Survey Icon
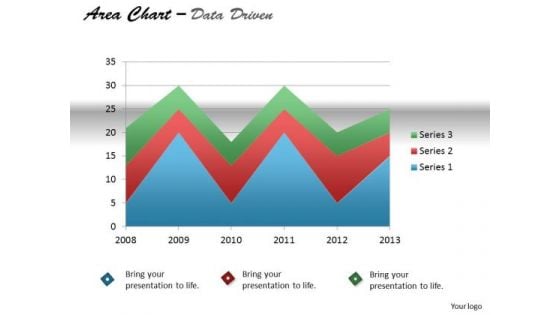
Quantitative Data Analysis Driven Display Series With Area Chart PowerPoint Slides Templates
Our quantitative data analysis driven display series with area chart powerpoint slides Templates Enjoy Drama. They Provide Entertaining Backdrops.
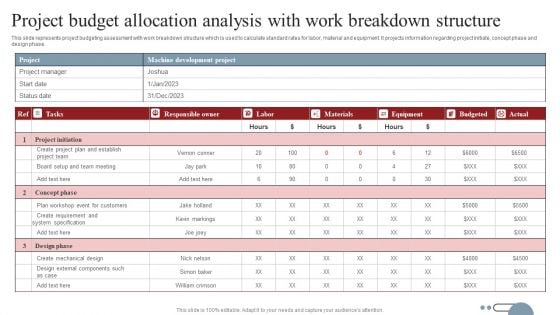
Project Budget Allocation Analysis With Work Breakdown Structure Inspiration PDF
This slide represents project budgeting assessment with work breakdown structure which is used to calculate standard rates for labor, material and equipment. It projects information regarding project initiate, concept phase and design phase. Showcasing this set of slides titled Project Budget Allocation Analysis With Work Breakdown Structure Inspiration PDF. The topics addressed in these templates are Project Initiation, Concept Phase, Design Phase. All the content presented in this PPT design is completely editable. Download it and make adjustments in color, background, font etc. as per your unique business setting.
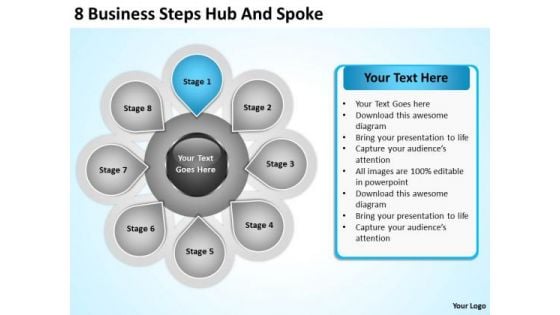
Business Model Diagram Examples PowerPoint Templates Steps Hub And Spoke
We present our business model diagram examples powerpoint templates steps hub and spoke.Download and present our Circle Charts PowerPoint Templates because You can Channelise the thoughts of your team with our PowerPoint Templates and Slides. Urge them to focus on the goals you have set. Use our Arrows PowerPoint Templates because Watching this your Audience will Grab their eyeballs, they wont even blink. Present our Business PowerPoint Templates because You can Double your output with our PowerPoint Templates and Slides. They make beating deadlines a piece of cake. Download our Flow Charts PowerPoint Templates because You can Zap them with our PowerPoint Templates and Slides. See them reel under the impact. Use our Ring Charts PowerPoint Templates because Your ideas provide food for thought. Our PowerPoint Templates and Slides will help you create a dish to tickle the most discerning palate.Use these PowerPoint slides for presentations relating to 3d, abstract, action, analysis, business, chart, competition, concept, connection, corporate, diagram, direction, employee, financial, future, graphic, idea, market, marketing, organization, process, strategy, success, target, timeline, training. The prominent colors used in the PowerPoint template are Blue, Gray, Black. Champion causes with our Business Model Diagram Examples PowerPoint Templates Steps Hub And Spoke. Download without worries with our money back guaranteee.
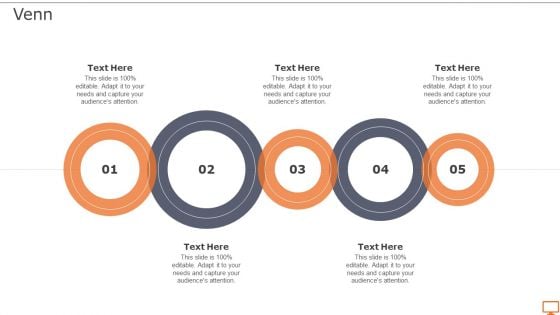
Venn Deploying XP Practices To Enhance Operational Efficiency Clipart PDF
If your project calls for a presentation, then Slidegeeks is your go-to partner because we have professionally designed, easy-to-edit templates that are perfect for any presentation. After downloading, you can easily edit Venn Deploying XP Practices To Enhance Operational Efficiency Clipart PDF and make the changes accordingly. You can rearrange slides or fill them with different images. Check out all the handy templates.
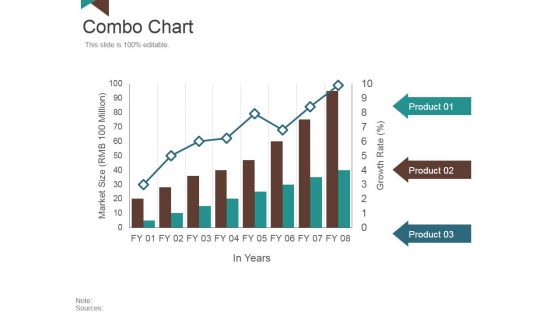
Combo Chart Ppt PowerPoint Presentation Inspiration Images
This is a combo chart ppt powerpoint presentation inspiration images. This is a three stage process. The stages in this process are market size, in years, growth rate, product.
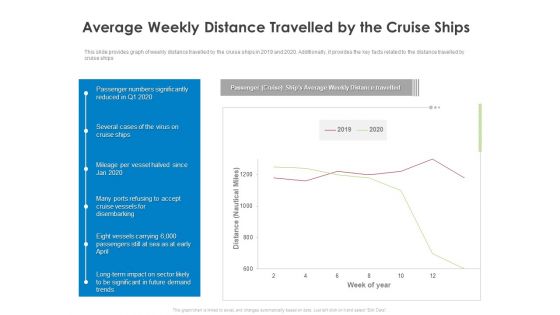
COVID 19 Risk Analysis Mitigation Policies Ocean Liner Sector Average Weekly Distance Travelled By The Cruise Ships Diagrams PDF
This slide provides graph of weekly distance travelled by the cruise ships in 2019 and 2020. Additionally, it provides the key facts related to the distance travelled by cruise ships. Deliver an awe inspiring pitch with this creative covid 19 risk analysis mitigation policies ocean liner sector average weekly distance travelled by the cruise ships diagrams pdf bundle. Topics like average weekly distance travelled by the cruise ships can be discussed with this completely editable template. It is available for immediate download depending on the needs and requirements of the user.
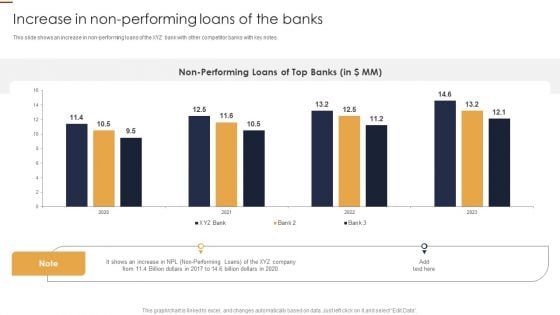
Increase In Non Performing Loans Of The Banks Credit Risk Analysis Model For Banking Institutions Diagrams PDF
This slide shows an increase in non-performing loans of the XYZ bank with other competitor banks with key notes.Want to ace your presentation in front of a live audience Our Increase In Non Performing Loans Of The Banks Credit Risk Analysis Model For Banking Institutions Diagrams PDF can help you do that by engaging all the users towards you.. Slidegeeks experts have put their efforts and expertise into creating these impeccable powerpoint presentations so that you can communicate your ideas clearly. Moreover, all the templates are customizable, and easy-to-edit and downloadable. Use these for both personal and commercial use.
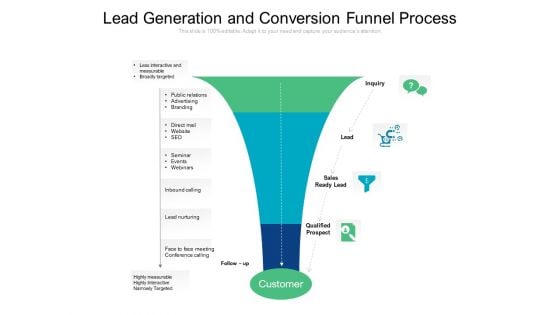
Lead Generation And Conversion Funnel Process Ppt PowerPoint Presentation File Background PDF
Presenting lead generation and conversion funnel process ppt powerpoint presentation file background pdf to dispense important information. This template comprises four stages. It also presents valuable insights into the topics including inquiry, lead, sales. This is a completely customizable PowerPoint theme that can be put to use immediately. So, download it and address the topic impactfully.
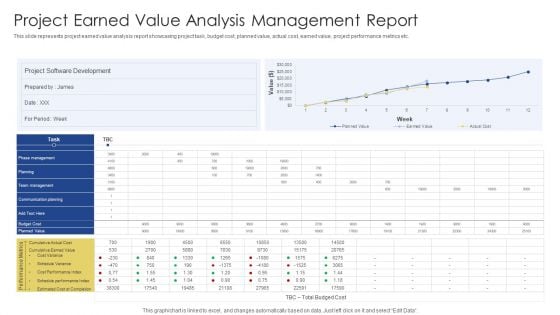
Project Earned Value Analysis Management Report Ppt PowerPoint Presentation Gallery Outline PDF
This slide represents project earned value analysis report showcasing project task, budget cost, planned value, actual cost, earned value, project performance metrics etc. Pitch your topic with ease and precision using this Project Earned Value Analysis Management Report Ppt PowerPoint Presentation Gallery Outline PDF. This layout presents information on Project Software Development, Phase Management, Communication Planning. It is also available for immediate download and adjustment. So, changes can be made in the color, design, graphics or any other component to create a unique layout.
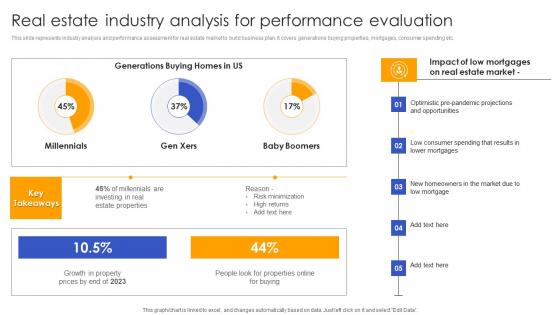
Real Estate Industry Analysis For Performance Effective Real Estate Flipping Approaches Sample Pdf
This slide represents industry analysis and performance assessment for real estate market to build business plan. It covers generations buying properties, mortgages, consumer spending etc. Slidegeeks is here to make your presentations a breeze with Real Estate Industry Analysis For Performance Effective Real Estate Flipping Approaches Sample Pdf With our easy to use and customizable templates, you can focus on delivering your ideas rather than worrying about formatting. With a variety of designs to choose from, you are sure to find one that suits your needs. And with animations and unique photos, illustrations, and fonts, you can make your presentation pop. So whether you are giving a sales pitch or presenting to the board, make sure to check out Slidegeeks first This slide represents industry analysis and performance assessment for real estate market to build business plan. It covers generations buying properties, mortgages, consumer spending etc.
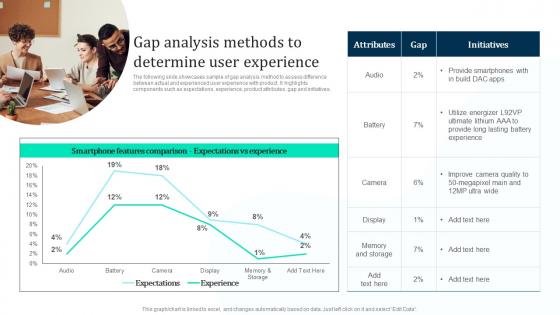
Gap Analysis Methods To Determine Marketing Intelligence Guide Data Gathering Download Pdf
The following slide showcases sample of gap analysis method to assess difference between actual and experienced user experience with product. It highlights components such as expectations, experience, product attributes, gap and initiatives. If your project calls for a presentation, then Slidegeeks is your go to partner because we have professionally designed, easy to edit templates that are perfect for any presentation. After downloading, you can easily edit Gap Analysis Methods To Determine Marketing Intelligence Guide Data Gathering Download Pdf and make the changes accordingly. You can rearrange slides or fill them with different images. Check out all the handy templates The following slide showcases sample of gap analysis method to assess difference between actual and experienced user experience with product. It highlights components such as expectations, experience, product attributes, gap and initiatives.
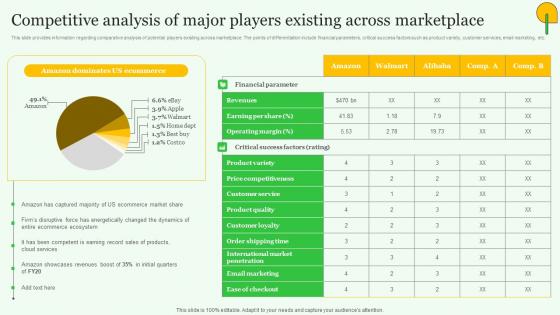
Competitive Analysis Major Players Exploring Amazons Global Business Model Growth Graphics Pdf
This slide provides information regarding comparative analysis of potential players existing across marketplace. The points of differentiation include financial parameters, critical success factors such as product variety, customer services, email marketing, etc. Slidegeeks is here to make your presentations a breeze with Competitive Analysis Major Players Exploring Amazons Global Business Model Growth Graphics Pdf With our easy to use and customizable templates, you can focus on delivering your ideas rather than worrying about formatting. With a variety of designs to choose from, you are sure to find one that suits your needs. And with animations and unique photos, illustrations, and fonts, you can make your presentation pop. So whether you are giving a sales pitch or presenting to the board, make sure to check out Slidegeeks first This slide provides information regarding comparative analysis of potential players existing across marketplace. The points of differentiation include financial parameters, critical success factors such as product variety, customer services, email marketing, etc.
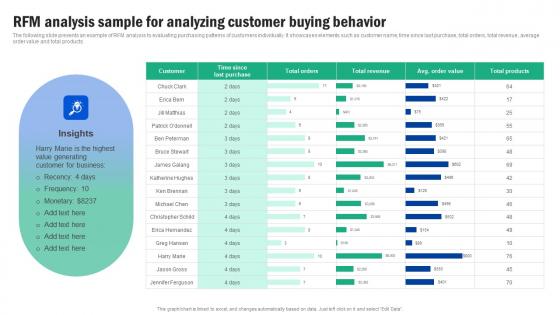
RFM Analysis Sample For Analyzing Customer Buying Guide For Segmenting And Formulating Portrait Pdf
The following slide presents an example of RFM analysis to evaluating purchasing patterns of customers individually. It showcases elements such as customer name, time since last purchase, total orders, total revenue, average order value and total products. If your project calls for a presentation, then Slidegeeks is your go to partner because we have professionally designed, easy to edit templates that are perfect for any presentation. After downloading, you can easily edit RFM Analysis Sample For Analyzing Customer Buying Guide For Segmenting And Formulating Portrait Pdf and make the changes accordingly. You can rearrange slides or fill them with different images. Check out all the handy templates The following slide presents an example of RFM analysis to evaluating purchasing patterns of customers individually. It showcases elements such as customer name, time since last purchase, total orders, total revenue, average order value and total products.
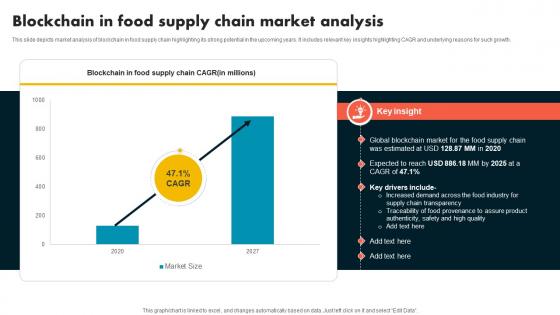
Blockchain In Food Supply Chain Market Analysis Supply Chain Evolution Harnessing The Power BCT SS V
This slide depicts market analysis of blockchain in food supply chain highlighting its strong potential in the upcoming years. It includes relevant key insights highlighting CAGR and underlying reasons for such growth.If your project calls for a presentation, then Slidegeeks is your go-to partner because we have professionally designed, easy-to-edit templates that are perfect for any presentation. After downloading, you can easily edit Blockchain In Food Supply Chain Market Analysis Supply Chain Evolution Harnessing The Power BCT SS V and make the changes accordingly. You can rearrange slides or fill them with different images. Check out all the handy templates This slide depicts market analysis of blockchain in food supply chain highlighting its strong potential in the upcoming years. It includes relevant key insights highlighting CAGR and underlying reasons for such growth.

Projected Expenditure Analysis For AI In Education Educational Transformation Through AI SS V
This slide showcases top grossing facts of AI in education by expenditure analysis, helping tech practitioners refer practical data and make decisions accordingly. This furthermore helps them tweak or make changes in their institutes. Slidegeeks is here to make your presentations a breeze with Projected Expenditure Analysis For AI In Education Educational Transformation Through AI SS V With our easy-to-use and customizable templates, you can focus on delivering your ideas rather than worrying about formatting. With a variety of designs to choose from, you are sure to find one that suits your needs. And with animations and unique photos, illustrations, and fonts, you can make your presentation pop. So whether you are giving a sales pitch or presenting to the board, make sure to check out Slidegeeks first This slide showcases top grossing facts of AI in education by expenditure analysis, helping tech practitioners refer practical data and make decisions accordingly. This furthermore helps them tweak or make changes in their institutes.
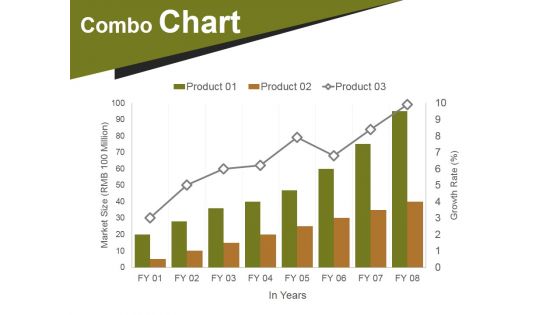
Combo Chart Ppt PowerPoint Presentation Portfolio Infographics
This is a combo chart ppt powerpoint presentation portfolio infographics. This is a eight stage process. The stages in this process are market size, growth, years, finance, business.
Best Credit Card Deals Shopping Festival PowerPoint Templates Ppt Backgrounds For Slides 1112
We present our Best Credit Card Deals Shopping Festival PowerPoint Templates PPT Backgrounds For Slides 1112.Use our Sales PowerPoint Templates because different people with differing ideas and priorities perform together to score. Present our Festival PowerPoint Templates because you can Churn the wheels of the brains of your colleagues. Use our Holidays PowerPoint Templates because You have some unique ones up your sleeve. Expose the special features of these hotspots to the world around you. Download and present our Shapes PowerPoint Templates because displaying your ideas and highlighting your ability will accelerate the growth of your company and yours. Use our Boxes PowerPoint Templates because by using this slide you can Heighten the anticipation of your audience listing .Use these PowerPoint slides for presentations relating to Credit card shopping, sales, festival, holidays, shapes, boxes. The prominent colors used in the PowerPoint template are Green, Pink, Yellow. People tell us our Best Credit Card Deals Shopping Festival PowerPoint Templates PPT Backgrounds For Slides 1112 will impress their bosses and teams. Presenters tell us our sales PowerPoint templates and PPT Slides are Exuberant. PowerPoint presentation experts tell us our Best Credit Card Deals Shopping Festival PowerPoint Templates PPT Backgrounds For Slides 1112 are Bold. Customers tell us our shapes PowerPoint templates and PPT Slides are Fashionable. Customers tell us our Best Credit Card Deals Shopping Festival PowerPoint Templates PPT Backgrounds For Slides 1112 are topically designed to provide an attractive backdrop to any subject. Customers tell us our shopping PowerPoint templates and PPT Slides are Handsome. Add some chutzpah with our Best Credit Card Deals Shopping Festival PowerPoint Templates Ppt Backgrounds For Slides 1112. They define your elegance and style.
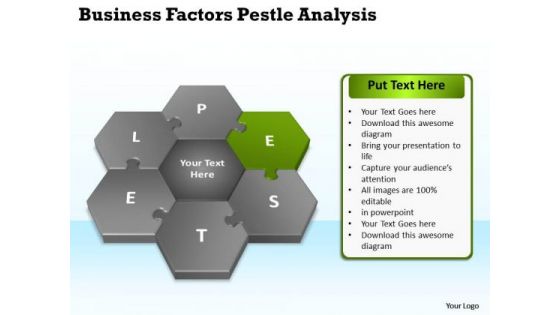
Business Diagram Examples Analysis Model PowerPoint Templates Backgrounds For Slides
We present our business diagram examples analysis model PowerPoint templates backgrounds for slides.Present our Advertising PowerPoint Templates because it Shines the light on your thoughts and motivates your team to improve the quality of celebration for all around you. Present our Business PowerPoint Templates because our bewitching PowerPoint Templates and Slides will delight your audience with the magic of your words. Use our Marketing PowerPoint Templates because networking is an imperative in todays world. You need to access the views of others. Similarly you need to give access to them of your abilities. Download and present our Finance PowerPoint Templates because you envisage some areas of difficulty in the near future. The overall financial situation could be a source of worry. Present our Shapes PowerPoint Templates because this diagram helps to reaffirm to your team your faith in maintaining the highest ethical standards.Use these PowerPoint slides for presentations relating to Analysis, Analyze, Business, Chalk, Chalkboard, Chart, Component, Concept, Diagram, Direction, Economic, Education, Environmental, Factors, Framework, Graph, Graphics, Illustration, Law, Leadership, Management, Market, Research, Model, Operations, Political, Position, Research, Scanning. The prominent colors used in the PowerPoint template are Green, Gray, Black. PowerPoint presentation experts tell us our business diagram examples analysis model PowerPoint templates backgrounds for slides help you meet deadlines which are an element of today's workplace. Just browse and pick the slides that appeal to your intuitive senses. Professionals tell us our Business PowerPoint templates and PPT Slides are Chic. People tell us our business diagram examples analysis model PowerPoint templates backgrounds for slides are Whimsical. We assure you our Component PowerPoint templates and PPT Slides are Spiffy. PowerPoint presentation experts tell us our business diagram examples analysis model PowerPoint templates backgrounds for slides are Elegant. Professionals tell us our Diagram PowerPoint templates and PPT Slides provide great value for your money. Be assured of finding the best projection to highlight your words. Bake the cake with our Business Diagram Examples Analysis Model PowerPoint Templates Backgrounds For Slides. Give them all a big slab of it.
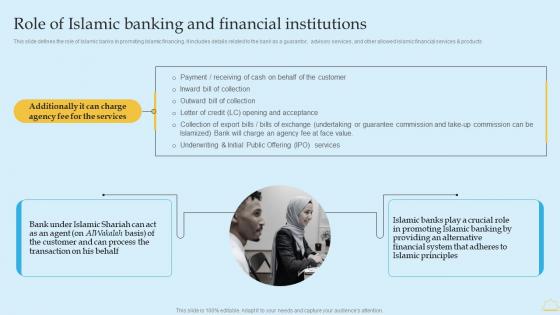
In Depth Analysis Of Islamic Banking Role Of Islamic Banking And Financial Institutions Themes PDF
This slide defines the role of Islamic banks in promoting Islamic financing. It includes details related to the bank as a guarantor, advisory services, and other allowed Islamic financial services and products. If you are looking for a format to display your unique thoughts, then the professionally designed In Depth Analysis Of Islamic Banking Role Of Islamic Banking And Financial Institutions Themes PDF is the one for you. You can use it as a Google Slides template or a PowerPoint template. Incorporate impressive visuals, symbols, images, and other charts. Modify or reorganize the text boxes as you desire. Experiment with shade schemes and font pairings. Alter, share or cooperate with other people on your work. Download In Depth Analysis Of Islamic Banking Role Of Islamic Banking And Financial Institutions Themes PDF and find out how to give a successful presentation. Present a perfect display to your team and make your presentation unforgettable. This slide defines the role of Islamic banks in promoting Islamic financing. It includes details related to the bank as a guarantor, advisory services, and other allowed Islamic financial services and products.
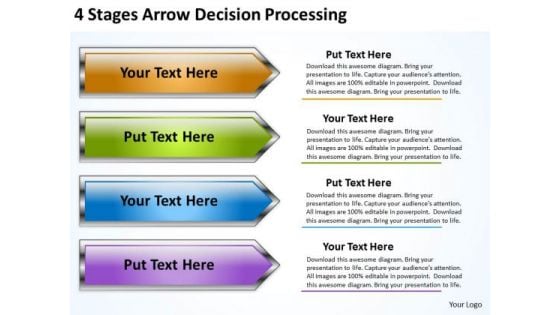
Arrow In PowerPoint 4 Stages Decision Processing Slides
We present our arrow in powerpoint 4 stages decision processing Slides.Download and present our Business PowerPoint Templates because It can be used to Set your controls for the heart of the sun. Our PowerPoint Templates and Slides will be the propellant to get you there. Present our Marketing PowerPoint Templates because Our PowerPoint Templates and Slides will provide you a launch platform. Give a lift off to your ideas and send them into orbit. Use our Shapes PowerPoint Templates because Our PowerPoint Templates and Slides are conceived by a dedicated team. Use them and give form to your wondrous ideas. Download and present our Arrows PowerPoint Templates because It can be used to Set your controls for the heart of the sun. Our PowerPoint Templates and Slides will be the propellant to get you there. Use our Process and Flows PowerPoint Templates because You are an avid believer in ethical practices. Highlight the benefits that accrue with our PowerPoint Templates and Slides.Use these PowerPoint slides for presentations relating to Arrow, Banner, Bar, Collection, Completion, Concept, Confirmation, Design, Flow, Graph, Graphic, Illustration, Indication, Information, Instruction, Interface, Internet, Layout, Measurement, Modern, Number, Order, Phase, Pointer, Process, Progress, Reflection, Scale, Shape, Stage, Status, Step, Template, Two, Vector, Web, Web Design, Web Design Elements, Websites, Work Flow. The prominent colors used in the PowerPoint template are Yellow, Blue, Green. Customers tell us our arrow in powerpoint 4 stages decision processing Slides are visually appealing. We assure you our Confirmation PowerPoint templates and PPT Slides will get their audience's attention. Use our arrow in powerpoint 4 stages decision processing Slides will make the presenter successul in his career/life. You can be sure our Bar PowerPoint templates and PPT Slides will make you look like a winner. PowerPoint presentation experts tell us our arrow in powerpoint 4 stages decision processing Slides are aesthetically designed to attract attention. We guarantee that they will grab all the eyeballs you need. The feedback we get is that our Completion PowerPoint templates and PPT Slides will help them to explain complicated concepts. Curb assumptions with our Arrow In PowerPoint 4 Stages Decision Processing Slides. Face up to them with the facts.
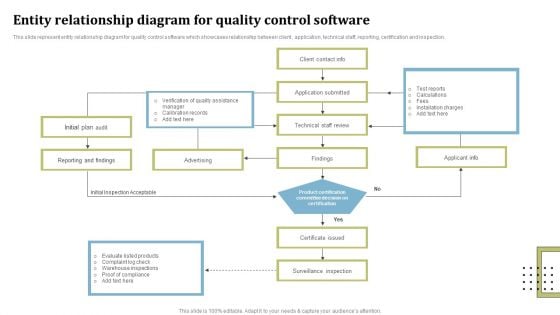
Entity Relationship Diagram For Quality Control Software Ppt Pictures Smartart PDF
This slide represent entity relationship diagram for quality control software which showcases relationship between client , application, technical staff, reporting, certification and inspection. Persuade your audience using this Entity Relationship Diagram For Quality Control Software Ppt Pictures Smartart PDF. This PPT design covers one stages, thus making it a great tool to use. It also caters to a variety of topics including Advertising Findings, Applicant Info, Initial Plan Audit, Reporting And Findings. Download this PPT design now to present a convincing pitch that not only emphasizes the topic but also showcases your presentation skills.
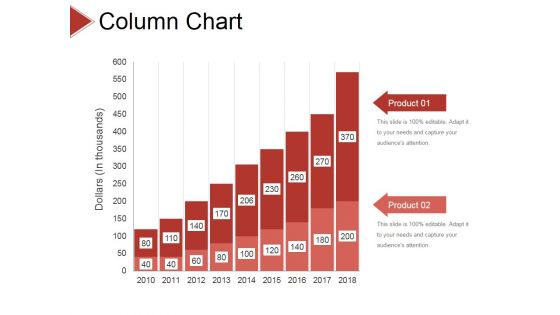
Column Chart Ppt PowerPoint Presentation Gallery Layouts
This is a column chart ppt powerpoint presentation gallery layouts. This is a two stage process. The stages in this process are business, strategy, analysis, pretention, chart and graph, growth.
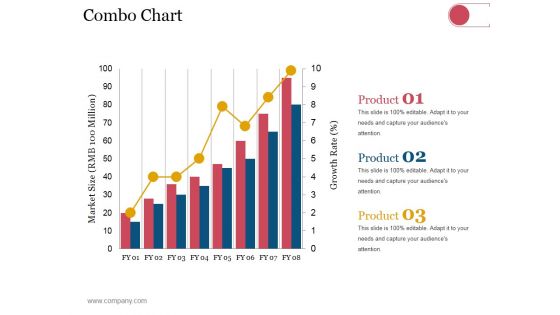
Combo Chart Ppt PowerPoint Presentation Inspiration Information
This is a combo chart ppt powerpoint presentation inspiration information. This is a eight stage process. The stages in this process are business, strategy, analysis, planning, combo chart, market size, growth rate.
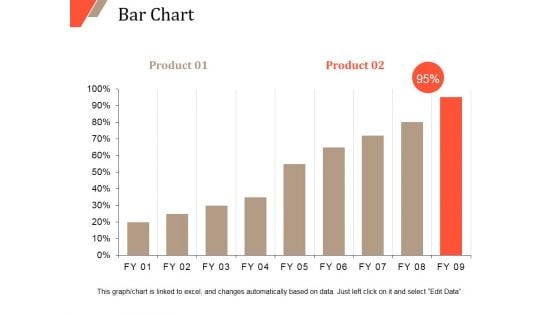
Bar Chart Ppt PowerPoint Presentation Outline Infographics
This is a bar chart ppt powerpoint presentation outline infographics. This is a two stage process. The stages in this process are bar chart, finance, marketing, strategy, analysis, business.
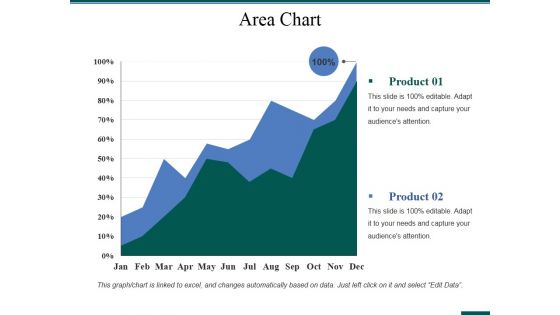
Area Chart Ppt PowerPoint Presentation Pictures Slideshow
This is a area chart ppt powerpoint presentation pictures slideshow. This is a two stage process. The stages in this process are area chart, finance, analysis, marketing, strategy, business.
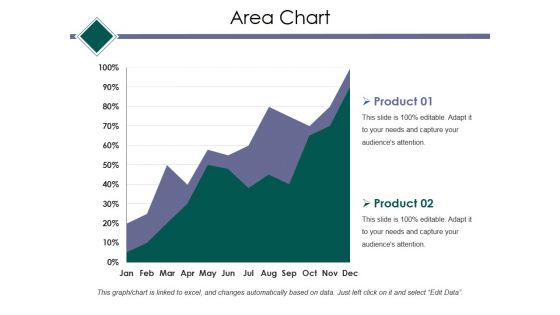
Area Chart Ppt PowerPoint Presentation Model Layout
This is a area chart ppt powerpoint presentation model layout. This is a two stage process. The stages in this process are area chart, finance, marketing, strategy, analysis, business.
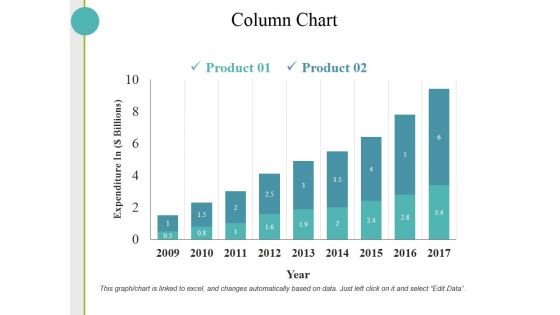
Column Chart Ppt PowerPoint Presentation Pictures Outfit
This is a column chart ppt powerpoint presentation pictures outfit. This is a two stage process. The stages in this process are column chart, finance, marketing, strategy, analysis, business.
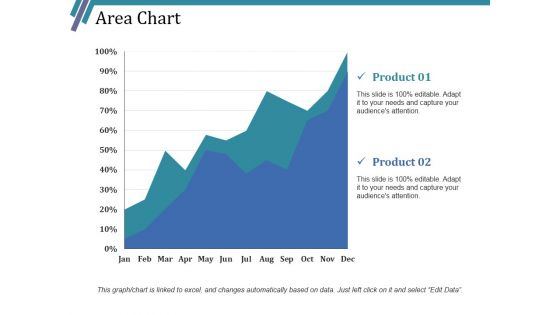
Area Chart Ppt PowerPoint Presentation Styles Templates
This is a area chart ppt powerpoint presentation styles templates. This is a two stage process. The stages in this process are area chart, growth, finance, marketing, strategy, analysis.
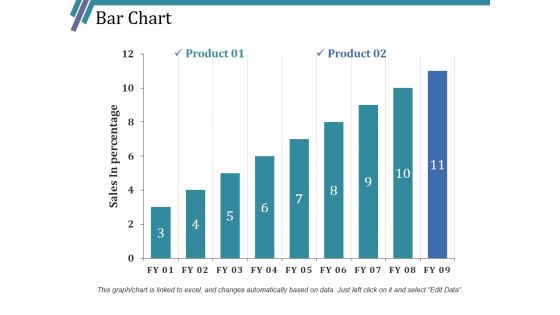
Bar Chart Ppt PowerPoint Presentation Styles Smartart
This is a bar chart ppt powerpoint presentation styles smartart. This is a two stage process. The stages in this process are bar chart, growth, finance, marketing, strategy, analysis.
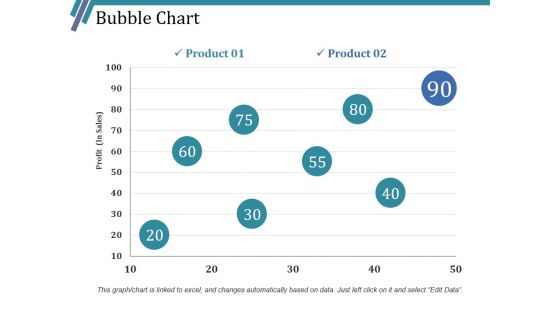
Bubble Chart Ppt PowerPoint Presentation Inspiration Picture
This is a bubble chart ppt powerpoint presentation inspiration picture. This is a two stage process. The stages in this process are bubble chart, growth, finance, marketing, strategy, analysis.
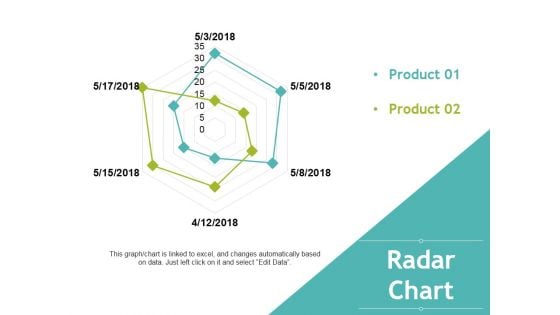
Radar Chart Ppt PowerPoint Presentation Professional Brochure
This is a radar chart ppt powerpoint presentation professional brochure. This is a two stage process. The stages in this process are radar chart, finance, marketing, strategy, analysis, business.
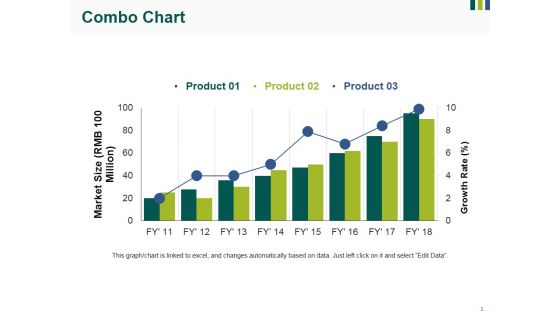
Combo Chart Ppt PowerPoint Presentation Inspiration Vector
This is a combo chart ppt powerpoint presentation inspiration vector. This is a three stage process. The stages in this process are combo chart, finance, marketing, strategy, analysis, business.
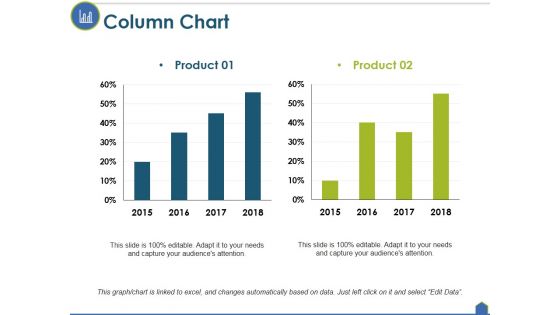
Column Chart Ppt PowerPoint Presentation Inspiration Good
This is a column chart ppt powerpoint presentation inspiration good. This is a two stage process. The stages in this process are column chart, finance, marketing, strategy, analysis, business.
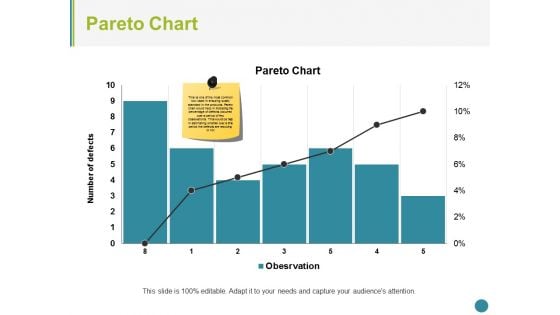
Pareto Chart Ppt PowerPoint Presentation Summary Structure
This is a pareto chart ppt powerpoint presentation summary structure. This is a seven stage process. The stages in this process are pareto chart, finance, marketing, strategy, analysis, business.
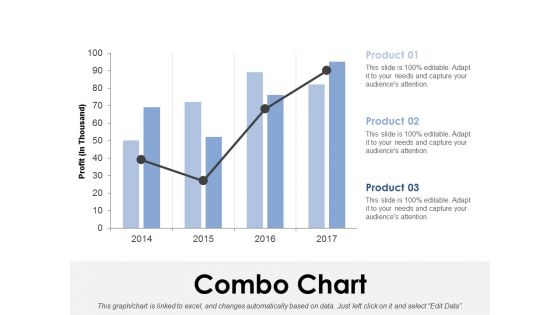
Combo Chart Ppt PowerPoint Presentation Infographics Sample
This is a combo chart ppt powerpoint presentation infographics sample. This is a three stage process. The stages in this process are combo chart, finance, analysis, marketing, strategy, business.
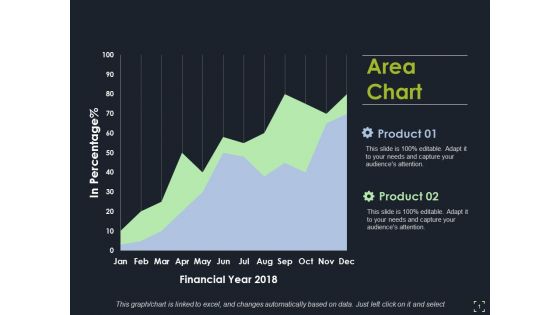
Area Chart Ppt PowerPoint Presentation Infographics Images
This is a area chart ppt powerpoint presentation infographics images. This is a two stage process. The stages in this process are area chart, finance, marketing, analysis, strategy, business.
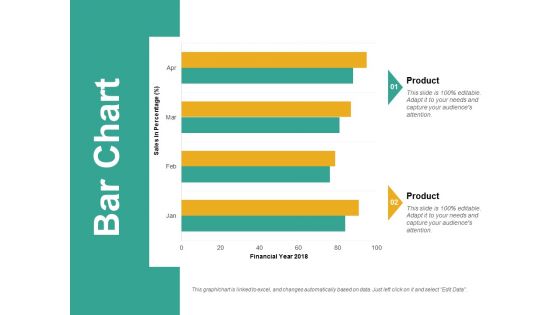
Bar Chart Ppt PowerPoint Presentation Slides Model
This is a bar chart ppt powerpoint presentation slides model. This is a two stage process. The stages in this process are bar chart, analysis, business, marketing, strategy, finance.
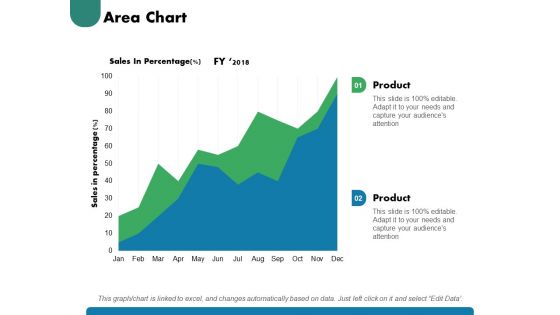
Area Chart Ppt PowerPoint Presentation Pictures Show
This is a area chart ppt powerpoint presentation pictures show. This is a two stage process. The stages in this process are area chart, finance, marketing, management, investment, analysis.
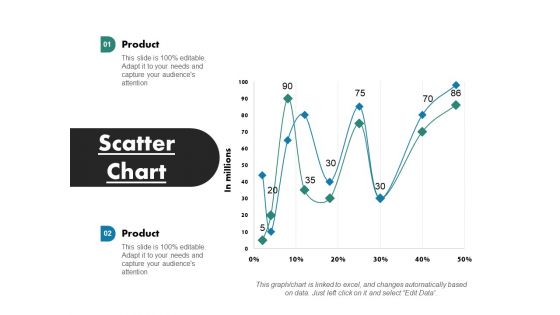
Scatter Chart Ppt PowerPoint Presentation Infographics Designs
This is a scatter chart ppt powerpoint presentation infographics designs. This is a two stage process. The stages in this process are scatter chart, finance, marketing, management, investment, analysis.
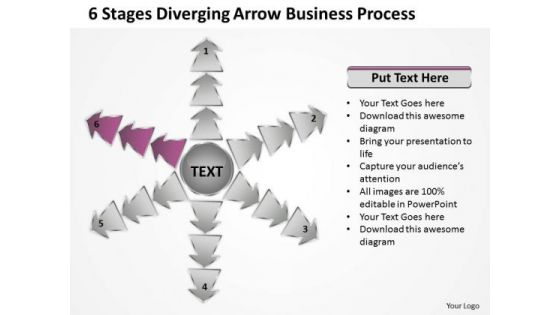
6 Stages Diverging Arrow Business Process Circular Spoke Network PowerPoint Template
We present our 6 stages diverging arrow business process Circular Spoke Network PowerPoint template.Download our Marketing PowerPoint Templates because Our PowerPoint Templates and Slides will let you Leave a lasting impression to your audiences. They possess an inherent longstanding recall factor. Download our Shapes PowerPoint Templates because you can Adorn them with your ideas and thoughts. Present our Arrows PowerPoint Templates because this slide brings grey areas to the table and explain in detail you assessment of the need for care to ensure continued smooth progress. Present our Business PowerPoint Templates because the fruits of your labour are beginning to show.Enlighten them on the great plans you have for their enjoyment. Use our Process and Flows PowerPoint Templates because you can Adorn them with your ideas and thoughts.Use these PowerPoint slides for presentations relating to Arrows, Business, Chart, Cyclic, Data, Diagram, Financial, Goal, Graph, Illustration, Info, Information, Marketing, Model, Option, Part, Pie, Presentation, Process, Result, Sphere, Statistics. The prominent colors used in the PowerPoint template are Purple, Gray, Black. The feedback we get is that our 6 stages diverging arrow business process Circular Spoke Network PowerPoint template will make the presenter successul in his career/life. People tell us our Data PowerPoint templates and PPT Slides are Endearing. Presenters tell us our 6 stages diverging arrow business process Circular Spoke Network PowerPoint template are Spiffy. Use our Cyclic PowerPoint templates and PPT Slides are Appealing. Use our 6 stages diverging arrow business process Circular Spoke Network PowerPoint template are Fancy. Use our Financial PowerPoint templates and PPT Slides are Appealing. Regain control with our 6 Stages Diverging Arrow Business Process Circular Spoke Network PowerPoint Template. Download without worries with our money back guaranteee.

Three Ways Action To Achieve Goal Circular Flow Network PowerPoint Templates
We present our three ways action to achieve goal Circular Flow Network PowerPoint templates.Download and present our Marketing PowerPoint Templates because profit is fairly earned in what you believe. Present our Business PowerPoint Templates because you too have got the framework of your companys growth in place. Present our Shapes PowerPoint Templates because you will be able to Highlight these individual targets and the paths to their achievement. Use our Finance PowerPoint Templates because by using this slide you can Heighten the anticipation of your audience listing . Use our Symbol PowerPoint Templates because you know what it takes to keep it fit and healthy.Use these PowerPoint slides for presentations relating to Arrows, Business, Chart, Cyclic, Data, Diagram, Financial, Goal, Graph, Illustration, Info, Information, Marketing, Model, Option, Part, Pie, Presentation, Process, Result, Sphere, Statistics. The prominent colors used in the PowerPoint template are Red, Blue, White. We assure you our three ways action to achieve goal Circular Flow Network PowerPoint templates are Graceful. Customers tell us our Goal PowerPoint templates and PPT Slides are designed by professionals The feedback we get is that our three ways action to achieve goal Circular Flow Network PowerPoint templates are effectively colour coded to prioritise your plans They automatically highlight the sequence of events you desire. We assure you our Data PowerPoint templates and PPT Slides are Wonderful. People tell us our three ways action to achieve goal Circular Flow Network PowerPoint templates will help you be quick off the draw. Just enter your specific text and see your points hit home. We assure you our Data PowerPoint templates and PPT Slides are Exuberant. Greet your conference with our Three Ways Action To Achieve Goal Circular Flow Network PowerPoint Templates. Try us out and see what a difference our templates make.
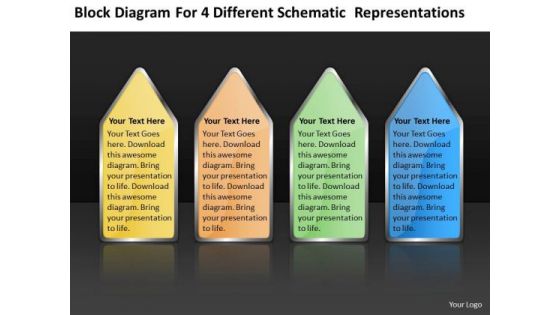
4 Different Schematic Representations Create Business Plan Template PowerPoint Templates
We present our 4 different schematic representations create business plan template PowerPoint templates.Use our Arrows PowerPoint Templates because It will get your audience in sync. Use our Signs PowerPoint Templates because Our PowerPoint Templates and Slides come in all colours, shades and hues. They help highlight every nuance of your views. Download and present our Shapes PowerPoint Templates because You can Score a slam dunk with our PowerPoint Templates and Slides. Watch your audience hang onto your every word. Download our Metaphors-Visual Concepts PowerPoint Templates because Our PowerPoint Templates and Slides are Clear and concise. Use them and dispel any doubts your team may have. Download and present our Business PowerPoint Templates because You can Raise a toast with our PowerPoint Templates and Slides. Spread good cheer amongst your audience.Use these PowerPoint slides for presentations relating to abstract, arrow, banner, bar, brochure, business, chart, collaboration, combined, communication, conjugate, constrain, cooperation, data, diagram, different, direction, efficiency, five, flow, flowchart, illustration, individual, information, input, joined, junction, marketing, mixed, output, plan, pointing, presentation, schematic, statistics, strategy, streamline, structure, teamwork, template, unite. The prominent colors used in the PowerPoint template are Blue, Green, Orange. We assure you our 4 different schematic representations create business plan template PowerPoint templates are incredible easy to use. People tell us our brochure PowerPoint templates and PPT Slides are incredible easy to use. Customers tell us our 4 different schematic representations create business plan template PowerPoint templates are effectively colour coded to prioritise your plans They automatically highlight the sequence of events you desire. Presenters tell us our brochure PowerPoint templates and PPT Slides will help them to explain complicated concepts. People tell us our 4 different schematic representations create business plan template PowerPoint templates are readymade to fit into any presentation structure. We assure you our business PowerPoint templates and PPT Slides effectively help you save your valuable time. Define growth with our 4 Different Schematic Representations Create Business Plan Template PowerPoint Templates. Download without worries with our money back guaranteee.
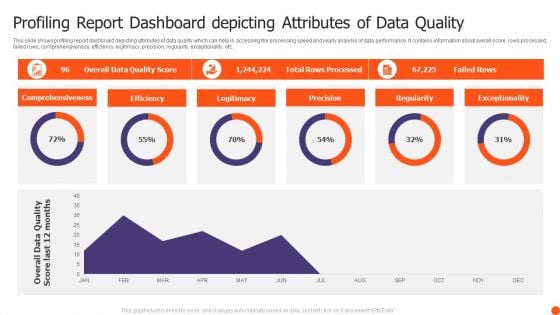
Profiling Report Dashboard Depicting Attributes Of Data Quality Themes PDF
This slide shows profiling report dashboard depicting attributes of data quality which can help in accessing the processing speed and yearly analysis of data performance. It contains information about overall score, rows processed, failed rows, comprehensiveness, efficiency, legitimacy, precision, regularity, exceptionality, etc. Pitch your topic with ease and precision using this Profiling Report Dashboard Depicting Attributes Of Data Quality Themes PDF. This layout presents information on Comprehensiveness, Efficiency, Legitimacy, Precision. It is also available for immediate download and adjustment. So, changes can be made in the color, design, graphics or any other component to create a unique layout.
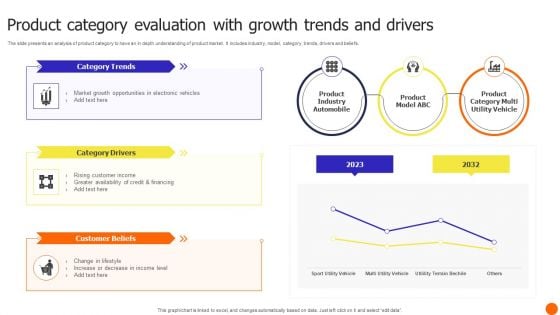
Product Category Evaluation With Growth Trends And Drivers Themes PDF
The slide presents an analysis of product category to have an in depth understanding of product market. It includes industry, model, category, trends, drivers and beliefs. Pitch your topic with ease and precision using this Product Category Evaluation With Growth Trends And Drivers Themes PDF. This layout presents information on Product Industry Automobile, Customer Beliefs, Category Drivers. It is also available for immediate download and adjustment. So, changes can be made in the color, design, graphics or any other component to create a unique layout.
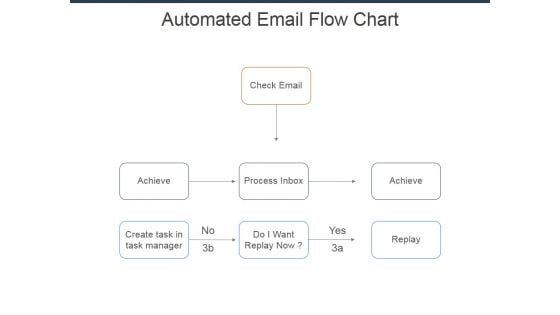
Automated Email Flow Chart Ppt Powerpoint Presentation Infographics Show
This is a automated email flow chart ppt powerpoint presentation infographics show. This is a three stage process. The stages in this process are check email, achieve, process inbox, do i want replay now, create task in task manager.
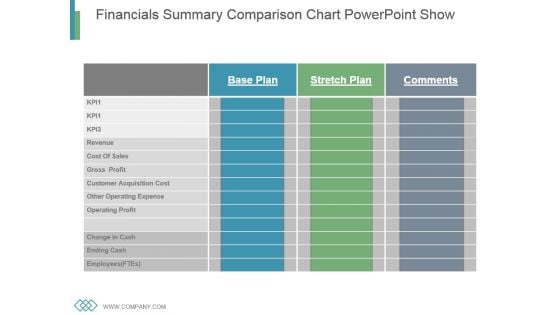
Financials Summary Comparison Chart Powerpoint Show
This is a financials summary comparison chart powerpoint show. This is a three stage process. The stages in this process are revenue, cost of sales, gross profit, customer acquisition cost, other operating cost expense, operating profit, change in cash, ending cash, employees.

Job Task Analysis Powerpoint Presentation Examples
This is a job task analysis powerpoint presentation examples. This is a three stage process. The stages in this time process are job task analysis, skill gaps, e learning conversion.
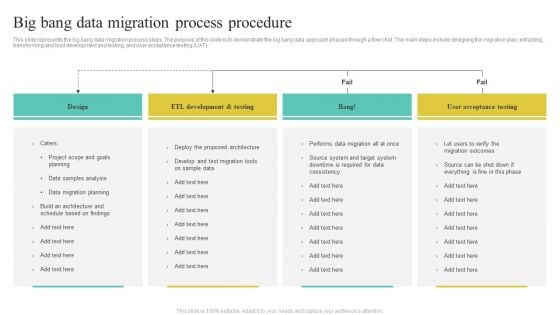
Big Bang Data Migration Process Procedure Diagrams PDF
This slide represents the big bang data migration process steps. The purpose of this slide is to demonstrate the big bang data approach phases through a flow chat. The main steps include designing the migration plan, extracting, transforming and load development and testing, and user acceptance testing UAT.
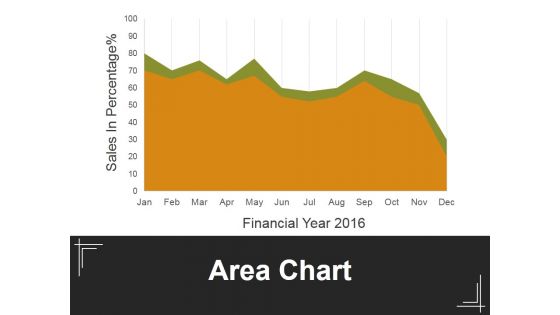
Area Chart Ppt PowerPoint Presentation Slides Deck
This is a area chart ppt powerpoint presentation slides deck. This is a two stage process. The stages in this process are financial, sales in percentage, business, marketing, management.
Data Structure IT Data Structure Performance Tracking Dashboard Diagrams PDF
Slidegeeks is here to make your presentations a breeze with Data Structure IT Data Structure Performance Tracking Dashboard Diagrams PDF With our easy-to-use and customizable templates, you can focus on delivering your ideas rather than worrying about formatting. With a variety of designs to choose from, youre sure to find one that suits your needs. And with animations and unique photos, illustrations, and fonts, you can make your presentation pop. So whether youre giving a sales pitch or presenting to the board, make sure to check out Slidegeeks first.
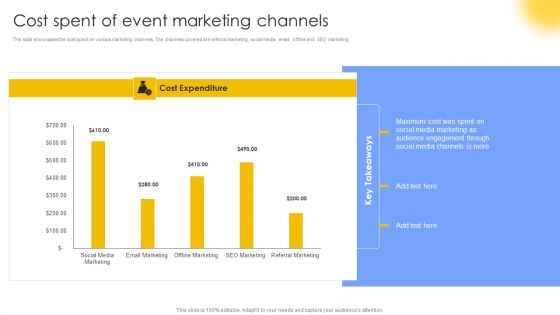
Cost Spent Of Event Marketing Channels Diagrams PDF
This slide showcases the cost spent on various marketing channels. The channels covered are referral marketing, social media, email, offline and SEO marketing. If your project calls for a presentation, then Slidegeeks is your go-to partner because we have professionally designed, easy-to-edit templates that are perfect for any presentation. After downloading, you can easily edit Cost Spent Of Event Marketing Channels Diagrams PDF and make the changes accordingly. You can rearrange slides or fill them with different images. Check out all the handy templates
Strategies Employing PPC Advertising To Generate High Quality Leads Venn Diagram Graphics PDF
Find highly impressive Strategies Employing PPC Advertising To Generate High Quality Leads Venn Diagram Graphics PDF on Slidegeeks to deliver a meaningful presentation. You can save an ample amount of time using these presentation templates. No need to worry to prepare everything from scratch because Slidegeeks experts have already done a huge research and work for you. You need to download Strategies Employing PPC Advertising To Generate High Quality Leads Venn Diagram Graphics PDF for your upcoming presentation. All the presentation templates are 100 percent editable and you can change the color and personalize the content accordingly. Download now.
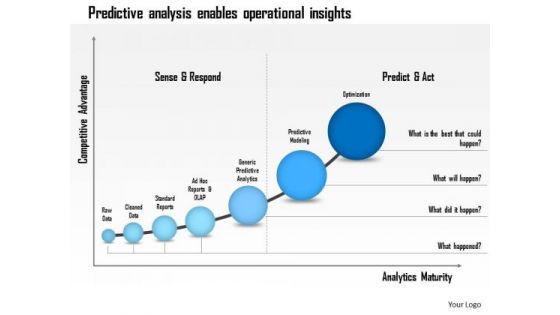
Business Framework Predictive Analysis Enables Operational Insights PowerPoint Presentation
This Power Point template diagram slide has been designed with graphic of growth arrows with text boxes. This text box arrow contains the concept of predictive analysis for operational insights. Use this PPT slide for business operation related presentations.
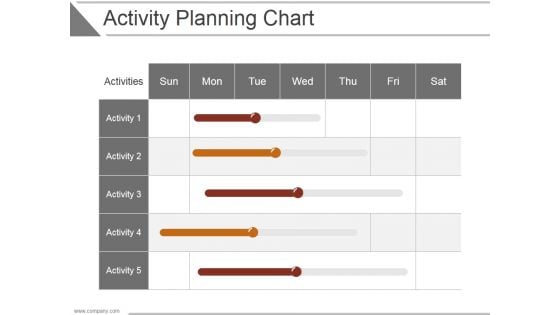
Activity Planning Chart Ppt PowerPoint Presentation Backgrounds
This is a activity planning chart ppt powerpoint presentation backgrounds. This is a five stage process. The stages in this process are business, strategy, analysis, marketing, chart and graph, compare.
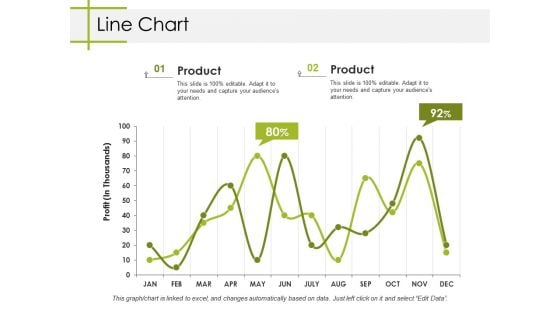
Line Chart Ppt PowerPoint Presentation Ideas Templates
This is a line chart ppt powerpoint presentation ideas templates. This is a two stage process. The stages in this process are line chart, growth, finance, marketing, analysis, business.
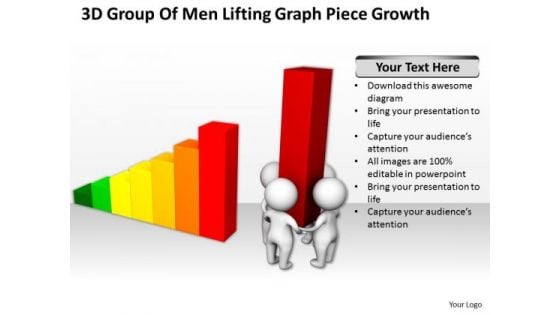
Business People Clipart 3d Group Of Men Lifting Graph Piece Growth PowerPoint Slides
We present our business people clipart 3d group of men lifting graph piece growth PowerPoint Slides.Download and present our Process and Flows PowerPoint Templates because You can Connect the dots. Fan expectations as the whole picture emerges. Use our Business PowerPoint Templates because you should Experience excellence with our PowerPoint Templates and Slides. They will take your breath away. Present our Marketing PowerPoint Templates because It can Leverage your style with our PowerPoint Templates and Slides. Charm your audience with your ability. Present our Shapes PowerPoint Templates because It will Strengthen your hand with your thoughts. They have all the aces you need to win the day. Use our Teamwork PowerPoint Templates because Your success is our commitment. Our PowerPoint Templates and Slides will ensure you reach your goal.Use these PowerPoint slides for presentations relating to 3d,achievement, altogether, bar, barchart, business, businessman,businesspeople, cartoon, character, chart, commerce, concept, economic,economy, finance, financial, goal, graph, growing, growth, guy, help, human,illustration, improvement, increase, investment, lifting, lost, male, manager,market, men, partnership, people, person, presentation, progress, raising, render,rising, statistic, strength, success, team, teamwork, work, worker. The prominent colors used in the PowerPoint template are Red, Yellow, Green. Continue on your path to success with our Business People Clipart 3d Group Of Men Lifting Graph Piece Growth PowerPoint Slides. You will come out on top.

Top Business People 3d Golden Men Handshake New PowerPoint Presentation Slides
We present our top business people 3d golden men handshake new powerpoint presentation Slides.Download our Arrows PowerPoint Templates because Our PowerPoint Templates and Slides will let you Leave a lasting impression to your audiences. They possess an inherent longstanding recall factor. Present our Business PowerPoint Templates because Our PowerPoint Templates and Slides are aesthetically designed to attract attention. We gaurantee that they will grab all the eyeballs you need. Download our Handshake PowerPoint Templates because You can Channelise the thoughts of your team with our PowerPoint Templates and Slides. Urge them to focus on the goals you have set. Use our Success PowerPoint Templates because Our PowerPoint Templates and Slides will generate and maintain the level of interest you desire. They will create the impression you want to imprint on your audience. Use our Future PowerPoint Templates because Our PowerPoint Templates and Slides are specially created by a professional team with vast experience. They diligently strive to come up with the right vehicle for your brilliant Ideas. Use these PowerPoint slides for presentations relating to 3d, arrows, below, briefcase, build, business, businessman, character,chart, concept, finance, financial, goal, graph, graphic, growing, growth, guy,handshake, illustration, leader, manager, men, partner, partnership,people, person, presentation, professional, profit, progress, red, rising, statistics,success, successful, symbol, tie, together. The prominent colors used in the PowerPoint template are Gray, Yellow, White. People often criticise without any cause. With our Top Business People 3d Golden Men Handshake New PowerPoint Presentation Slides you won't give a fig.
Top Business People 3d Man With Colorful Bar Graph PowerPoint Templates
We present our top business people 3d man with colorful bar graph PowerPoint templates.Download and present our Business PowerPoint Templates because Our PowerPoint Templates and Slides will let your words and thoughts hit bullseye everytime. Use our People PowerPoint Templates because Our PowerPoint Templates and Slides are effectively colour coded to prioritise your plans They automatically highlight the sequence of events you desire. Use our Future PowerPoint Templates because Our PowerPoint Templates and Slides will let you Hit the target. Go the full distance with ease and elan. Present our Marketing PowerPoint Templates because Our PowerPoint Templates and Slides will generate and maintain the level of interest you desire. They will create the impression you want to imprint on your audience. Present our Success PowerPoint Templates because Our PowerPoint Templates and Slides will provide weight to your words. They will bring out the depth of your thought process.Use these PowerPoint slides for presentations relating to 3d, achievement, ascending, bar, bargraph, business, businessman, career,chart, company, concept, corporate, design, development, executive, finance,financial, gain, goal, graph, graphic, growing, growth, happy, illustration, improvement, increase, man, manager, office, people, performance, person,photo, presentation, professional, profit, progress, report, rising, statistics,success, successful, technology, upward, top, winner. The prominent colors used in the PowerPoint template are Blue, Yellow, Red. Arm yourself with our Top Business People 3d Man With Colorful Bar Graph PowerPoint Templates. Carry your thoughts safely across.

Successful Business People Man Climbing Towards Growth PowerPoint Templates
We present our successful business people man climbing towards growth PowerPoint templates.Present our People PowerPoint Templates because Our PowerPoint Templates and Slides will help you be quick off the draw. Just enter your specific text and see your points hit home. Use our Success PowerPoint Templates because Our PowerPoint Templates and Slides will give you great value for your money. Be assured of finding the best projection to highlight your words. Present our Ladders PowerPoint Templates because Our PowerPoint Templates and Slides will generate and maintain the level of interest you desire. They will create the impression you want to imprint on your audience. Download and present our Finance PowerPoint Templates because Our PowerPoint Templates and Slides will effectively help you save your valuable time. They are readymade to fit into any presentation structure. Download and present our Marketing PowerPoint Templates because Our PowerPoint Templates and Slides offer you the widest possible range of options.Use these PowerPoint slides for presentations relating to cyan, way, isolated, bar, achievement, challenge, climbing, business, concept, arrow, sign, success, symbol, glad, graphic, finance, problem solving, goal, marketing, accounting, abstract, shortcut, graph, steps, illustration, chart, solve, ladder, up, reflection, aspirations, solution, pleasure, stairway, growth, motivation, progress, access, profit, increase, cheerful, path, investment, successful, conceptual, statistic, happy, stairs, ideas, 3d. The prominent colors used in the PowerPoint template are Blue, Red, Green. Persuade your teams with our Successful Business People Man Climbing Towards Growth PowerPoint Templates. Download without worries with our money back guaranteee.

Successful Business People Time To Reach With Ladder PowerPoint Templates
We present our successful business people time to reach with ladder PowerPoint templates.Present our People PowerPoint Templates because Our PowerPoint Templates and Slides help you pinpoint your timelines. Highlight the reasons for your deadlines with their use. Present our Success PowerPoint Templates because It can Leverage your style with our PowerPoint Templates and Slides. Charm your audience with your ability. Download our Ladders PowerPoint Templates because You can Channelise the thoughts of your team with our PowerPoint Templates and Slides. Urge them to focus on the goals you have set. Download our Finance PowerPoint Templates because Our PowerPoint Templates and Slides will definately Enhance the stature of your presentation. Adorn the beauty of your thoughts with their colourful backgrounds. Download our Marketing PowerPoint Templates because You can Double your output with our PowerPoint Templates and Slides. They make beating deadlines a piece of cake.Use these PowerPoint slides for presentations relating to cyan, way, isolated, bar, achievement, challenge, climbing, business, concept, arrow, sign, success, symbol, glad, graphic, finance, problem solving, goal, marketing, accounting, abstract, shortcut, graph, steps, illustration, chart, solve, ladder, up, reflection, aspirations, solution, pleasure, stairway, growth, motivation, progress, access, profit, increase, cheerful, path, investment, successful, conceptual, statistic, happy, stairs, ideas, 3d. The prominent colors used in the PowerPoint template are Red, Gray, Green. Suggest ideas with our Successful Business People Time To Reach With Ladder PowerPoint Templates. Download without worries with our money back guaranteee.
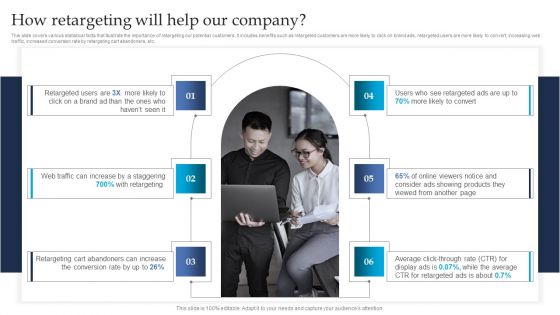
Retargeting Strategies To Improve Sales How Retargeting Will Help Our Company Topics PDF
This slide covers various statistical facts that illustrate the importance of retargeting our potential customers. It includes benefits such as retargeted customers are more likely to click on brand ads, retargeted users are more likely to convert, increasing web traffic, increased conversion rate by retargeting cart abandoners, etc. If you are looking for a format to display your unique thoughts, then the professionally designed Retargeting Strategies To Improve Sales How Retargeting Will Help Our Company Topics PDF is the one for you. You can use it as a Google Slides template or a PowerPoint template. Incorporate impressive visuals, symbols, images, and other charts. Modify or reorganize the text boxes as you desire. Experiment with shade schemes and font pairings. Alter, share or cooperate with other people on your work. Download Retargeting Strategies To Improve Sales How Retargeting Will Help Our Company Topics PDF and find out how to give a successful presentation. Present a perfect display to your team and make your presentation unforgettable.

Customer Experience Management Company Investor Funding Elevator Pitch Deck Ppt Template
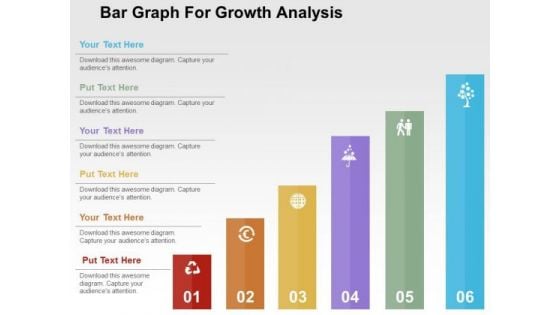
Bar Graph For Growth Analysis PowerPoint Template
This slide contains graphics bar chart. This slide helps to exhibit business growth analysis. Sparkling thoughts are swirling around in your head. Filter them through with this diagram slide.
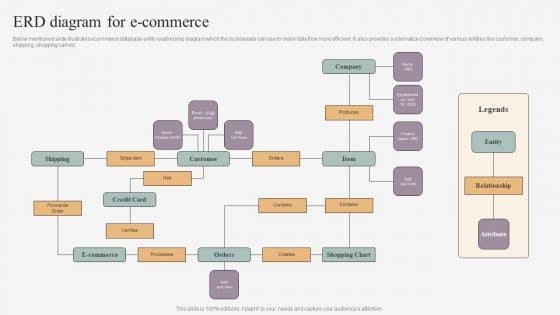
ERD Diagram For E Commerce Infographics PDF
Below mentioned slide illustrates ecommerce database entity relationship diagram which the businesses can use to make data flow more efficient. It also provides systematized overview of various entities like customer, company, shipping, shopping cart etc. Showcasing this set of slides titled ERD Diagram For E Commerce Infographics PDF. The topics addressed in these templates are Shipping, Customer, Company, Entity, Shopping Chart, Credit Card, Relationship. All the content presented in this PPT design is completely editable. Download it and make adjustments in color, background, font etc. as per your unique business setting.
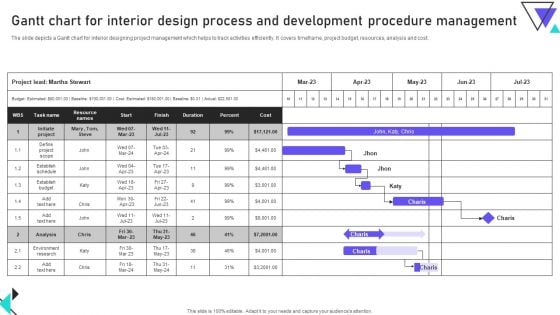
Gantt Chart For Interior Design Process And Development Procedure Management Diagrams PDF
The slide depicts a Gantt chart for interior designing project management which helps to track activities efficiently. It covers timeframe, project budget, resources, analysis and cost. Showcasing this set of slides titled Gantt Chart For Interior Design Process And Development Procedure Management Diagrams PDF. The topics addressed in these templates are Cost, Establish Budget, Development Procedure Management. All the content presented in this PPT design is completely editable. Download it and make adjustments in color, background, font etc. as per your unique business setting.

Data Analysis Excel 3d Pie Chart For Marketing Process PowerPoint Templates
Our data analysis excel 3d pie chart for marketing process Powerpoint Templates Team Are A Dogged Lot. They Keep At It Till They Get It Right.
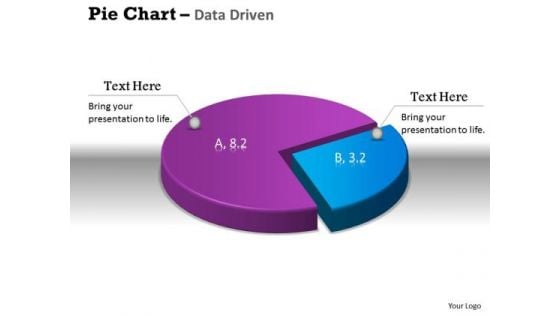
Data Analysis Excel 3d Pie Chart Shows Relative Size Of PowerPoint Templates
Get The Doers Into Action. Activate Them With Our data analysis excel 3d pie chart shows relative size of Powerpoint Templates.
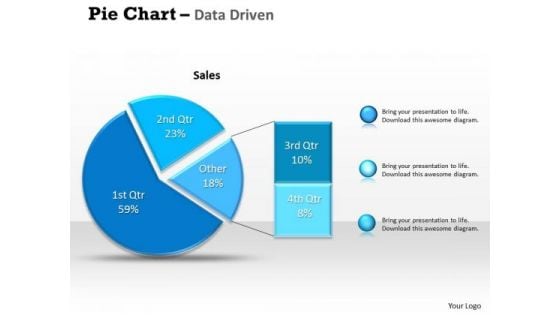
Data Analysis Excel Driven Percentage Breakdown Pie Chart PowerPoint Slides Templates
Be A Donor Of Great Ideas. Display Your Charity On Our data analysis excel driven percentage breakdown pie chart powerpoint slides Templates.
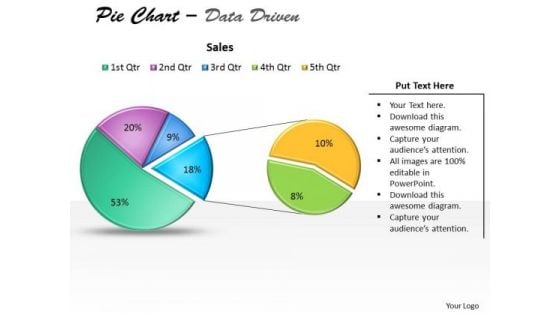
Data Analysis Excel Driven Pie Chart For Business Stratregy PowerPoint Slides Templates
Open Up Doors That Lead To Success. Our data analysis excel driven pie chart for business stratregy powerpoint slides Templates Provide The Handles.

Data Analysis Excel Driven Pie Chart For Easy Comparison PowerPoint Slides Templates
Our data analysis excel driven pie chart for easy comparison powerpoint slides Templates Abhor Doodling. They Never Let The Interest Flag.
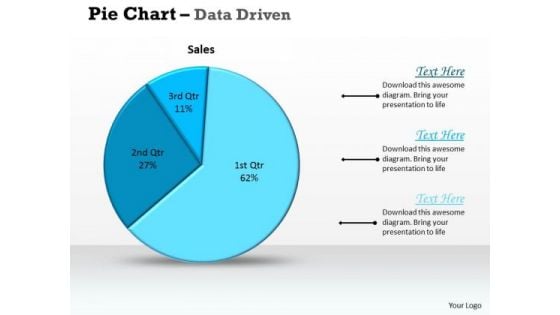
Data Analysis Excel Driven Pie Chart For Sales Process PowerPoint Slides Templates
Deliver The Right Dose With Our data analysis excel driven pie chart for sales process powerpoint slides Templates . Your Ideas Will Get The Correct Illumination.
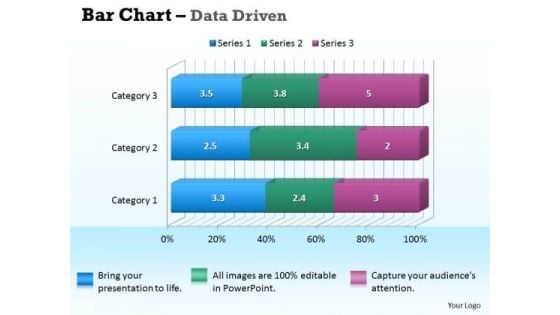
Data Analysis In Excel 3d Bar Chart For Business Information PowerPoint Templates
Our data analysis in excel 3d bar chart for business information Powerpoint Templates Deliver At Your Doorstep. Let Them In For A Wonderful Experience.
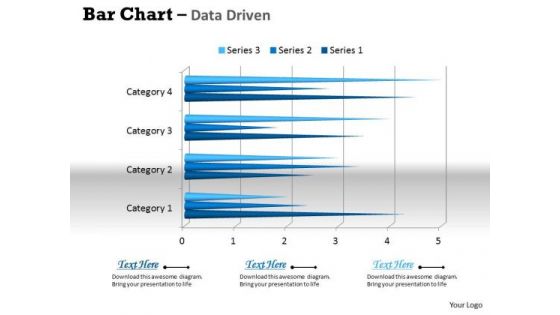
Data Analysis In Excel 3d Bar Chart For Business Trends PowerPoint Templates
Connect The Dots With Our data analysis in excel 3d bar chart for business trends Powerpoint Templates . Watch The Whole Picture Clearly Emerge.
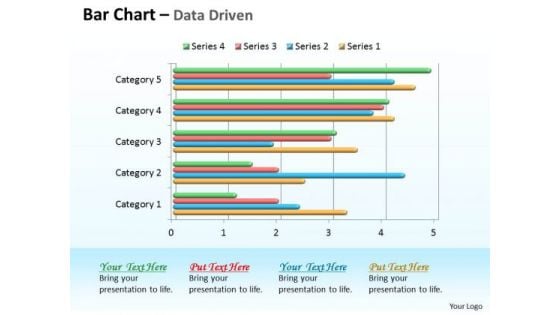
Data Analysis In Excel 3d Bar Chart For Comparison Of Time Series PowerPoint Templates
Double Your Chances With Our data analysis in excel 3d bar chart for comparison of time series Powerpoint Templates . The Value Of Your Thoughts Will Increase Two-Fold.
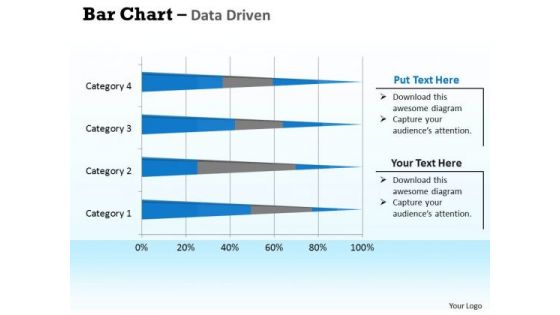
Data Analysis In Excel 3d Bar Chart For Interpretation PowerPoint Templates
Double Up Our data analysis in excel 3d bar chart for interpretation Powerpoint Templates With Your Thoughts. They Will Make An Awesome Pair.
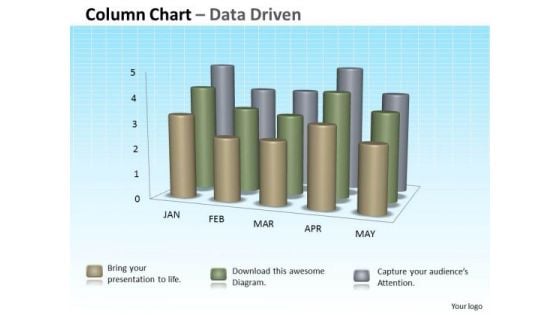
Data Analysis In Excel 3d Column Chart For Sets Of Information PowerPoint Templates
Double The Impact With Our data analysis in excel 3d column chart for sets of information Powerpoint Templates . Your Thoughts Will Have An Imposing Effect.
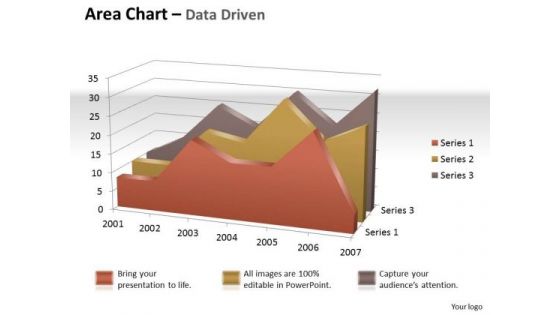
Data Analysis In Excel 3d Visual Display Of Area Chart PowerPoint Templates
Brace Yourself, Arm Your Thoughts. Prepare For The Hustle With Our data analysis in excel 3d visual display of area chart Powerpoint Templates .
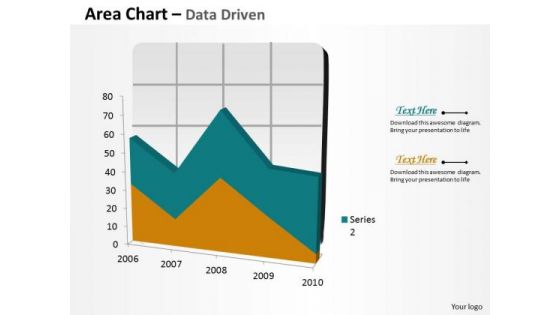
Data Analysis In Excel Area Chart For Business Process PowerPoint Templates
Your Grasp Of Economics Is Well Known. Help Your Audience Comprehend Issues With Our data analysis in excel area chart for business process Powerpoint Templates .
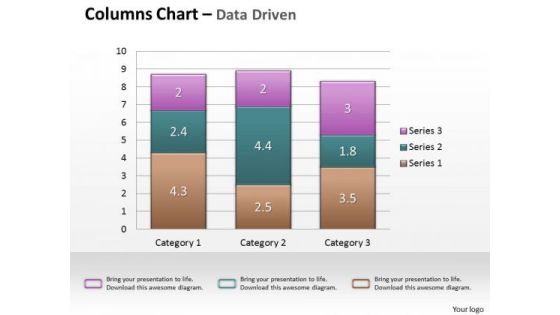
Data Analysis In Excel Column Chart For Business Analytics PowerPoint Templates
Our data analysis in excel column chart for business analytics Powerpoint Templates Heighten Concentration. Your Audience Will Be On The Edge.
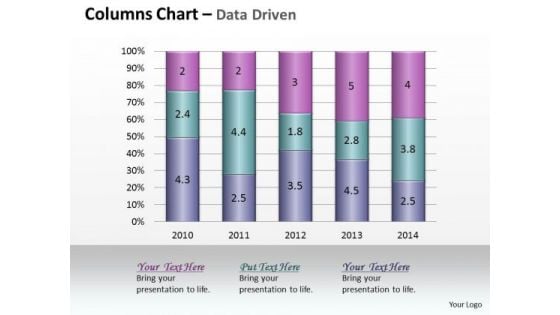
Data Analysis In Excel Column Chart Of Various Fields PowerPoint Templates
Land The Idea With Our data analysis in excel column chart of various fields Powerpoint Templates . Help It Grow With Your Thoughts.
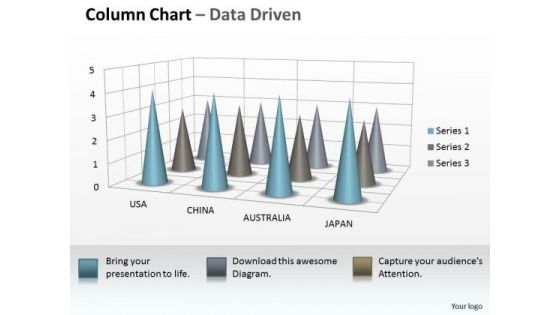
Data Analysis On Excel 3d Chart To Incorporate Business Information PowerPoint Templates
Our data analysis on excel 3d chart to incorporate business information Powerpoint Templates Allow You To Do It With Ease. Just Like Picking The Low Hanging Fruit.
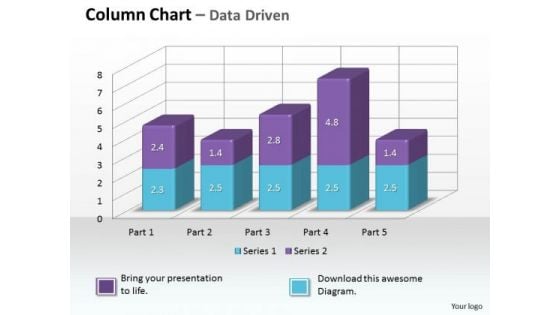
Data Analysis On Excel 3d Chart To Monitor Business Process PowerPoint Templates
Make Some Dough With Our data analysis on excel 3d chart to monitor business process Powerpoint Templates . Your Assets Will Rise Significantly.
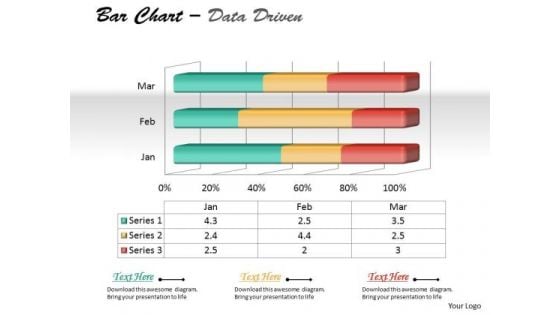
Data Analysis On Excel 3d Chart To Represent Quantitative Differences PowerPoint Templates
Draft It Out On Our data analysis on excel 3d chart to represent quantitative differences Powerpoint Templates . Give The Final Touches With Your Ideas.
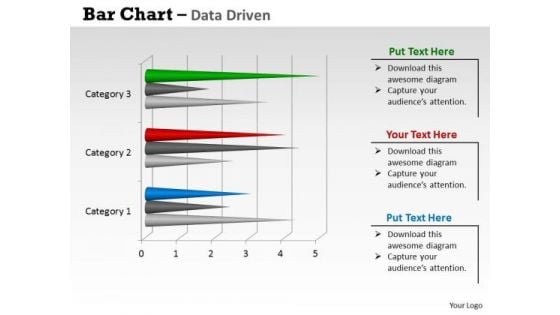
Data Analysis On Excel 3d Chart With Sets Of PowerPoint Templates
Reduce The Drag With Our data analysis on excel 3d chart with sets of Powerpoint Templates . Give More Lift To Your Thoughts.
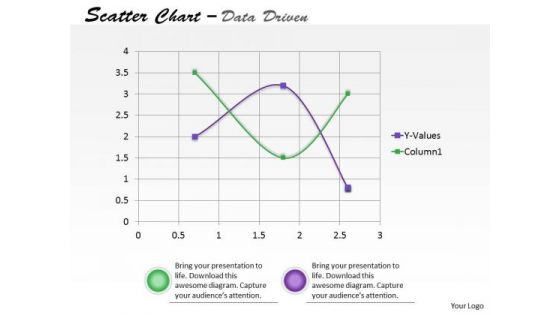
Data Analysis On Excel Driven Scatter Chart To Predict Future Movements PowerPoint Slides Templates
Our data analysis on excel driven scatter chart to predict future movements powerpoint slides Templates Enjoy Drama. They Provide Entertaining Backdrops.
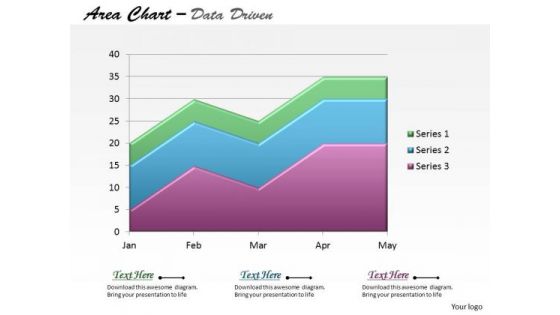
Data Analysis On Excel Driven Stacked Area Chart PowerPoint Slides Templates
Be The Dramatist With Our data analysis on excel driven stacked area chart powerpoint slides Templates . Script Out The Play Of Words.
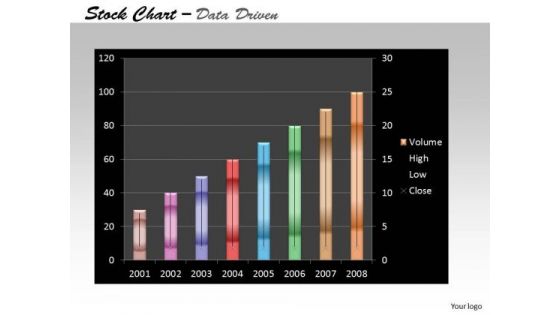
Data Analysis On Excel Driven Stock Chart For Business Growth PowerPoint Slides Templates
Add Some Dramatization To Your Thoughts. Our data analysis on excel driven stock chart for business growth powerpoint slides Templates Make Useful Props.
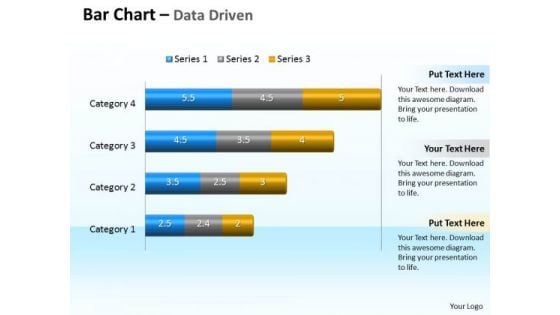
Data Analysis Programs 3d Bar Chart To Compare Categories PowerPoint Templates
Discover Decisive Moments With Our data analysis programs 3d bar chart to compare categories Powerpoint Templates . They Help Make That Crucial Difference.
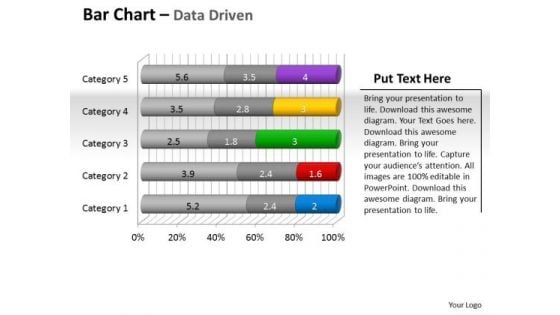
Data Analysis Programs 3d Bar Chart To Put Information PowerPoint Templates
Draw Up Your Agenda On Our data analysis programs 3d bar chart to put information Powerpoint Templates . Coax Your Audience Into Acceptance.
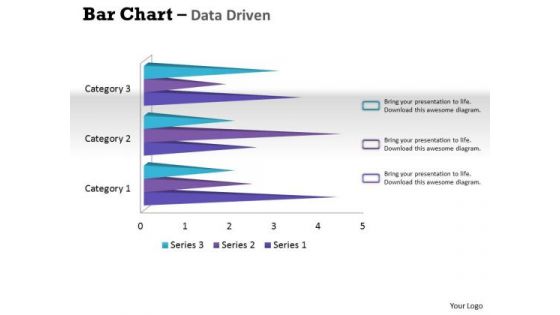
Data Analysis Techniques 3d Bar Chart For Financial Solutions PowerPoint Templates
Make Your Dreams A Reality With Our data analysis techniques 3d bar chart for financial solutions Powerpoint Templates . Your Ideas Will Begin To Take Shape.

Data Analysis Template Driven Express Business Facts Pie Chart PowerPoint Slides Templates
Display Your Drive On Our data analysis template driven express business facts pie chart powerpoint slides Templates . Invigorate The Audience With Your Fervor.
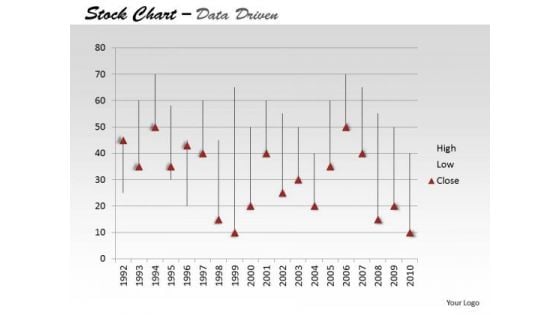
Data Analysis Template Driven Ineract With Stock Chart PowerPoint Slides Templates
Drive Your Passion With Our data analysis template driven ineract with stock chart powerpoint slides Templates . Steer Yourself To Achieve Your Aims.
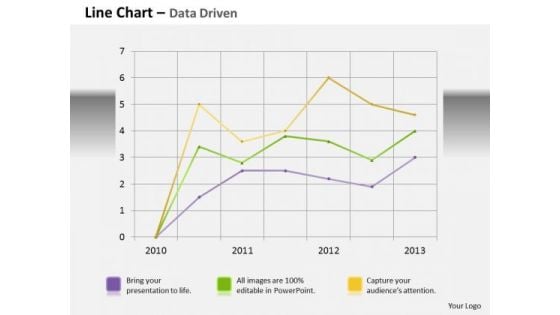
Data Analysis Template Driven Line Chart Business Graph PowerPoint Slides Templates
Bottle Your Thoughts In Our data analysis template driven line chart business graph powerpoint slides Templates . Pass It Around For Your Audience To Sip.
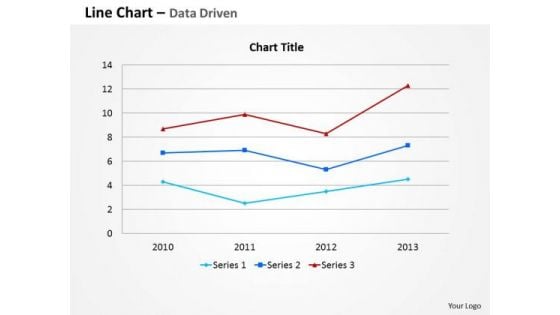
Data Analysis Template Driven Line Chart For Business Information PowerPoint Slides Templates
Your Thoughts Are Dripping With Wisdom. Lace It With Our data analysis template driven line chart for business information powerpoint slides Templates .
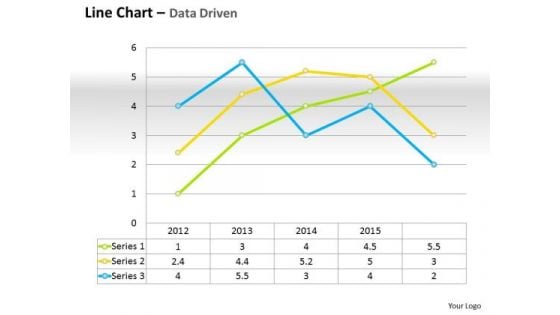
Data Analysis Template Driven Line Chart For Business Performance PowerPoint Slides Templates
Do Not Allow Things To Drift. Ring In Changes With Our data analysis template driven line chart for business performance powerpoint slides Templates .
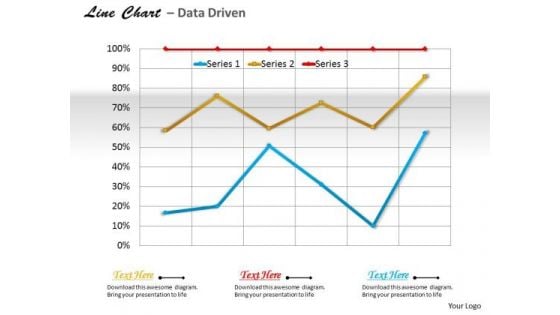
Data Analysis Template Driven Line Chart For Business Trends PowerPoint Slides Templates
Use Our data analysis template driven line chart for business trends powerpoint slides Templates As The Bit. Drill Your Thoughts Into Their Minds.
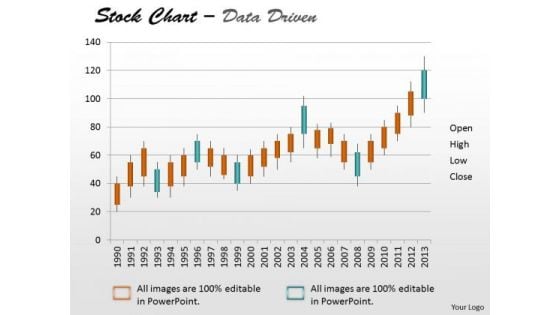
Data Analysis Template Driven Stock Chart For Market Trends PowerPoint Slides Templates
Drive Your Team Along The Road To Success. Take The Wheel With Our data analysis template driven stock chart for market trends powerpoint slides Templates .
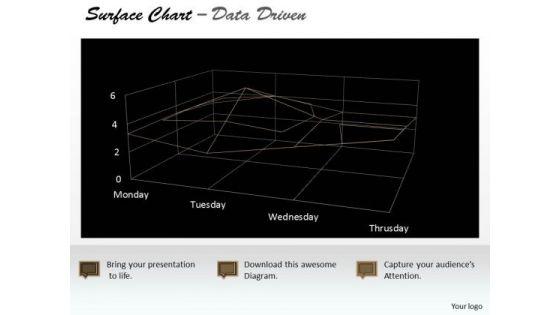
Data Analysis Template Driven Surface Chart Indicating Areas PowerPoint Slides Templates
Highlight Your Drive With Our data analysis template driven surface chart indicating areas powerpoint slides Templates . Prove The Fact That You Have Control.
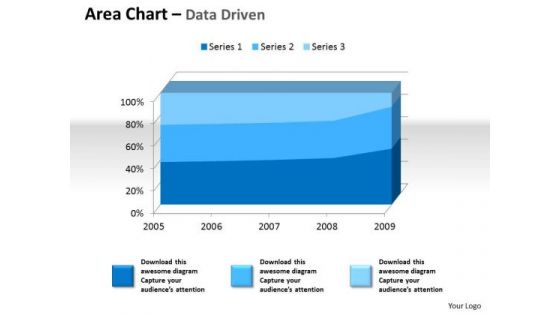
Examples Of Data Analysis Market 3d Area Chart For Quantiative PowerPoint Templates
Drum It Up With Our examples of data analysis market 3d area chart for quantiative Powerpoint Templates . Your Thoughts Will Raise The Tempo.
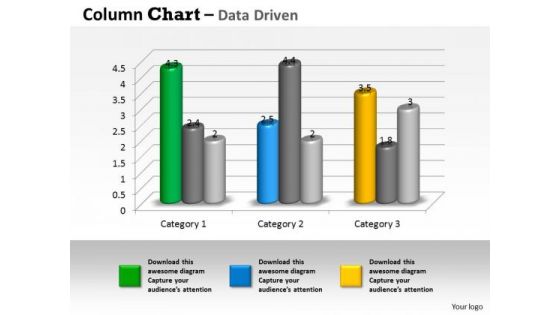
Examples Of Data Analysis Market 3d Business Trend Series Chart PowerPoint Templates
Duct It Through With Our examples of data analysis market 3d business trend series chart Powerpoint Templates . Your Ideas Will Reach Into Their Minds Intact.
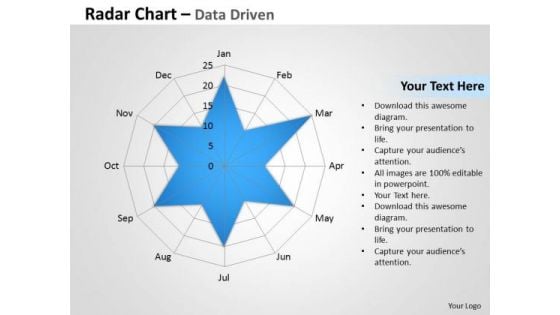
Examples Of Data Analysis Market Driven Radar Chart To Compare PowerPoint Slides Templates
Rely On Our examples of data analysis market driven radar chart to compare powerpoint slides Templates In Any Duel. They Will Drive Home Your Point.
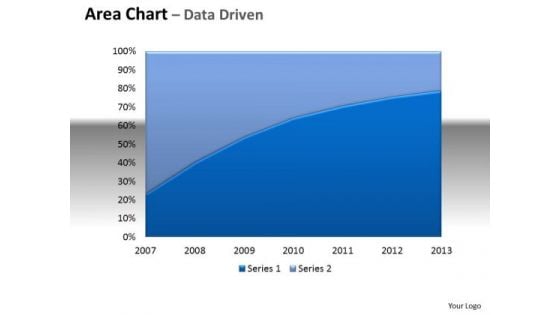
Financial Data Analysis Area Chart With Plotted Line Center PowerPoint Templates
Be The Doer With Our financial data analysis area chart with plotted line center Powerpoint Templates . Put Your Thoughts Into Practice.
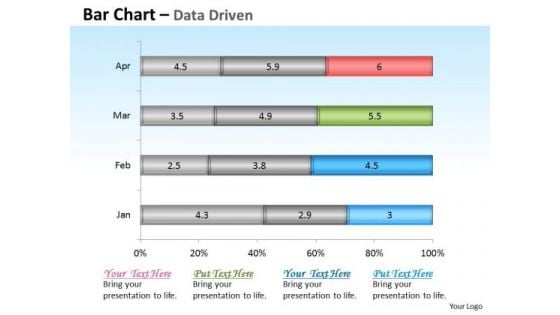
Financial Data Analysis Driven Base Bar Chart Design PowerPoint Slides Templates
Get The Domestics Right With Our financial data analysis driven base bar chart design powerpoint slides Templates . Create The Base For Thoughts To Grow.
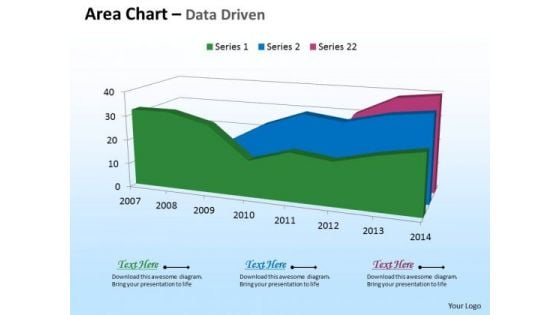
Microsoft Excel Data Analysis 3d Area Chart For Time Based PowerPoint Templates
Deliver The Right Dose With Our microsoft excel data analysis 3d area chart for time based Powerpoint Templates . Your Ideas Will Get The Correct Illumination.
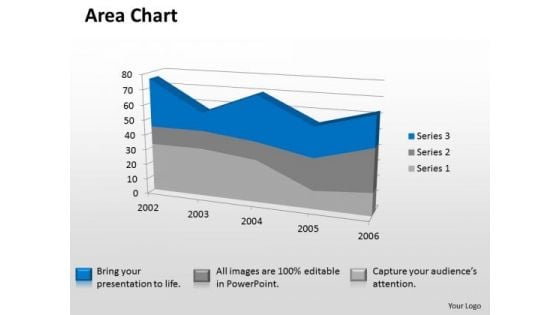
Microsoft Excel Data Analysis 3d Area Chart Showimg Change In Values PowerPoint Templates
Our microsoft excel data analysis 3d area chart showimg change in values Powerpoint Templates Deliver At Your Doorstep. Let Them In For A Wonderful Experience.
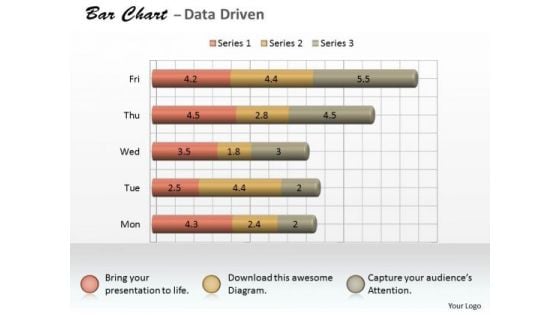
Microsoft Excel Data Analysis 3d Bar Chart As Research Tool PowerPoint Templates
Knock On The Door To Success With Our microsoft excel data analysis 3d bar chart as research tool Powerpoint Templates . Be Assured Of Gaining Entry.
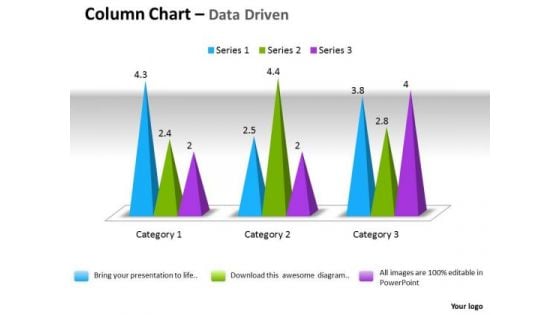
Microsoft Excel Data Analysis 3d Change In Business Process Chart PowerPoint Templates
Double Your Chances With Our microsoft excel data analysis 3d change in business process chart Powerpoint Templates . The Value Of Your Thoughts Will Increase Two-Fold.
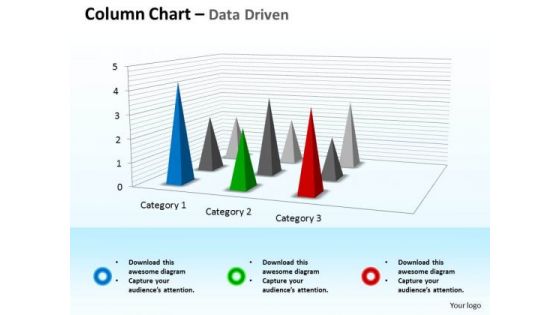
Microsoft Excel Data Analysis 3d Chart For Business Observation PowerPoint Templates
Double Up Our microsoft excel data analysis 3d chart for business observation Powerpoint Templates With Your Thoughts. They Will Make An Awesome Pair.
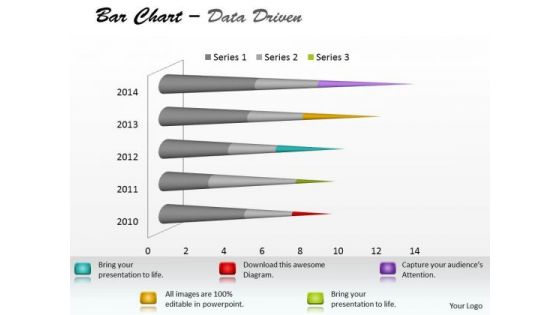
Microsoft Excel Data Analysis Bar Chart To Communicate Information PowerPoint Templates
With Our microsoft excel data analysis bar chart to communicate information Powerpoint Templates You Will Be Doubly Sure. They Possess That Stamp Of Authority.
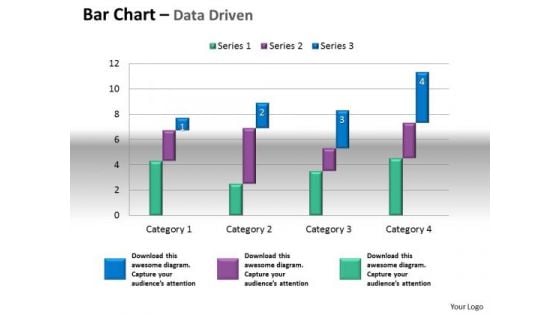
Microsoft Excel Data Analysis Bar Chart To Compare Quantities PowerPoint Templates
Our microsoft excel data analysis bar chart to compare quantities Powerpoint Templates Leave No One In Doubt. Provide A Certainty To Your Views.
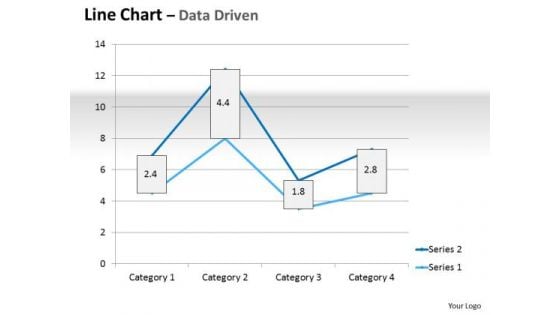
Multivariate Data Analysis Driven Line Chart Market Graph PowerPoint Slides Templates
Plan For All Contingencies With Our multivariate data analysis driven line chart market graph powerpoint slides Templates . Douse The Fire Before It Catches.
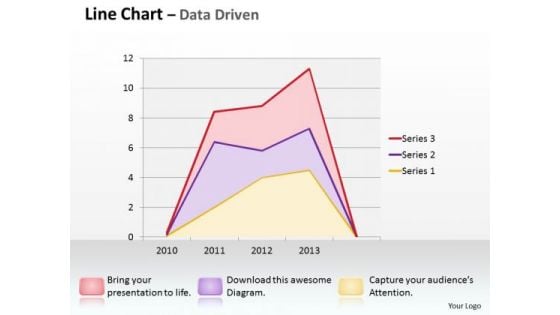
Multivariate Data Analysis Driven Line Chart Shows Revenue Trends PowerPoint Slides Templates
Good Camaraderie Is A Key To Teamwork. Our multivariate data analysis driven line chart shows revenue trends powerpoint slides Templates Can Be A Cementing Force.
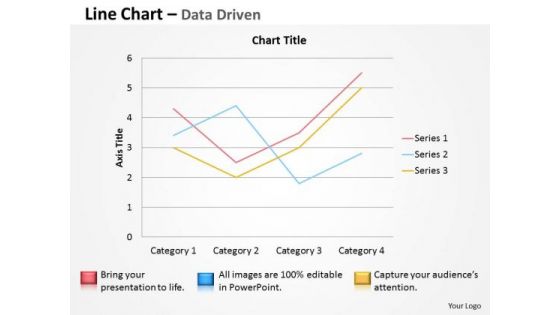
Multivariate Data Analysis Driven Line Chart To Demonstrate PowerPoint Slides Templates
Brace Yourself, Arm Your Thoughts. Prepare For The Hustle With Our multivariate data analysis driven line chart to demonstrate powerpoint slides Templates .
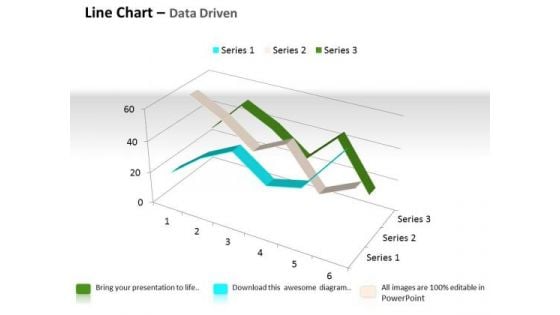
Quantitative Data Analysis 3d Line Chart For Comparison Of PowerPoint Templates
Touch Base With Our quantitative data analysis 3d line chart for comparison of Powerpoint Templates . Review Your Growth With Your Audience.

Quantitative Data Analysis 3d Pie Chart For Business Process PowerPoint Templates
Put Them On The Same Page With Our quantitative data analysis 3d pie chart for business process Powerpoint Templates . Your Team Will Sing From The Same Sheet.
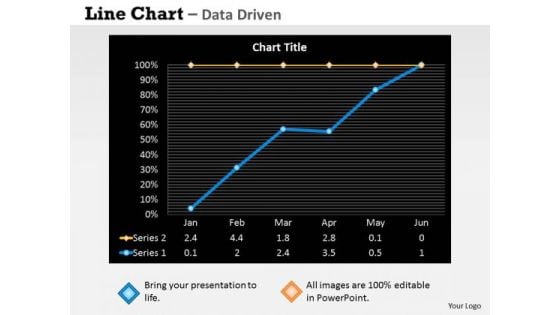
Quantitative Data Analysis Driven Economic Status Line Chart PowerPoint Slides Templates
Be The Dramatist With Our quantitative data analysis driven economic status line chart powerpoint slides Templates . Script Out The Play Of Words.
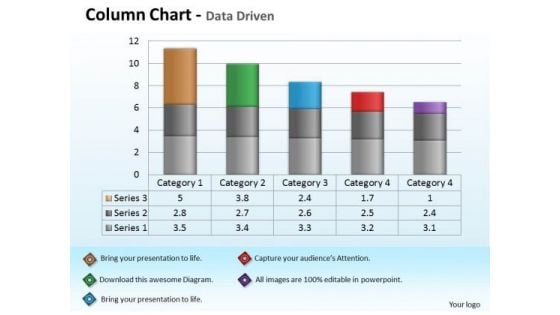
Quantitative Data Analysis Driven Economic With Column Chart PowerPoint Slides Templates
Add Some Dramatization To Your Thoughts. Our quantitative data analysis driven economic with column chart powerpoint slides Templates Make Useful Props.
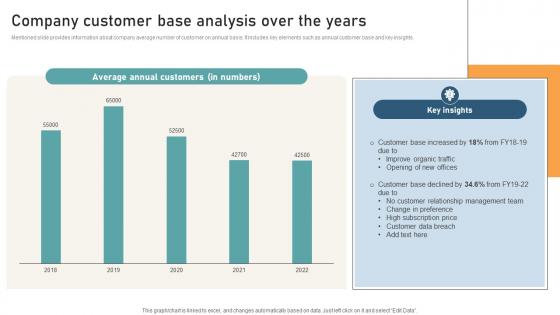
Comprehensive Guide For Website Company Customer Base Analysis Over The Years
Mentioned slide provides information about company average number of customer on annual basis. It includes key elements such as annual customer base and key insights. If your project calls for a presentation, then Slidegeeks is your go-to partner because we have professionally designed, easy-to-edit templates that are perfect for any presentation. After downloading, you can easily edit Comprehensive Guide For Website Company Customer Base Analysis Over The Years and make the changes accordingly. You can rearrange slides or fill them with different images. Check out all the handy templates Mentioned slide provides information about company average number of customer on annual basis. It includes key elements such as annual customer base and key insights.

Global Data Security Industry Report Geographical Analysis For Cybersecurity Industry IR SS V
The slide highlights the geographical summary of current state of cybersecurity industry. The purpose of the slide is to provide insights on cybersecurity landscape, trends, development at regional levels. It helps stakeholders in understanding the market dynamics, regulatory environments and potential growth opportunities. If your project calls for a presentation, then Slidegeeks is your go-to partner because we have professionally designed, easy-to-edit templates that are perfect for any presentation. After downloading, you can easily edit Global Data Security Industry Report Geographical Analysis For Cybersecurity Industry IR SS V and make the changes accordingly. You can rearrange slides or fill them with different images. Check out all the handy templates The slide highlights the geographical summary of current state of cybersecurity industry. The purpose of the slide is to provide insights on cybersecurity landscape, trends, development at regional levels. It helps stakeholders in understanding the market dynamics, regulatory environments and potential growth opportunities.
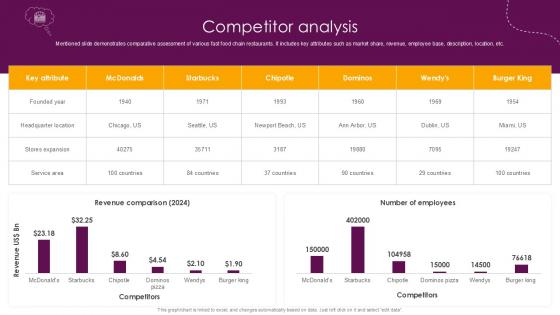
Competitor Analysis Food And Beverages Company Profile Ppt Powerpoint CP SS V
Mentioned slide demonstrates comparative assessment of various fast food chain restaurants. It includes key attributes such as market share, revenue, employee base, description, location, etc. Slidegeeks is here to make your presentations a breeze with Competitor Analysis Food And Beverages Company Profile Ppt Powerpoint CP SS V With our easy-to-use and customizable templates, you can focus on delivering your ideas rather than worrying about formatting. With a variety of designs to choose from, you are sure to find one that suits your needs. And with animations and unique photos, illustrations, and fonts, you can make your presentation pop. So whether you are giving a sales pitch or presenting to the board, make sure to check out Slidegeeks first Mentioned slide demonstrates comparative assessment of various fast food chain restaurants. It includes key attributes such as market share, revenue, employee base, description, location, etc.

 Home
Home