Survey Icon
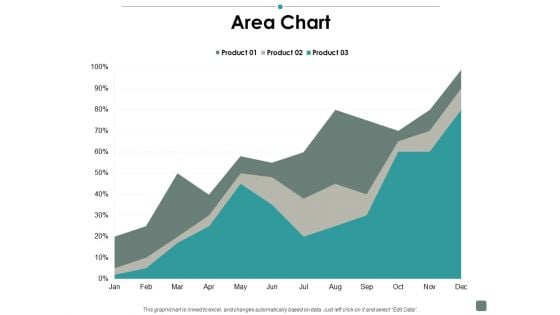
Area Chart Contribution Ppt PowerPoint Presentation Gallery Structure
This is a area chart contribution ppt powerpoint presentation gallery structure. This is a three stage process. The stages in this process are business, management, strategy, analysis, marketing.
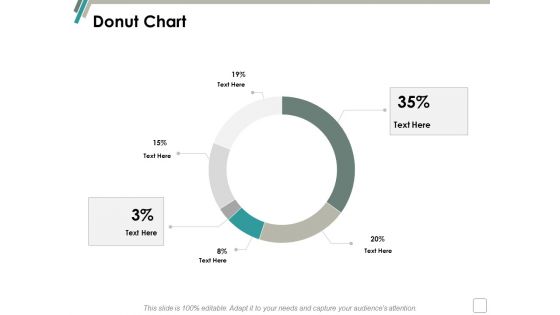
Donut Chart Management Ppt Powerpoint Presentation Slides Aids
This is a donut chart management ppt powerpoint presentation slides aids. This is a six stage process. The stages in this process are finance, marketing, management, investment, analysis.
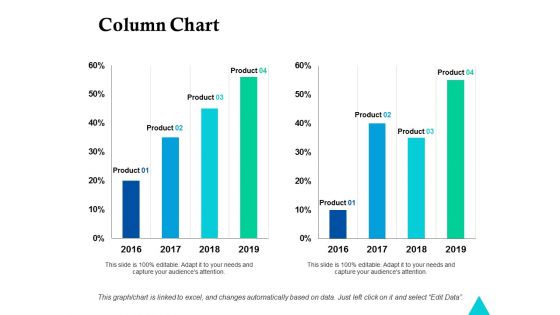
Column Chart Finance Ppt Powerpoint Presentation Summary Visuals
This is a column chart finance ppt powerpoint presentation summary visuals. This is a four stage process. The stages in this process are finance, marketing, management, investment, analysis.

area chart finance ppt powerpoint presentation layouts ideas
This is a area chart finance ppt powerpoint presentation layouts ideas. This is a three stage process. The stages in this process are finance, marketing, management, investment, analysis.
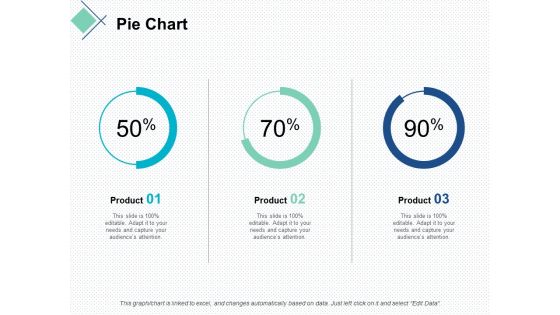
pie chart finance marketing ppt powerpoint presentation slides demonstration
This is a pie chart finance marketing ppt powerpoint presentation slides demonstration. This is a stage process. The stages in this process are finance, marketing, management, investment, analysis.
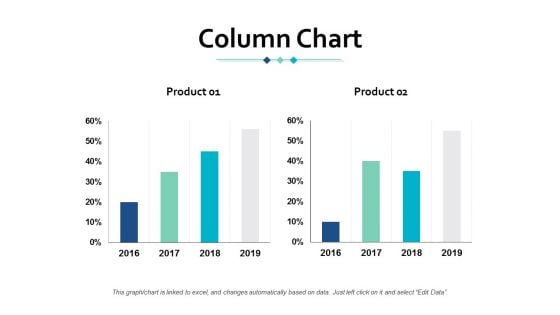
Column Chart Finance Ppt Powerpoint Presentation Gallery Maker
This is a column chart finance ppt powerpoint presentation gallery maker. This is a two stage process. The stages in this process are finance, marketing, management, investment, analysis.
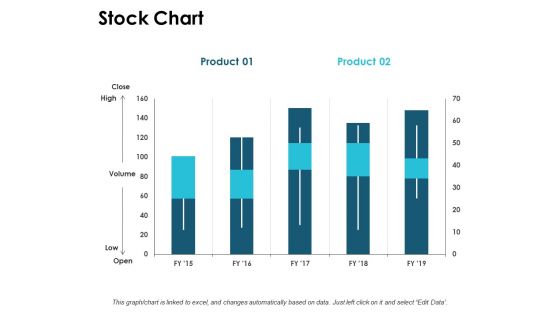
Stock Chart Graph Ppt PowerPoint Presentation Ideas Demonstration
This is a stock chart graph ppt powerpoint presentation ideas demonstration. This is a three stage process. The stages in this process are finance, marketing, management, investment, analysis.
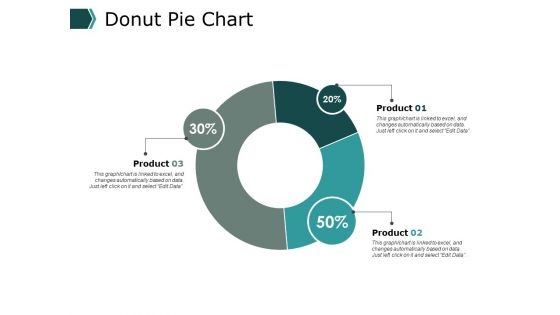
Donut Pie Chart Ppt PowerPoint Presentation Model Deck
This is a donut pie chart ppt powerpoint presentation model deck. This is a three stage process. The stages in this process are finance, marketing, management, investment, analysis.
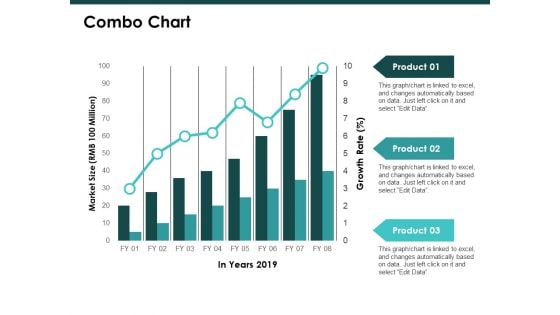
Combo Chart Graph Ppt PowerPoint Presentation Inspiration Template
This is a combo chart graph ppt powerpoint presentation inspiration template. This is a three stage process. The stages in this process are finance, marketing, management, investment, analysis.
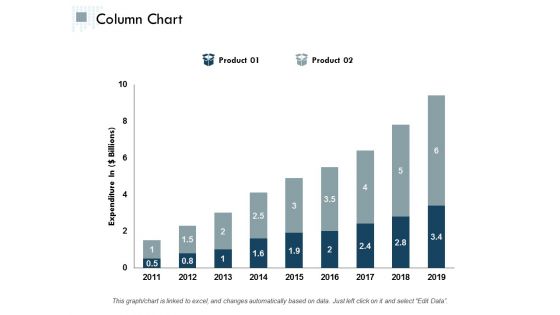
Column Chart Finance Ppt Powerpoint Presentation Styles Examples
This is a column chart finance ppt powerpoint presentation styles examples. This is a two stage process. The stages in this process are finance, marketing, management, investment, analysis.
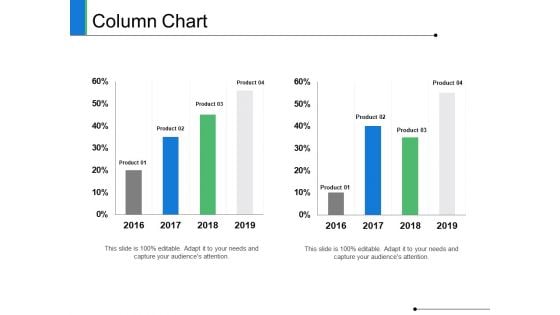
Column Chart Finance Ppt PowerPoint Presentation Summary Grid
This is a column chart finance ppt powerpoint presentation summary grid. This is a three stage process. The stages in this process are finance, marketing, management, investment, analysis.
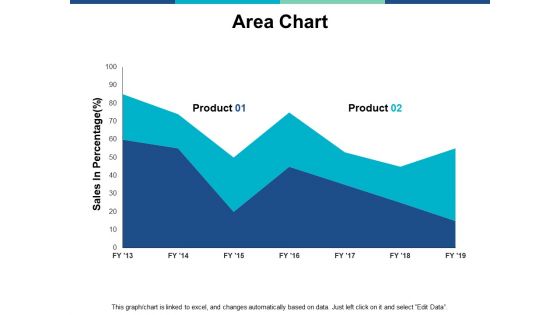
Area Chart Finance Ppt PowerPoint Presentation Summary Structure
This is a area chart finance ppt powerpoint presentation summary structure. This is a two stage process. The stages in this process are finance, marketing, management, investment, analysis.
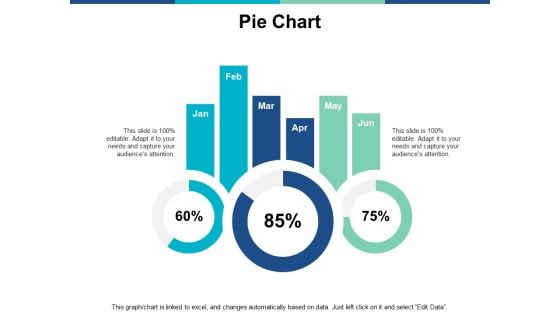
Pie Chart Finance Ppt PowerPoint Presentation Ideas Templates
This is a pie chart finance ppt powerpoint presentation ideas templates. This is a three stage process. The stages in this process are finance, marketing, management, investment, analysis.
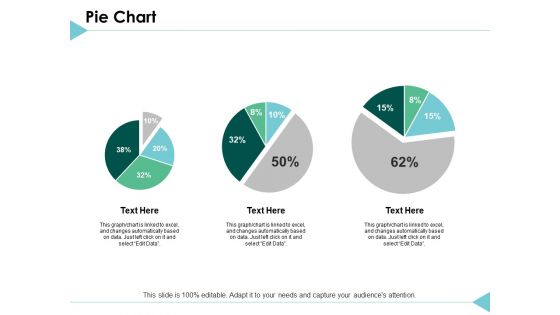
Pie Chart Finance Ppt PowerPoint Presentation Styles Templates
This is a pie chart finance ppt powerpoint presentation styles templates. This is a three stage process. The stages in this process are finance, marketing, analysis, investment, million.
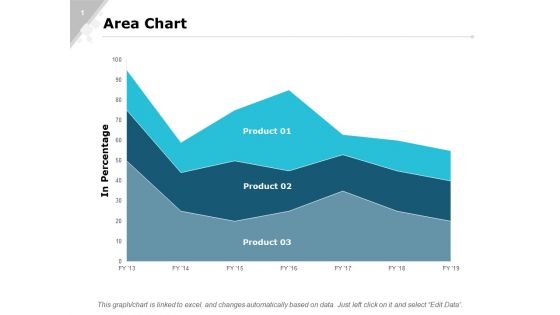
Area Chart Finance Ppt PowerPoint Presentation Outline Structure
This is a area chart finance ppt powerpoint presentation outline structure. This is a three stage process. The stages in this process are finance, marketing, analysis, investment, million.
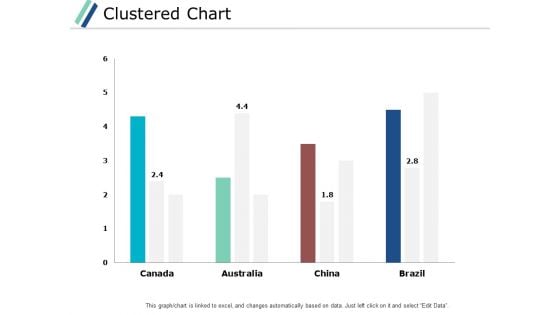
Clustered Chart Graph Ppt PowerPoint Presentation Gallery Backgrounds
This is a clustered chart graph ppt powerpoint presentation gallery backgrounds. This is a three stage process. The stages in this process are finance, marketing, analysis, investment, million.
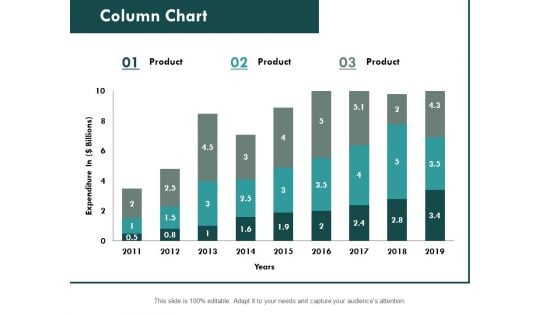
Column Chart Graph Ppt PowerPoint Presentation Slides File Formats
This is a combo chart bar ppt powerpoint presentation slides portfolio. This is a three stage process. The stages in this process are finance, marketing, analysis, investment, million.
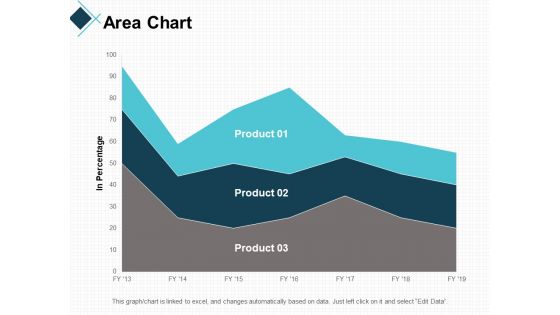
Area Chart Finance Ppt PowerPoint Presentation Gallery Information
This is a area chart finance ppt powerpoint presentation gallery information. This is a three stage process. The stages in this process are finance, marketing, analysis, investment, million.
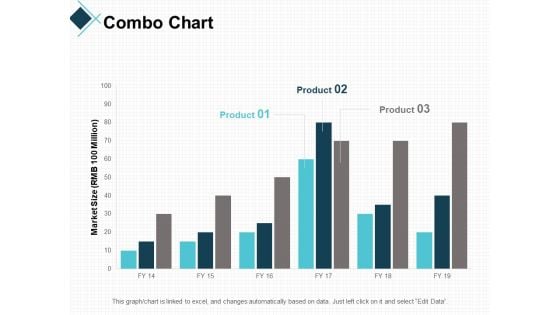
Combo Chart Graph Ppt PowerPoint Presentation Professional Guidelines
This is a combo chart graph ppt powerpoint presentation professional guidelines. This is a three stage process. The stages in this process are finance, marketing, analysis, investment, million.
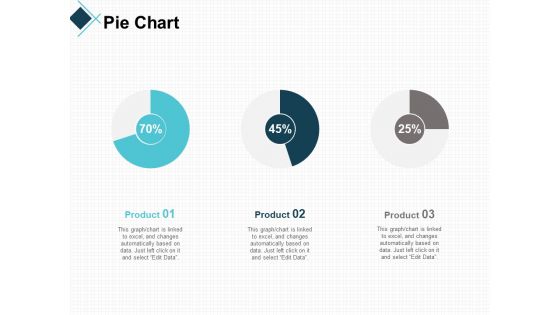
Pie Chart Bar Ppt PowerPoint Presentation Layouts Examples
This is a pie chart bar ppt powerpoint presentation layouts examples. This is a three stage process. The stages in this process are finance, marketing, analysis, investment, million.
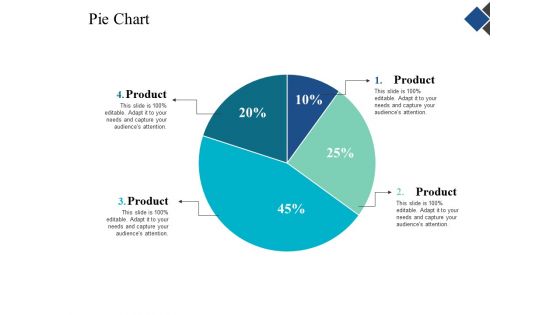
Pie Chart Finance Ppt Powerpoint Presentation Gallery Templates
This is a pie chart finance ppt powerpoint presentation gallery templates. This is a four stage process. The stages in this process are finance, marketing, management, investment, analysis.
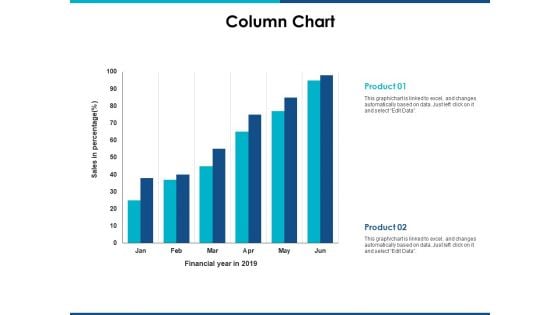
Column Chart Finance Ppt Powerpoint Presentation Inspiration Images
This is a column chart finance ppt powerpoint presentation inspiration images. This is a two stage process. The stages in this process are finance, marketing, management, investment, analysis.
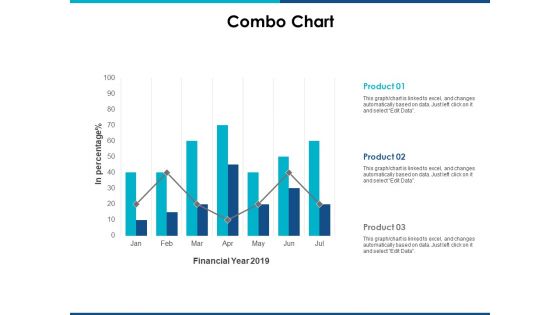
Combo Chart Finance Ppt Powerpoint Presentation Ideas Slides
This is a combo chart finance ppt powerpoint presentation ideas slides. This is a three stage process. The stages in this process are finance, marketing, management, investment, analysis.
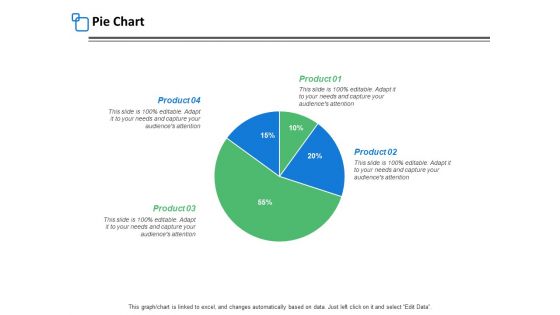
Pie Chart Finance Ppt PowerPoint Presentation Inspiration Templates
This is a pie chart finance ppt powerpoint presentation inspiration templates. This is a four stage process. The stages in this process are finance, marketing, management, investment, analysis.
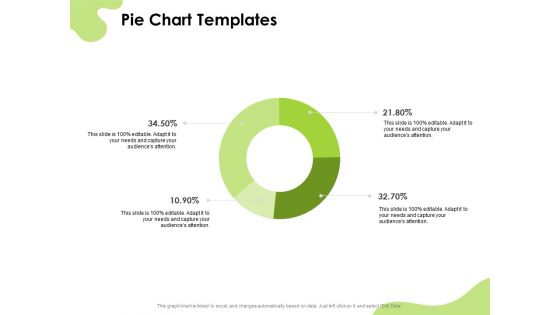
Reach Your Target Audience Pie Chart Ppt Show Model PDF
This is a reach your target audience pie chart ppt show model pdf template with various stages. Focus and dispense information on four stages using this creative set, that comes with editable features. It contains large content boxes to add your information on topics like pie chart. You can also showcase facts, figures, and other relevant content using this PPT layout. Grab it now.
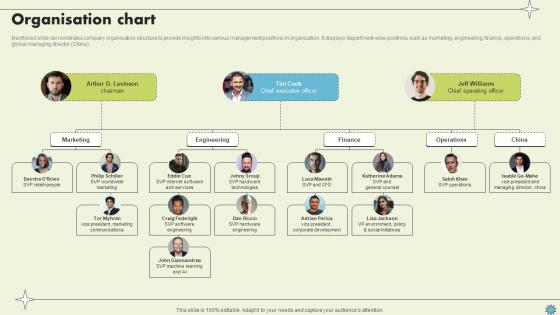
Organisation Chart Consumer Electronics Company Profile CP SS V
Mentioned slide demonstrates company organisation structure to provide insights into various management positions in organization. It displays department-wise positions such as marketing, engineering, finance, operations, and global managing director ChinaIf your project calls for a presentation, then Slidegeeks is your go-to partner because we have professionally designed, easy-to-edit templates that are perfect for any presentation. After downloading, you can easily edit Organisation Chart Consumer Electronics Company Profile CP SS V and make the changes accordingly. You can rearrange slides or fill them with different images. Check out all the handy templates Mentioned slide demonstrates company organisation structure to provide insights into various management positions in organization. It displays department-wise positions such as marketing, engineering, finance, operations, and global managing director China
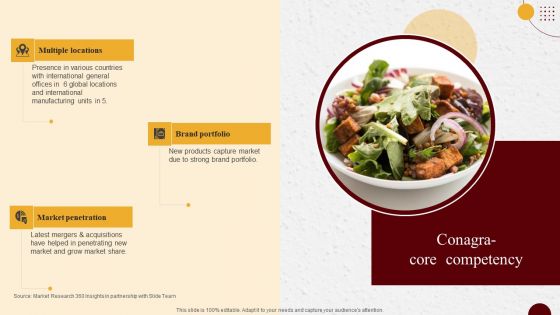
Industry Report Of Packaged Food Products Part 2 Conagra Core Competency Diagrams PDF
Slidegeeks is here to make your presentations a breeze with Industry Report Of Packaged Food Products Part 2 Conagra Core Competency Diagrams PDF With our easy to use and customizable templates, you can focus on delivering your ideas rather than worrying about formatting. With a variety of designs to choose from, you are sure to find one that suits your needs. And with animations and unique photos, illustrations, and fonts, you can make your presentation pop. So whether you are giving a sales pitch or presenting to the board, make sure to check out Slidegeeks first.
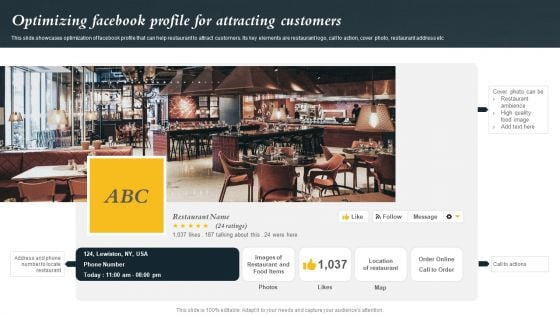
Marketing Initiatives To Promote Fast Food Cafe Optimizing Facebook Profile For Attracting Customers Diagrams PDF
This slide showcases optimization of facebook profile that can help restaurant to attract customers. Its key elements are restaurant logo, call to action, cover photo, restaurant address etc If your project calls for a presentation, then Slidegeeks is your go to partner because we have professionally designed, easy to edit templates that are perfect for any presentation. After downloading, you can easily edit Marketing Initiatives To Promote Fast Food Cafe Optimizing Facebook Profile For Attracting Customers Diagrams PDF and make the changes accordingly. You can rearrange slides or fill them with different images. Check out all the handy templates
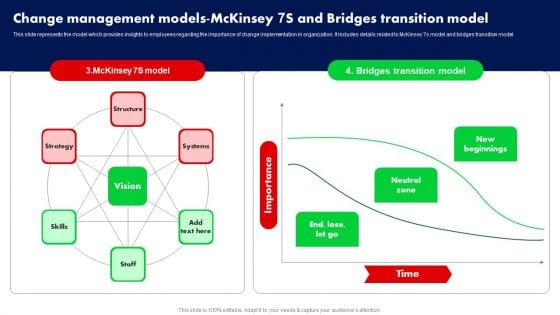
Change Management Models Mckinsey 7S And Bridges Transition Model Ppt PowerPoint Presentation Diagram Templates PDF
This slide represents the model which provides insights to employees regarding the importance of change implementation in organization. It includes details related to McKinsey 7s model and bridges transition model. If your project calls for a presentation, then Slidegeeks is your go to partner because we have professionally designed, easy to edit templates that are perfect for any presentation. After downloading, you can easily edit Change Management Models Mckinsey 7S And Bridges Transition Model Ppt PowerPoint Presentation Diagram Templates PDF and make the changes accordingly. You can rearrange slides or fill them with different images. Check out all the handy templates
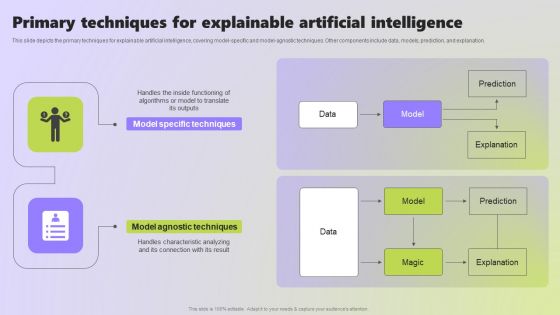
Use Cases Of Explainable AI In Various Sectors Primary Techniques For Explainable Diagrams PDF
This slide depicts the primary techniques for explainable artificial intelligence, covering model-specific and model-agnostic techniques. Other components include data, models, prediction, and explanation. If your project calls for a presentation, then Slidegeeks is your go-to partner because we have professionally designed, easy-to-edit templates that are perfect for any presentation. After downloading, you can easily edit Use Cases Of Explainable AI In Various Sectors Primary Techniques For Explainable Diagrams PDF and make the changes accordingly. You can rearrange slides or fill them with different images. Check out all the handy templates
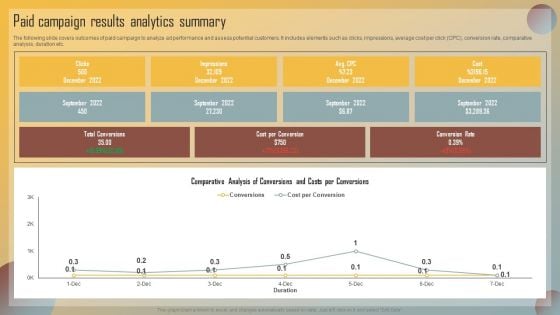
Guide For Marketing Analytics To Improve Decisions Paid Campaign Results Analytics Summary Themes PDF
The following slide covers outcomes of paid campaign to analyze ad performance and assess potential customers. It includes elements such as clicks, impressions, average cost per click CPC, conversion rate, comparative analysis, duration etc. Do you have to make sure that everyone on your team knows about any specific topic I yes, then you should give Guide For Marketing Analytics To Improve Decisions Paid Campaign Results Analytics Summary Themes PDF a try. Our experts have put a lot of knowledge and effort into creating this impeccable Guide For Marketing Analytics To Improve Decisions Paid Campaign Results Analytics Summary Themes PDF. You can use this template for your upcoming presentations, as the slides are perfect to represent even the tiniest detail. You can download these templates from the Slidegeeks website and these are easy to edit. So grab these today.
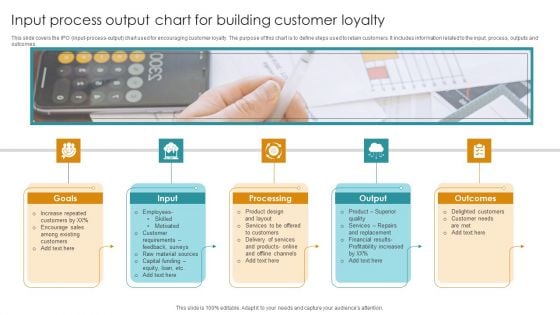
Input Process Output Chart For Building Customer Loyalty Formats PDF
This slide covers the IPO input-process-output chart used for encouraging customer loyalty. The purpose of this chart is to define steps used to retain customers. It includes information related to the input, process, outputs and outcomes. Persuade your audience using this Input Process Output Chart For Building Customer Loyalty Formats PDF. This PPT design covers Five stages, thus making it a great tool to use. It also caters to a variety of topics including Goals, Input, Processing. Download this PPT design now to present a convincing pitch that not only emphasizes the topic but also showcases your presentation skills.
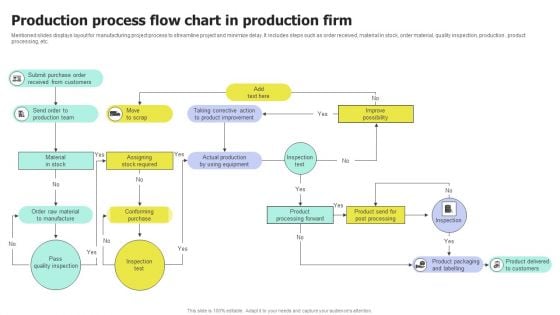
Production Process Flow Chart In Production Firm Elements PDF
Mentioned slide demonstrates risk management process used by businesses to reduce project cost. It includes elements such as setting risk approach, identify risk, risk analysis, response planning for risk, budget allocation, response implementation and risk status communication to executives. Presenting Production Process Flow Chart In Production Firm Elements PDF to dispense important information. This template comprises Three stages. It also presents valuable insights into the topics including Formulate Risk, Management Plan, Identify Risk, Document Risk, Address Identified Risk. This is a completely customizable PowerPoint theme that can be put to use immediately. So, download it and address the topic impactfully.
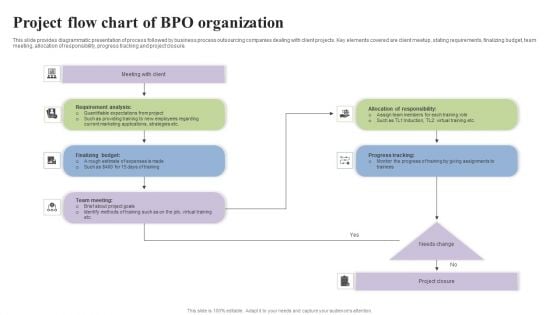
Project Flow Chart Of BPO Organization Summary PDF
This slide provides diagrammatic presentation of process followed by business process outsourcing companies dealing with client projects. Key elements covered are client meetup, stating requirements, finalizing budget, team meeting, allocation of responsibility, progress tracking and project closure. Presenting Project Flow Chart Of BPO Organization Summary PDF to dispense important information. This template comprises one stages. It also presents valuable insights into the topics including Requirement Analysis, Finalizing Budget, Team Meeting. This is a completely customizable PowerPoint theme that can be put to use immediately. So, download it and address the topic impactfully.
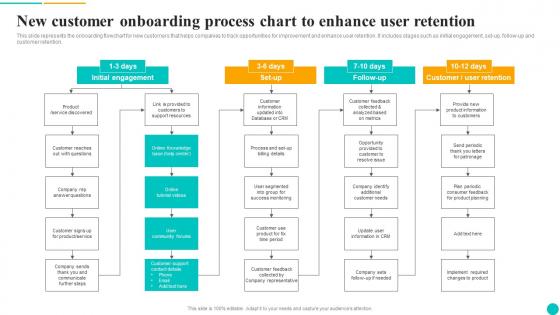
New Customer Onboarding Process Chart To Enhance User Retention Clipart Pdf
This slide represents the onboarding flowchart for new customers that helps companies to track opportunities for improvement and enhance user retention. It includes stages such as initial engagement, set-up, follow-up and customer retention. Showcasing this set of slides titled New Customer Onboarding Process Chart To Enhance User Retention Clipart Pdf. The topics addressed in these templates are Initial Engagement, Follow Up, Customer User Retention. All the content presented in this PPT design is completely editable. Download it and make adjustments in color, background, font etc. as per your unique business setting. This slide represents the onboarding flowchart for new customers that helps companies to track opportunities for improvement and enhance user retention. It includes stages such as initial engagement, set-up, follow-up and customer retention.
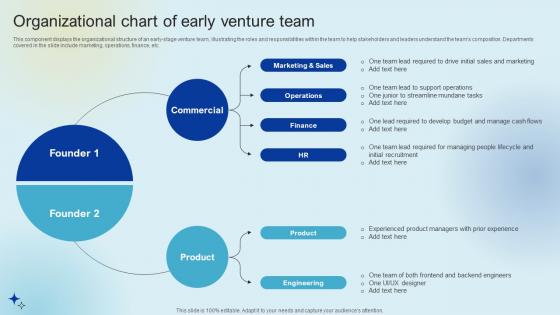
Organizational Chart Of Early Venture Team Raising Venture Capital A Holistic Approach Fin SS V
This component displays the organizational structure of an early-stage venture team, illustrating the roles and responsibilities within the team to help stakeholders and leaders understand the teams composition. Departments covered in the slide include marketing, operations, finance, etc. Find a pre-designed and impeccable Organizational Chart Of Early Venture Team Raising Venture Capital A Holistic Approach Fin SS V. The templates can ace your presentation without additional effort. You can download these easy-to-edit presentation templates to make your presentation stand out from others. So, what are you waiting for. Download the template from Slidegeeks today and give a unique touch to your presentation. This component displays the organizational structure of an early-stage venture team, illustrating the roles and responsibilities within the team to help stakeholders and leaders understand the teams composition. Departments covered in the slide include marketing, operations, finance, etc.
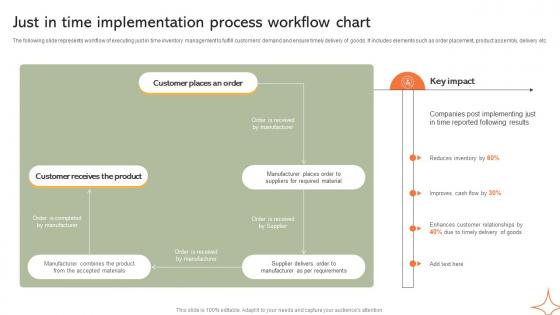
Just In Time Implementation Process Workflow Chart Implementing Manufacturing Strategy SS V
The following slide represents workflow of executing just in time inventory management to fulfill customers demand and ensure timely delivery of goods. It includes elements such as order placement, product assembly, delivery etc. The best PPT templates are a great way to save time, energy, and resources. Slidegeeks have 100 percent editable powerpoint slides making them incredibly versatile. With these quality presentation templates, you can create a captivating and memorable presentation by combining visually appealing slides and effectively communicating your message. Download Just In Time Implementation Process Workflow Chart Implementing Manufacturing Strategy SS V from Slidegeeks and deliver a wonderful presentation. The following slide represents workflow of executing just in time inventory management to fulfill customers demand and ensure timely delivery of goods. It includes elements such as order placement, product assembly, delivery etc.
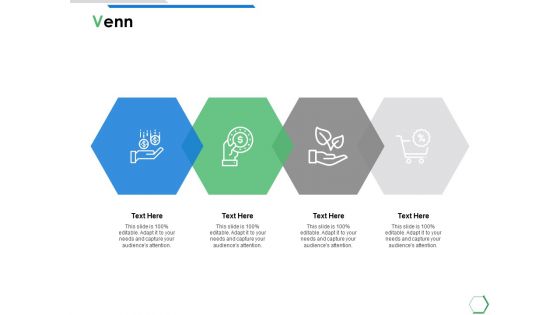
Venn Sales Marleting Ppt PowerPoint Presentation File Templates
Presenting this set of slides with name venn sales marleting ppt powerpoint presentation file templates. This is a three stage process. The stages in this process are venn, sales, marketing, management, analysis. This is a completely editable PowerPoint presentation and is available for immediate download. Download now and impress your audience.
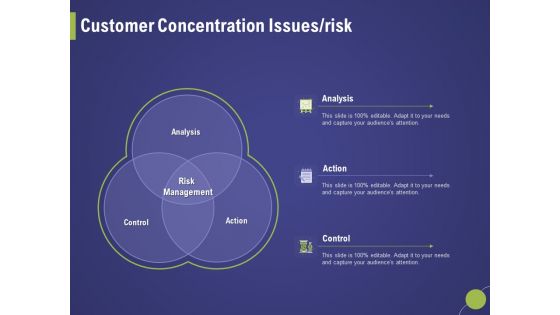
Firm Capability Assessment Customer Concentration Issues Risk Ppt Ideas Sample PDF
Presenting this set of slides with name firm capability assessment customer concentration issues risk ppt ideas sample pdf. This is a three stage process. The stages in this process are analysis, action, control. This is a completely editable PowerPoint presentation and is available for immediate download. Download now and impress your audience.
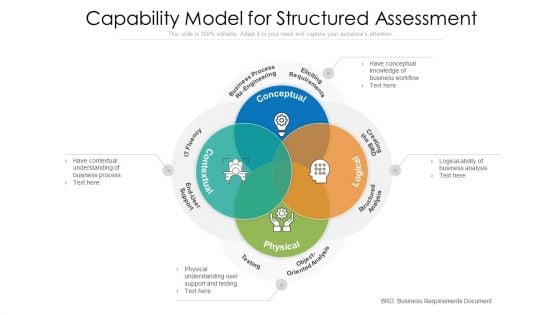
Capability Model For Structured Assessment Ppt Layouts Templates PDF
Persuade your audience using this capability model for structured assessment ppt layouts templates pdf. This PPT design covers four stages, thus making it a great tool to use. It also caters to a variety of topics including business, process, analysis. Download this PPT design now to present a convincing pitch that not only emphasizes the topic but also showcases your presentation skills.
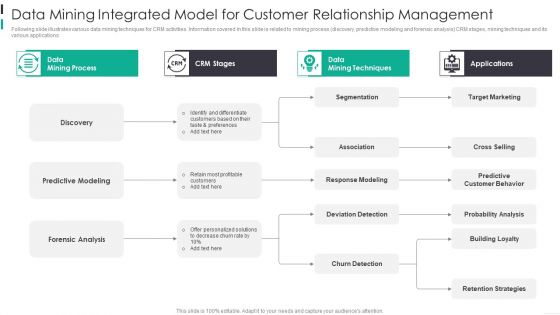
Data Mining Integrated Model For Customer Relationship Management Themes PDF
Following slide illustrates various data mining techniques for CRM activities. Information covered in this slide is related to mining process discovery, predictive modeling and forensic analysis CRM stages, mining techniques and its various applications. Showcasing this set of slides titled Data Mining Integrated Model For Customer Relationship Management Themes PDF The topics addressed in these templates are Predictive Modeling, Forensic Analysis, Response Modeling All the content presented in this PPT design is completely editable. Download it and make adjustments in color, background, font etc. as per your unique business setting.
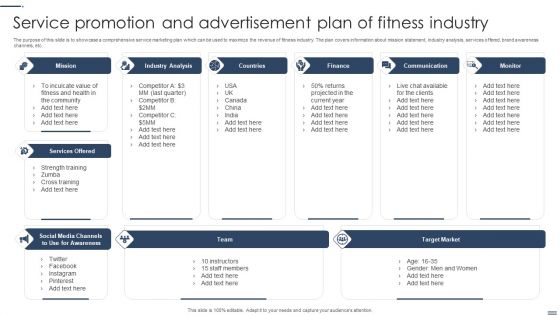
Service Promotion And Advertisement Plan Of Fitness Industry Themes PDF
The purpose of this slide is to showcase a comprehensive service marketing plan which can be used to maximize the revenue of fitness industry. The plan covers information about mission statement, industry analysis, services offered, brand awareness channels, etc. Pitch your topic with ease and precision using this Service Promotion And Advertisement Plan Of Fitness Industry Themes PDF. This layout presents information onIndustry Analysis, Finance, Countries. It is also available for immediate download and adjustment. So, changes can be made in the color, design, graphics or any other component to create a unique layout.
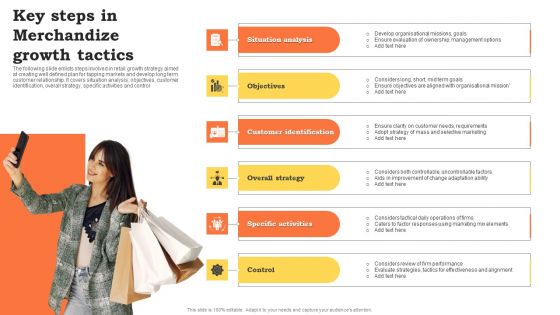
Key Steps In Merchandize Growth Tactics Themes PDF
The following slide enlists steps involved in retail growth strategy aimed at creating well defined plan for tapping markets and develop long term customer relationship. It covers situation analysis, objectives, customer identification, overall strategy, specific activities and control. Showcasing this set of slides titled Key Steps In Merchandize Growth Tactics Themes PDF. The topics addressed in these templates are Situation Analysis, Objectives, Customer Identification . All the content presented in this PPT design is completely editable. Download it and make adjustments in color, background, font etc. as per your unique business setting.

Hierarchy Chart Sample Templates Ppt PowerPoint Presentation Background Designs
This is a hierarchy chart sample templates ppt powerpoint presentation background designs. This is a two stage process. The stages in this process are business, marketing, management, communication, planning.
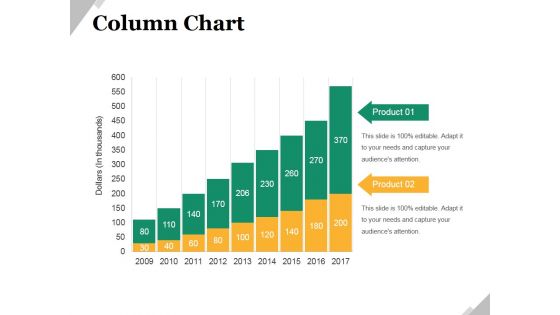
Column Chart Ppt PowerPoint Presentation Infographic Template Graphic Images
This is a column chart ppt powerpoint presentation infographic template graphic images. This is a nine stage process. The stages in this process are business, marketing, growth, product, management.
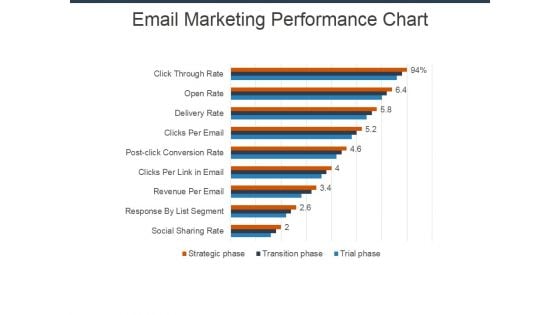
Email Marketing Performance Chart Ppt Powerpoint Presentation Pictures Show
This is a email marketing performance chart ppt powerpoint presentation pictures show. This is a nine stage process. The stages in this process are finance, planning, marketing, business, management, strategy.
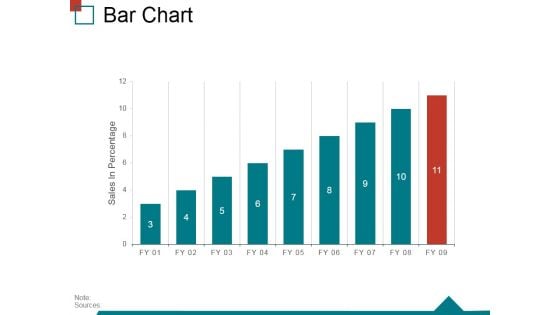
Bar Chart Ppt PowerPoint Presentation Infographic Template Skills
This is a bar chart ppt powerpoint presentation infographic template skills. This is a nine stage process. The stages in this process are sales in percentage, finance, business, marketing, strategy, success.
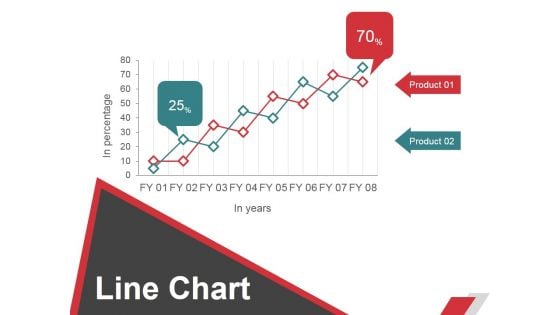
Line Chart Ppt PowerPoint Presentation File Graphic Images
This is a line chart ppt powerpoint presentation file graphic images. This is a two stage process. The stages in this process are business, strategy, marketing, planning, growth strategy, finance.
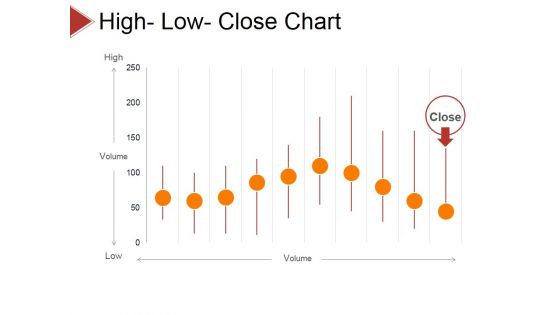
High Low Close Chart Ppt PowerPoint Presentation Layouts Visual Aids
This is a high low close chart ppt powerpoint presentation layouts visual aids. This is a ten stage process. The stages in this process are volume, high, low, close.
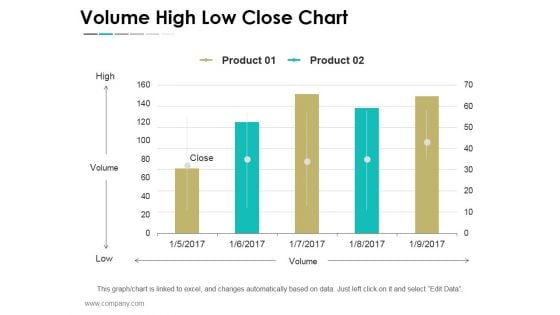
Volume High Low Close Chart Ppt PowerPoint Presentation Show Outfit
This is a volume high low close chart ppt powerpoint presentation show outfit. This is a five stage process. The stages in this process are business, strategy, marketing, success, finance, growth.

Column Chart Ppt PowerPoint Presentation Styles Graphic Tips
This is a column chart ppt powerpoint presentation styles graphic tips. This is a six stage process. The stages in this process are slide bar, business, marketing, strategy, finance.
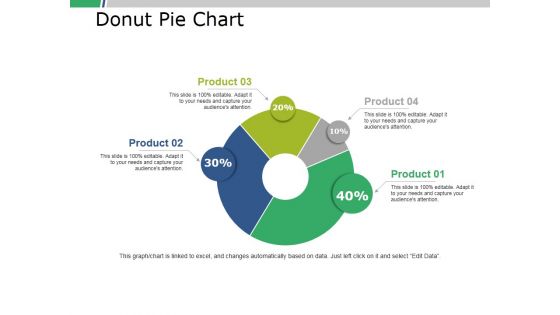
Donut Pie Chart Ppt PowerPoint Presentation Portfolio Slide Download
This is a donut pie chart ppt powerpoint presentation portfolio slide download. This is a four stage process. The stages in this process are business, marketing, finance, percent, donut.
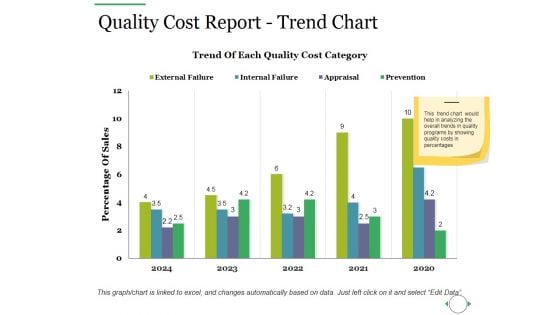
Quality Cost Report Trend Chart Ppt PowerPoint Presentation Outline Guidelines
This is a quality cost report trend chart ppt powerpoint presentation outline guidelines. This is a two stage process. The stages in this process are quality cost, appraisal cost, internal failure cost, external failure cost.
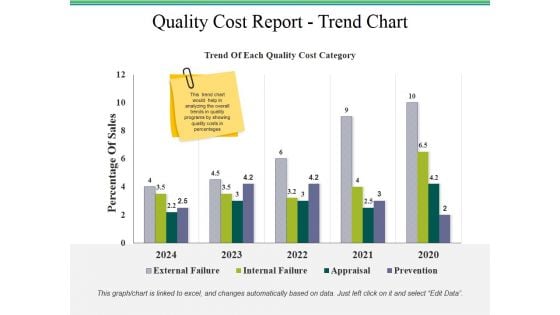
Quality Cost Report Trend Chart Ppt PowerPoint Presentation Styles Templates
This is a quality cost report trend chart ppt powerpoint presentation styles templates. This is a two stage process. The stages in this process are quality cost report, business, finance, marketing, strategy.
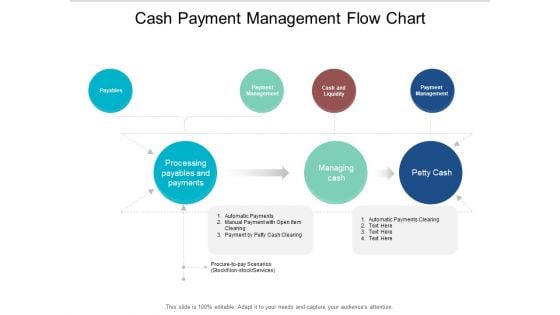
Cash Payment Management Flow Chart Ppt PowerPoint Presentation Styles Professional
This is a cash payment management flow chart ppt powerpoint presentation styles professional. This is a seven stage process. The stages in this process are liquidity, cash assets, solvency.
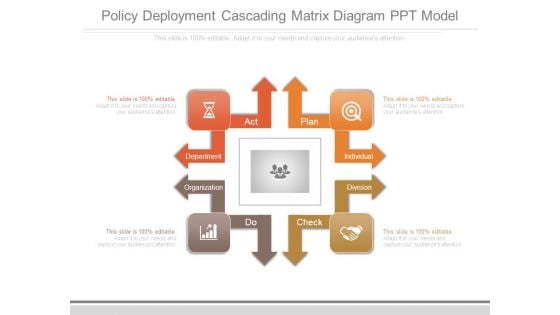
Policy Deployment Cascading Matrix Diagram Ppt Model
This is a policy deployment cascading matrix diagram ppt model. This is a four stage process. The stages in this process are department, organization, do, check, division, individual, plan, act.
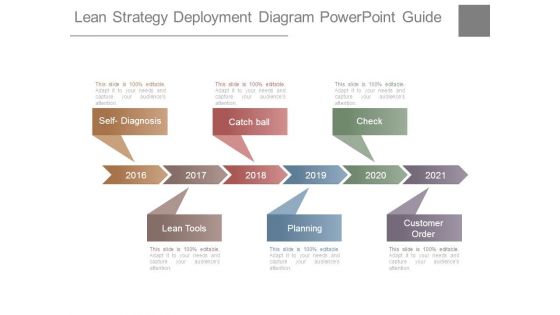
Lean Strategy Deployment Diagram Powerpoint Guide
This is a lean strategy deployment diagram powerpoint guide. This is a six stage process. The stages in this process are self diagnosis, catch ball, check, lean tools, planning, customer order.
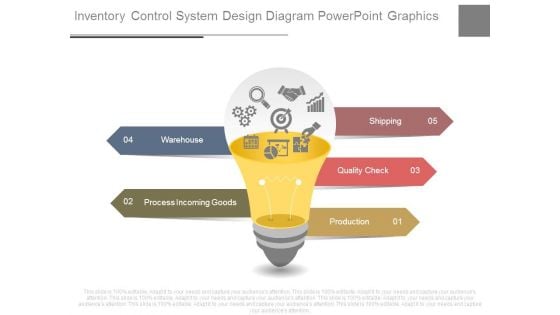
Inventory Control System Design Diagram Powerpoint Graphics
This is a inventory control system design diagram powerpoint graphics. This is a five stage process. The stages in this process are warehouse, process incoming goods, shipping, quality check, production.
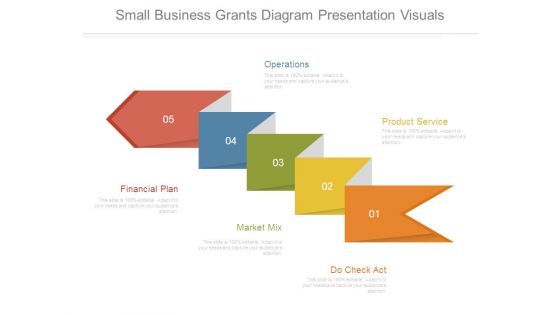
Small Business Grants Diagram Presentation Visuals
This is a small business grants diagram presentation visuals. This is a five stage process. The stages in this process are operations, product service, financial plan, market mix, do check act.
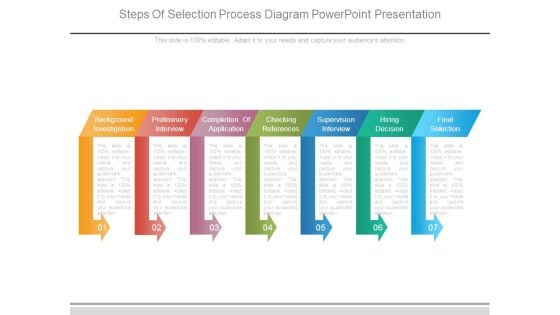
Steps Of Selection Process Diagram Powerpoint Presentation
This is a steps of selection process diagram powerpoint presentation. This is a seven stage process. The stages in this process are background investigation, preliminary interview, completion of application, checking references, supervision interview, hiring decision, final selection.

 Home
Home