Survey Themes
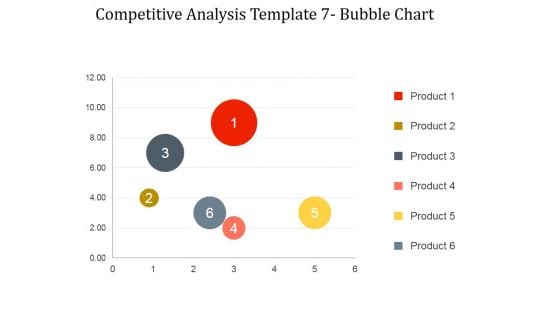
Competitive Analysis Bubble Chart Ppt PowerPoint Presentation Templates
This is a competitive analysis bubble chart ppt powerpoint presentation templates. This is a six stage process. The stages in this process are product, business, management, marketing, strategy.
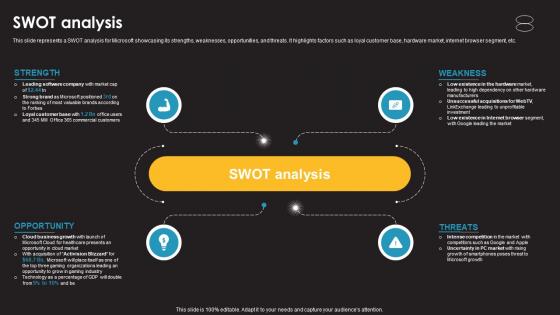
Swot Analysis Information Technology Services Provider Company Profile CP SS V
This slide represents a SWOT analysis for Microsoft showcasing its strengths, weaknesses, opportunities, and threats. It highlights factors such as loyal customer base, hardware market, internet browser segment, etc.Are you searching for a Swot Analysis Information Technology Services Provider Company Profile CP SS V that is uncluttered, straightforward, and original Its easy to edit, and you can change the colors to suit your personal or business branding. For a presentation that expresses how much effort you have put in, this template is ideal With all of its features, including tables, diagrams, statistics, and lists, its perfect for a business plan presentation. Make your ideas more appealing with these professional slides. Download Swot Analysis Information Technology Services Provider Company Profile CP SS V from Slidegeeks today. This slide represents a SWOT analysis for Microsoft showcasing its strengths, weaknesses, opportunities, and threats. It highlights factors such as loyal customer base, hardware market, internet browser segment, etc.
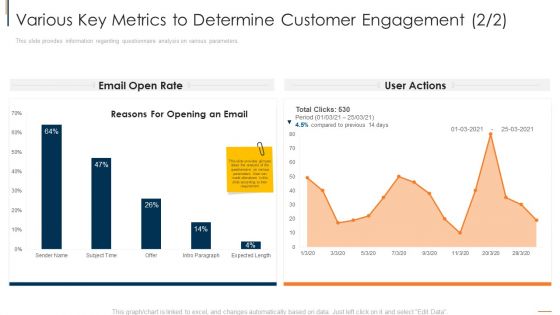
Various Key Metrics To Determine Customer Engagement Rate Download PDF
This slide provides information regarding questionnaire analysis on various parameters. Deliver an awe inspiring pitch with this creative various key metrics to determine customer engagement rate download pdf bundle. Topics like various key metrics to determine customer engagement can be discussed with this completely editable template. It is available for immediate download depending on the needs and requirements of the user.
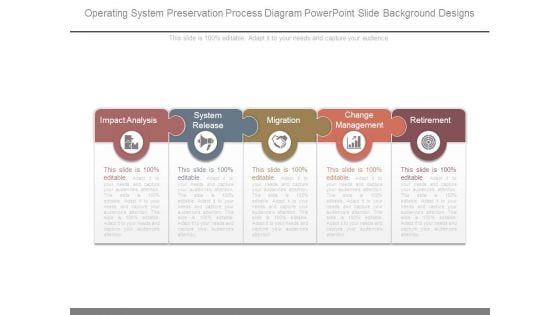
Operating System Preservation Process Diagram Powerpoint Slide Background Designs
This is a operating system preservation process diagram powerpoint slide background designs. This is a five stage process. The stages in this process are impact analysis, system release, migration, change management, retirement.
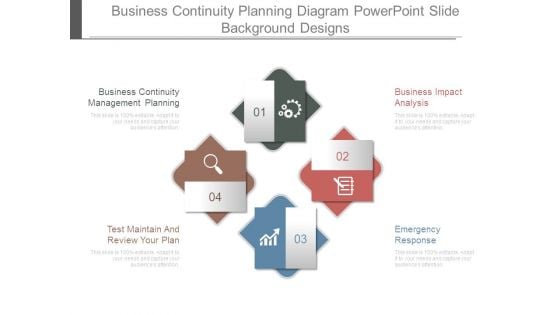
Business Continuity Planning Diagram Powerpoint Slide Background Designs
This is a business continuity planning diagram powerpoint slide background designs. This is a four stage process. The stages in this process are business continuity management planning, test maintain and review your plan, emergency response, business impact analysis.
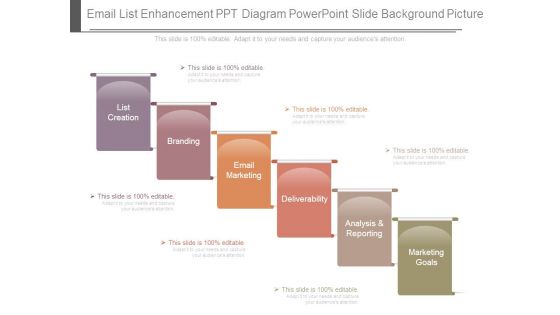
Email List Enhancement Ppt Diagram Powerpoint Slide Background Picture
This is a email list enhancement ppt diagram powerpoint slide background picture. This is a six stage process. The stages in this process are list creation, branding, email marketing, deliverability, analysis and reporting, marketing goals.
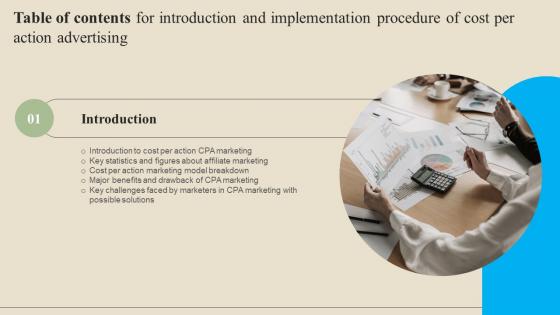
Introduction And Implementation Procedure Of Cost Per Table Of Contents Background Pdf
If you are looking for a format to display your unique thoughts, then the professionally designed Introduction And Implementation Procedure Of Cost Per Table Of Contents Background Pdf is the one for you. You can use it as a Google Slides template or a PowerPoint template. Incorporate impressive visuals, symbols, images, and other charts. Modify or reorganize the text boxes as you desire. Experiment with shade schemes and font pairings. Alter, share or cooperate with other people on your work. Download Introduction And Implementation Procedure Of Cost Per Table Of Contents Background Pdf and find out how to give a successful presentation. Present a perfect display to your team and make your presentation unforgettable. Our Introduction And Implementation Procedure Of Cost Per Table Of Contents Background Pdf are topically designed to provide an attractive backdrop to any subject. Use them to look like a presentation pro.
Use Of Funds Analysis Ppt PowerPoint Presentation Icon Slide Download
Presenting this set of slides with name use of funds analysis ppt powerpoint presentation icon slide download. The topics discussed in these slides are expenditures,service,operating,hodges,equipment. This is a completely editable PowerPoint presentation and is available for immediate download. Download now and impress your audience.
Client Segmentation Analysis Clustered Bar Ppt Icon Brochure PDF
Presenting this set of slides with name client segmentation analysis clustered bar ppt icon brochure pdf. The topics discussed in these slide is clustered bar. This is a completely editable PowerPoint presentation and is available for immediate download. Download now and impress your audience.
Strategy Profitability Balanced Scorecard With Ebita Analysis Icons PDF
Deliver and pitch your topic in the best possible manner with this Strategy Profitability Balanced Scorecard With Ebita Analysis Icons PDF. Use them to share invaluable insights on Related Measures, Target, Key Strategies and impress your audience. This template can be altered and modified as per your expectations. So, grab it now.
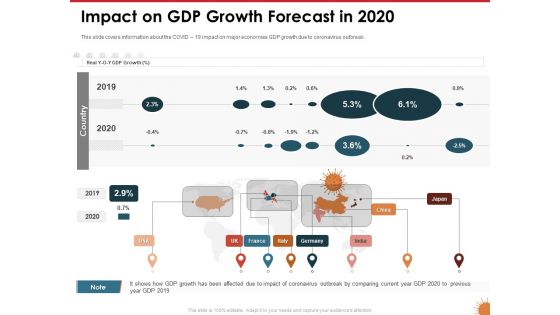
Impact Of COVID 19 On The Hospitality Industry Impact On Gdp Growth Forecast In 2020 Background PDF
Presenting this set of slides with name impact of covid 19 on the hospitality industry impact on gdp growth forecast in 2020 background pdf. This is a six stage process. The stages in this process are growth forecast, 2019, 2020. This is a completely editable PowerPoint presentation and is available for immediate download. Download now and impress your audience.
Consistent Imitation Of Marketing Process Using 6 Stages Network Map PowerPoint Templates
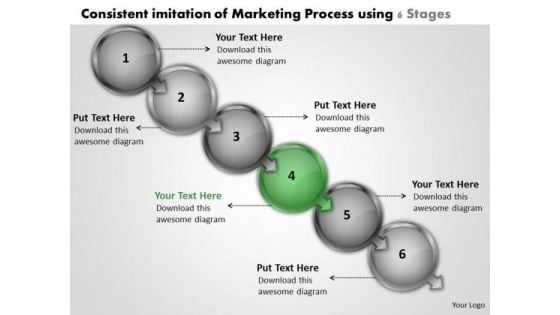
We present our consistent imitation of marketing process using 6 stages network map PowerPoint templates.Use our Arrows PowerPoint Templates because, You have good reasons to back up the strength of your belief. Use our Spheres PowerPoint Templates because, It expound on why you have discarded some plans as you went along to the apex and came out with the final selection which you know will make you and your team shine. Use our Marketing PowerPoint Templates because,They are the tools that helped most of us evolve. Use our Business PowerPoint Templates because,Everybody knows The world over it is a priority for many. Along with it there are so many oppurtunities waiting to be utilised Use our Abstract PowerPoint Templates because,You can asked to strive to give true form to your great dream.Use these PowerPoint slides for presentations relating to Arrow, Art, Assess, Blue, Business, Chart, Chevron, Clip, Clipart, Colorful, Compliance, Corporate, Design, Development, Diagram, Flow, Glossy, Graphic, Hierarchy, Icon, Illustration, Implement, Infographic, Levels, Marketing, Modern, Plan, Process, Shape, Shiny, Square, Stages, Vector. The prominent colors used in the PowerPoint template are Green, Gray, Black Concentrate on the important stuff with our Consistent Imitation Of Marketing Process Using 6 Stages Network Map PowerPoint Templates. You will come out on top.
Donut Pie Chart Investment Analysis Ppt PowerPoint Presentation Gallery Introduction
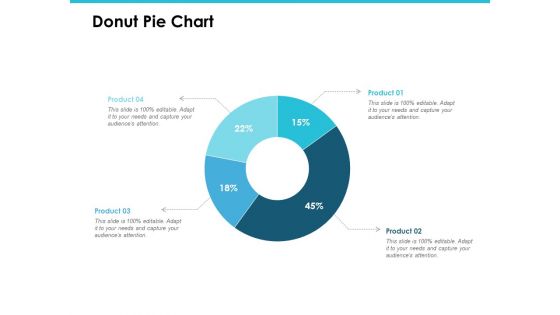
This is a donut pie chart investment analysis ppt powerpoint presentation gallery introduction. This is a four stage process. The stages in this process are finance, marketing, management, investment, analysis.
Column Chart Finance Ppt Powerpoint Presentation Infographic Template Icon
This is a column chart finance ppt powerpoint presentation infographic template icon. This is a three stage process. The stages in this process are finance, marketing, management, investment, analysis.
Clustered Bar Chart Marketing Ppt PowerPoint Presentation Layouts Icon
This is a clustered bar chart marketing ppt powerpoint presentation layouts icon. This is a four stage process. The stages in this process are finance, marketing, analysis, business, investment.
Donut Pie Chart Marketing Ppt PowerPoint Presentation Infographic Template Icon
This is a donut pie chart marketing ppt powerpoint presentation infographic template icon. This is a five stage process. The stages in this process are finance, marketing, analysis, business, investment.
Bar Chart Finance Marketing Ppt PowerPoint Presentation Icon Display
This is a bar chart finance marketing ppt powerpoint presentation icon display. This is a three stage process. The stages in this process are finance, analysis, business, investment, marketing.
Column Chart Marketing Management Ppt PowerPoint Presentation Infographic Template Icon
This is a column chart marketing management ppt powerpoint presentation infographic template icon. This is a two stage process. The stages in this process are finance, marketing, management, investment, analysis.
Business Diagram Examples PowerPoint Presentations Process Chart Templates
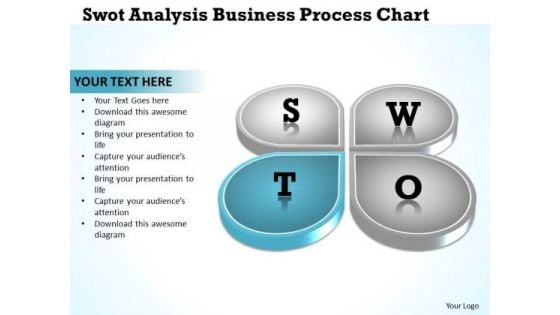
We present our business diagram examples powerpoint presentations process chart templates.Download our Advertising PowerPoint Templates because you can Adorn them with your ideas and thoughts. Download our Business PowerPoint Templates because maximising sales of your product is the intended destination. Use our Marketing PowerPoint Templates because The marketplace is the merger of your dreams and your ability. Download our Finance PowerPoint Templates because you have a handle on all the targets, a master of the game, the experienced and consummate juggler. Present our Shapes PowerPoint Templates because this is Aesthetically designed to make a great first impression this template highlights .Use these PowerPoint slides for presentations relating to Analysis, Business, Concept, Design, Diagram, Direction, Goals, Guide, Icon, Idea, Management, Model, Opportunity, Organization, Performance, Plan, Process, Project, Representation, Resource, Strategy, Swot. The prominent colors used in the PowerPoint template are Blue, Black, Gray. PowerPoint presentation experts tell us our business diagram examples powerpoint presentations process chart templates are Efficacious. Professionals tell us our Diagram PowerPoint templates and PPT Slides are Endearing. People tell us our business diagram examples powerpoint presentations process chart templates provide great value for your money. Be assured of finding the best projection to highlight your words. We assure you our Diagram PowerPoint templates and PPT Slides are Attractive. PowerPoint presentation experts tell us our business diagram examples powerpoint presentations process chart templates are Graceful. Professionals tell us our Direction PowerPoint templates and PPT Slides are Splendid. Make our Business Diagram Examples PowerPoint Presentations Process Chart Templates your calling card. Your thoughts will find open doors.
Introduction To Switched Memory Access Ppt PowerPoint Presentation Diagram Graph Charts PDF
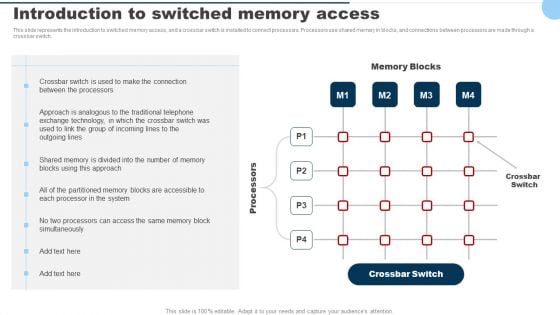
This slide represents the introduction to switched memory access, and a crossbar switch is installed to connect processors. Processors use shared memory in blocks, and connections between processors are made through a crossbar switch. Coming up with a presentation necessitates that the majority of the effort goes into the content and the message you intend to convey. The visuals of a PowerPoint presentation can only be effective if it supplements and supports the story that is being told. Keeping this in mind our experts created Introduction To Switched Memory Access Ppt PowerPoint Presentation Diagram Graph Charts PDF to reduce the time that goes into designing the presentation. This way, you can concentrate on the message while our designers take care of providing you with the right template for the situation.
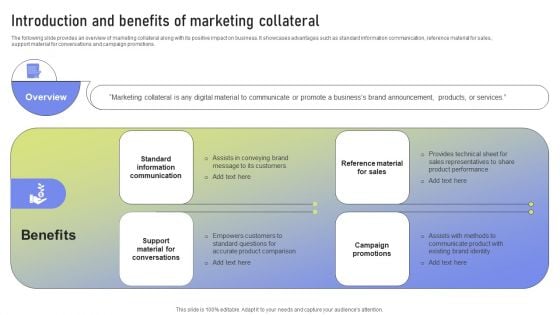
Introduction And Benefits Of Marketing Collateral Ppt PowerPoint Presentation Diagram Graph Charts PDF
The following slide provides an overview of marketing collateral along with its positive impact on business. It showcases advantages such as standard information communication, reference material for sales, support material for conversations and campaign promotions. Present like a pro with Introduction And Benefits Of Marketing Collateral Ppt PowerPoint Presentation Diagram Graph Charts PDF Create beautiful presentations together with your team, using our easy to use presentation slides. Share your ideas in real time and make changes on the fly by downloading our templates. So whether you are in the office, on the go, or in a remote location, you can stay in sync with your team and present your ideas with confidence. With Slidegeeks presentation got a whole lot easier. Grab these presentations today.
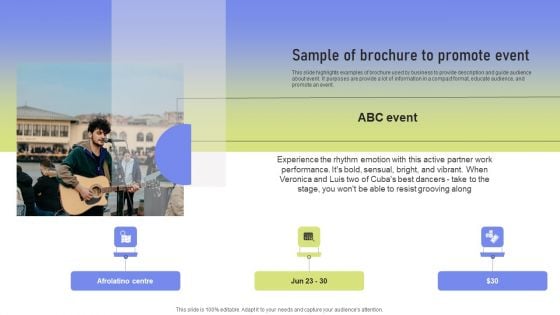
Sample Of Brochure To Promote Event Ppt PowerPoint Presentation Diagram Graph Charts PDF
This slide highlights examples of brochure used by business to provide description and guide audience about event. It purposes are provide a lot of information in a compact format, educate audience, and promote an event. This Sample Of Brochure To Promote Event Ppt PowerPoint Presentation Diagram Graph Charts PDF from Slidegeeks makes it easy to present information on your topic with precision. It provides customization options, so you can make changes to the colors, design, graphics, or any other component to create a unique layout. It is also available for immediate download, so you can begin using it right away. Slidegeeks has done good research to ensure that you have everything you need to make your presentation stand out. Make a name out there for a brilliant performance.
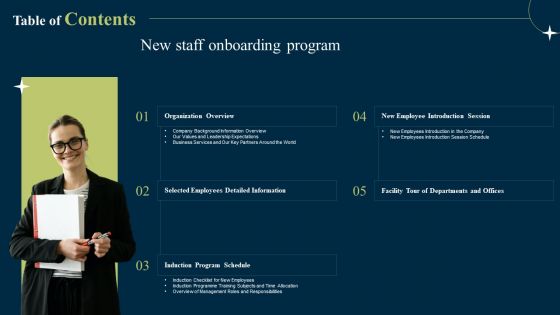
Table Of Contents New Staff Onboarding Program Diagrams PDF
Are you searching for a Table Of Contents New Staff Onboarding Program Diagrams PDF that is uncluttered, straightforward, and original Its easy to edit, and you can change the colors to suit your personal or business branding. For a presentation that expresses how much effort you have put in, this template is ideal With all of its features, including tables, diagrams, statistics, and lists, its perfect for a business plan presentation. Make your ideas more appealing with these professional slides. Download Table Of Contents New Staff Onboarding Program Diagrams PDF from Slidegeeks today.
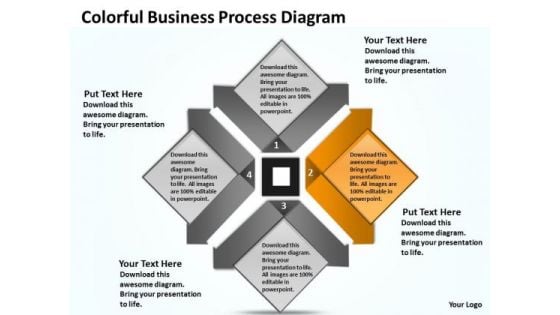
Business Plan Diagram Presentation Process Templates 2007 PowerPoint
We present our business plan diagram presentation process templates 2007 PowerPoint.Download and present our Process and Flows PowerPoint Templates because Our PowerPoint Templates and Slides will let you Leave a lasting impression to your audiences. They possess an inherent longstanding recall factor. Download and present our Flow Charts PowerPoint Templates because Our PowerPoint Templates and Slides are conceived by a dedicated team. Use them and give form to your wondrous ideas. Download and present our Business PowerPoint Templates because You have the co-ordinates for your destination of success. Let our PowerPoint Templates and Slides map out your journey. Download and present our Marketing PowerPoint Templates because Our PowerPoint Templates and Slides are aesthetically designed to attract attention. We gaurantee that they will grab all the eyeballs you need. Download our Shapes PowerPoint Templates because Our PowerPoint Templates and Slides are specially created by a professional team with vast experience. They diligently strive to come up with the right vehicle for your brilliant Ideas. Use these PowerPoint slides for presentations relating to Business, catalog, chart, demonstration, description, design, diagram, five, futuristic, green, illustration, information, interface, internet, level, list, marketing, model, multiple, navigation, network, pattern, pie, presentation, registry, report, section, space, sphere, statement, statistics, steps, structure, target. The prominent colors used in the PowerPoint template are Orange, Gray, White. People tell us our business plan diagram presentation process templates 2007 PowerPoint are incredible easy to use. PowerPoint presentation experts tell us our description PowerPoint templates and PPT Slides help you meet deadlines which are an element of today's workplace. Just browse and pick the slides that appeal to your intuitive senses. Presenters tell us our business plan diagram presentation process templates 2007 PowerPoint will save the presenter time. Use our chart PowerPoint templates and PPT Slides have awesome images to get your point across. Customers tell us our business plan diagram presentation process templates 2007 PowerPoint are designed to make your presentations professional. People tell us our design PowerPoint templates and PPT Slides effectively help you save your valuable time. Acquire the fame you deserve. Our Business Plan Diagram Presentation Process Templates 2007 PowerPoint will aid you to achieve acclaim.
Digital Marketing Campaign Training And Development Icon Template PDF
Persuade your audience using this Digital Marketing Campaign Training And Development Icon Template PDF. This PPT design covers three stages, thus making it a great tool to use. It also caters to a variety of topics including Digital Marketing, Team, Training And Development, Program Checklist. Download this PPT design now to present a convincing pitch that not only emphasizes the topic but also showcases your presentation skills.
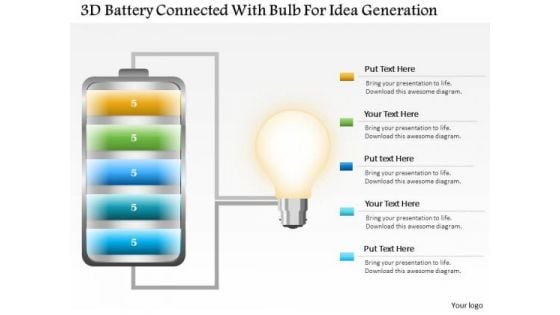
Business Diagram 3d Battery Connected With Bulb For Idea Generation PowerPoint Slide
This business slide displays battery icon connected with bulb. This diagram is a data visualization tool that gives you a simple way to present statistical information. This slide helps your audience examine and interpret the data you present.
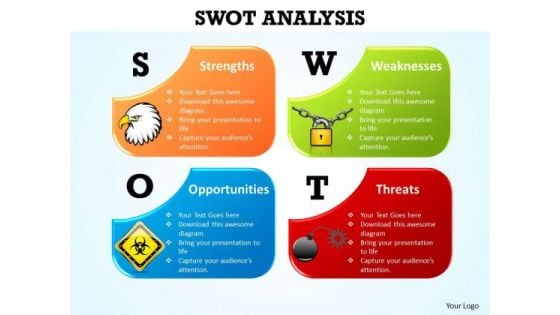
Consulting Diagram Swot Analysis Strategic Management
Your Listeners Will Never Doodle. Our Consulting Diagram Swot Analysis Strategic Management Powerpoint Templates Will Hold Their Concentration.
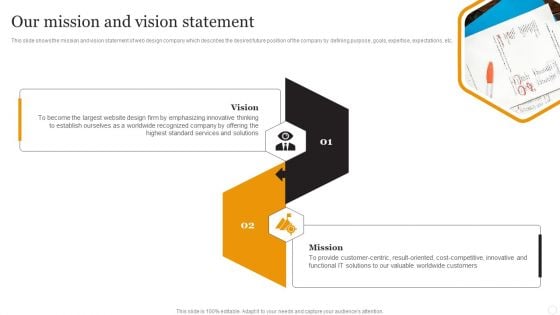
Website Designing Solutions Company Profile Our Mission And Vision Statement Microsoft PDF
This slide shows the mission and vision statement of web design company which describes the desired future position of the company by defining purpose, goals, expertise, expectations, etc. Are you searching for a Website Designing Solutions Company Profile Our Mission And Vision Statement Microsoft PDF that is uncluttered, straightforward, and original Its easy to edit, and you can change the colors to suit your personal or business branding. For a presentation that expresses how much effort youve put in, this template is ideal With all of its features, including tables, diagrams, statistics, and lists, its perfect for a business plan presentation. Make your ideas more appealing with these professional slides. Download Website Designing Solutions Company Profile Our Mission And Vision Statement Microsoft PDF from Slidegeeks today.
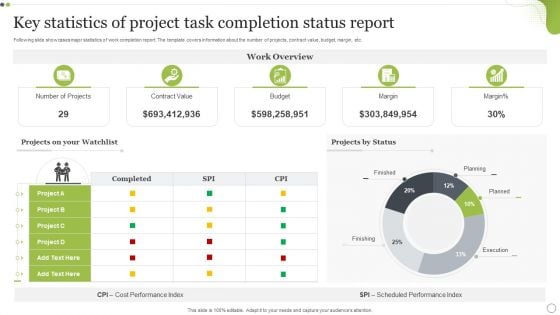
Key Statistics Of Project Task Completion Status Report Mockup PDF
Following slide showcases major statistics of work completion report. The template covers information about the number of projects, contract value, budget, margin, etc. Showcasing this set of slides titled Key Statistics Of Project Task Completion Status Report Mockup PDF. The topics addressed in these templates are Contract Value, Planning, Performance. All the content presented in this PPT design is completely editable. Download it and make adjustments in color, background, font etc. as per your unique business setting.
Organic Keywords Analysis SEO Dashboard Efficient Plan For Conducting Competitor Diagrams Pdf
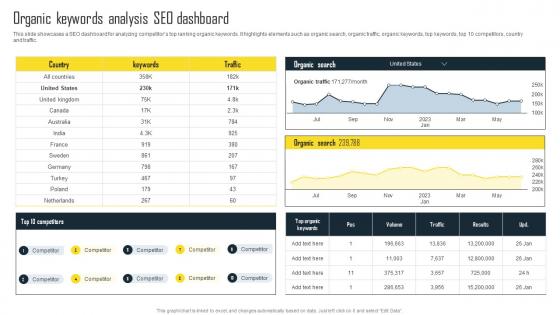
This slide showcases a SEO dashboard for analyzing competitors top ranking organic keywords. It highlights elements such as organic search, organic traffic, organic keywords, top keywords, top 10 competitors, country and traffic. Want to ace your presentation in front of a live audience Our Organic Keywords Analysis SEO Dashboard Efficient Plan For Conducting Competitor Diagrams Pdf can help you do that by engaging all the users towards you. Slidegeeks experts have put their efforts and expertise into creating these impeccable powerpoint presentations so that you can communicate your ideas clearly. Moreover, all the templates are customizable, and easy-to-edit and downloadable. Use these for both personal and commercial use. This slide showcases a SEO dashboard for analyzing competitors top ranking organic keywords. It highlights elements such as organic search, organic traffic, organic keywords, top keywords, top 10 competitors, country and traffic.
Cost Analysis For Sales And Marketing Strategies Efficient Marketing Tactics Diagrams Pdf
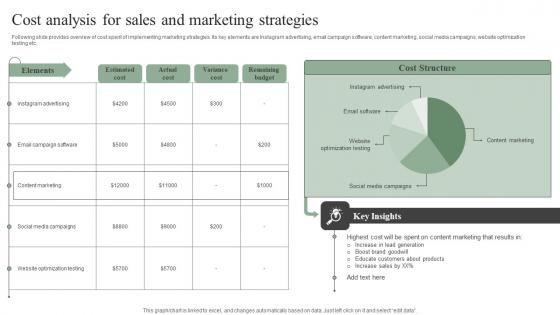
Following slide provides overview of cost spent of implementing marketing strategies. Its key elements are Instagram advertising, email campaign software, content marketing, social media campaigns, website optimization testing etc. From laying roadmaps to briefing everything in detail, our templates are perfect for you. You can set the stage with your presentation slides. All you have to do is download these easy-to-edit and customizable templates. Cost Analysis For Sales And Marketing Strategies Efficient Marketing Tactics Diagrams Pdf will help you deliver an outstanding performance that everyone would remember and praise you for. Do download this presentation today. Following slide provides overview of cost spent of implementing marketing strategies. Its key elements are Instagram advertising, email campaign software, content marketing, social media campaigns, website optimization testing etc.
Content Gap Analysis For E Commerce Staff Skills Icons PDF
The slide inculcates gap analysis for content team to formulate effective ,marketing strategies for e commerce business. Various types of content included are audio content, email content, blog content, case study, etc. Pitch your topic with ease and precision using this Content Gap Analysis For E Commerce Staff Skills Icons PDF. This layout presents information on Audio Content, Email Content, Blog Content. It is also available for immediate download and adjustment. So, changes can be made in the color, design, graphics or any other component to create a unique layout.
Comparative Analysis For Manual And Automation Testing Lifecycle Icons PDF
This slide showcases graphical report to compare test expenses from manual and automated testing cycles over the years. It further includes details about benefits that can be derived from test automation cycle. Pitch your topic with ease and precision using this Comparative Analysis For Manual And Automation Testing Lifecycle Icons PDF. This layout presents information on Comparative Analysis For Manual, Automation Testing Lifecycle. It is also available for immediate download and adjustment. So, changes can be made in the color, design, graphics or any other component to create a unique layout.
Bar Graph Chart For Showing Performance Analysis Ppt Design
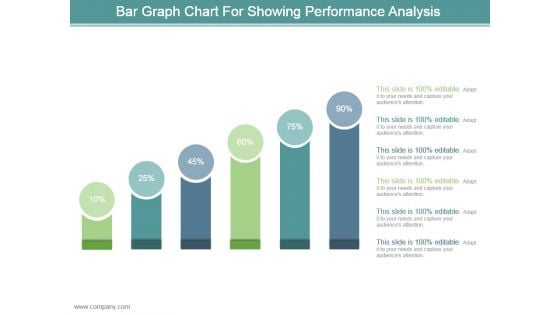
This is a bar graph chart for showing performance analysis ppt design. This is a six stage process. The stages in this process are business, marketing, process, success, presentation.
5 Years Profit And Loss Comparative Analysis Chart Of Enterprise Ppt Icon Graphics PDF
This slide represents the comparison of profit and loss of an organization for the five years. It includes details related to profit and loss from various accounts such as order fees, concession income, facility rental etc. Pitch your topic with ease and precision using this 5 Years Profit And Loss Comparative Analysis Chart Of Enterprise Ppt Icon Graphics PDF. This layout presents information on Account, 2018 To 2022, Exchange Fees. It is also available for immediate download and adjustment. So, changes can be made in the color, design, graphics or any other component to create a unique layout.
Competitive Analysis Matrix Chart Ppt PowerPoint Presentation Inspiration
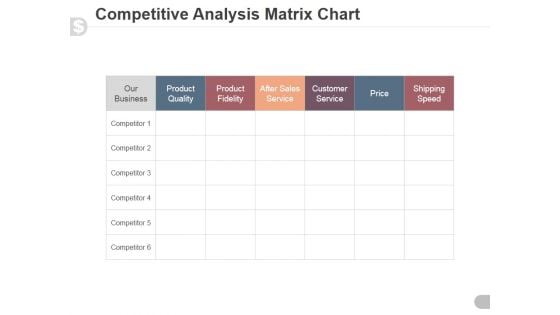
This is a competitive analysis matrix chart ppt powerpoint presentation inspiration. This is a six stage process. The stages in this process are product quality, product fidelity, after sales service, customer service, price, shipping speed.
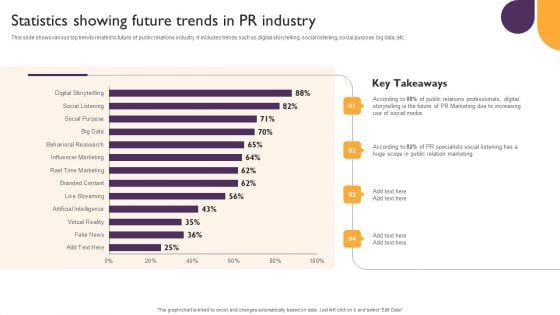
Public Relations Guide To Enhance Brand Credibility Statistics Showing Future Trends In PR Industry Ideas PDF
This slide shows various top trends related to future of public relations industry, It includes trends such as digital story telling, social listening, social purpose, big data, etc. This Public Relations Guide To Enhance Brand Credibility Statistics Showing Future Trends In PR Industry Ideas PDF from Slidegeeks makes it easy to present information on your topic with precision. It provides customization options, so you can make changes to the colors, design, graphics, or any other component to create a unique layout. It is also available for immediate download, so you can begin using it right away. Slidegeeks has done good research to ensure that you have everything you need to make your presentation stand out. Make a name out there for a brilliant performance.
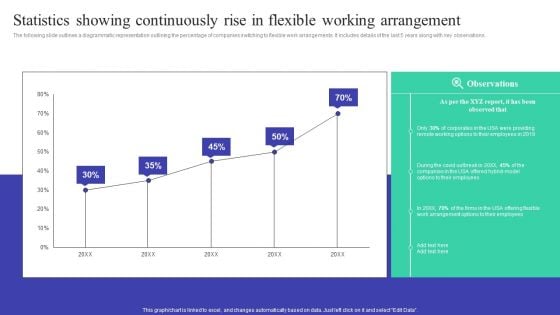
Implementing Adaptive Work Arrangements Statistics Showing Continuously Rise In Flexible Working Arrangement Information PDF
The following slide outlines a diagrammatic representation outlining the percentage of companies switching to flexible work arrangements. It includes details of the last 5 years along with key observations. This Implementing Adaptive Work Arrangements Statistics Showing Continuously Rise In Flexible Working Arrangement Information PDF from Slidegeeks makes it easy to present information on your topic with precision. It provides customization options, so you can make changes to the colors, design, graphics, or any other component to create a unique layout. It is also available for immediate download, so you can begin using it right away. Slidegeeks has done good research to ensure that you have everything you need to make your presentation stand out. Make a name out there for a brilliant performance.
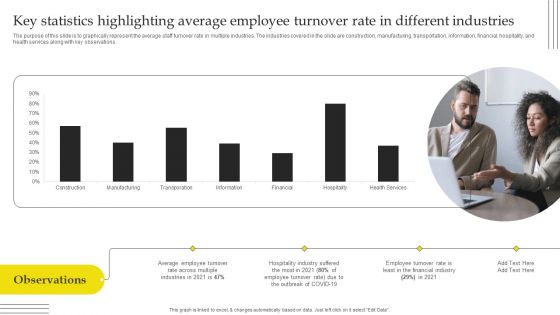
Effective Strategies For Retaining Healthcare Staff Key Statistics Highlighting Average Employee Turnover Rate Brochure PDF
The purpose of this slide is to graphically represent the average staff turnover rate in multiple industries. The industries covered in the slide are construction, manufacturing, transportation, information, financial, hospitality, and health services along with key observations. Want to ace your presentation in front of a live audience Our Effective Strategies For Retaining Healthcare Staff Key Statistics Highlighting Average Employee Turnover Rate Brochure PDF can help you do that by engaging all the users towards you. Slidegeeks experts have put their efforts and expertise into creating these impeccable powerpoint presentations so that you can communicate your ideas clearly. Moreover, all the templates are customizable, and easy to edit and downloadable. Use these for both personal and commercial use.
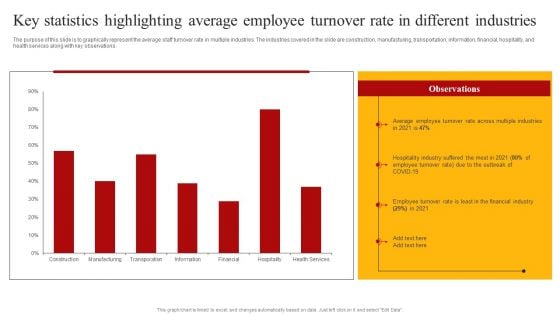
Staff Retention Techniques To Minimize Hiring Expenses Key Statistics Highlighting Average Employee Turnover Clipart PDF
The purpose of this slide is to graphically represent the average staff turnover rate in multiple industries. The industries covered in the slide are construction, manufacturing, transportation, information, financial, hospitality, and health services along with key observations. Want to ace your presentation in front of a live audience Our Staff Retention Techniques To Minimize Hiring Expenses Key Statistics Highlighting Average Employee Turnover Clipart PDF can help you do that by engaging all the users towards you. Slidegeeks experts have put their efforts and expertise into creating these impeccable powerpoint presentations so that you can communicate your ideas clearly. Moreover, all the templates are customizable, and easy to edit and downloadable. Use these for both personal and commercial use.
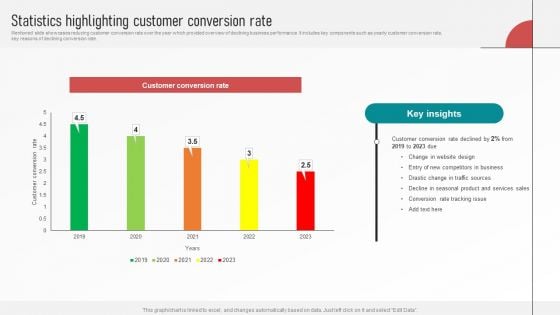
Customer Retention With Email Advertising Campaign Plan Statistics Highlighting Customer Conversion Rate Demonstration PDF
Mentioned slide showcases reducing customer conversion rate over the year which provided overview of declining business performance. It includes key components such as yearly customer conversion rate, key reasons of declining conversion rate. This modern and well arranged Customer Retention With Email Advertising Campaign Plan Statistics Highlighting Customer Conversion Rate Demonstration PDF provides lots of creative possibilities. It is very simple to customize and edit with the Powerpoint Software. Just drag and drop your pictures into the shapes. All facets of this template can be edited with Powerpoint no extra software is necessary. Add your own material, put your images in the places assigned for them, adjust the colors, and then you can show your slides to the world, with an animated slide included.
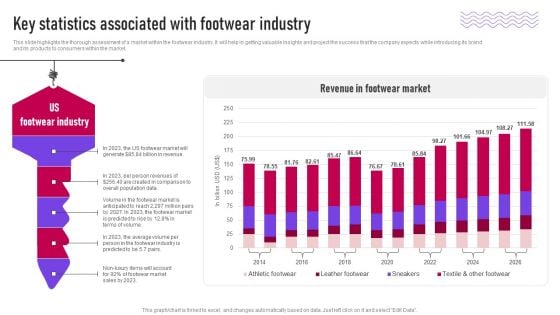
Key Statistics Associated With Footwear Industry Ppt Pictures Graphic Tips PDF
This slide highlights the thorough assessment of a market within the footwear industry. It will help in getting valuable insights and project the success that the company expects while introducing its brand and its products to consumers within the market. Present like a pro with Key Statistics Associated With Footwear Industry Ppt Pictures Graphic Tips PDF Create beautiful presentations together with your team, using our easy to use presentation slides. Share your ideas in real time and make changes on the fly by downloading our templates. So whether you are in the office, on the go, or in a remote location, you can stay in sync with your team and present your ideas with confidence. With Slidegeeks presentation got a whole lot easier. Grab these presentations today.
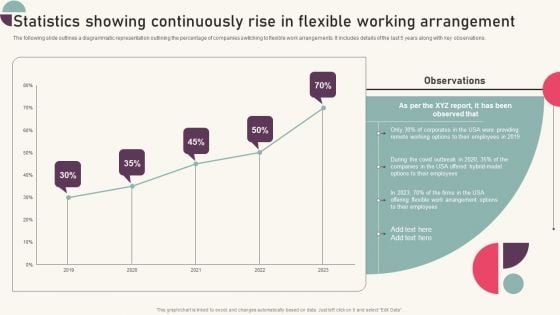
Tactics For Establishing Sustainable Hybrid Work Environment Statistics Showing Continuously Rise In Flexible Formats PDF
The following slide outlines a diagrammatic representation outlining the percentage of companies switching to flexible work arrangements. It includes details of the last 5 years along with key observations. Slidegeeks is one of the best resources for PowerPoint templates. You can download easily and regulate Tactics For Establishing Sustainable Hybrid Work Environment Statistics Showing Continuously Rise In Flexible Formats PDF for your personal presentations from our wonderful collection. A few clicks is all it takes to discover and get the most relevant and appropriate templates. Use our Templates to add a unique zing and appeal to your presentation and meetings. All the slides are easy to edit and you can use them even for advertisement purposes.
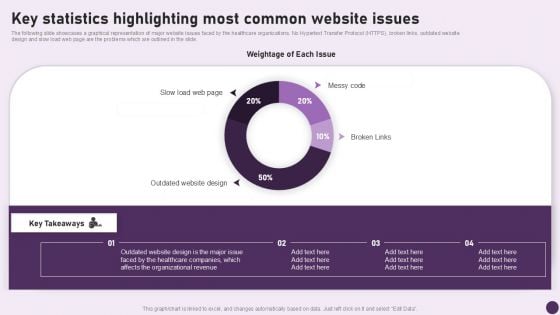
Guide To Healthcare Services Administration Key Statistics Highlighting Most Common Website Issues Introduction PDF
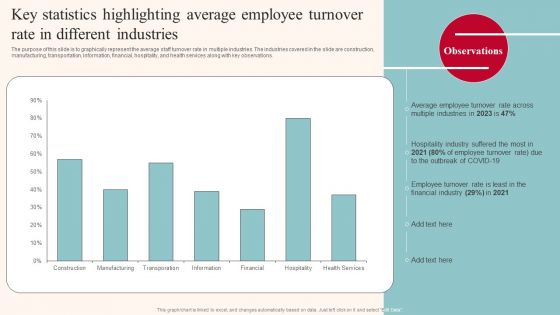
Key Statistics Highlighting Average Employee Turnover Rate In Different Industries Infographics PDF
The purpose of this slide is to graphically represent the average staff turnover rate in multiple industries. The industries covered in the slide are construction, manufacturing, transportation, information, financial, hospitality, and health services along with key observations. Want to ace your presentation in front of a live audience Our Key Statistics Highlighting Average Employee Turnover Rate In Different Industries Infographics PDF can help you do that by engaging all the users towards you. Slidegeeks experts have put their efforts and expertise into creating these impeccable powerpoint presentations so that you can communicate your ideas clearly. Moreover, all the templates are customizable, and easy to edit and downloadable. Use these for both personal and commercial use.
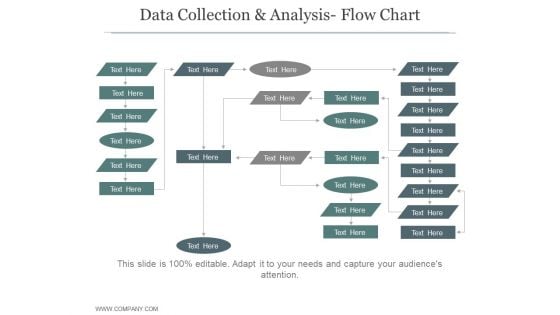
Data Collection And Analysis Flow Chart Ppt PowerPoint Presentation Sample
This is a data collection and analysis flow chart ppt powerpoint presentation sample. This is a five stage process. The stages in this process are business, strategy, marketing, process, growth strategy, finance.
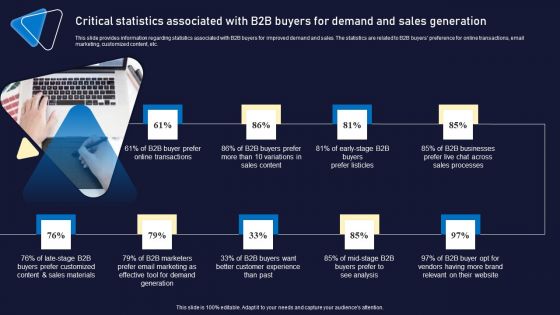
Critical Statistics Associated With B2B Buyers For Demand And Sales Generation Background PDF
This slide provides information regarding statistics associated with B2B buyers for improved demand and sales. The statistics are related to B2B buyers preference for online transactions, email marketing, customized content, etc. The best PPT templates are a great way to save time, energy, and resources. Slidegeeks have 100 percent editable powerpoint slides making them incredibly versatile. With these quality presentation templates, you can create a captivating and memorable presentation by combining visually appealing slides and effectively communicating your message. Download Critical Statistics Associated With B2B Buyers For Demand And Sales Generation Background PDF from Slidegeeks and deliver a wonderful presentation.
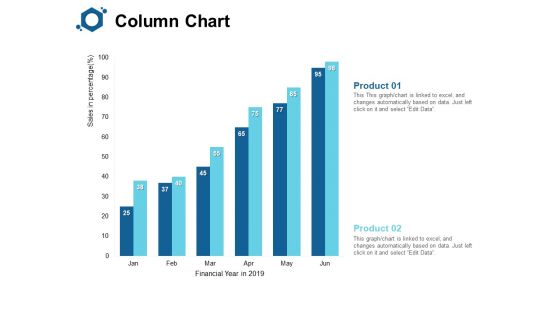
Column Chart Analysis Ppt PowerPoint Presentation Pictures Sample
Presenting this set of slides with name column chart analysis ppt powerpoint presentation pictures sample. The topics discussed in these slides are column chart, product, financial year, sales, marketing. This is a completely editable PowerPoint presentation and is available for immediate download. Download now and impress your audience.
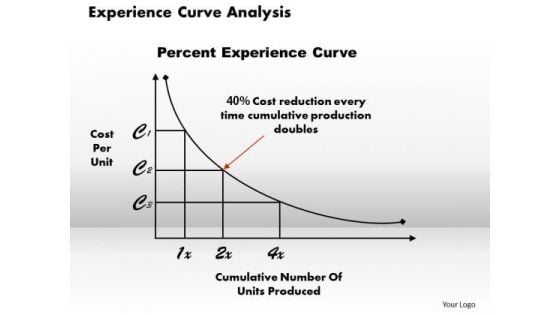
Business Framework Experience Curve Analysis PowerPoint Presentation
A two way linear curve has been used to design this PPT diagram. This business framework contains the concept of curve analysis and management. Use this PPT diagram for your business and management related topics.
Business People Pictures Man With Arrow Bar Graph PowerPoint Templates Ppt Backgrounds For Slides
We present our business people pictures man with arrow bar graph PowerPoint templates PPT backgrounds for slides.Use our Arrows PowerPoint Templates because Our PowerPoint Templates and Slides offer you the needful to organise your thoughts. Use them to list out your views in a logical sequence. Download and present our Process and Flows PowerPoint Templates because you can Set pulses racing with our PowerPoint Templates and Slides. They will raise the expectations of your team. Use our Business PowerPoint Templates because you can Add colour to your speech with our PowerPoint Templates and Slides. Your presentation will leave your audience speechless. Use our Marketing PowerPoint Templates because Our PowerPoint Templates and Slides are designed to help you succeed. They have all the ingredients you need. Use our Shapes PowerPoint Templates because You should Throw the gauntlet with our PowerPoint Templates and Slides. They are created to take up any challenge.Use these PowerPoint slides for presentations relating to 3d, abstract, arrow, background, bar, blue, business, businessman, character,chart, climbing, company, competition, concept, corporate, design, diagram,economy, figure, finance, goal, graph, graphic, growing, growth, idea, illustration,income, isolated, man, manager, market, people, person, profit, progress,reflection, render, run, statistic, succeed, success, white, winner. The prominent colors used in the PowerPoint template are Black, White, Yellow. Professionals tell us our business people pictures man with arrow bar graph PowerPoint templates PPT backgrounds for slides will generate and maintain the level of interest you desire. They will create the impression you want to imprint on your audience. People tell us our arrow PowerPoint templates and PPT Slides provide you with a vast range of viable options. Select the appropriate ones and just fill in your text. We assure you our business people pictures man with arrow bar graph PowerPoint templates PPT backgrounds for slides will make the presenter successul in his career/life. Presenters tell us our character PowerPoint templates and PPT Slides are incredible easy to use. We assure you our business people pictures man with arrow bar graph PowerPoint templates PPT backgrounds for slides are designed to make your presentations professional. PowerPoint presentation experts tell us our business PowerPoint templates and PPT Slides are specially created by a professional team with vast experience. They diligently strive to come up with the right vehicle for your brilliant Ideas. Give good counsel with our Business People Pictures Man With Arrow Bar Graph PowerPoint Templates Ppt Backgrounds For Slides. Your thoughts will show your compassion.
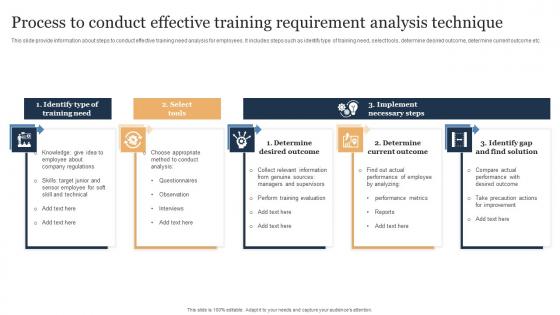
Process To Conduct Effective Training Requirement Analysis Technique Graphics Pdf
This slide provide information about steps to conduct effective training need analysis for employees. It includes steps such as identify type of training need, select tools, determine desired outcome, determine current outcome etc. Showcasing this set of slides titled Process To Conduct Effective Training Requirement Analysis Technique Graphics Pdf. The topics addressed in these templates are Training Requirement, Analysis Technique, Conduct Effective Training. All the content presented in this PPT design is completely editable. Download it and make adjustments in color, background, font etc. as per your unique business setting. This slide provide information about steps to conduct effective training need analysis for employees. It includes steps such as identify type of training need, select tools, determine desired outcome, determine current outcome etc.
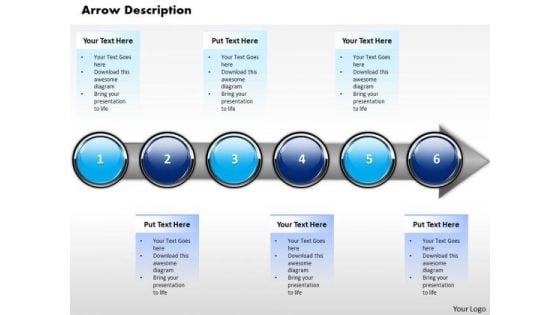
Ppt Horizontal Illustration Of Financial Process Using 6 State Diagram PowerPoint Templates
PPT horizontal illustration of financial process using 6 state diagram PowerPoint Templates-This diagram can be used in analyzing, designing, documenting or managing a process or program in various fields.-PPT horizontal illustration of financial process using 6 state diagram PowerPoint Templates-Abstract, Achievement, Aim, Arrow, Background, Business, Chart, Communication, Company, Competition, Concept, Design, Development, Diagram, Direction, Finance, Financial, Forecast, Forward, Goal, Graph, Graphic, Growth, Icon, Illustration, Increase, Investment, Leader, Leadership, Marketing, Motion, Moving, Orange, Path, Price, Process, Profit, Progress, Shape, Sign, Success, Symbol, Target, Team, Teamwork, Up, Upwards Spread awareness of digital tools. Whatever the divide our PT&s will bridge it.
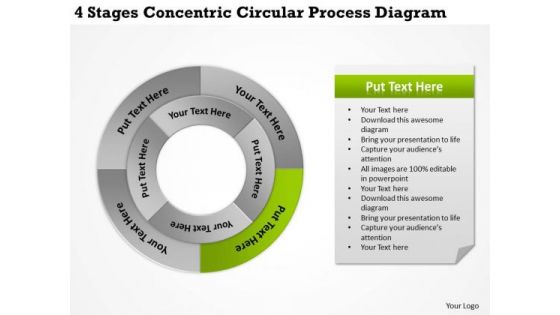
Business Strategy Implementation Circular Process Diagram Company
We present our business strategy implementation circular process diagram company.Download and present our Marketing PowerPoint Templates because Our PowerPoint Templates and Slides are designed to help you succeed. They have all the ingredients you need. Download and present our Business PowerPoint Templates because You can Be the puppeteer with our PowerPoint Templates and Slides as your strings. Lead your team through the steps of your script. Use our Process and Flows PowerPoint Templates because Our PowerPoint Templates and Slides are the chords of your song. String them along and provide the lilt to your views. Download our Shapes PowerPoint Templates because Our PowerPoint Templates and Slides come in all colours, shades and hues. They help highlight every nuance of your views. Use our Circle Charts PowerPoint Templates because Our PowerPoint Templates and Slides provide you with a vast range of viable options. Select the appropriate ones and just fill in your text. Use these PowerPoint slides for presentations relating to Abstract, Access, Background, Banner, Blue, Bright, Business, Chart, Circle, Color, Colorful, Concept, Conceptual, Connection, Corporate, Creative, Cycle, Design, Different, Element, Empty, Form, Frame, Graphic, Green, Group, Idea, Illustration, Match, Message, Order, Part, Piece, Place, Process, Red, Shape, Solution, Special, Speech, Strategy, Symbol, Template, Text. The prominent colors used in the PowerPoint template are Green, Gray, Black. Achieve any end with our Business Strategy Implementation Circular Process Diagram Company. They will carry your thoughts further than you think.
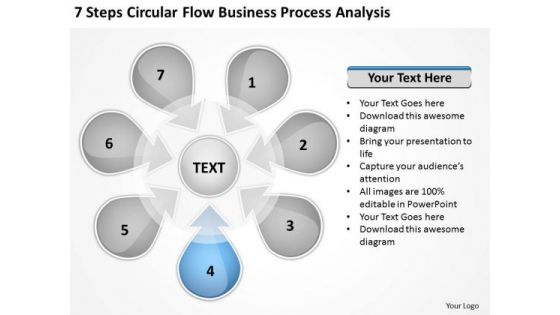
World Business PowerPoint Templates Process Analysis Sample Plans Slides
We present our world business powerpoint templates process analysis sample plans Slides.Present our Circle Charts PowerPoint Templates because Our PowerPoint Templates and Slides will provide you the cutting edge. Slice through the doubts in the minds of your listeners. Use our Arrows PowerPoint Templates because Our PowerPoint Templates and Slides will definately Enhance the stature of your presentation. Adorn the beauty of your thoughts with their colourful backgrounds. Present our Shapes PowerPoint Templates because Our PowerPoint Templates and Slides will let Your superior ideas hit the target always and everytime. Use our Business PowerPoint Templates because Our PowerPoint Templates and Slides will weave a web of your great ideas. They are gauranteed to attract even the most critical of your colleagues. Present our Process and Flows PowerPoint Templates because Our PowerPoint Templates and Slides are created by a hardworking bunch of busybees. Always flitting around with solutions gauranteed to please.Use these PowerPoint slides for presentations relating to achieve, achievement, analysis, background, brainstorm, brand, business, chart, commerce, communication, conceptual, conference, consultant, cooperation, corporate, diagram, executive, financial, formula, goal, guide, idea, innovation, management, market, marketing, mba, method, mission, motivation, operations, organization, organize, performance, process, program, resource, scheme, solution, strategy, success, successful, tactic, target, teamwork, text, vision, work. The prominent colors used in the PowerPoint template are Blue, Gray, Black. Your thoughts will strike the right chords. Pluck the strings with our World Business PowerPoint Templates Process Analysis Sample Plans Slides.
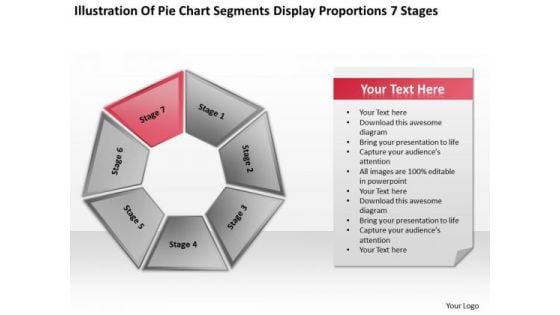
Pie Chart Segments Display Proportions 7 Stages Ppt PowerPoint Slides
We present our pie chart segments display proportions 7 stages ppt PowerPoint Slides.Present our Business PowerPoint Templates because Our PowerPoint Templates and Slides offer you the needful to organise your thoughts. Use them to list out your views in a logical sequence. Download and present our Marketing PowerPoint Templates because You canTake a leap off the starting blocks with our PowerPoint Templates and Slides. They will put you ahead of the competition in quick time. Present our Process and Flows PowerPoint Templates because Our PowerPoint Templates and Slides offer you the needful to organise your thoughts. Use them to list out your views in a logical sequence. Download our Flow Charts PowerPoint Templates because Our PowerPoint Templates and Slides has conjured up a web of all you need with the help of our great team. Use them to string together your glistening ideas. Download our Circle Charts PowerPoint Templates because Our PowerPoint Templates and Slides team portray an attitude of elegance. Personify this quality by using them regularly.Use these PowerPoint slides for presentations relating to Process, abstract, multicolored, market, website, network, cross, statistics, model, document, business, plan, presentation,diagram, circle, data, marketing, management, chart, sphere, options, function, shiny, direction, piechart,design, company, navigation,financial, structure, multiple, button, steps, seven, flow. The prominent colors used in the PowerPoint template are Red, White, Gray. Get fascinated by our Pie Chart Segments Display Proportions 7 Stages Ppt PowerPoint Slides. They will keep attracting your attention.
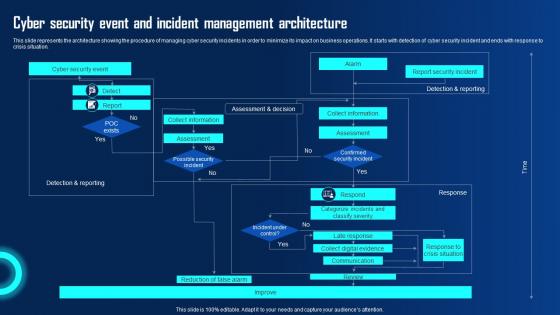
Cyber Security Event And Incident Management Ppt Powerpoint Presentation Diagram Graph Charts Pdf
This slide represents the architecture showing the procedure of managing cyber security incidents in order to minimize its impact on business operations. It starts with detection of cyber security incident and ends with response to crisis situation. Are you in need of a template that can accommodate all of your creative concepts This one is crafted professionally and can be altered to fit any style. Use it with Google Slides or PowerPoint. Include striking photographs, symbols, depictions, and other visuals. Fill, move around, or remove text boxes as desired. Test out color palettes and font mixtures. Edit and save your work, or work with colleagues. Download Cyber Security Event And Incident Management Ppt Powerpoint Presentation Diagram Graph Charts Pdf and observe how to make your presentation outstanding. Give an impeccable presentation to your group and make your presentation unforgettable. This slide represents the architecture showing the procedure of managing cyber security incidents in order to minimize its impact on business operations. It starts with detection of cyber security incident and ends with response to crisis situation.
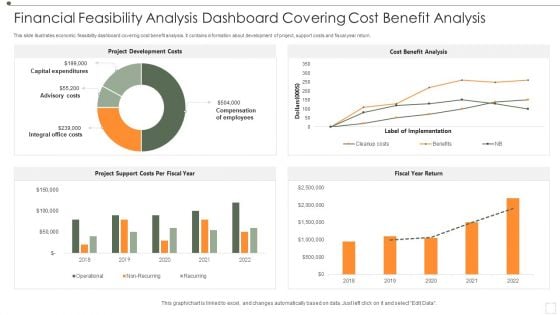
Financial Feasibility Analysis Dashboard Covering Cost Benefit Analysis Professional PDF
This slide illustrates economic feasibility dashboard covering cost benefit analysis. It contains information about development of project, support costs and fiscal year return. Showcasing this set of slides titled Financial Feasibility Analysis Dashboard Covering Cost Benefit Analysis Professional PDF. The topics addressed in these templates are Project Development Costs, Cost Benefit Analysis, Fiscal Year Return. All the content presented in this PPT design is completely editable. Download it and make adjustments in color, background, font etc. as per your unique business setting.
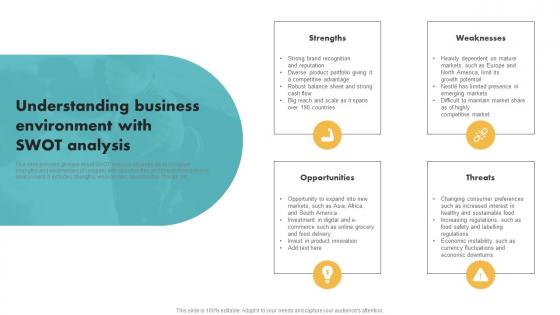
Understanding Business Environment With Swot Analysis Customer Segmentation Background Pdf
This slide provides glimpse about SWOT analysis of Nestle SA to compare strengths and weaknesses of company with opportunities and threats from external environment. It includes strengths, weaknesses, opportunities, threats, etc. Slidegeeks is here to make your presentations a breeze with Understanding Business Environment With Swot Analysis Customer Segmentation Background Pdf With our easy-to-use and customizable templates, you can focus on delivering your ideas rather than worrying about formatting. With a variety of designs to choose from, you are sure to find one that suits your needs. And with animations and unique photos, illustrations, and fonts, you can make your presentation pop. So whether you are giving a sales pitch or presenting to the board, make sure to check out Slidegeeks first. This slide provides glimpse about SWOT analysis of Nestle SA to compare strengths and weaknesses of company with opportunities and threats from external environment. It includes strengths, weaknesses, opportunities, threats, etc.
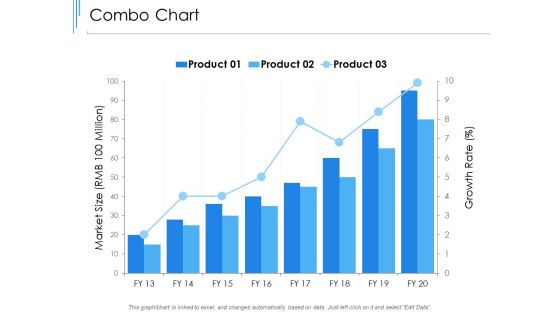
Combo Chart Analysis Ppt PowerPoint Presentation Portfolio Templates
Presenting this set of slides with name combo chart analysis ppt powerpoint presentation portfolio templates. The topics discussed in these slides are market size, growth rate. This is a completely editable PowerPoint presentation and is available for immediate download. Download now and impress your audience.
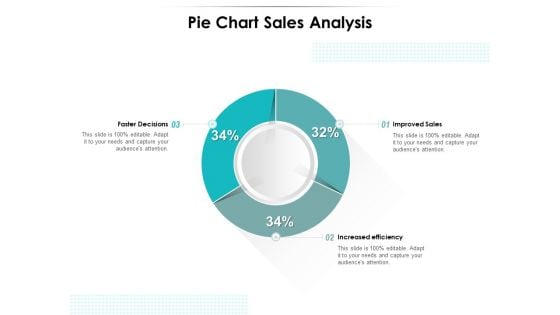
Pie Chart Sales Analysis Ppt PowerPoint Presentation Samples PDF
Presenting this set of slides with name pie chart sales analysis ppt powerpoint presentation samples pdf. The topics discussed in these slides are improved sales, increased efficiency, faster decisions. This is a completely editable PowerPoint presentation and is available for immediate download. Download now and impress your audience.


 Continue with Email

 Home
Home


