Survey Themes
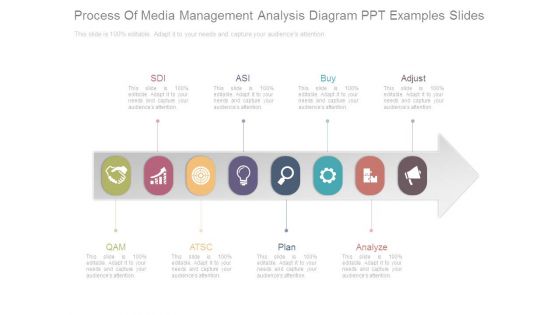
Process Of Media Management Analysis Diagram Ppt Examples Slides
This is a process of media management analysis diagram ppt examples slides. This is a eight stage process. The stages in this process are sdi, asi, buy, adjust, qam, atsc, plan, analyze.
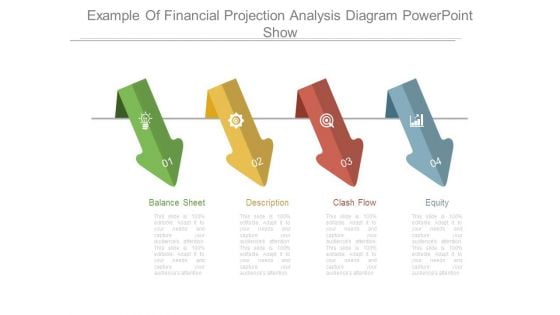
Example Of Financial Projection Analysis Diagram Powerpoint Show
This is a example of financial projection analysis diagram powerpoint show. This is a four stage process. The stages in this process are balance sheet, description, clash flow, equity.

Fundamentals Of Business Analysis Diagram Powerpoint Slide Rules
This is a fundamentals of business analysis diagram powerpoint slide rules. This is a six stage process. The stages in this process are business model, building website, retail partnership, network of retail stores, web sales of advantage card, money conscious.
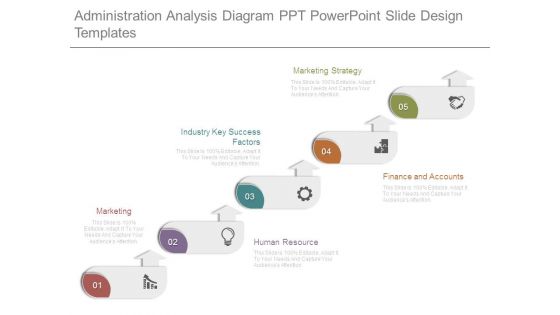
Administration Analysis Diagram Ppt Powerpoint Slide Design Templates
This is a administration analysis diagram ppt powerpoint slide design templates. This is a five stage process. The stages in this process are marketing strategy, industry key success factors, marketing, human resource, finance and accounts.
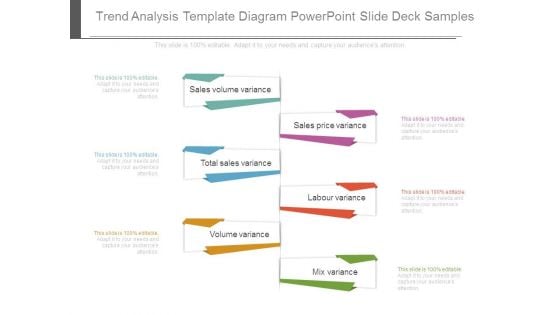
Trend Analysis Template Diagram Powerpoint Slide Deck Samples
This is a trend analysis template diagram powerpoint slide deck samples. This is a six stage process. The stages in this process are sales volume variance, total sales variance, sales price variance, labour variance, mix variance, volume variance.
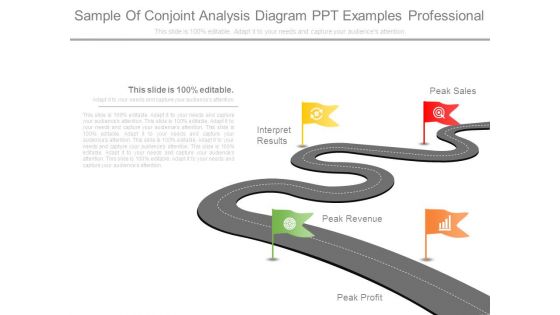
Sample Of Conjoint Analysis Diagram Ppt Examples Professional
This is a sample of conjoint analysis diagram ppt examples professional. This is a four stage process. The stages in this process are peak profit, peak revenue, interpret results, peak sales.
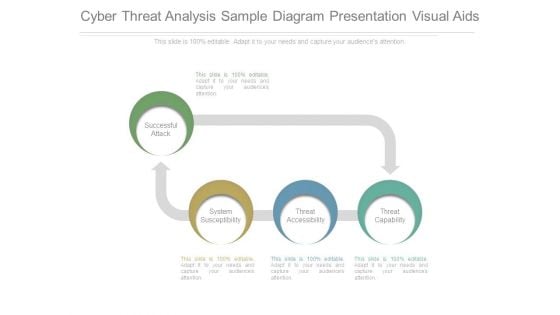
Cyber Threat Analysis Sample Diagram Presentation Visual Aids
This is a cyber threat analysis sample diagram presentation visual aids. This is a four stage process. The stages in this process are successful attack, system susceptibility, threat accessibility, threat capability.
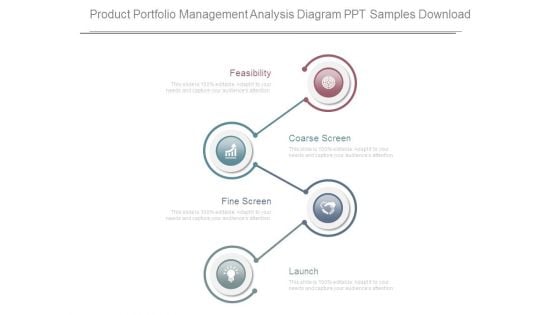
Product Portfolio Management Analysis Diagram Ppt Samples Download
This is a product portfolio management analysis diagram ppt samples download. This is a four stage process. The stages in this process are feasibility, coarse screen, fine screen, launch.
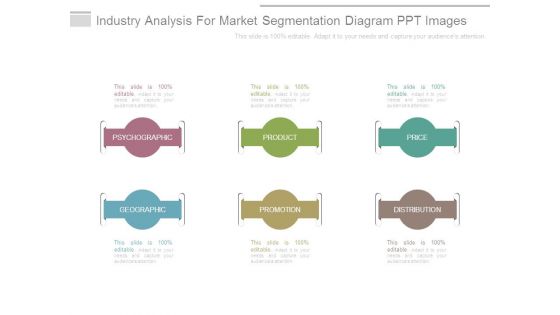
Industry Analysis For Market Segmentation Diagram Ppt Images
This is a industry analysis for market segmentation diagram ppt images. This is a six stage process. The stages in this process are psychographic, product, price, geographic, promotion, distribution.
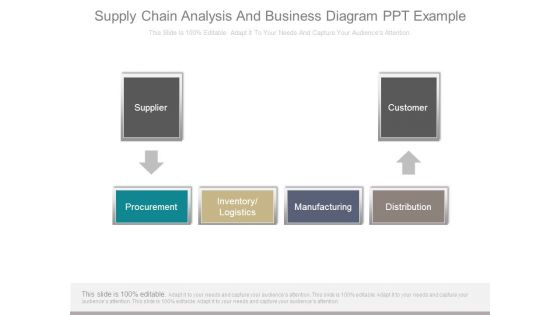
Supply Chain Analysis And Business Diagram Ppt Example
This is a supply chain analysis and business diagram ppt example. This is a four stage process. The stages in this process are supplier, customer, procurement, inventory logistics, manufacturing, distribution.
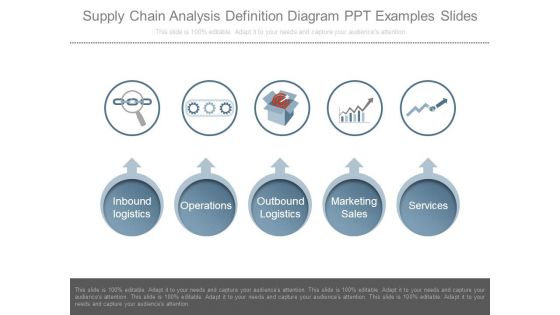
Supply Chain Analysis Definition Diagram Ppt Examples Slides
This is a supply chain analysis definition diagram ppt examples slides. This is a five stage process. The stages in this process are inbound logistics, operations, outbound logistics, marketing sales, services.
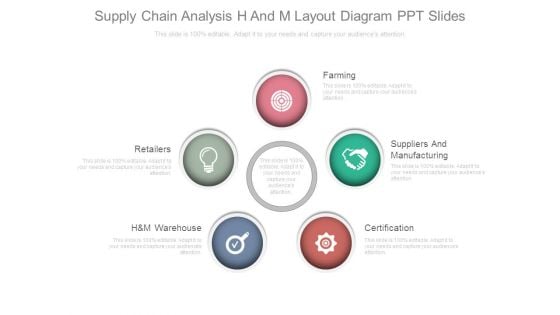
Supply Chain Analysis H And M Layout Diagram Ppt Slides
This is a supply chain analysis h and m layout diagram ppt slides. This is a five stage process. The stages in this process are suppliers and manufacturing, certification, farming, retailers, h and m warehouse.
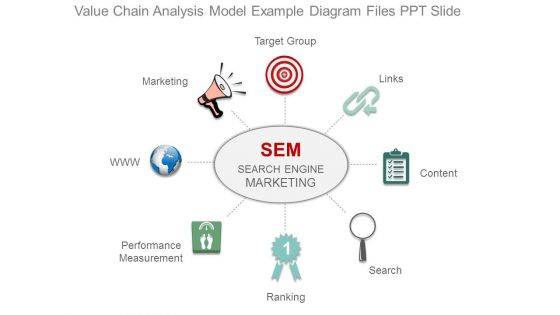
Value Chain Analysis Model Example Diagram Files Ppt Slide
This is a value chain analysis model example diagram files ppt slide. This is a eight stage process. The stages in this process are sem, search engine, marketing, marketing, target group, links, content, search, ranking, performance measurement, www.
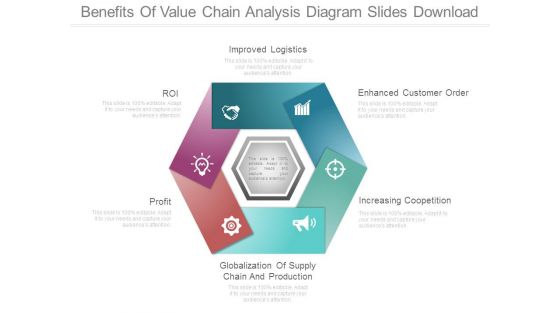
Benefits Of Value Chain Analysis Diagram Slides Download
This is a benefits of value chain analysis diagram slides download. This is a six stage process. The stages in this process are improved logistics, roi, profit, globalization of supply chain and production, enhanced customer order, increasing coopetition.
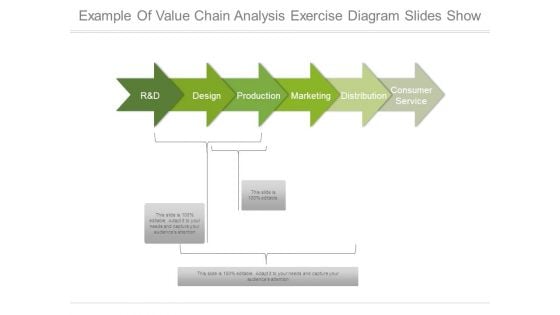
Example Of Value Chain Analysis Exercise Diagram Slides Show
This is a example of value chain analysis exercise diagram slides show. This is a six stage process. The stages in this process are r and d, design, production, marketing, distribution, consumer service.
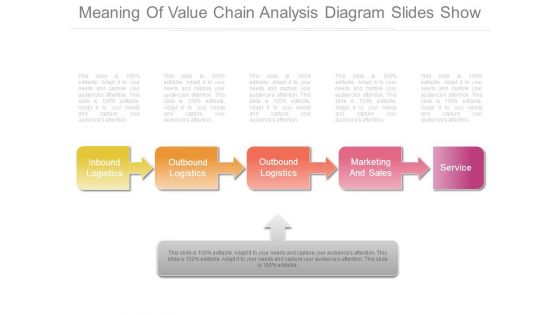
Meaning Of Value Chain Analysis Diagram Slides Show
This is a meaning of value chain analysis diagram slides show. This is a five stage process. The stages in this process are inbound logistics, outbound logistics, outbound logistics, marketing and sales, service.

Sample Of Value Chain Analysis Business Model Diagram Ppt Files
This is a sample of value chain analysis business model diagram ppt files. This is a five stage process. The stages in this process are product development, marketing and sales, customer service, operations, management.
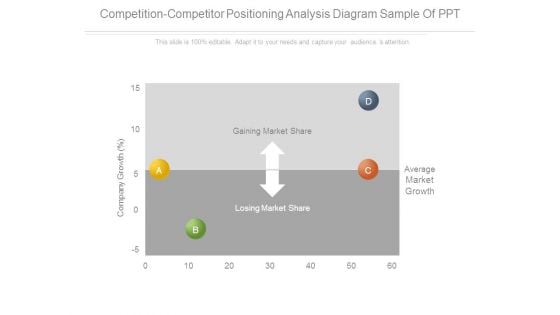
Competition Competitor Positioning Analysis Diagram Sample Of Ppt
This is a competition competitor positioning analysis diagram sample of ppt. This is a two stage process. The stages in this process are gaining market share, average market growth, losing market share, company growth.
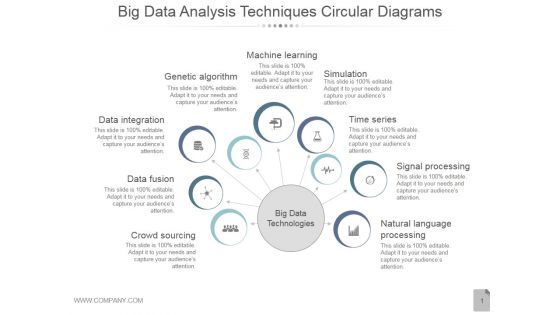
Big Data Analysis Techniques Circular Diagrams Ppt PowerPoint Presentation Shapes
This is a big data analysis techniques circular diagrams ppt powerpoint presentation shapes. This is a nine stage process. The stages in this process are data fusion, data integration, genetic algorithm, machine learning, simulation.
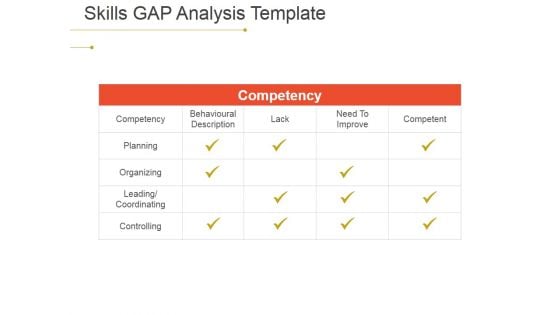
Skills Gap Analysis Ppt PowerPoint Presentation File Diagrams
This is a skills gap analysis ppt powerpoint presentation file diagrams. This is a four stage process. The stages in this process are competency, planning, organizing, leading coordinating, controlling, behavioural description, lack.
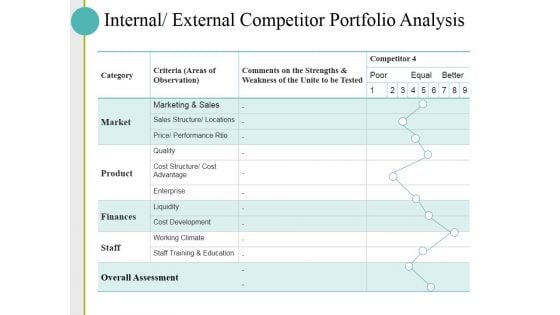
Internal External Competitor Portfolio Analysis Ppt PowerPoint Presentation Pictures Diagrams
This is a internal external competitor portfolio analysis ppt powerpoint presentation pictures diagrams. This is a five stage process. The stages in this process are market, product, finances, staff, overall assessment.
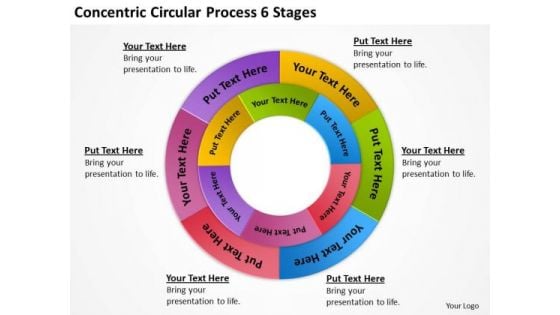
Concentric Circular Process 6 Stages Great Business Plan Examples PowerPoint Slides
We present our concentric circular process 6 stages great business plan examples PowerPoint Slides.Use our Circle Charts PowerPoint Templates because You canTake a leap off the starting blocks with our PowerPoint Templates and Slides. They will put you ahead of the competition in quick time. Present our Ring Charts PowerPoint Templates because Our PowerPoint Templates and Slides will let you Illuminate the road ahead to Pinpoint the important landmarks along the way. Use our Shapes PowerPoint Templates because Our PowerPoint Templates and Slides are conceived by a dedicated team. Use them and give form to your wondrous ideas. Download our Process and Flows PowerPoint Templates because It can Leverage your style with our PowerPoint Templates and Slides. Charm your audience with your ability. Present our Business PowerPoint Templates because you should Whip up a frenzy with our PowerPoint Templates and Slides. They will fuel the excitement of your team.Use these PowerPoint slides for presentations relating to shape, vector, process, arrow, chart, website, speech, form, green, special, corporate, order, red, business, concept, bright, symbol, template, circle, match, usable, graphic, element, different, idea, abstract, cycle, creative, illustration, piece, connection, strategy, place, frame, web, solution, design, color, group, blue, colorful, text, empty, banner, access, background, part, conceptual, message. The prominent colors used in the PowerPoint template are Blue, Yellow, Green. Concentrate on the assignment with our Concentric Circular Process 6 Stages Great Business Plan Examples PowerPoint Slides. Don't give a fig about other issues.
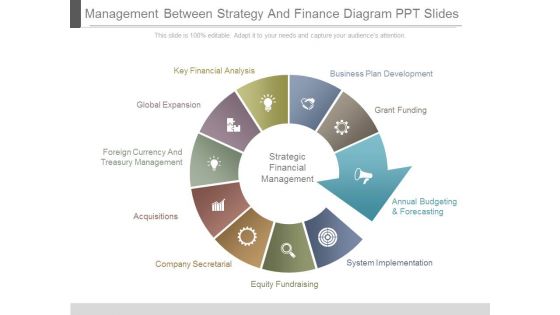
Management Between Strategy And Finance Diagram Ppt Slides
This is a management between strategy and finance diagram ppt slides. This is a ten stage process. The stages in this process are key financial analysis, business plan development, global expansion, foreign currency and treasury management, acquisitions, company secretarial, equity fundraising, system implementation, annual budgeting and forecasting, grant funding, business plan development, strategic financial management.\n\n\n\n\n\n\n \n\n\n\n\n\n\n\n\n\n\n\n\n\n\n\n\n\n\n\n\n\n\n\n\n\n
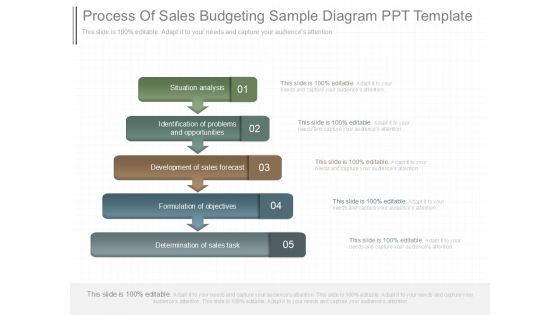
Process Of Sales Budgeting Sample Diagram Ppt Template
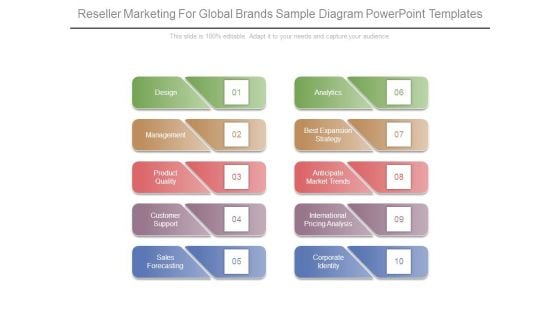
Reseller Marketing For Global Brands Sample Diagram Powerpoint Templates
This is a reseller marketing for global brands sample diagram powerpoint templates. This is a ten stage process. The stages in this process are design, management, product quality, customer support, sales forecasting, analytics, best expansion strategy, anticipate market trends, international pricing analysis, corporate identity.
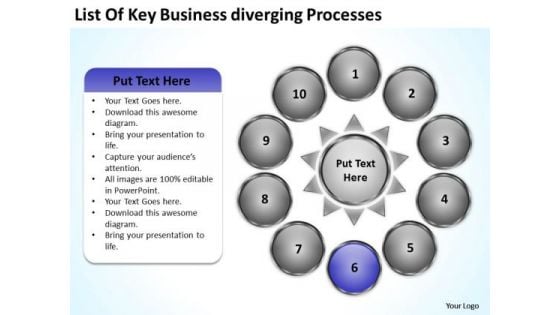
Nine Stages Diverging Factors Flow Chart Circular Network PowerPoint Templates
We present our nine stages diverging factors flow chart Circular Network PowerPoint templates.Use our Ring Charts PowerPoint Templates because they enhance the essence of your viable ideas. Download our Process and Flows PowerPoint Templates because it depicts Rolling along while gathering profits along the way is the aim. Use our Circle charts PowerPoint Templates because you should Emphasise the process of your business or corporate growth. Use our Arrows PowerPoint Templates because by using this slide you can Heighten the anticipation of your audience listing . Download and present our Success PowerPoint Templates because your brain is always churning out ideas like cogs in a wheel.Use these PowerPoint slides for presentations relating to Communication,competition, development, diagram,direction, element, finance, financial,forward, graphic, growth, guide,increase, investment, leader, leadership,management, marketing, motion,moving, organization, path, plan,presentation, price, profit, progress,report, representation, shape, sign. The prominent colors used in the PowerPoint template are Purple, Gray, White. People tell us our nine stages diverging factors flow chart Circular Network PowerPoint templates will save the presenter time. Customers tell us our finance PowerPoint templates and PPT Slides are Romantic. Professionals tell us our nine stages diverging factors flow chart Circular Network PowerPoint templates are topically designed to provide an attractive backdrop to any subject. Presenters tell us our element PowerPoint templates and PPT Slides will make the presenter successul in his career/life. Use our nine stages diverging factors flow chart Circular Network PowerPoint templates are readymade to fit into any presentation structure. Presenters tell us our finance PowerPoint templates and PPT Slides are designed by professionals You will be held in high esteem. Use our Nine Stages Diverging Factors Flow Chart Circular Network PowerPoint Templates as a coat-of-arms.
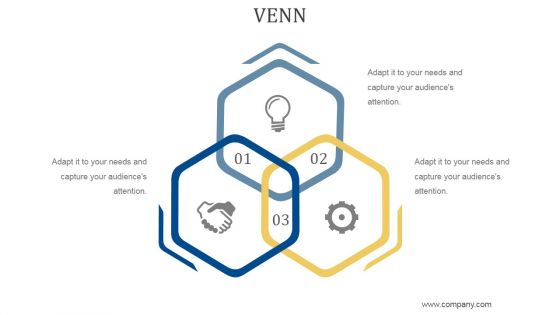
Venn Ppt PowerPoint Presentation Design Ideas
This is a venn ppt powerpoint presentation design ideas. This is a three stage process. The stages in this process are business, strategy, marketing, analysis, venn diagram.
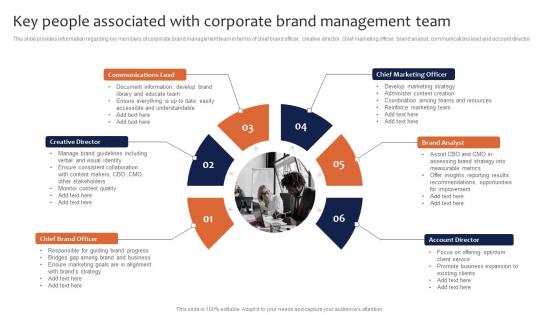
Key People Associated With Corporate Brand Management Team Leveraging Corporate Sample Pdf
This slide provides information regarding key members of corporate brand management team in terms of chief brand officer, creative director, chief marketing officer, brand analyst, communications lead and account director. Are you searching for a Key People Associated With Corporate Brand Management Team Leveraging Corporate Sample Pdf that is uncluttered, straightforward, and original It is easy to edit, and you can change the colors to suit your personal or business branding. For a presentation that expresses how much effort you have put in, this template is ideal With all of its features, including tables, diagrams, statistics, and lists, it is perfect for a business plan presentation. Make your ideas more appealing with these professional slides. Download Key People Associated With Corporate Brand Management Team Leveraging Corporate Sample Pdf from Slidegeeks today. This slide provides information regarding key members of corporate brand management team in terms of chief brand officer, creative director, chief marketing officer, brand analyst, communications lead and account director.
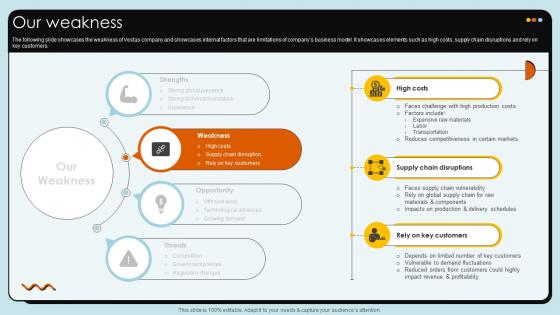
Our Weakness Wind Turbines Manufacturer Company Profile CP SS V
The following slide showcases the weakness of Vestas company and showcases internal factors that are limitations of companys business model. It showcases elements such as high costs, supply chain disruptions and rely onAre you searching for a Our Weakness Wind Turbines Manufacturer Company Profile CP SS V that is uncluttered, straightforward, and original Its easy to edit, and you can change the colors to suit your personal or business branding. For a presentation that expresses how much effort you have put in, this template is ideal With all of its features, including tables, diagrams, statistics, and lists, its perfect for a business plan presentation. Make your ideas more appealing with these professional slides. Download Our Weakness Wind Turbines Manufacturer Company Profile CP SS V from Slidegeeks today. The following slide showcases the weakness of Vestas company and showcases internal factors that are limitations of companys business model. It showcases elements such as high costs, supply chain disruptions and rely on

Robo Advisors To Provide Investment Suggestions Understanding Investment Banking Framework Fin SS V
This slide shows information which can be used to understand the concept of Robo advisors in investment banking. It also includes details regarding the impact of using these advisors. Are you searching for a Robo Advisors To Provide Investment Suggestions Understanding Investment Banking Framework Fin SS V that is uncluttered, straightforward, and original Its easy to edit, and you can change the colors to suit your personal or business branding. For a presentation that expresses how much effort you have put in, this template is ideal With all of its features, including tables, diagrams, statistics, and lists, its perfect for a business plan presentation. Make your ideas more appealing with these professional slides. Download Robo Advisors To Provide Investment Suggestions Understanding Investment Banking Framework Fin SS V from Slidegeeks today. This slide shows information which can be used to understand the concept of Robo advisors in investment banking. It also includes details regarding the impact of using these advisors.
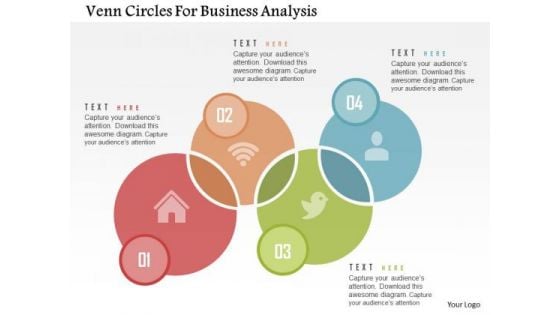
Venn Circles For Business Analysis Presentation Template
Use this PowerPoint diagram for classification of business activities. It may also be used for business analysis . This business diagram makes your presentation more interactive.
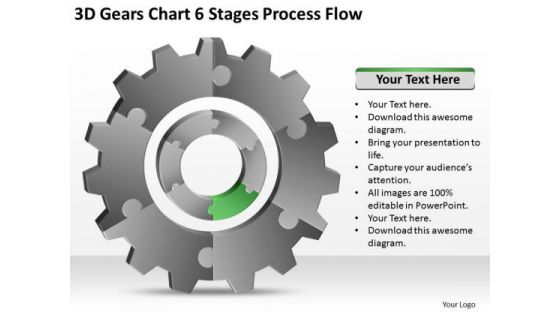
3d Gears Chart 6 Stages Process Flow Ppt Business Continuity Plan Software PowerPoint Slides
We present our 3d gears chart 6 stages process flow ppt business continuity plan software PowerPoint Slides.Present our Industrial PowerPoint Templates because You have gained great respect for your brilliant ideas. Use our PowerPoint Templates and Slides to strengthen and enhance your reputation. Download our Gear Wheels PowerPoint Templates because Our PowerPoint Templates and Slides are conceived by a dedicated team. Use them and give form to your wondrous ideas. Use our Technology PowerPoint Templates because They will bring a lot to the table. Their alluring flavours will make your audience salivate. Present our Shapes PowerPoint Templates because Our PowerPoint Templates and Slides will Embellish your thoughts. They will help you illustrate the brilliance of your ideas. Present our Business PowerPoint Templates because You are an avid believer in ethical practices. Highlight the benefits that accrue with our PowerPoint Templates and Slides.Use these PowerPoint slides for presentations relating to gear, engineering, concept, green, vector, technical, steel, machinery, bio, sign, glossy, teamwork, symbol, circle, mechanical, ecology, cooperation, element, spin, engine, technology, wheel, modern, mechanism, illustration, icon, round, collection, industrial, reflection, design, mechanics, transparent, motion, machine, set, factory, progress, transmission, background, work, industry, clock, editable, communication, cogwheel. The prominent colors used in the PowerPoint template are White, Gray, Green. Our 3d Gears Chart 6 Stages Process Flow Ppt Business Continuity Plan Software PowerPoint Slides make a great bait. Your ideas will hook them all.
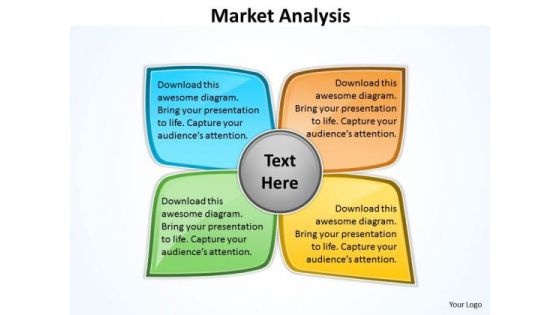
Business Finance Strategy Development Market Analysis Diagram For Business Strategy Diagram
Dominate Proceedings With Your Ideas. Our Business Finance Strategy Development Market Analysis Diagram For Business Strategy Diagram Powerpoint Templates Will Empower Your Thoughts.
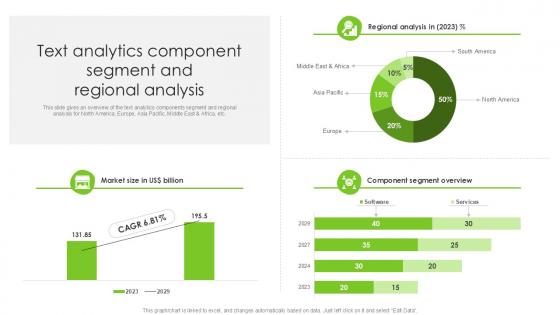
Text Analytics Component Segment And Regional Analysis PPT Template SS
This slide gives an overview of the text analytics components segment and regional analysis for North America, Europe, Asia Pacific, Middle East and Africa, etc. Presenting this PowerPoint presentation, titled Text Analytics Component Segment And Regional Analysis PPT Template SS, with topics curated by our researchers after extensive research. This editable presentation is available for immediate download and provides attractive features when used. Download now and captivate your audience. Presenting this Text Analytics Component Segment And Regional Analysis PPT Template SS. Our researchers have carefully researched and created these slides with all aspects taken into consideration. This is a completely customizable Text Analytics Component Segment And Regional Analysis PPT Template SS that is available for immediate downloading. Download now and make an impact on your audience. Highlight the attractive features available with our PPTs. This slide gives an overview of the text analytics components segment and regional analysis for North America, Europe, Asia Pacific, Middle East and Africa, etc.
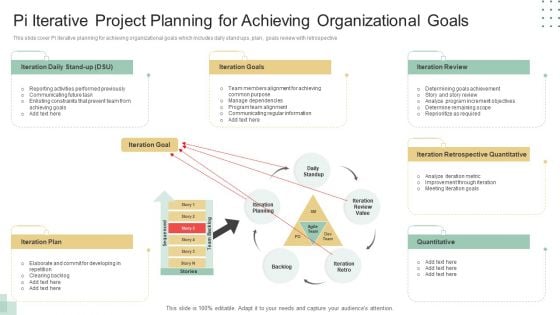
Pi Iterative Project Planning For Achieving Organizational Goals Ppt Gallery Vector PDF
This slide cover Pi iterative planning for achieving organizational goals which includes daily stand ups, plan , goals review with retrospective. Showcasing this set of slides titled Pi Iterative Project Planning For Achieving Organizational Goals Ppt Gallery Vector PDF. The topics addressed in these templates are Inspect And Adapt, Quantitative Measurement, Problem Solving Workshop. All the content presented in this PPT design is completely editable. Download it and make adjustments in color, background, font etc. as per your unique business setting.
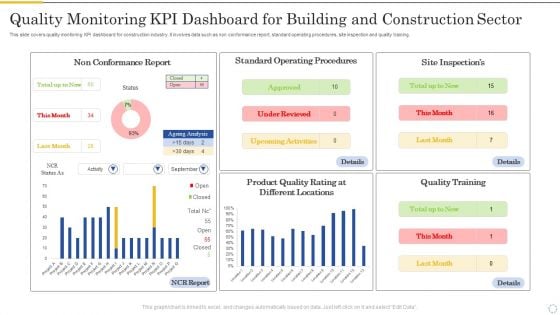
Quality Monitoring Kpi Dashboard For Building And Construction Sector Portrait PDF
This slide covers quality monitoring KPI dashboard for construction industry. It involves data such as non conformance report, standard operating procedures, site inspection and quality training. Showcasing this set of slides titled Quality Monitoring Kpi Dashboard For Building And Construction Sector Portrait PDF. The topics addressed in these templates are Non Conformance Report, Standard Operating, Procedures. All the content presented in this PPT design is completely editable. Download it and make adjustments in color, background, font etc. as per your unique business setting.
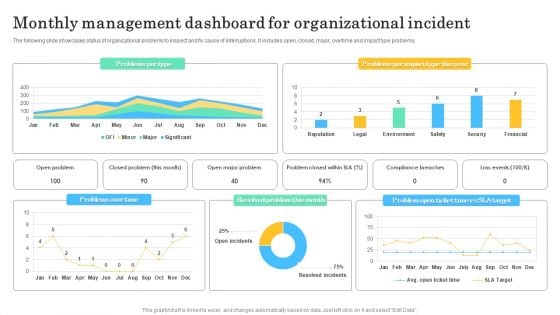
Monthly Management Dashboard For Organizational Incident Professional PDF
The following slide showcases status of organizational problems to inspect and fix cause of interruptions. It includes open, closed, major, overtime and impact type problems. Showcasing this set of slides titled Monthly Management Dashboard For Organizational Incident Professional PDF. The topics addressed in these templates are Problems Over Time, Resolved Problem Month. All the content presented in this PPT design is completely editable. Download it and make adjustments in color, background, font etc. as per your unique business setting.
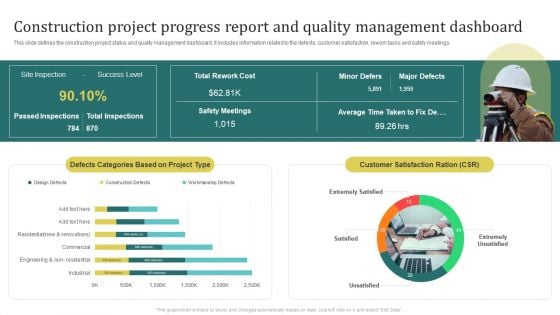
Construction Project Progress Report And Quality Management Dashboard Sample PDF
This slide defines the construction project status and quality management dashboard. It includes information related to the defects, customer satisfaction, rework tasks and safety meetings.Showcasing this set of slides titled Construction Project Progress Report And Quality Management Dashboard Sample PDF. The topics addressed in these templates are Passed Inspections, Customer Satisfaction, Defects Categories. All the content presented in this PPT design is completely editable. Download it and make adjustments in color, background, font etc. as per your unique business setting.

Business People Child Toy Blocks Entertainment PowerPoint Templates Ppt Backgrounds For Slides
We present our business people child toy blocks entertainment PowerPoint templates PPT backgrounds for slides.Use our Boxes PowerPoint Templates because These PowerPoint Templates and Slides will give the updraft to your ideas. See them soar to great heights with ease. Download and present our Shapes PowerPoint Templates because They will bring a lot to the table. Their alluring flavours will make your audience salivate. Download our Future PowerPoint Templates because Our PowerPoint Templates and Slides will Activate the energies of your audience. Get their creative juices flowing with your words. Use our Puzzles or Jigsaws PowerPoint Templates because It will Raise the bar of your Thoughts. They are programmed to take you to the next level. Present our Cubes PowerPoint Templates because Our PowerPoint Templates and Slides are conceived by a dedicated team. Use them and give form to your wondrous ideas.Use these PowerPoint slides for presentations relating to 3d, abstract, achievement, activity, aspirations, block, box, building,business,businessman , construction, creativity, cube, decisions, games,graphic, group, growth, human, ideas, illustration, isolated, male, men, occupation, partnership, people, person, picking, progress, puzzle, shape,silhouette, stack, stone, structure, success, team, teamwork, text, togetherness, toy, white, working. The prominent colors used in the PowerPoint template are Green, Red, Yellow. Applaud the performance of your employees. Give them due credit through our Business People Child Toy Blocks Entertainment PowerPoint Templates Ppt Backgrounds For Slides.
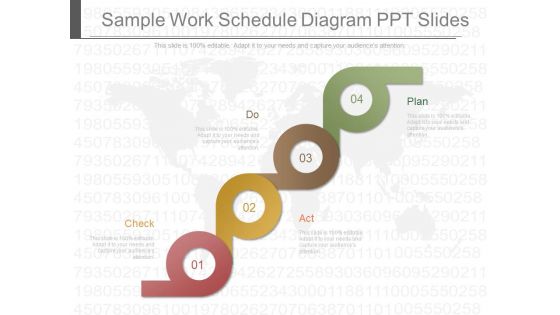
Sample Work Schedule Diagram Ppt Slides
This is a sample work schedule diagram ppt slides. This is a four stage process. The stages in this process are check, act, do, plan.
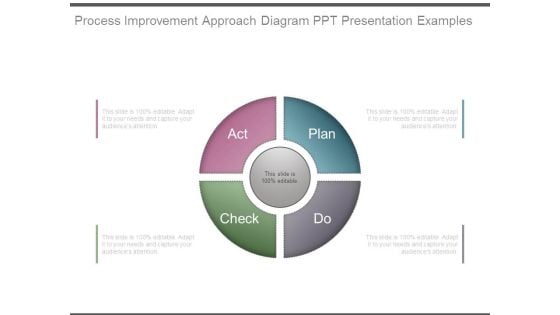
Process Improvement Approach Diagram Ppt Presentation Examples
This is a process improvement approach diagram ppt presentation examples. This is a four stage process. The stages in this process are plan, check, act, do.
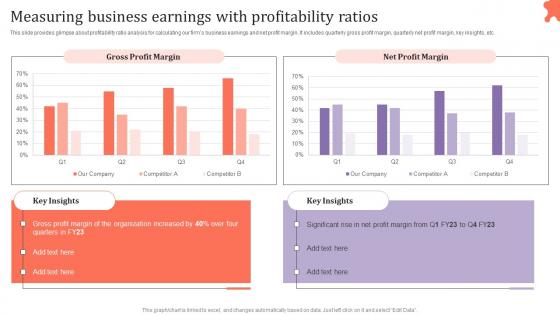
Measuring Business Earnings Assessing Corporate Financial Techniques Diagrams Pdf
This slide provides glimpse about profitability ratio analysis for calculating our firms business earnings and net profit margin. It includes quarterly gross profit margin, quarterly net profit margin, key insights, etc. Slidegeeks has constructed Measuring Business Earnings Assessing Corporate Financial Techniques Diagrams Pdf after conducting extensive research and examination. These presentation templates are constantly being generated and modified based on user preferences and critiques from editors. Here, you will find the most attractive templates for a range of purposes while taking into account ratings and remarks from users regarding the content. This is an excellent jumping off point to explore our content and will give new users an insight into our top notch PowerPoint Templates. This slide provides glimpse about profitability ratio analysis for calculating our firms business earnings and net profit margin. It includes quarterly gross profit margin, quarterly net profit margin, key insights, etc.
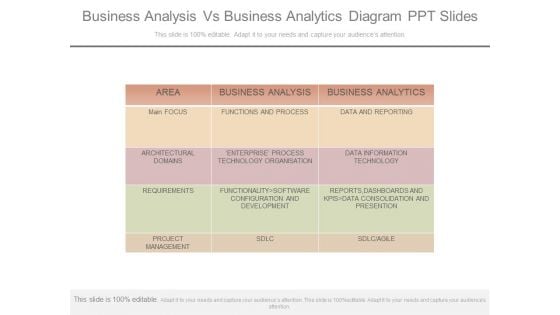
Business Analysis Vs Business Analytics Diagram Ppt Slides
This is a business analysis vs business analytics diagram ppt slides. This is a one stage process. The stages in this process are area, main focus, architectural domains, requirements, project management, business analysis, functions and process, enterprise? process technology organisation, functionality software configuration and development, sdlc, business analytics, data and reporting, data information technology, reports, dashboards and kpis data consolidation and presention, sdlc agile.
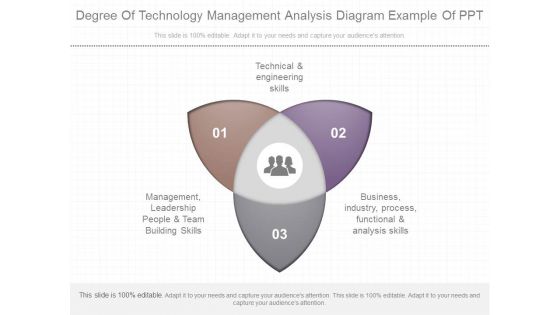
Degree Of Technology Management Analysis Diagram Example Of Ppt
This is a degree of technology management analysis diagram example of ppt. This is a three stage process. The stages in this process are technical and engineering skills, management leadership people and team building skills, business industry process functional and analysis skills.
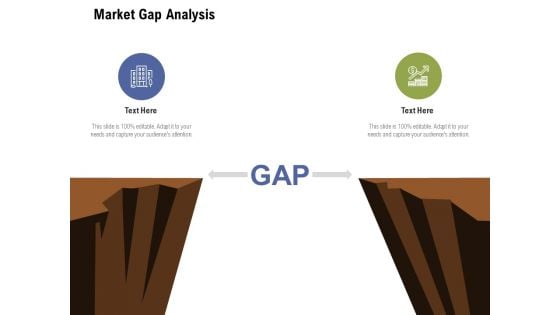
Market Gap Analysis Ppt PowerPoint Presentation Diagram Templates
Presenting this set of slides with name market gap analysis ppt powerpoint presentation diagram templates. This is a two stage process. The stages in this process is market gap analysis. This is a completely editable PowerPoint presentation and is available for immediate download. Download now and impress your audience.
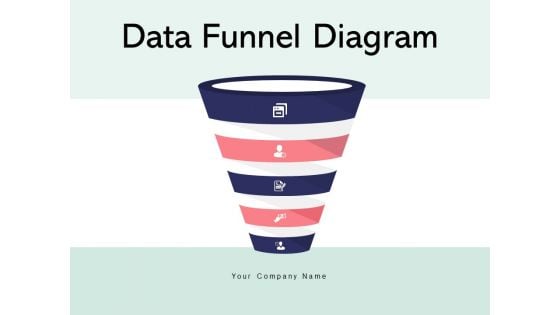
Data Funnel Diagram Interest Analysis Ppt PowerPoint Presentation Complete Deck
Presenting this set of slides with name data funnel diagram interest analysis ppt powerpoint presentation complete deck. The topics discussed in these slides are interest, analysis, arrow, marketing, funnel. This is a completely editable PowerPoint presentation and is available for immediate download. Download now and impress your audience.
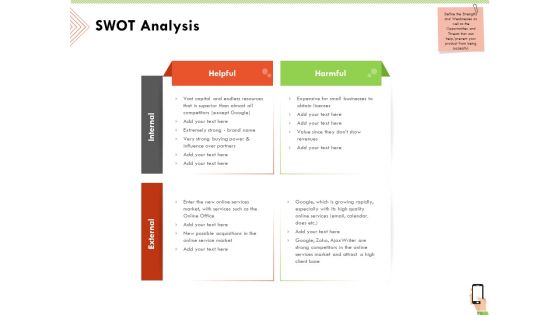
Multi Channel Online Commerce SWOT Analysis Diagrams PDF
Presenting multi channel online commerce swot analysis diagrams pdf to provide visual cues and insights. Share and navigate important information on four stages that need your due attention. This template can be used to pitch topics like swot analysis. In addtion, this PPT design contains high resolution images, graphics, etc, that are easily editable and available for immediate download.
Four Business Analysis Techniques With Icons Ppt PowerPoint Presentation Infographics Icons
Presenting this set of slides with name four business analysis techniques with icons ppt powerpoint presentation infographics icons. This is a four stage process. The stages in this process are strategic analysis, tactical analysis, operational analysis, entity relationship diagram. This is a completely editable PowerPoint presentation and is available for immediate download. Download now and impress your audience.
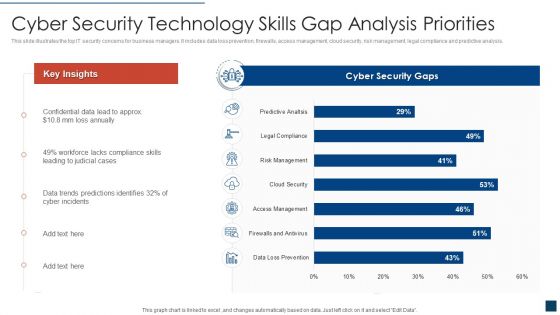
Cyber Security Technology Skills Gap Analysis Priorities Clipart PDF
This slide illustrates the top IT security concerns for business managers. It includes data loss prevention, firewalls, access management, cloud security, risk management, legal compliance and predictive analysis. Showcasing this set of slides titled cyber security technology skills gap analysis priorities clipart pdf. The topics addressed in these templates are cyber security technology skills gap analysis priorities. All the content presented in this PPT design is completely editable. Download it and make adjustments in color, background, font etc. as per your unique business setting.
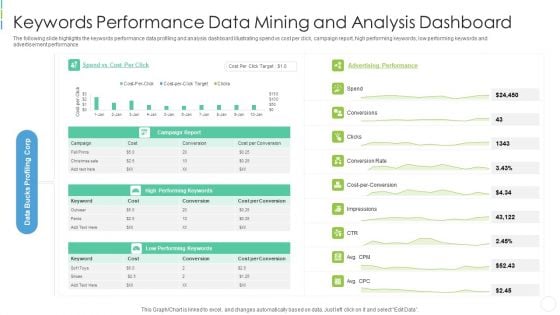
Keywords Performance Data Mining And Analysis Dashboard Microsoft PDF
The following slide highlights the keywords performance data profiling and analysis dashboard illustrating spend vs cost per click, campaign report, high performing keywords, low performing keywords and advertisement performance Showcasing this set of slides titled keywords performance data mining and analysis dashboard microsoft pdf . The topics addressed in these templates are keywords performance data mining and analysis dashboard . All the content presented in this PPT design is completely editable. Download it and make adjustments in color, background, font etc. as per your unique business setting.
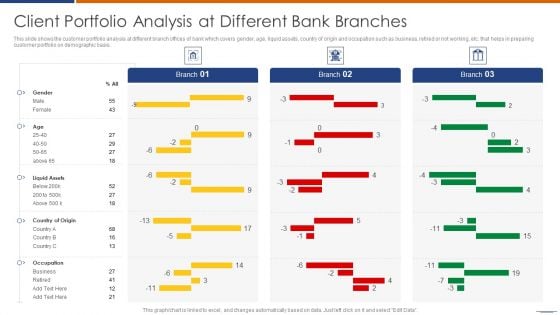
Client Portfolio Analysis At Different Bank Branches Infographics PDF
This slide shows the customer portfolio analysis at different branch offices of bank which covers gender, age, liquid assets, country of origin and occupation such as business, retired or not working, etc. that helps in preparing customer portfolio on demographic basis.Showcasing this set of slides titled Client Portfolio Analysis At Different Bank Branches Infographics PDF The topics addressed in these templates are Client Portfolio, Analysis Different, Bank Branches All the content presented in this PPT design is completely editable. Download it and make adjustments in color, background, font etc. as per your unique business setting.
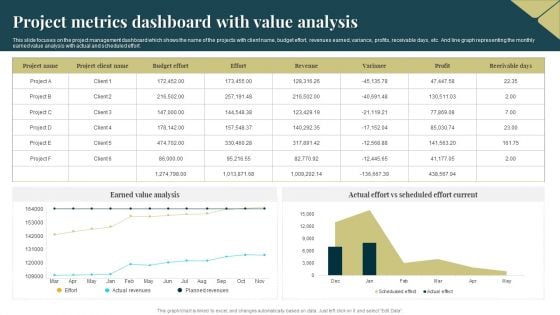
Project Metrics Dashboard With Value Analysis Introduction PDF
This slide focuses on the project management dashboard which shows the name of the projects with client name, budget effort, revenues earned, variance, profits, receivable days, etc. And line graph representing the monthly earned value analysis with actual and scheduled effort. Showcasing this set of slides titled Project Metrics Dashboard With Value Analysis Introduction PDF. The topics addressed in these templates are Budget Effort, Revenues, Earned Value Analysis. All the content presented in this PPT design is completely editable. Download it and make adjustments in color, background, font etc. as per your unique business setting.
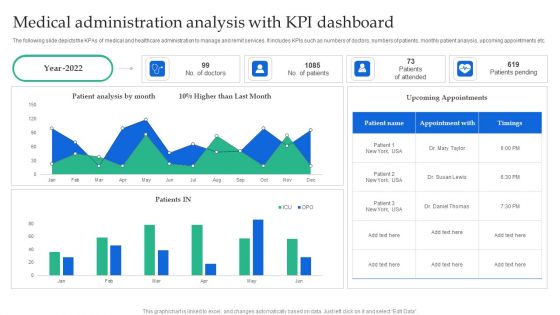
Medical Administration Analysis With KPI Dashboard Clipart PDF
The following slide depicts the KPAs of medical and healthcare administration to manage and remit services. It includes KPIs such as numbers of doctors, numbers of patients, monthly patient analysis, upcoming appointments etc. Showcasing this set of slides titled Medical Administration Analysis With KPI Dashboard Clipart PDF. The topics addressed in these templates are Patient Analysis, Higher Than, Upcoming Appointments. All the content presented in this PPT design is completely editable. Download it and make adjustments in color, background, font etc. as per your unique business setting.
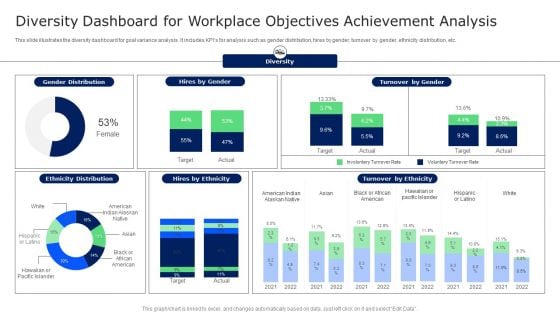
Diversity Dashboard For Workplace Objectives Achievement Analysis Microsoft PDF
This slide illustrates the diversity dashboard for goal variance analysis. It includes KPIs for analysis such as gender distribution, hires by gender, turnover by gender, ethnicity distribution, etc. Showcasing this set of slides titled Diversity Dashboard For Workplace Objectives Achievement Analysis Microsoft PDF. The topics addressed in these templates are Target, Involuntary Turnover Rate, Turnover By Ethnicity. All the content presented in this PPT design is completely editable. Download it and make adjustments in color, background, font etc. as per your unique business setting.
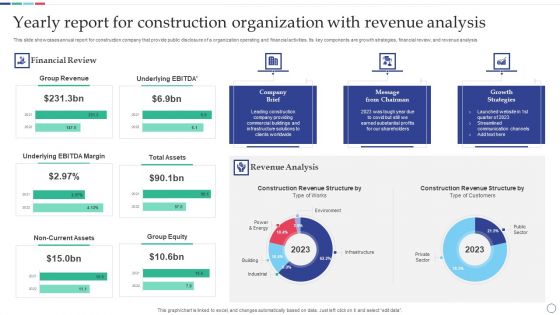
Yearly Report For Construction Organization With Revenue Analysis Topics PDF
This slide showcases annual report for construction company that provide public disclosure of a organization operating and financial activities. Its key components are growth strategies, financial review, and revenue analysis. Showcasing this set of slides titled Yearly Report For Construction Organization With Revenue Analysis Topics PDF. The topics addressed in these templates are Revenue Analysis, Growth Strategies, Customers. All the content presented in this PPT design is completely editable. Download it and make adjustments in color, background, font etc. as per your unique business setting.
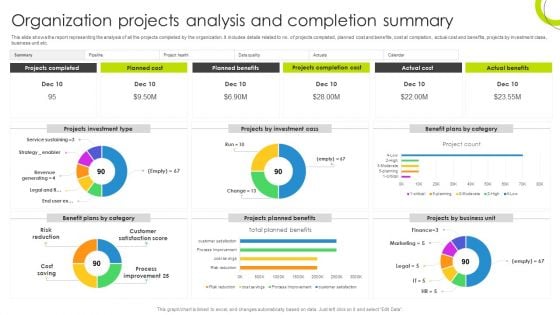
Organization Projects Analysis And Completion Summary Microsoft PDF
This slide shows the report representing the analysis of all the projects completed by the organization. It includes details related to no. of projects completed, planned cost and benefits, cost at completion, actual cost and benefits, projects by investment class, business unit etc. Showcasing this set of slides titled Organization Projects Analysis And Completion Summary Microsoft PDF. The topics addressed in these templates are Organization Projects, Analysis Completion Summary. All the content presented in this PPT design is completely editable. Download it and make adjustments in color, background, font etc. as per your unique business setting.
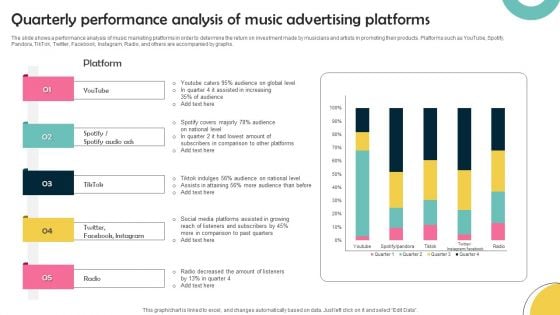
Quarterly Performance Analysis Of Music Advertising Platforms Microsoft PDF
The slide shows a performance analysis of music marketing platforms in order to determine the return on investment made by musicians and artists in promoting their products. Platforms such as YouTube, Spotify, Pandora, TikTok, Twitter, Facebook, Instagram, Radio, and others are accompanied by graphs. Showcasing this set of slides titled Quarterly Performance Analysis Of Music Advertising Platforms Microsoft PDF. The topics addressed in these templates are Global Level, Social Media Platforms, Quarterly Performance Analysis. All the content presented in this PPT design is completely editable. Download it and make adjustments in color, background, font etc. as per your unique business setting.
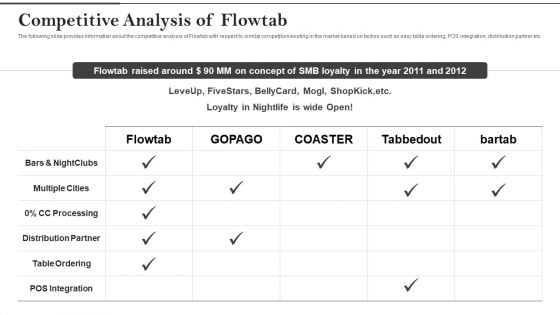
Flowtab Venture Capital Investment Competitive Analysis Of Flowtab Diagrams PDF
The following slide provides information about the competitive analysis of Flowtab with respect to similar competitors existing in the market based on factors such as easy table ordering, POS integration, distribution partner etc. Deliver an awe inspiring pitch with this creative flowtab venture capital investment competitive analysis of flowtab diagrams pdf bundle. Topics like competitive analysis of flowtab can be discussed with this completely editable template. It is available for immediate download depending on the needs and requirements of the user.
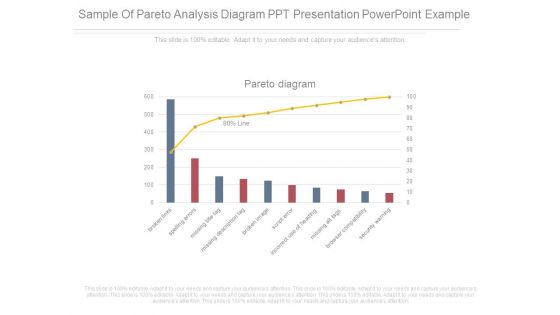
Sample Of Pareto Analysis Diagram Ppt Presentation Powerpoint Example
This is a sample of pareto analysis diagram ppt presentation powerpoint example. This is a ten stage process. The stages in this process are pareto diagram, broken links, spelling errors, missing title tag, missing description tag, broken image, script error, incorrect use of heading, missing alt tags, browser capability, security warning.
Market Potential Analysis Circular Diagram Ppt Sample PDF
Presenting market potential analysis circular diagram ppt sample pdf to provide visual cues and insights. Share and navigate important information on six stages that need your due attention. This template can be used to pitch topics like circular diagram. In addtion, this PPT design contains high resolution images, graphics, etc, that are easily editable and available for immediate download.


 Continue with Email

 Home
Home


