Survey Themes
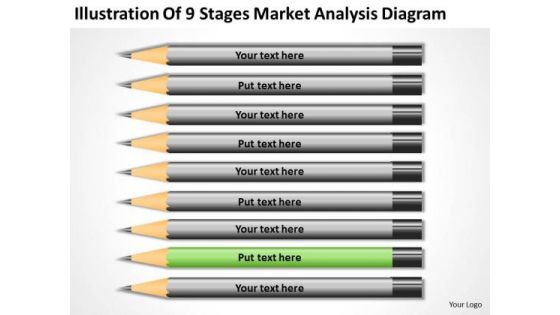
9 Stages Market Analysis Diagram Sample Business Continuity Plan PowerPoint Templates
We present our 9 stages market analysis diagram sample business continuity plan PowerPoint templates.Present our Education PowerPoint Templates because Our PowerPoint Templates and Slides are specially created by a professional team with vast experience. They diligently strive to come up with the right vehicle for your brilliant Ideas. Use our Arrows PowerPoint Templates because Our PowerPoint Templates and Slides have the Brilliant backdrops. Guaranteed to illuminate the minds of your audience. Download our Business PowerPoint Templates because Our PowerPoint Templates and Slides will let you Hit the right notes. Watch your audience start singing to your tune. Present our Process and Flows PowerPoint Templates because Our PowerPoint Templates and Slides will let you Clearly mark the path for others to follow. Download our Shapes PowerPoint Templates because They will bring a lot to the table. Their alluring flavours will make your audience salivate.Use these PowerPoint slides for presentations relating to Pencil, hexagon, spectrum, crayon, stack, drawing, close-up, macro, hex, palette, core, wood, color, group, color, objects, school, edge, draw, art, bunch, wooden, background, office, pattern, artist. The prominent colors used in the PowerPoint template are Green, Gray, Black. Make sure your audience learns with our 9 Stages Market Analysis Diagram Sample Business Continuity Plan PowerPoint Templates. Make sure your presentation gets the attention it deserves.
Data Valuation And Monetization Role Of Predictive Analytics On Data In Preventing Customer Churn Icons PDF
The firm will use advanced technology such as predictive analytics in order to project the probability of future outcomes, events based on current and historical data. It utilizes different statistical techniques such as machine learning, pattern recognition through data mining, etc. Deliver and pitch your topic in the best possible manner with this Data Valuation And Monetization Role Of Predictive Analytics On Data In Preventing Customer Churn Icons PDF. Use them to share invaluable insights on Pattern Recognition, Existing Customers, Machine Learning and impress your audience. This template can be altered and modified as per your expectations. So, grab it now.
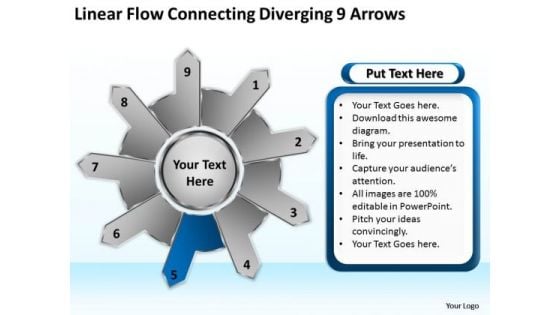
Linear Flow Connecting Diverging 9 Arrows Cycle Circular Spoke Network PowerPoint Slides
We present our linear flow connecting diverging 9 arrows cycle Circular Spoke Network PowerPoint Slides.Use our Shapes PowerPoint Templates because it demonstrates the seeds of many of our successes. Use our Flow charts PowerPoint Templates because your brain is always churning out ideas like cogs in a wheel. Download and present our Process and Flows PowerPoint Templates because with the help of our Slides you can Illustrate your plans to your listeners with the same accuracy. Present our Arrows PowerPoint Templates because with the help of our Slides you can Illustrate your plans on using the many social media modes available to inform soceity at large of the benefits of your product. Use our Success PowerPoint Templates because you have come up with a brilliant breakthrough idea. you can also visualise the interest it will generate.Use these PowerPoint slides for presentations relating to Access, arrow, background,banner, blue, bright, business, chart,circle, color, colorful, concept,conceptual, connection, corporate,creative, cycle, design, different, element,empty, form, frame, graphic, green,group, idea, illustration, match,message, order, part, piece, place,process, red, shape, solution, special,speech, strategy, symbol. The prominent colors used in the PowerPoint template are Blue navy, Gray, White. People tell us our linear flow connecting diverging 9 arrows cycle Circular Spoke Network PowerPoint Slides are Royal. Customers tell us our banner PowerPoint templates and PPT Slides are Elegant. Professionals tell us our linear flow connecting diverging 9 arrows cycle Circular Spoke Network PowerPoint Slides help you meet deadlines which are an element of today's workplace. Just browse and pick the slides that appeal to your intuitive senses. Presenters tell us our background PowerPoint templates and PPT Slides are Youthful. Use our linear flow connecting diverging 9 arrows cycle Circular Spoke Network PowerPoint Slides are Striking. Presenters tell us our background PowerPoint templates and PPT Slides are Majestic. Have nothing to fear with our Linear Flow Connecting Diverging 9 Arrows Cycle Circular Spoke Network PowerPoint Slides. Just download, type and present.
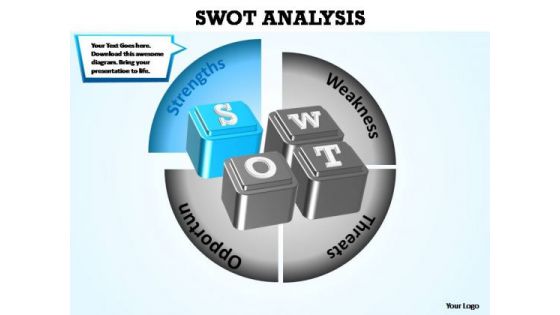
PowerPoint Template Success Swot Analysis Ppt Slide Designs
PowerPoint Template Success Swot Analysis PPT Slide Designs Business Power Points-These high quality powerpoint pre-designed slides and powerpoint templates have been carefully created by our professional team to help you impress your audience. All slides have been created and are 100% editable in powerpoint. Each and every property of any graphic - color, size, orientation, shading, outline etc. can be modified to help you build an effective powerpoint presentation. Any text can be entered at any point in the powerpoint template or slide. Simply DOWNLOAD, TYPE and PRESENT!-These amazing PowerPoint pre-designed slides and PowerPoint templates have been carefully created by our team of experts to help you impress your audience. Our stunning collection of Powerpoint slides are 100% editable and can easily fit in any PowerPoint presentations. By using these animations and graphics in PowerPoint and you can easily make professional presentations. Any text can be entered at any point in the PowerPoint template or slide. Just DOWNLOAD our awesome PowerPoint templates and you are ready to go. Avoid delays with our PowerPoint Template Success Swot Analysis Ppt Slide Designs. They accelerate your thought process.
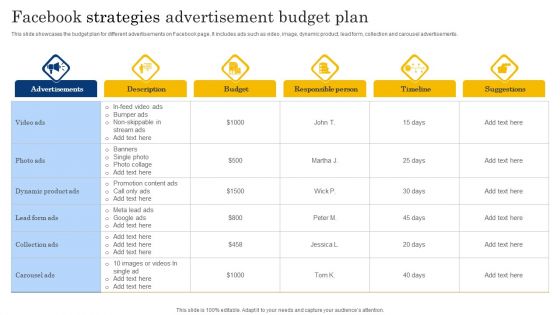
Facebook Strategies Advertisement Budget Plan Diagrams PDF
This slide showcases the budget plan for different advertisements on Facebook page. It includes ads such as video, image, dynamic product, lead form, collection and carousel advertisements. Pitch your topic with ease and precision using this Facebook Strategies Advertisement Budget Plan Diagrams PDF. This layout presents information on Description, Budget, Responsible Person. It is also available for immediate download and adjustment. So, changes can be made in the color, design, graphics or any other component to create a unique layout.
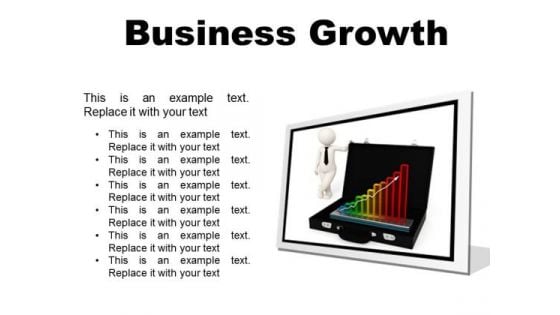
Growth Business PowerPoint Presentation Slides F
Microsoft PowerPoint Slides and Backgrounds with man presents business growth in a hologram graph placed in his briefcase isolated You have envisaged a bright future for your organisation. Deliver your forecast on our Growth Business PowerPoint Presentation Slides F.
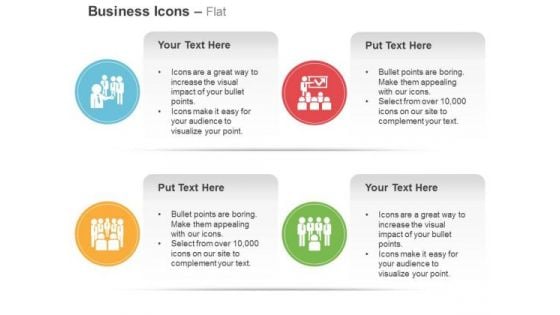
Leadership Team Management Analysis Ppt Slides Graphics
Concept of leadership and team management can be well explained with these icons. This template contains the professional designed icons for time management, leadership and analysis. Amplify your thoughts via our appropriate template.
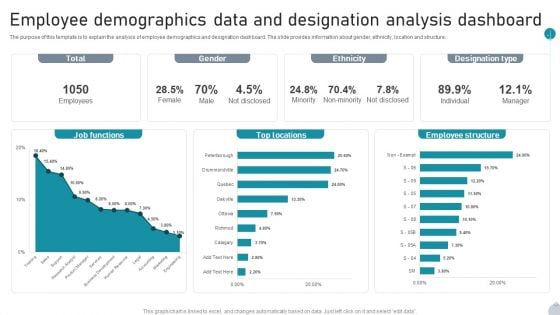
Employee Demographics Data And Designation Analysis Dashboard Introduction PDF
The purpose of this template is to explain the analysis of employee demographics and designation dashboard. The slide provides information about gender, ethnicity, location and structure. Pitch your topic with ease and precision using this Employee Demographics Data And Designation Analysis Dashboard Introduction PDF. This layout presents information on Job Functions, Top Locations, Employee Structure It is also available for immediate download and adjustment. So, changes can be made in the color, design, graphics or any other component to create a unique layout.
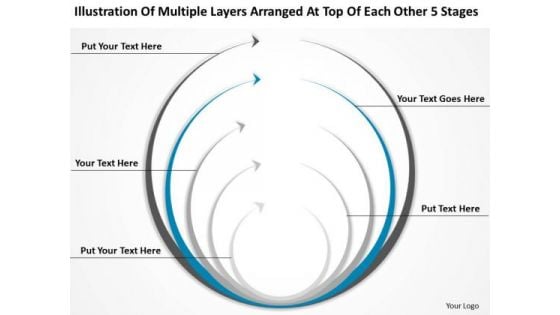
Layers Arranged At Top Each Other 5 Stages Ppt Business Plan PowerPoint Slides
We present our layers arranged at top each other 5 stages ppt business plan PowerPoint Slides.Download our Circle Charts PowerPoint Templates because Our PowerPoint Templates and Slides are Clear and concise. Use them and dispel any doubts your team may have. Present our Arrows PowerPoint Templates because Our PowerPoint Templates and Slides provide you with a vast range of viable options. Select the appropriate ones and just fill in your text. Download our Business PowerPoint Templates because It is Aesthetically crafted by artistic young minds. Our PowerPoint Templates and Slides are designed to display your dexterity. Download our Process and Flows PowerPoint Templates because Our PowerPoint Templates and Slides will provide you the cutting edge. Slice through the doubts in the minds of your listeners. Download our Marketing PowerPoint Templates because You have gained great respect for your brilliant ideas. Use our PowerPoint Templates and Slides to strengthen and enhance your reputation.Use these PowerPoint slides for presentations relating to Business, circle, process, leadership, components, concept, presentation, teamwork, internet, template, diagram, scheme, report, marketing, technology, strategy, project, growth, progress, background. The prominent colors used in the PowerPoint template are Blue, Gray, White. List your core competencies with our Layers Arranged At Top Each Other 5 Stages Ppt Business Plan PowerPoint Slides. They will make you look good.
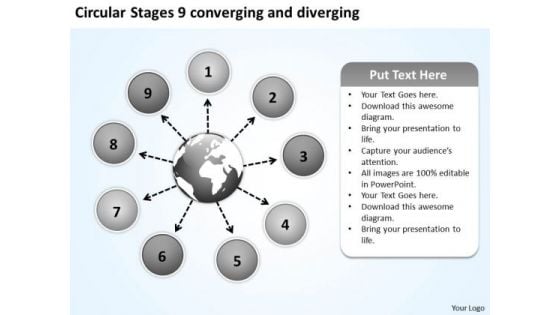
Circular Stages 9 Converging And Diverging Venn Chart PowerPoint Templates
We present our circular stages 9 converging and diverging Venn Chart PowerPoint templates.Download our Process and flows PowerPoint Templates because this layout helps you to impress upon the audience how your strategy will carry all to the top of the corporate heap. Download our Business PowerPoint Templates because this is the unerring accuracy in reaching the target. the effortless ability to launch into flight. Use our Marketing PowerPoint Templates because The marketplace is the merger of your dreams and your ability. Download and present our Flow charts PowerPoint Templates because they pinpoint the core values of your organisation. Present our Shapes PowerPoint Templates because they pinpoint the core values of your organisation.Use these PowerPoint slides for presentations relating to Access, arrow, blue, bright, business, chart, circle, color, colorful, concept, conceptual, connection, corporate, creative, cycle, design, different, element, empty, form, frame, graphic, green, group, idea, illustration, match, part, piece, place, process, shape, solution, special, speech, strategy, symbol. The prominent colors used in the PowerPoint template are Green, White, Black. People tell us our circular stages 9 converging and diverging Venn Chart PowerPoint templates are Dazzling. We assure you our business PowerPoint templates and PPT Slides provide great value for your money. Be assured of finding the best projection to highlight your words. PowerPoint presentation experts tell us our circular stages 9 converging and diverging Venn Chart PowerPoint templates are Ritzy. You can be sure our color PowerPoint templates and PPT Slides are Dazzling. Professionals tell us our circular stages 9 converging and diverging Venn Chart PowerPoint templates are Colorful. Use our chart PowerPoint templates and PPT Slides are Fantastic. Get the right fabric for your thoughts. Our Circular Stages 9 Converging And Diverging Venn Chart PowerPoint Templates will provide a fitting color.
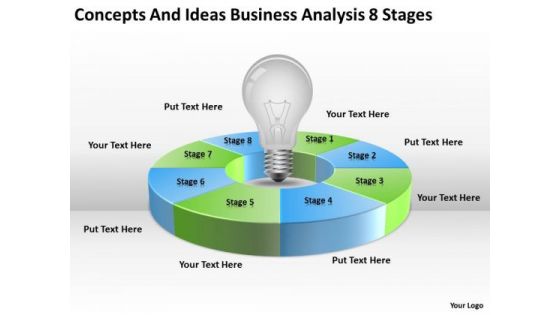
Ideas Business Analysis 8 Stages Ppt Writing Plan Template PowerPoint Templates
We present our ideas business analysis 8 stages ppt writing plan template PowerPoint templates.Download and present our Circle Charts PowerPoint Templates because Our PowerPoint Templates and Slides are designed to help you succeed. They have all the ingredients you need. Download and present our Light Bulbs PowerPoint Templates because Our PowerPoint Templates and Slides will fulfill your every need. Use them and effectively satisfy the desires of your audience. Present our Marketing PowerPoint Templates because Timeline crunches are a fact of life. Meet all deadlines using our PowerPoint Templates and Slides. Download our Process and Flows PowerPoint Templates because Our PowerPoint Templates and Slides will let your team Walk through your plans. See their energy levels rise as you show them the way. Download and present our Business PowerPoint Templates because It can Leverage your style with our PowerPoint Templates and Slides. Charm your audience with your ability.Use these PowerPoint slides for presentations relating to Lightbulb, icon, electric, white, lamp, bulb, yellow, diagram, electricity, orange, light, incandescence, graphic, process, element, illustration, energy, clipart, planning, design, clip, blue, set, infographic, transparency, art, wire, glass. The prominent colors used in the PowerPoint template are Green, Blue, Gray. Choreograph your act with our Ideas Business Analysis 8 Stages Ppt Writing Plan Template PowerPoint Templates. Your thoughts will automatically educate and entertain.
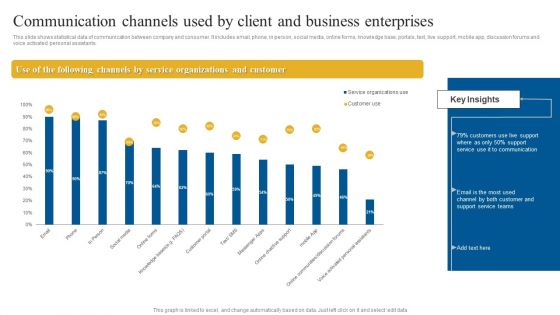
Communication Channels Used By Client And Business Enterprises Guidelines PDF
This slide shows statistical data of communication between company and consumer. It includes email, phone, in person, social media, online forms, knowledge base, portals, text, live support, mobile app, discussion forums and voice activated personal assistants. Pitch your topic with ease and precision using this Communication Channels Used By Client And Business Enterprises Guidelines PDF. This layout presents information on Service, Communication, Customer. It is also available for immediate download and adjustment. So, changes can be made in the color, design, graphics or any other component to create a unique layout.
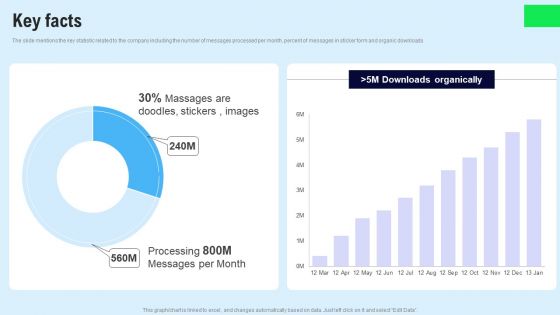
Chat Messenger Investor Funding Elevator Pitch Deck Key Facts Clipart PDF
The slide mentions the key statistic related to the company including the number of messages processed per month, percent of messages in sticker form and organic downloads. This Chat Messenger Investor Funding Elevator Pitch Deck Key Facts Clipart PDF is perfect for any presentation, be it in front of clients or colleagues. It is a versatile and stylish solution for organizing your meetings. The product features a modern design for your presentation meetings. The adjustable and customizable slides provide unlimited possibilities for acing up your presentation. Slidegeeks has done all the homework before launching the product for you. So, do not wait, grab the presentation templates today
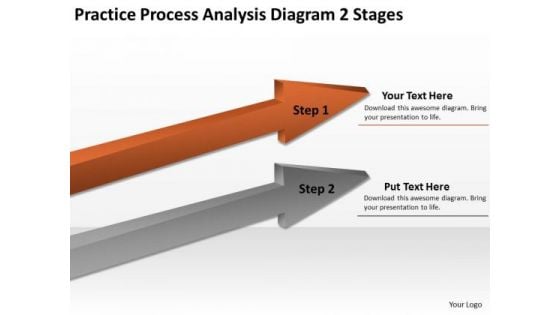
Applications Of Parallel Processing Analysis Diagram 2 Stages Ppt PowerPoint Slides
We present our applications of parallel processing analysis diagram 2 stages ppt PowerPoint Slides.Use our Arrows PowerPoint Templates because Our PowerPoint Templates and Slides help you pinpoint your timelines. Highlight the reasons for your deadlines with their use. Download and present our Business PowerPoint Templates because It is Aesthetically crafted by artistic young minds. Our PowerPoint Templates and Slides are designed to display your dexterity. Present our Success PowerPoint Templates because Your audience will believe you are the cats whiskers. Download our Shapes PowerPoint Templates because Our PowerPoint Templates and Slides are a sure bet. Gauranteed to win against all odds. Download and present our Signs PowerPoint Templates because It will Give impetus to the hopes of your colleagues. Our PowerPoint Templates and Slides will aid you in winning their trust.Use these PowerPoint slides for presentations relating to business, chart, collaborate, colorful, colors, commerce, concept, data, development, direction, economic, forward, graph, graphics, growing, growth, illustration, improvement, interaction, lead, leadership, line, manage, management, networking, object, organization, organize, performance, race, relation, relationship, resources, results, sales, same, staff, team, together. The prominent colors used in the PowerPoint template are Red, Gray, Black. You can be sure our applications of parallel processing analysis diagram 2 stages ppt PowerPoint Slides will help them to explain complicated concepts. People tell us our commerce PowerPoint templates and PPT Slides will get their audience's attention. You can be sure our applications of parallel processing analysis diagram 2 stages ppt PowerPoint Slides will make the presenter successul in his career/life. Use our commerce PowerPoint templates and PPT Slides are designed by a team of presentation professionals. Presenters tell us our applications of parallel processing analysis diagram 2 stages ppt PowerPoint Slides provide you with a vast range of viable options. Select the appropriate ones and just fill in your text. We assure you our colors PowerPoint templates and PPT Slides will get their audience's attention. Lead the fight with our Applications Of Parallel Processing Analysis Diagram 2 Stages Ppt PowerPoint Slides. You will come out on top.
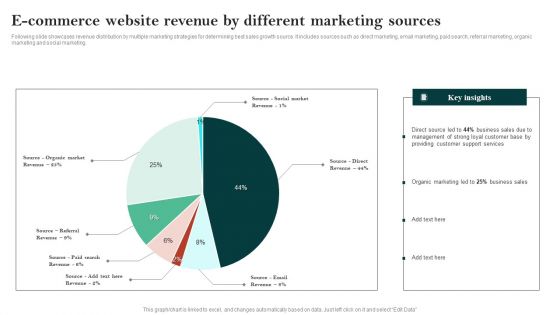
E Commerce Website Revenue By Different Marketing Sources Ppt Ideas PDF
Following slide showcases revenue distribution by multiple marketing strategies for determining best sales growth source. It includes sources such as direct marketing, email marketing, paid search, referral marketing, organic marketing and social marketing. Pitch your topic with ease and precision using this E Commerce Website Pre Launch Checklist Ppt Summary Backgrounds PDF. This layout presents information on Direct Source Led, Business Sales, Customer Base. It is also available for immediate download and adjustment. So, changes can be made in the color, design, graphics or any other component to create a unique layout.
KPI Dashboard Tracking Seo Major Promotional Analytics Future Trends Guidelines Pdf
This slide covers the KPI dashboard for analyzing SEO metrics such as authority score, organic traffic, organic keywords, paid keywords, ref. Domains, site audit, link building tool, organic traffic, on page SEO checker, backlink audit, etc. Are you searching for a KPI Dashboard Tracking Seo Major Promotional Analytics Future Trends Guidelines Pdf that is uncluttered, straightforward, and original Its easy to edit, and you can change the colors to suit your personal or business branding. For a presentation that expresses how much effort you have put in, this template is ideal With all of its features, including tables, diagrams, statistics, and lists, its perfect for a business plan presentation. Make your ideas more appealing with these professional slides. Download KPI Dashboard Tracking Seo Major Promotional Analytics Future Trends Guidelines Pdf from Slidegeeks today. This slide covers the KPI dashboard for analyzing SEO metrics such as authority score, organic traffic, organic keywords, paid keywords, ref. Domains, site audit, link building tool, organic traffic, on page SEO checker, backlink audit, etc.
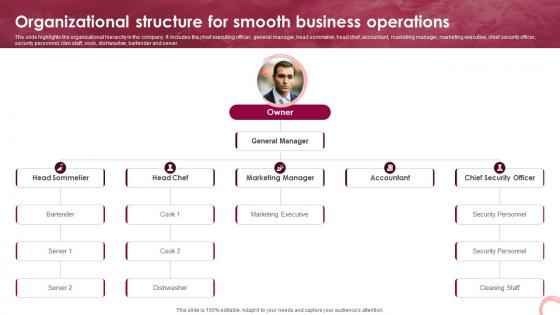
Wine Lounge Business Plan Organizational Structure For Smooth Business Operations BP SS V
The slide highlights the organizational hierarchy in the company. It includes the chief executing officer, general manager, head sommelier, head chef, accountant, marketing manager, marketing executive, chief security officer, security personnel, clen staff, cook, dishwasher, bartender and server. Are you searching for a Wine Lounge Business Plan Organizational Structure For Smooth Business Operations BP SS V that is uncluttered, straightforward, and original Its easy to edit, and you can change the colors to suit your personal or business branding. For a presentation that expresses how much effort you have put in, this template is ideal With all of its features, including tables, diagrams, statistics, and lists, its perfect for a business plan presentation. Make your ideas more appealing with these professional slides. Download Wine Lounge Business Plan Organizational Structure For Smooth Business Operations BP SS V from Slidegeeks today. The slide highlights the organizational hierarchy in the company. It includes the chief executing officer, general manager, head sommelier, head chef, accountant, marketing manager, marketing executive, chief security officer, security personnel, clen staff, cook, dishwasher, bartender and server.
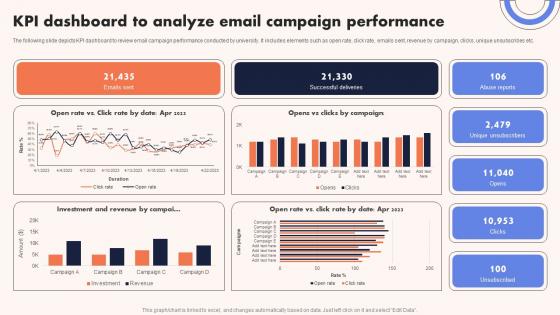
University Marketing Guide KPI Dashboard To Analyze Email Campaign Performance Strategy SS V
The following slide depicts KPI dashboard to review email campaign performance conducted by university. It includes elements such as open rate, click rate, emails sent, revenue by campaign, clicks, unique unsubscribes etc. Are you searching for a University Marketing Guide KPI Dashboard To Analyze Email Campaign Performance Strategy SS V that is uncluttered, straightforward, and original Its easy to edit, and you can change the colors to suit your personal or business branding. For a presentation that expresses how much effort you have put in, this template is ideal With all of its features, including tables, diagrams, statistics, and lists, its perfect for a business plan presentation. Make your ideas more appealing with these professional slides. Download University Marketing Guide KPI Dashboard To Analyze Email Campaign Performance Strategy SS V from Slidegeeks today. The following slide depicts KPI dashboard to review email campaign performance conducted by university. It includes elements such as open rate, click rate, emails sent, revenue by campaign, clicks, unique unsubscribes etc.

Lead Prioritization Based On Interest Inside Vs Outside Sales PPT Presentation Strategy SS V
This slide showcases matrix that can help organization in effective lead prioritization based on product fit and interest. It can help organization to prioritize the leads and increase inside sales conversion rates. Are you searching for a Lead Prioritization Based On Interest Inside Vs Outside Sales PPT Presentation Strategy SS V that is uncluttered, straightforward, and original Its easy to edit, and you can change the colors to suit your personal or business branding. For a presentation that expresses how much effort you have put in, this template is ideal With all of its features, including tables, diagrams, statistics, and lists, its perfect for a business plan presentation. Make your ideas more appealing with these professional slides. Download Lead Prioritization Based On Interest Inside Vs Outside Sales PPT Presentation Strategy SS V from Slidegeeks today. This slide showcases matrix that can help organization in effective lead prioritization based on product fit and interest. It can help organization to prioritize the leads and increase inside sales conversion rates
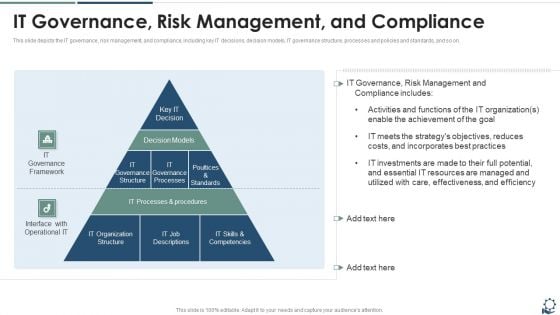
IT Governance Risk Management And Compliance Diagrams PDF
This slide depicts the IT governance, risk management, and compliance, including key IT decisions, decision models, IT governance structure, processes and policies and standards, and so on.Deliver an awe inspiring pitch with this creative IT Governance Risk Management And Compliance Diagrams PDF bundle. Topics like Activities And Functions, Enable The Achievement, Resources Are Managed can be discussed with this completely editable template. It is available for immediate download depending on the needs and requirements of the user.
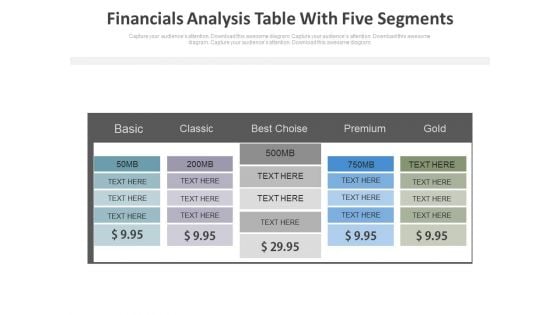
Five Steps Financial Analysis Table Powerpoint Slides
This PowerPoint template has been designed with dollar value pricing table chart. This PPT slide may be used for sample marketing proposal. Download this slide to build unique presentation.
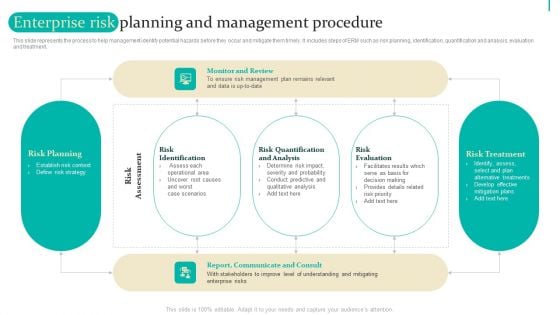
Enterprise Risk Management Enterprise Risk Planning And Management Procedure Information PDF
This slide represents the process to help management identify potential hazards before they occur and mitigate them timely. It includes steps of ERM such as risk planning, identification, quantification and analysis, evaluation and treatment. Are you in need of a template that can accommodate all of your creative concepts This one is crafted professionally and can be altered to fit any style. Use it with Google Slides or PowerPoint. Include striking photographs, symbols, depictions, and other visuals. Fill, move around, or remove text boxes as desired. Test out color palettes and font mixtures. Edit and save your work, or work with colleagues. Download Enterprise Risk Management Enterprise Risk Planning And Management Procedure Information PDF and observe how to make your presentation outstanding. Give an impeccable presentation to your group and make your presentation unforgettable.
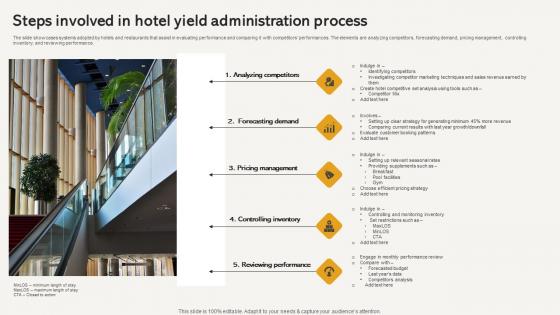
Steps Involved In Hotel Yield Administration Process Infographics Pdf
The slide showcases systems adopted by hotels and restaurants that assist in evaluating performance and comparing it with competitors performances. The elements are analyzing competitors, forecasting demand, pricing management, controlling inventory, and reviewing performance. Showcasing this set of slides titled Steps Involved In Hotel Yield Administration Process Infographics Pdf The topics addressed in these templates are Analyzing Competitors, Forecasting Demand, Pricing Management All the content presented in this PPT design is completely editable. Download it and make adjustments in color, background, font etc. as per your unique business setting. The slide showcases systems adopted by hotels and restaurants that assist in evaluating performance and comparing it with competitors performances. The elements are analyzing competitors, forecasting demand, pricing management, controlling inventory, and reviewing performance.
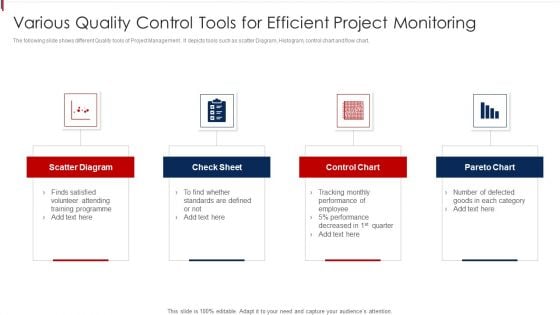
Various Quality Control Tools For Efficient Project Monitoring Demonstration PDF
The following slide shows different Quality tools of Project Management . It depicts tools such as scatter Diagram, Histogram, control chart and flow chart. Persuade your audience using this Various Quality Control Tools For Efficient Project Monitoring Demonstration PDF. This PPT design covers four stages, thus making it a great tool to use. It also caters to a variety of topics including Scatter Diagram, Check Sheet, Control Chart. Download this PPT design now to present a convincing pitch that not only emphasizes the topic but also showcases your presentation skills.
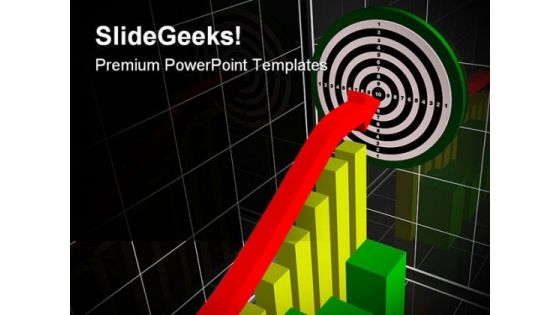
Performance Chart Business PowerPoint Templates And PowerPoint Backgrounds 0311
Microsoft PowerPoint Template and Background with business picture about analysis graph arrow and target Illustrate the essential elements of the project. Delve into the basic nature with our Performance Chart Business PowerPoint Templates And PowerPoint Backgrounds 0311.
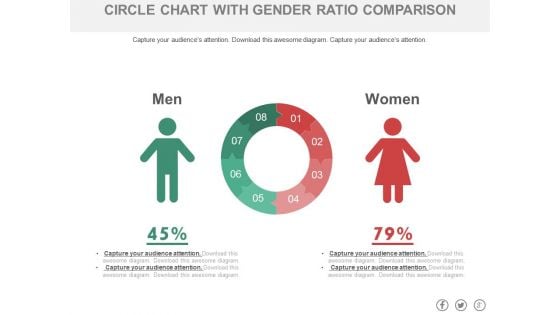
Circle Chart With Man And Woman Ratio Comparison Powerpoint Slides
This PowerPoint template has been designed with graphics of circle chart. You may download this PPT slide to depict man and woman ratio analysis. Add this slide to your presentation and impress your superiors.
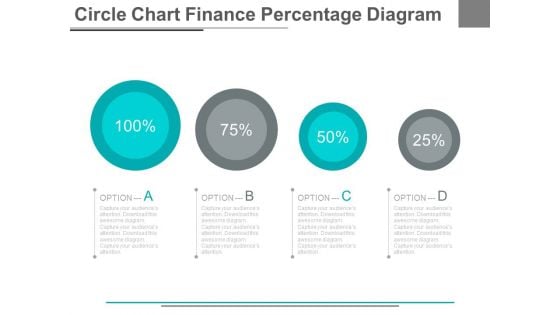
Four Options Circle Chart With Percentage Powerpoint Slides
This PowerPoint template has been designed with graphics of four options circle chart. This PowerPoint template may be used to display four steps of financial analysis. Prove the viability of your ideas using this impressive slide.
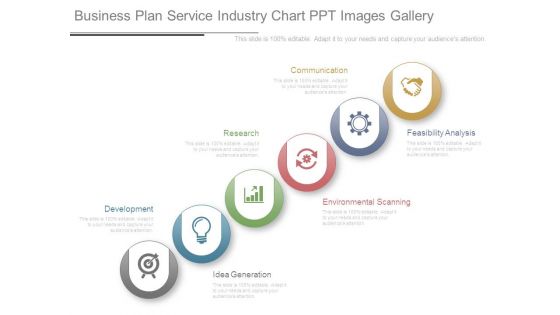
Business Plan Service Industry Chart Ppt Images Gallery
This is a business plan service industry chart ppt images gallery. This is a six stage process. The stages in this process are development, research, communication, idea generation, environmental scanning, feasibility analysis.
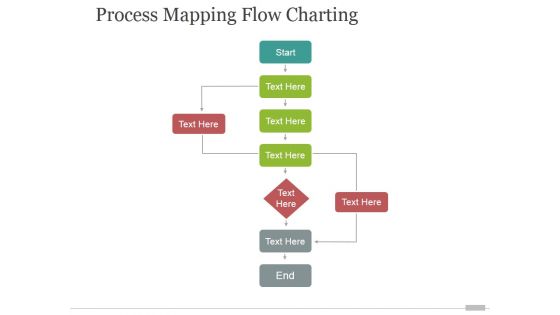
Process Mapping Flow Charting Ppt PowerPoint Presentation Designs Download
This is a process mapping flow charting ppt powerpoint presentation designs download. This is a three stage process. The stages in this process are business, process, management, analysis, success.
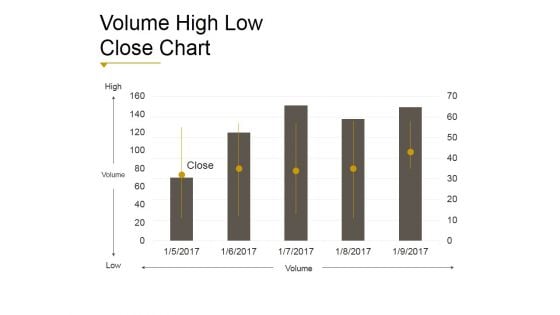
Volume High Low Close Chart Ppt PowerPoint Presentation Shapes
This is a volume high low close chart ppt powerpoint presentation shapes. This is a five stage process. The stages in this process are business, strategy, analysis, marketing, finance, growth.

High Low Close Chart Ppt PowerPoint Presentation Summary Ideas
This is a high low close chart ppt powerpoint presentation summary ideas. This is a five stage process. The stages in this process are business, strategy, marketing, analysis, growth.
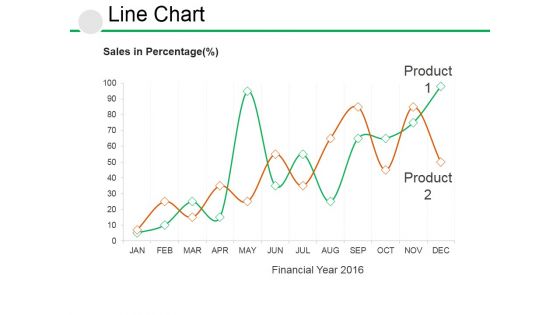
Line Chart Ppt PowerPoint Presentation Visual Aids Example File
This is a line chart ppt powerpoint presentation visual aids example file. This is a two stage process. The stages in this process are business, growth, strategy, analysis, management.
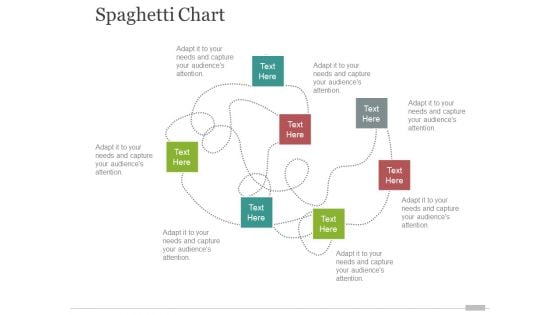
spaghetti chart template 2 ppt powerpoint presentation inspiration portfolio
This is a spaghetti chart template 2 ppt powerpoint presentation inspiration portfolio. This is a seven stage process. The stages in this process are business, marketing, management, analysis, strategy.
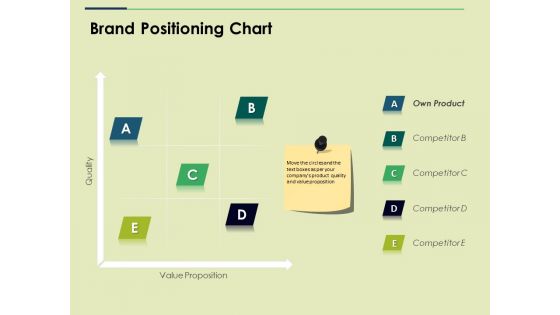
Brand Positioning Chart Ppt PowerPoint Presentation Show Example File
This is a brand positioning chart ppt powerpoint presentation show example file. This is a five stage process. The stages in this process are own product, business, marketing, strategy, analysis.
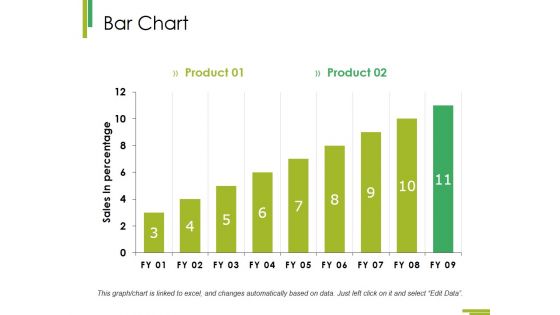
Bar Chart Ppt PowerPoint Presentation Infographic Template Master Slide
This is a bar chart ppt powerpoint presentation infographic template master slide. This is a two stage process. The stages in this process are growth, finance, business, analysis, marketing.
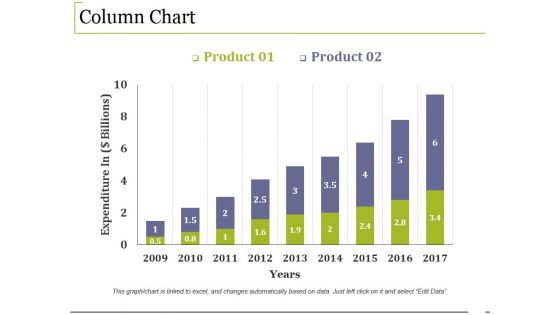
Column Chart Ppt PowerPoint Presentation Infographic Template Example File
This is a column chart ppt powerpoint presentation infographic template example file. This is a two stage process. The stages in this process are growth, finance, business, marketing, analysis.
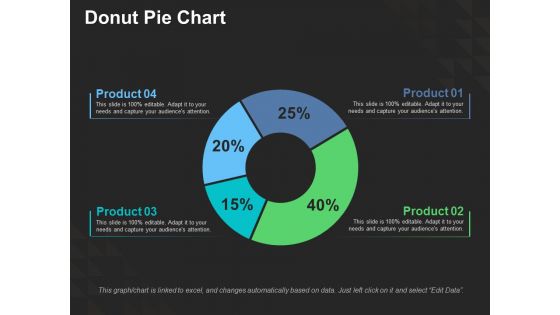
Donut Pie Chart Ppt PowerPoint Presentation Ideas Design Templates
This is a donut pie chart ppt powerpoint presentation ideas design templates. This is a four stage process. The stages in this process are analysis finance, investment, business, planning, marketing.
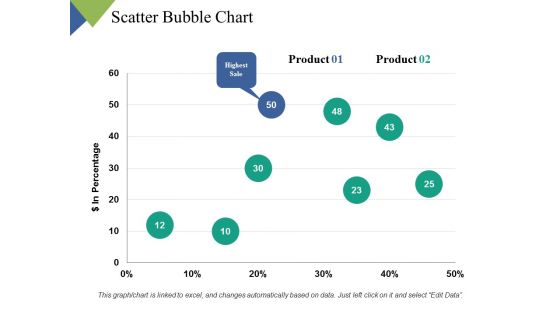
Scatter Bubble Chart Ppt PowerPoint Presentation Inspiration Graphics Tutorials
This is a scatter bubble chart ppt powerpoint presentation inspiration graphics tutorials. This is a two stage process. The stages in this process are finance, marketing, management, investment, analysis.
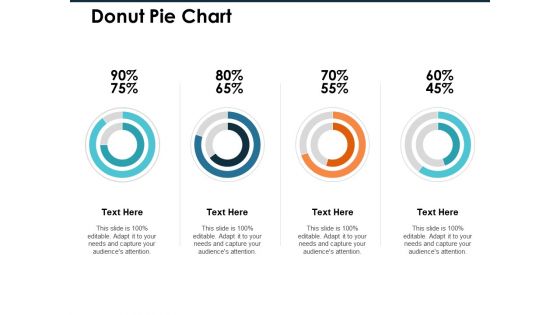
Donut Pie Chart Ppt PowerPoint Presentation Infographic Template Professional
This is a donut pie chart ppt powerpoint presentation infographic template professional. This is a four stage process. The stages in this process are finance, marketing, management, investment, analysis.
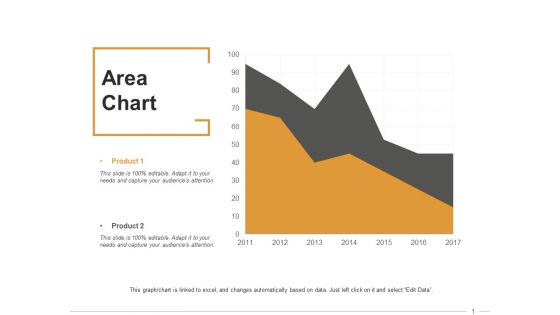
Area Chart Ppt PowerPoint Presentation Infographic Template Clipart Images
This is a area chart ppt powerpoint presentation infographic template clipart images. This is a two stage process. The stages in this process are finance, marketing, management, investment, analysis.
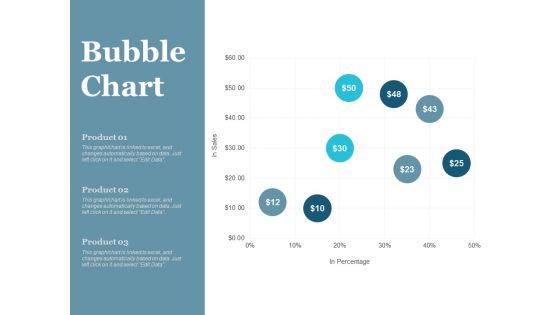
Bubble Chart Finance Ppt PowerPoint Presentation File Master Slide
This is a bubble chart finance ppt powerpoint presentation file master slide. This is a three stage process. The stages in this process are finance, marketing, management, investment, analysis.
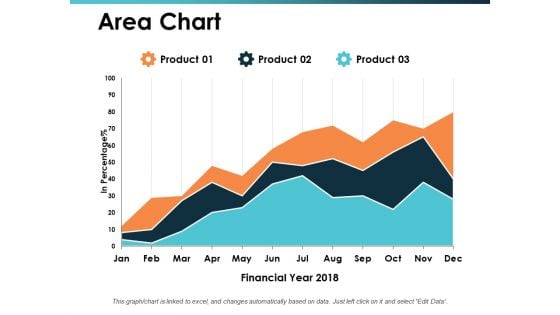
Area Chart Talent Mapping Ppt PowerPoint Presentation Ideas Vector
This is a area chart talent mapping ppt powerpoint presentation ideas vector. This is a three stage process. The stages in this process are business, management, strategy, analysis, marketing.
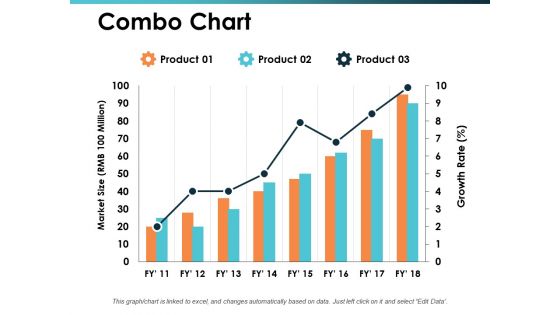
Combo Chart Talent Mapping Ppt PowerPoint Presentation Inspiration Display
This is a combo chart talent mapping ppt powerpoint presentation inspiration display. This is a three stage process. The stages in this process are business, management, strategy, analysis, marketing.
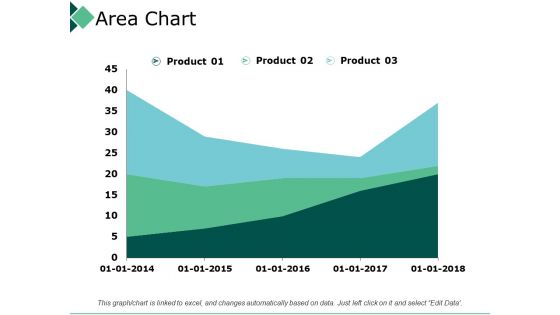
Area Chart Product Marketing Ppt PowerPoint Presentation Layouts Portfolio
This is a area chart product marketing ppt powerpoint presentation layouts portfolio. This is a three stage process. The stages in this process are business, management, strategy, analysis, marketing.
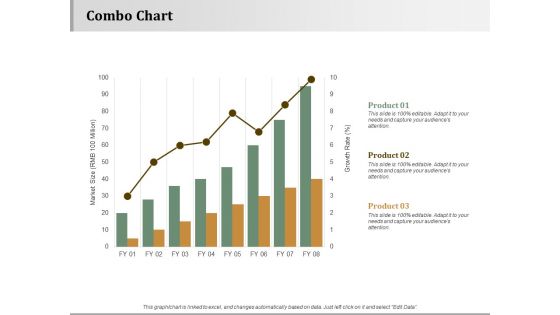
Combo Chart Strategy Approaches Ppt PowerPoint Presentation Inspiration Layout Ideas
This is a combo chart strategy approaches ppt powerpoint presentation inspiration layout ideas. This is a three stage process. The stages in this process are business, management, strategy, analysis, marketing.
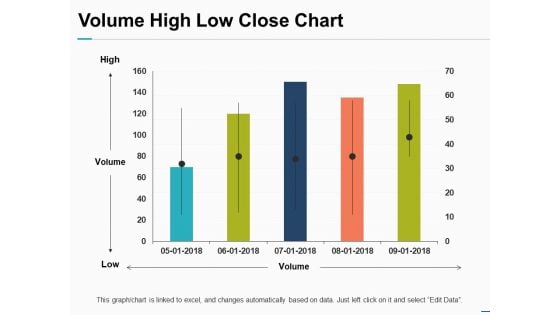
Volume High Low Close Chart Ppt PowerPoint Presentation Pictures Objects
This is a volume high low close chart ppt powerpoint presentation pictures objects. This is a one stage process. The stages in this process are finance, marketing, management, investment, analysis.
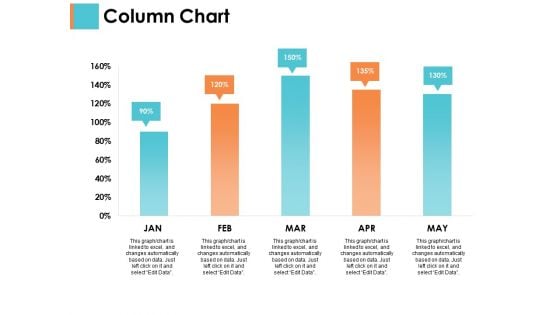
Column Chart Sample Budget Ppt Ppt PowerPoint Presentation Infographics Brochure
This is a column chart sample budget ppt ppt powerpoint presentation infographics brochure. This is a two stage process. The stages in this process are business, management, strategy, analysis, marketing.
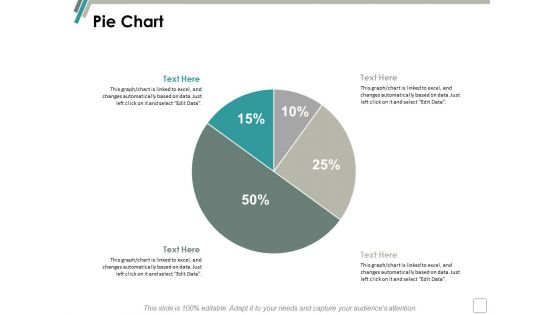
Pie Chart Finance Marketing Ppt Powerpoint Presentation Infographics Background
This is a pie chart finance marketing ppt powerpoint presentation infographics background. This is a two stage process. The stages in this process are finance, marketing, management, investment, analysis.
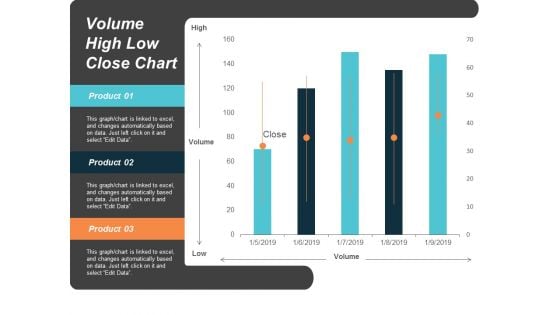
Volume High Low Close Chart Ppt Powerpoint Presentation Slides Images
This is a volume high low close chart ppt powerpoint presentation slides images. This is a five stage process. The stages in this process are finance, marketing, management, investment, analysis.

Area Chart Finance Marketing Ppt Powerpoint Presentation Gallery Slides
This is a area chart finance marketing ppt powerpoint presentation gallery slides. This is a three stage process. The stages in this process are finance, marketing, management, investment, analysis.
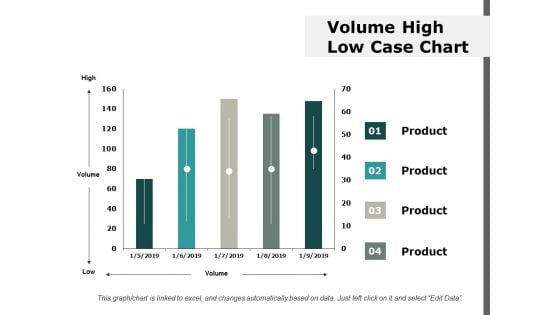
Volume High Low Case Chart Ppt Powerpoint Presentation Ideas Information
This is a volume high low case chart ppt powerpoint presentation ideas information. This is a four stage process. The stages in this process are finance, marketing, management, investment, analysis.
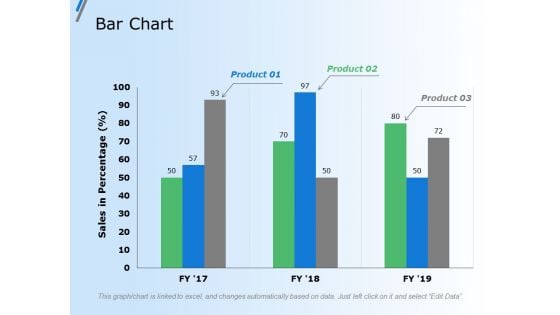
Bar Chart Finance Marketing Ppt Powerpoint Presentation Gallery Grid
This is a bar chart finance marketing ppt powerpoint presentation gallery grid. This is a three stage process. The stages in this process are finance, marketing, management, investment, analysis.
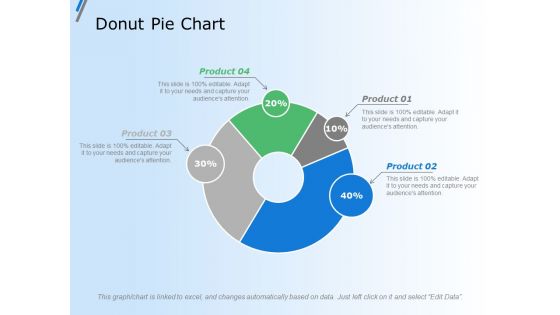
Donut Pie Chart Finance Ppt Powerpoint Presentation Outline Vector
This is a donut pie chart finance ppt powerpoint presentation outline vector. This is a four stage process. The stages in this process are finance, marketing, management, investment, analysis.
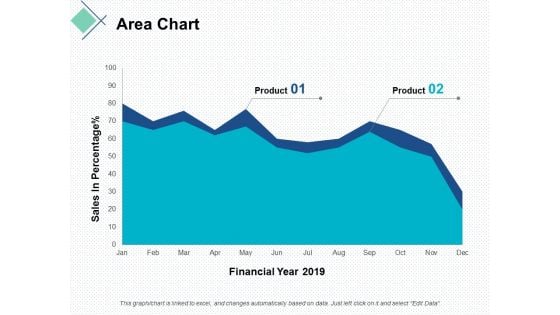
area chart finance ppt powerpoint presentation portfolio graphics download
This is a area chart finance ppt powerpoint presentation portfolio graphics download. This is a two stage process. The stages in this process are finance, marketing, management, investment, analysis.

Pie Chart Finance Ppt Powerpoint Presentation Layouts Design Ideas
This is a pie chart finance ppt powerpoint presentation layouts design ideas. This is a four stage process. The stages in this process are finance, marketing, management, investment, analysis.
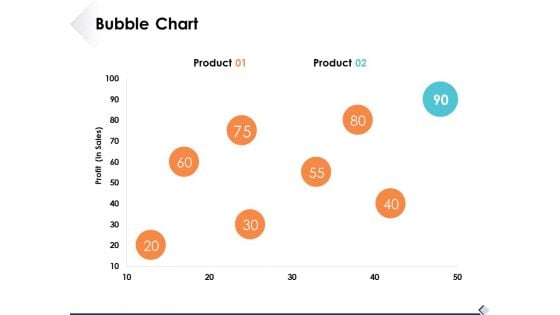
Bubble Chart Marketing Business Ppt PowerPoint Presentation Model Sample
This is a bubble chart marketing business ppt powerpoint presentation model sample. This is a two stage process. The stages in this process are finance, business, management, strategy, analysis.
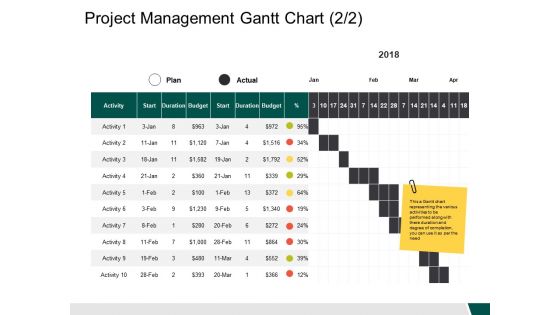
Project Management Gantt Chart Activity Ppt PowerPoint Presentation Inspiration Samples
This is a project management gantt chart activity ppt powerpoint presentation inspiration samples. This is a ten stage process. The stages in this process are business, management, strategy, analysis, marketing.

Donut Pie Chart Finance Ppt PowerPoint Presentation Portfolio Model
This is a donut pie chart finance ppt powerpoint presentation portfolio model. This is a three stage process. The stages in this process are finance, management, strategy, analysis, marketing.
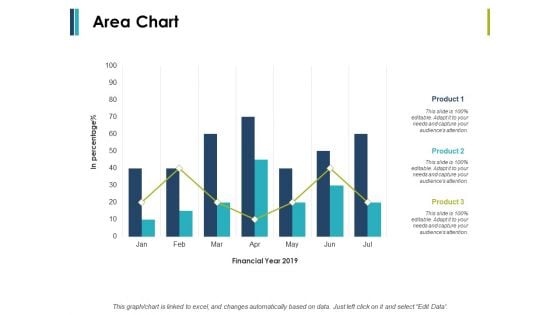
Area Chart Finance Ppt PowerPoint Presentation Infographic Template Model
This is a area chart finance ppt powerpoint presentation infographic template model. This is a two stage process. The stages in this process are finance, marketing, management, investment, analysis.
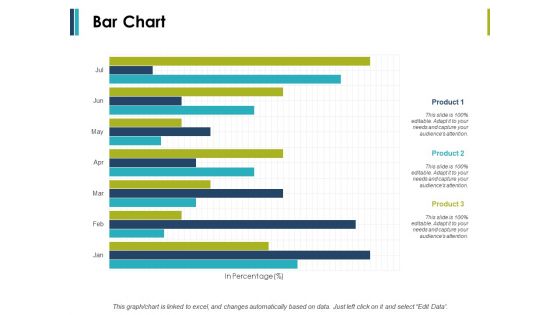
Bar Chart Business Management Ppt PowerPoint Presentation Ideas Example Introduction
This is a bar chart business management ppt powerpoint presentation ideas example introduction. This is a three stage process. The stages in this process are finance, marketing, management, investment, analysis.


 Continue with Email

 Home
Home


