Survey Themes

Us Nation Is Best In Unity PowerPoint Templates Ppt Backgrounds For Slides 0713
Draw the debate to a close. Arrive at conclusions with our US Nation Is Best In Unity PowerPoint Templates PPT Backgrounds For Slides. Make your dreams a reality with our Leadership PowerPoint Templates. Your ideas will begin to take shape. Breathe life into your dreams with our Business PowerPoint Templates. Give your thoughts a tangible form. Give credit where its due. Just download, type and present.
Follow The Right Path For Success Business PowerPoint Templates Ppt Backgrounds For Slides 0713
Draw the debate to a close. Arrive at conclusions with our Follow The Right Path For Success Business PowerPoint Templates PPT Backgrounds For Slides. Make your dreams a reality with our Arrows PowerPoint Templates. Your ideas will begin to take shape. Breathe life into your dreams with our People PowerPoint Templates. Give your thoughts a tangible form. Let your ideas acquire a flourish. Our PT&s will ensure they blossom.
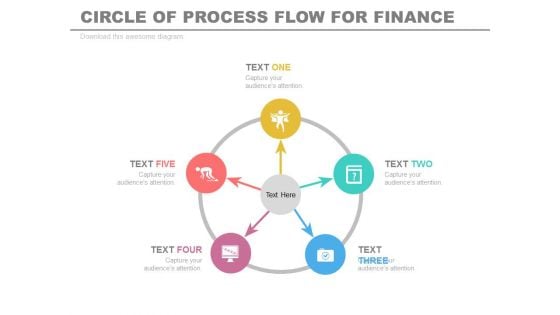
Five Steps Circular Infographics Diagram Powerpoint Template
This PowerPoint template has been designed with circular infographic diagram. This Infographic diagram may be used for business process analysis. Download this impressive diagram to build unique presentations.
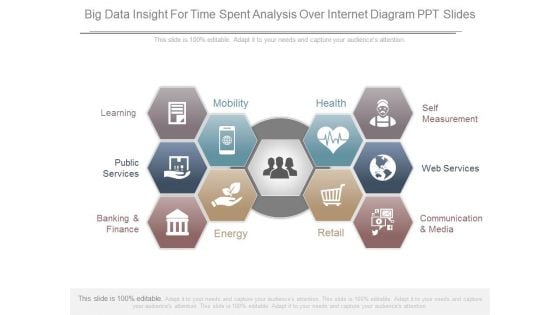
Big Data Insight For Time Spent Analysis Over Internet Diagram Ppt Slides
This is a big data insight for time spent analysis over internet diagram ppt slides. This is a ten stage process. The stages in this process are learning, public services, banking and finance, energy, mobility, health, retail, communication and media, web services, self measurement.
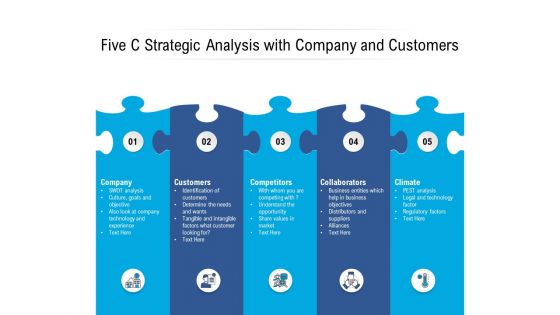
Five C Strategic Analysis With Company And Customers Ppt PowerPoint Presentation Layouts Diagrams PDF
Presenting this set of slides with name five c strategic analysis with company and customers ppt powerpoint presentation layouts diagrams pdf. This is a five stage process. The stages in this process are company, customers, competitors, collaborators, climate. This is a completely editable PowerPoint presentation and is available for immediate download. Download now and impress your audience.
Fishbone Ishikawa Cause And Effect Analysis Idea Generation Ppt PowerPoint Presentation Layouts Diagrams PDF
Presenting this set of slides with name fishbone ishikawa cause and effect analysis idea generation ppt powerpoint presentation layouts diagrams pdf. This is a four stage process. The stages in this process are idea generation. This is a completely editable PowerPoint presentation and is available for immediate download. Download now and impress your audience.
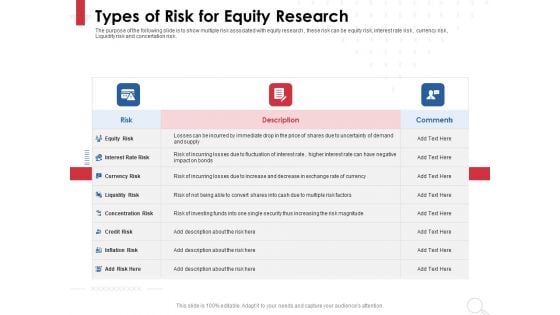
Equity Analysis Project Types Of Risk For Equity Research Ppt PowerPoint Presentation Infographics Diagrams PDF
Presenting this set of slides with name equity analysis project types of risk for equity research ppt powerpoint presentation infographics diagrams pdf. The topics discussed in these slides are equity risk, interest rate risk, currency risk, liquidity risk, concentration risk, credit risk . This is a completely editable PowerPoint presentation and is available for immediate download. Download now and impress your audience.
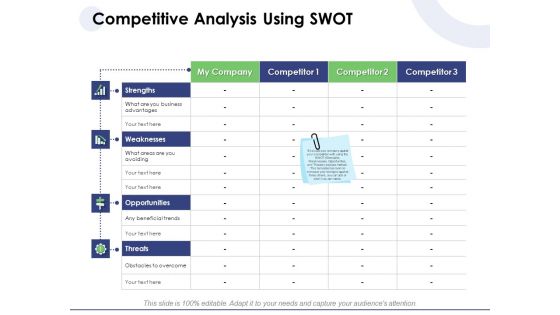
Macro And Micro Marketing Planning And Strategies Competitive Analysis Using SWOT Diagrams PDF
Presenting this set of slides with name macro and micro marketing planning and strategies competitive analysis using swot diagrams pdf. The topics discussed in these slides are strengths, threats, weaknesses, opportunities. This is a completely editable PowerPoint presentation and is available for immediate download. Download now and impress your audience.
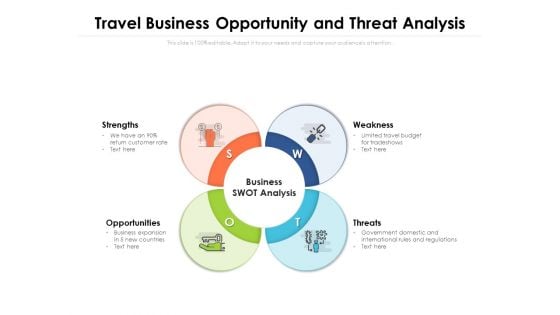
Travel Business Opportunity And Threat Analysis Ppt PowerPoint Presentation Gallery Diagrams PDF
Presenting this set of slides with name travel business opportunity and threat analysis ppt powerpoint presentation gallery diagrams pdf. This is a four stage process. The stages in this process are strengths, opportunities, weakness. This is a completely editable PowerPoint presentation and is available for immediate download. Download now and impress your audience.
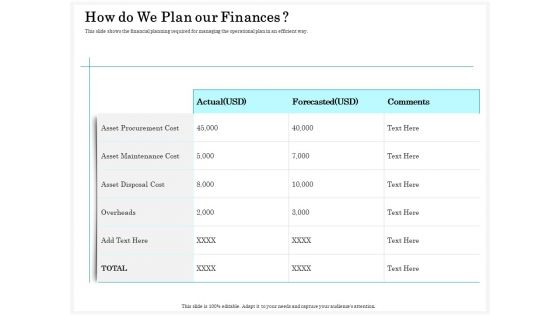
Application Life Cycle Analysis Capital Assets How Do We Plan Our Finances Diagrams PDF
Presenting this set of slides with name application life cycle analysis capital assets how do we plan our finances diagrams pdf. The topics discussed in these slides are asset, procurement, cost, maintenance, actual. This is a completely editable PowerPoint presentation and is available for immediate download. Download now and impress your audience.
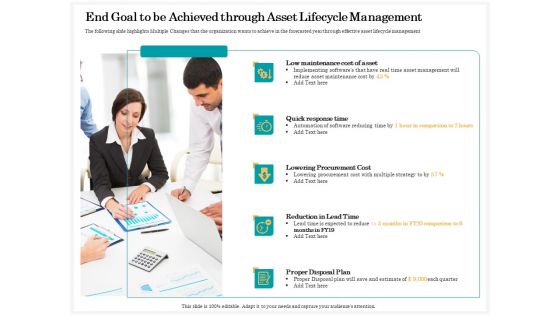
Application Life Cycle Analysis Capital End Goal To Be Achieved Through Asset Lifecycle Management Diagrams PDF
Presenting this set of slides with name application life cycle analysis capital end goal to be achieved through asset lifecycle management diagrams pdf. This is a five stage process. The stages in this process are maintenance, cost, procurement, plan, reduction. This is a completely editable PowerPoint presentation and is available for immediate download. Download now and impress your audience.
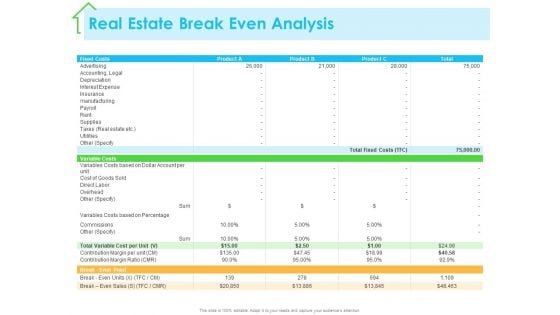
Real Estate Development Real Estate Break Even Analysis Ppt PowerPoint Presentation Diagram Templates PDF
Presenting this set of slides with name real estate development real estate break even analysis ppt powerpoint presentation diagram templates pdf. The topics discussed in these slides are fixed costs, advertising, interest expense, insurance, manufacturing. This is a completely editable PowerPoint presentation and is available for immediate download. Download now and impress your audience.
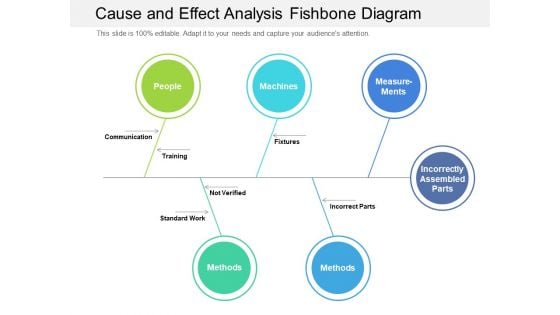
Cause And Effect Analysis Fishbone Diagram Ppt PowerPoint Presentation Gallery Designs PDF
Presenting this set of slides with name cause and effect analysis fishbone diagram ppt powerpoint presentation gallery designs pdf. This is a five stage process. The stages in this process are communication, training, fixtures. This is a completely editable PowerPoint presentation and is available for immediate download. Download now and impress your audience.
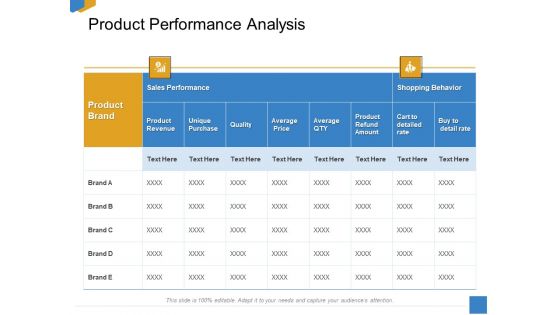
Effective Outcome Launch Roadmap Product Performance Analysis Ppt Pictures Diagrams PDF
Presenting this set of slides with name effective outcome launch roadmap product performance analysis ppt pictures diagrams pdf. The topics discussed in these slides are product revenue, unique purchase, quality, average price, average qty, product refund amount. This is a completely editable PowerPoint presentation and is available for immediate download. Download now and impress your audience.
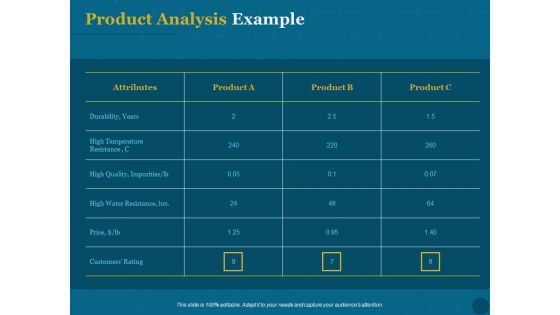
Product Portfolio Management For New Product Development Product Analysis Example Diagrams PDF
Presenting this set of slides with name product portfolio management for new product development product analysis example diagrams pdf. The topics discussed in these slides are attributes, product, customers rating, price. This is a completely editable PowerPoint presentation and is available for immediate download. Download now and impress your audience.
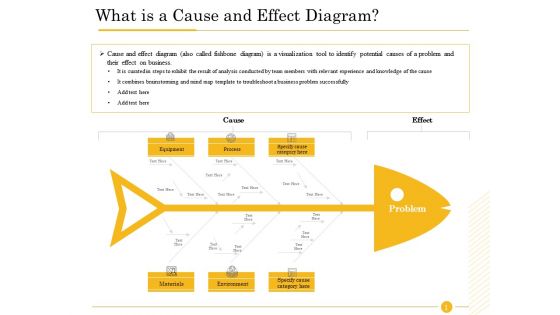
The Fishbone Analysis Tool What Is A Cause And Effect Diagram Guidelines PDF
Deliver an awe-inspiring pitch with this creative the fishbone analysis tool what is a cause and effect diagram guidelines pdf bundle. Topics like equipment, process, specify cause category, materials, environment, combines brainstorming mind map, business problem successfully can be discussed with this completely editable template. It is available for immediate download depending on the needs and requirements of the user.
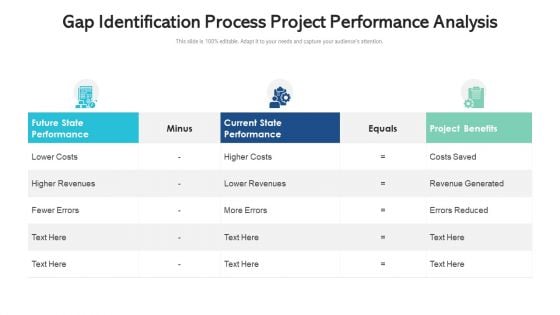
Gap Identification Process Project Performance Analysis Ppt Visual Aids Diagrams PDF
Pitch your topic with ease and precision using this gap identification process project performance analysis ppt visual aids diagrams pdf. This layout presents information on future state performance, current state performance, project benefits. It is also available for immediate download and adjustment. So, changes can be made in the color, design, graphics or any other component to create a unique layout.
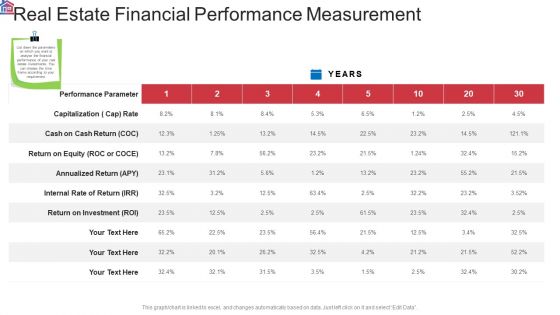
Market Research Analysis Of Housing Sector Real Estate Financial Performance Measurement Diagrams PDF
Deliver an awe inspiring pitch with this creative market research analysis of housing sector real estate financial performance measurement diagrams pdf bundle. Topics like performance parameter, capitalization, return on investment, cash on cash return can be discussed with this completely editable template. It is available for immediate download depending on the needs and requirements of the user.
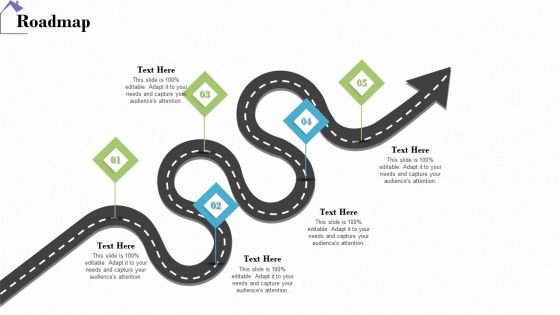
Industry Analysis Of Real Estate And Construction Sector Roadmap Diagrams PDF
This is a industry analysis of real estate and construction sector roadmap diagrams pdf template with various stages. Focus and dispense information on five stages using this creative set, that comes with editable features. It contains large content boxes to add your information on topics like roadmap. You can also showcase facts, figures, and other relevant content using this PPT layout. Grab it now.
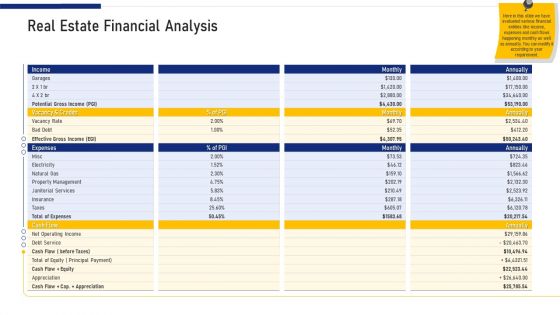
Real Estate Business Real Estate Financial Analysis Ppt Diagram Lists PDF
Deliver and pitch your topic in the best possible manner with this real estate business real estate financial analysis ppt diagram lists pdf. Use them to share invaluable insights on property management, net operating income, vacancy and credits and impress your audience. This template can be altered and modified as per your expectations. So, grab it now.
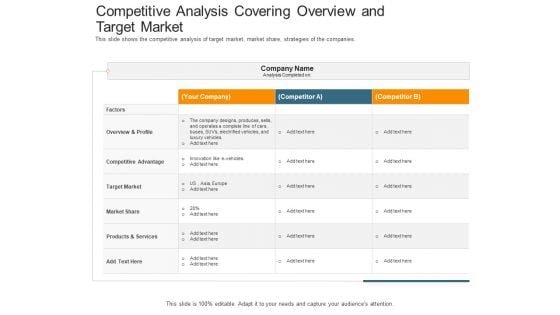
Pitch Deck Raise Capital Interim Financing Investments Competitive Analysis Covering Overview And Target Market Diagrams PDF
Deliver an awe inspiring pitch with this creative pitch deck raise capital interim financing investments competitive analysis covering overview and target market diagrams pdf bundle. Topics like overview and profile, competitive advantage, target market can be discussed with this completely editable template. It is available for immediate download depending on the needs and requirements of the user.
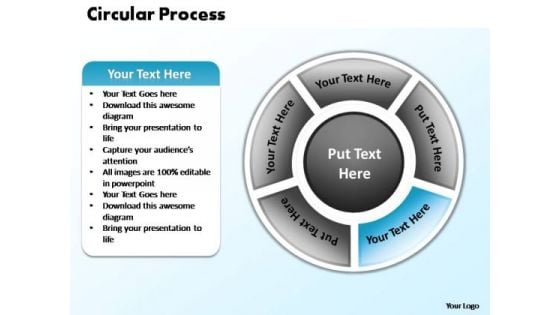
PowerPoint Slides Global Circular Process Ppt Design
PowerPoint Slides Global Circular Process PPT Design-Highlight the key components of your entire manufacturing/ business process. Illustrate how each element flows seamlessly onto the next stage. Emphasise on any critical or key factors within them. Demonstrate how they all combine to form the final product.-PowerPoint Slides Global Circular Process PPT Design Get your audience all activated to go. Emit exhilirating energy with our PowerPoint Slides Global Circular Process Ppt Design.
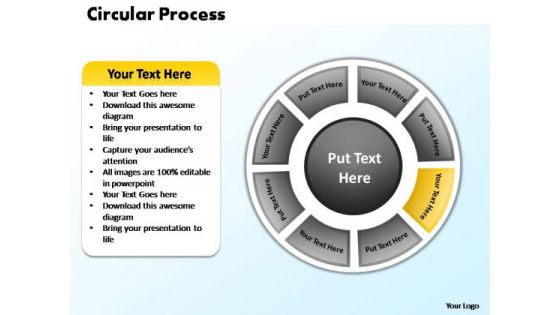
PowerPoint Slides Growth Circular Process Ppt Presentation
PowerPoint Slides Growth Circular Process PPT Presentation-Highlight the key components of your entire manufacturing/ business process. Illustrate how each element flows seamlessly onto the next stage. Emphasise on any critical or key factors within them. Demonstrate how they all combine to form the final product.-PowerPoint Slides Growth Circular Process PPT Presentation Target your audience with our PowerPoint Slides Growth Circular Process Ppt Presentation. Download without worries with our money back guaranteee.
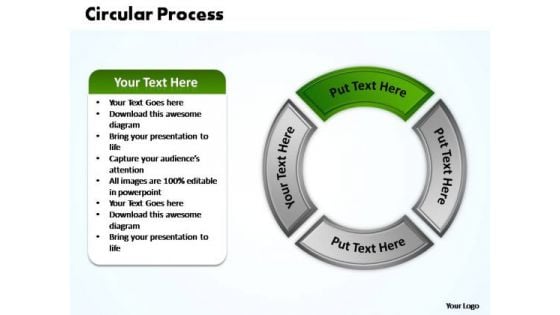
PowerPoint Slides Process Circular Process Ppt Templates
PowerPoint Slides Process Circular Process PPT Templates-Highlight the key components of your entire manufacturing/ business process. Illustrate how each element flows seamlessly onto the next stage. Emphasise on any critical or key factors within them. Demonstrate how they all combine to form the final product.-PowerPoint Slides Process Circular Process PPT Templates Cash in with our PowerPoint Slides Process Circular Process Ppt Templates. You will prove commercially astute.
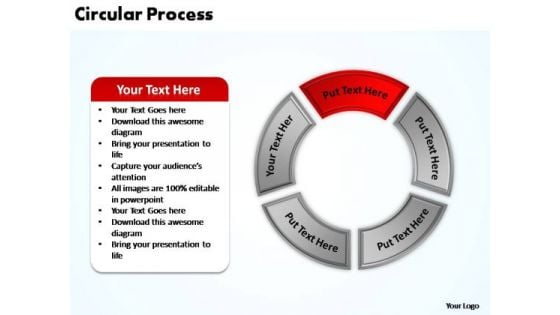
PowerPoint Slides Sales Circular Process Ppt Presentation
PowerPoint Slides Sales Circular Process PPT Presentation-Highlight the key components of your entire manufacturing/ business process. Illustrate how each element flows seamlessly onto the next stage. Emphasise on any critical or key factors within them. Demonstrate how they all combine to form the final product.-PowerPoint Slides Sales Circular Process PPT Presentation Convincing an audience is no mean feat. Do it with ease with our PowerPoint Slides Sales Circular Process Ppt Presentation.
PowerPoint Slides Strategy Circular Process Ppt Layouts
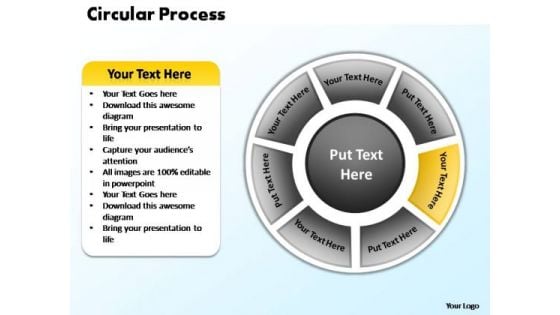
PowerPoint Slides Strategy Circular Process PPT Layouts-Highlight the key components of your entire manufacturing/ business process. Illustrate how each element flows seamlessly onto the next stage. Emphasise on any critical or key factors within them. Demonstrate how they all combine to form the final product.-PowerPoint Slides Strategy Circular Process PPT Layouts Get the dynamics correct with our PT&s. Your thoughts will initiate the right moves.
PowerPoint Template Company Circular Arrow Ppt Backgrounds
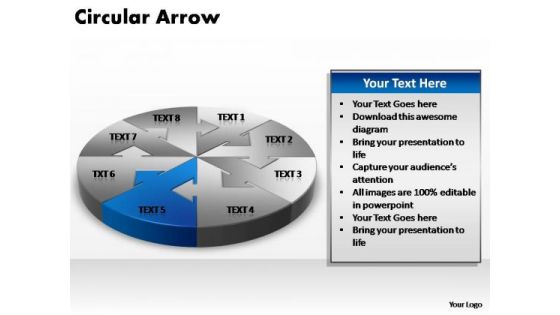
PowerPoint Template Company Circular Arrow PPT Backgrounds-The arrows indicate the progression of the process. Constant monitoring of the processes provides you with opportunities to concentrate on the core competencies in your business and improve the standards for more effective results.-PowerPoint Template Company Circular Arrow PPT Backgrounds Form great presentations with our PowerPoint Template Company Circular Arrow Ppt Backgrounds. Try us out and see what a difference our templates make.
PowerPoint Template Editable Circular Process Ppt Backgrounds
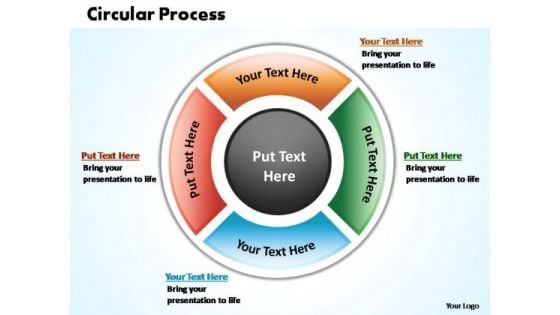
PowerPoint Template Editable Circular Process PPT Backgrounds-Highlight the key components of your entire manufacturing/ business process. Illustrate how each element flows seamlessly onto the next stage. Emphasise on any critical or key factors within them. Demonstrate how they all combine to form the final product.-PowerPoint Template Editable Circular Process PPT Backgrounds Connect the dots differently. Be daring with our PowerPoint Template Editable Circular Process Ppt Backgrounds.
PowerPoint Template Graphic Circular Process Ppt Designs
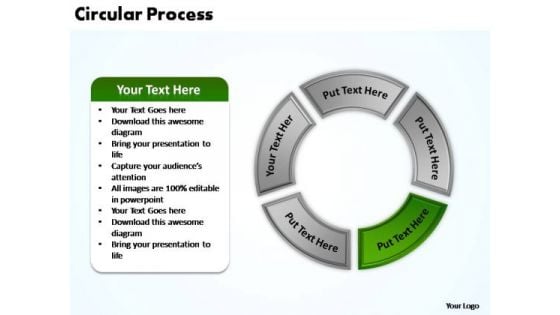
PowerPoint Template Graphic Circular Process PPT Designs-Highlight the key components of your entire manufacturing/ business process. Illustrate how each element flows seamlessly onto the next stage. Emphasise on any critical or key factors within them. Demonstrate how they all combine to form the final product.-PowerPoint Template Graphic Circular Process PPT Designs Give the gift of career growth with our PowerPoint Template Graphic Circular Process Ppt Designs. Dont waste time struggling with PowerPoint. Let us do it for you.
Business Activity Diagram 3d Person With Umbrella Green And Question Mark PowerPoint Slides
We present our business activity diagram 3d person with umbrella green and question mark PowerPoint Slides.Download our Finance PowerPoint Templates because Our PowerPoint Templates and Slides are conceived by a dedicated team. Use them and give form to your wondrous ideas. Download and present our Business PowerPoint Templates because Our PowerPoint Templates and Slides help you meet the demand of the Market. Just browse and pick the slides that appeal to your intuitive senses. Download and present our Shapes PowerPoint Templates because Our PowerPoint Templates and Slides are Clear and concise. Use them and dispel any doubts your team may have. Use our Symbol PowerPoint Templates because Our PowerPoint Templates and Slides will embellish your thoughts. See them provide the desired motivation to your team. Download our Umbrellas PowerPoint Templates because Our PowerPoint Templates and Slides come in all colours, shades and hues. They help highlight every nuance of your views.Use these PowerPoint slides for presentations relating to 3d, Background, Characters, Concepts, Confusion, Discovery, Finances, Frequently, Hand, Human, Illustration, Image, Incredulity, Inspiration, Liquid, Male, Mark, Objects, Overcast, Person, Problems, Questions, Rain, Raindrop, Reflection, Render, Shape, Sign, Single, Storm, Symbol, Three-Dimensional, Umbrella, Uncertainty, Weather, Wet, White, Worker. The prominent colors used in the PowerPoint template are Green, Black, White. Presenters tell us our business activity diagram 3d person with umbrella green and question mark PowerPoint Slides are incredible easy to use. PowerPoint presentation experts tell us our Concepts PowerPoint templates and PPT Slides are the best it can get when it comes to presenting. Professionals tell us our business activity diagram 3d person with umbrella green and question mark PowerPoint Slides will help them to explain complicated concepts. People tell us our Finances PowerPoint templates and PPT Slides will get their audience's attention. The feedback we get is that our business activity diagram 3d person with umbrella green and question mark PowerPoint Slides look good visually. Customers tell us our Confusion PowerPoint templates and PPT Slides will help you be quick off the draw. Just enter your specific text and see your points hit home. Exhibit your faith on our Business Activity Diagram 3d Person With Umbrella Green And Question Mark PowerPoint Slides. Your audience will believe in you.
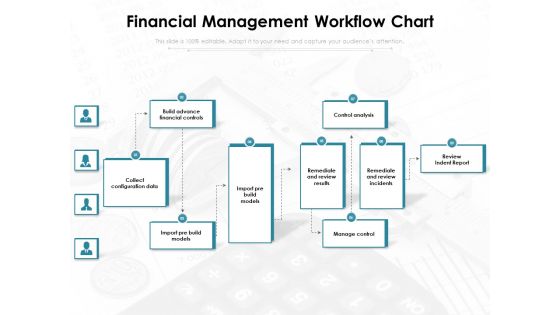
Financial Management Workflow Chart Ppt PowerPoint Presentation Infographics Mockup PDF
Presenting this set of slides with name financial management workflow chart ppt powerpoint presentation infographics mockup pdf. This is a nine stage process. The stages in this process are build advance financial controls, control analysis review, indent report remediate and review incidents, remediate and review results, import pre build models, import pre build models, collect configuration data, manage control. This is a completely editable PowerPoint presentation and is available for immediate download. Download now and impress your audience.
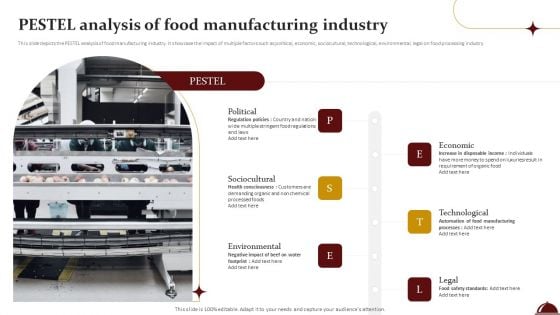
Food Processing Industry Latest Insights Trends And Analytics Pestel Analysis Of Food Manufacturing Industry Diagrams PDF
This slide depicts the PESTEL analysis of food manufacturing industry. It showcase the impact of multiple factors such as political, economic, sociocultural, technological, environmental, legal on food processing industry. Get a simple yet stunning designed Food Processing Industry Latest Insights Trends And Analytics Pestel Analysis Of Food Manufacturing Industry Diagrams PDF. It is the best one to establish the tone in your meetings. It is an excellent way to make your presentations highly effective. So, download this PPT today from Slidegeeks and see the positive impacts. Our easy to edit Food Processing Industry Latest Insights Trends And Analytics Pestel Analysis Of Food Manufacturing Industry Diagrams PDF can be your go to option for all upcoming conferences and meetings. So, what are you waiting for Grab this template today.
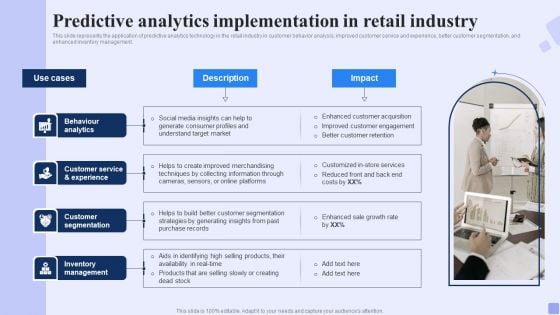
Predictive Analytics Implementation In Retail Industry Forward Looking Analysis IT Diagrams PDF
This slide represents the application of predictive analytics technology in the retail industry in customer behavior analysis, improved customer service and experience, better customer segmentation, and enhanced inventory management.Formulating a presentation can take up a lot of effort and time, so the content and message should always be the primary focus. The visuals of the PowerPoint can enhance the presenters message, so our Predictive Analytics Implementation In Retail Industry Forward Looking Analysis IT Diagrams PDF was created to help save time. Instead of worrying about the design, the presenter can concentrate on the message while our designers work on creating the ideal templates for whatever situation is needed. Slidegeeks has experts for everything from amazing designs to valuable content, we have put everything into Predictive Analytics Implementation In Retail Industry Forward Looking Analysis IT Diagrams PDF.
Pipeline Management To Evaluate Comparative Analysis Of Sales Tracking Software Diagrams PDF
This slide shows the comparative analysis of sales tracking software which includes features such as lead nurturing and scoring, automated tasks, customizable pipeline, etc Formulating a presentation can take up a lot of effort and time, so the content and message should always be the primary focus. The visuals of the PowerPoint can enhance the presenters message, so our Pipeline Management To Evaluate Comparative Analysis Of Sales Tracking Software Diagrams PDF was created to help save time. Instead of worrying about the design, the presenter can concentrate on the message while our designers work on creating the ideal templates for whatever situation is needed. Slidegeeks has experts for everything from amazing designs to valuable content, we have put everything into Pipeline Management To Evaluate Comparative Analysis Of Sales Tracking Software Diagrams PDF.
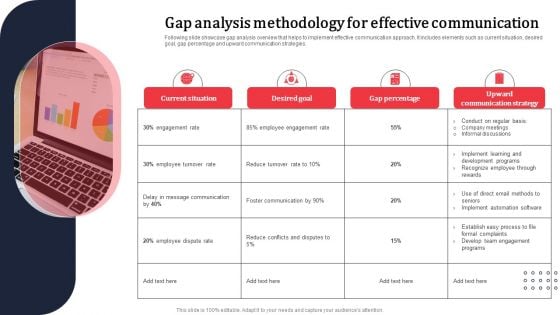
Gap Analysis Methodology For Effective Communication Ppt PowerPoint Presentation Diagram Lists PDF
Following slide showcase gap analysis overview that helps to implement effective communication approach. It includes elements such as current situation, desired goal, gap percentage and upward communication strategies. Find highly impressive Gap Analysis Methodology For Effective Communication Ppt PowerPoint Presentation Diagram Lists PDF on Slidegeeks to deliver a meaningful presentation. You can save an ample amount of time using these presentation templates. No need to worry to prepare everything from scratch because Slidegeeks experts have already done a huge research and work for you. You need to download Gap Analysis Methodology For Effective Communication Ppt PowerPoint Presentation Diagram Lists PDF for your upcoming presentation. All the presentation templates are 100 percent editable and you can change the color and personalize the content accordingly. Download now.
Devops Continuous Workflow Tracking Dashboard Slides PDF
This slide provides the glimpse of facts and figures related to continuous monitoring of project with DevOps. It includes planned vs. completed work items, work item priority wise, active bugs severity wise, etc. Showcasing this set of slides titled Devops Continuous Workflow Tracking Dashboard Slides PDF. The topics addressed in these templates are Continuous Workflow, Tracking Dashboard, Sprint Analysis By Assignee. All the content presented in this PPT design is completely editable. Download it and make adjustments in color, background, font etc. as per your unique business setting.
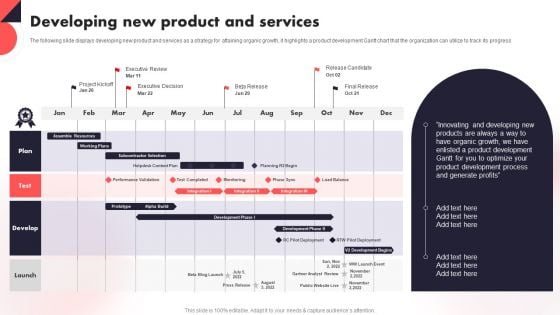
Developing New Product And Services Year Over Year Business Success Playbook Background PDF
The following slide displays developing new product and services as a strategy for attaining organic growth, it highlights a product development Gantt chart that the organization can utilize.Here you can discover an assortment of the finest PowerPoint and Google Slides templates. With these templates, you can create presentations for a variety of purposes while simultaneously providing your audience with an eye-catching visual experience. Download Developing New Product And Services Year Over Year Business Success Playbook Background PDF to deliver an impeccable presentation. These templates will make your job of preparing presentations much quicker, yet still, maintain a high level of quality. Slidegeeks has experienced researchers who prepare these templates and write high-quality content for you. Later on, you can personalize the content by editing the Developing New Product And Services Year Over Year Business Success Playbook Background PDF.
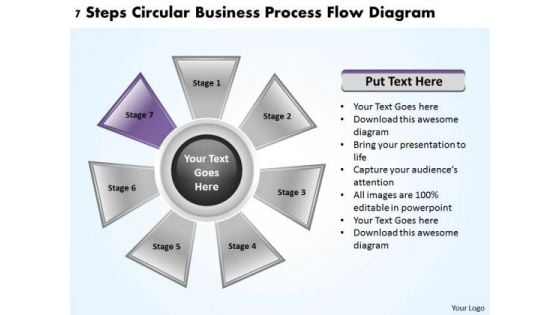
Business Process Strategy 7 Steps Circular Flow Diagram PowerPoint
We present our business process strategy 7 steps circular flow diagram Powerpoint.Use our Success PowerPoint Templates because Your audience will believe you are the cats whiskers. Use our Business PowerPoint Templates because Our PowerPoint Templates and Slides offer you the needful to organise your thoughts. Use them to list out your views in a logical sequence. Present our Process and Flows PowerPoint Templates because you should once Tap the ingenuity of our PowerPoint Templates and Slides. They are programmed to succeed. Use our Shapes PowerPoint Templates because You canTake a leap off the starting blocks with our PowerPoint Templates and Slides. They will put you ahead of the competition in quick time. Use our Signs PowerPoint Templates because Our PowerPoint Templates and Slides will provide you a launch platform. Give a lift off to your ideas and send them into orbit.Use these PowerPoint slides for presentations relating to Art, Business, Chart, Circle, Collection, Color, Colorful, Concept, Control, Creative, Cycle, Design, Development, Diagram, Element, Evaluate, Flow, Flowchart, Graphic, Idea, Info Graphic, Iterative, Life, Life-Cycle, Management, Method, Model, Palette, Place, Process, Quality, Rainbow, Research, Retro, Schema, Sign, Software, Spectrum, Step, Strategy, Success, System, Template. The prominent colors used in the PowerPoint template are Purple, Gray, Black. Show direct & decisive organizational leadership with our Business Process Strategy 7 Steps Circular Flow Diagram PowerPoint. They will make you look good.
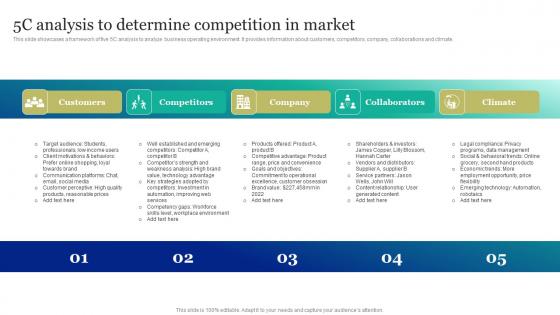
5c Analysis To Determine Competition Marketing And Promotion Automation Background Pdf
This slide showcases a framework of five 5C analysis to analyze business operating environment. It provides information about customers, competitors, company, collaborations and climate.Boost your pitch with our creative 5c Analysis To Determine Competition Marketing And Promotion Automation Background Pdf. Deliver an awe-inspiring pitch that will mesmerize everyone. Using these presentation templates you will surely catch everyones attention. You can browse the ppts collection on our website. We have researchers who are experts at creating the right content for the templates. So you do not have to invest time in any additional work. Just grab the template now and use them. This slide showcases a framework of five 5C analysis to analyze business operating environment. It provides information about customers, competitors, company, collaborations and climate.
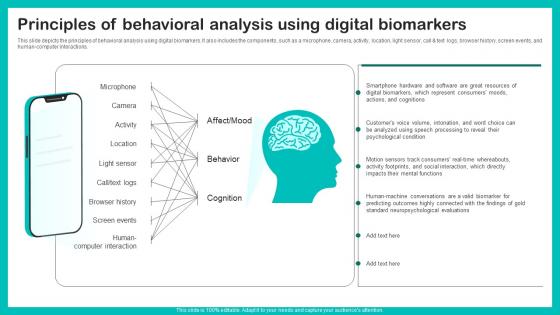
Principles Of Behavioral Analysis Digital Biomarkers For Personalized Health Insights Background Pdf
This slide depicts the principles of behavioral analysis using digital biomarkers. It also includes the components, such as a microphone, camera, activity, location, light sensor, call and text logs, browser history, screen events, and human computer interactions. Slidegeeks has constructed Principles Of Behavioral Analysis Digital Biomarkers For Personalized Health Insights Background Pdf after conducting extensive research and examination. These presentation templates are constantly being generated and modified based on user preferences and critiques from editors. Here, you will find the most attractive templates for a range of purposes while taking into account ratings and remarks from users regarding the content. This is an excellent jumping off point to explore our content and will give new users an insight into our top notch PowerPoint Templates. This slide depicts the principles of behavioral analysis using digital biomarkers. It also includes the components, such as a microphone, camera, activity, location, light sensor, call and text logs, browser history, screen events, and human computer interactions.
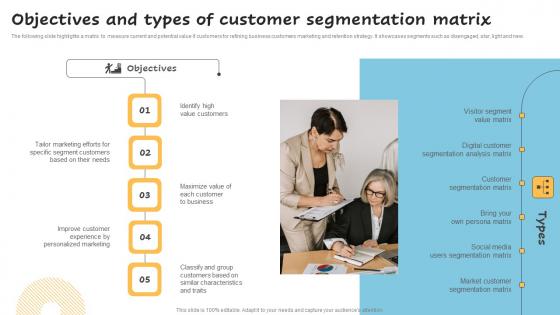
Objectives And Types Of Customer Segmentation Successful Guide For Market Segmentation Guidelines Pdf
The following slide highlights a matrix to measure current and potential value if customers for refining business customers marketing and retention strategy. It showcases segments such as disengaged, star, light and new. Do you have to make sure that everyone on your team knows about any specific topic I yes, then you should give Objectives And Types Of Customer Segmentation Successful Guide For Market Segmentation Guidelines Pdf a try. Our experts have put a lot of knowledge and effort into creating this impeccable Objectives And Types Of Customer Segmentation Successful Guide For Market Segmentation Guidelines Pdf. You can use this template for your upcoming presentations, as the slides are perfect to represent even the tiniest detail. You can download these templates from the Slidegeeks website and these are easy to edit. So grab these today. The following slide highlights a matrix to measure current and potential value if customers for refining business customers marketing and retention strategy. It showcases segments such as disengaged, star, light and new.
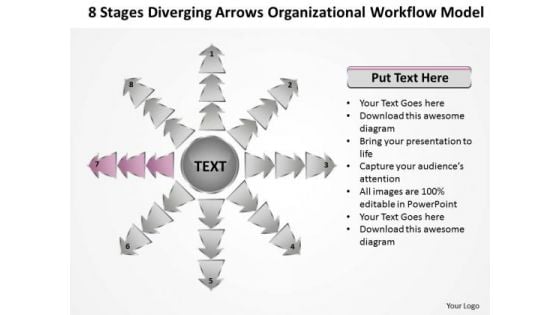
8 Stages Diverging Arrows Organizational Workflow Model Ppt Charts And PowerPoint Slides
We present our 8 stages diverging arrows organizational workflow model ppt Charts and PowerPoint Slides.Download and present our Arrows PowerPoint Templates because you should Demonstrate how you think out of the box. Use our Business PowerPoint Templates because watch the excitement levels rise as they realise their worth. Download our Flow Charts PowerPoint Templates because you will be able to Highlight these individual targets and the paths to their achievement. Present our Shapes PowerPoint Templates because you can take it along a sure fire road to good profit. Download and present our Process and Flows PowerPoint Templates because it helps you to display your ideas and thoughts.Use these PowerPoint slides for presentations relating to Arrows, Business, Chart, Cyclic, Data, Diagram, Financial, Goal, Graph, Illustration, Info, Information, Marketing, Model, Option, Part, Pie, Presentation, Process, Result, Sphere, Statistics. The prominent colors used in the PowerPoint template are Pink, White, Gray. PowerPoint presentation experts tell us our 8 stages diverging arrows organizational workflow model ppt Charts and PowerPoint Slides will make the presenter look like a pro even if they are not computer savvy. The feedback we get is that our Graph PowerPoint templates and PPT Slides provide you with a vast range of viable options. Select the appropriate ones and just fill in your text. Fresh concepts are ever evolving. Help the audience absorb them with our 8 Stages Diverging Arrows Organizational Workflow Model Ppt Charts And PowerPoint Slides.
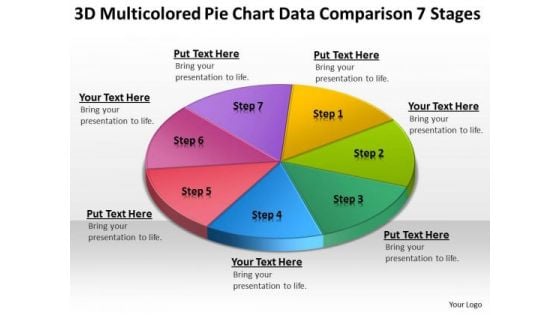
Chart Data Comparison 7 Stages Examples Of Business Plans For PowerPoint Slides
We present our chart data comparison 7 stages examples of business plans for PowerPoint Slides.Download and present our Circle Charts PowerPoint Templates because You are well armed with penetrative ideas. Our PowerPoint Templates and Slides will provide the gunpowder you need. Use our Business PowerPoint Templates because It can be used to Set your controls for the heart of the sun. Our PowerPoint Templates and Slides will be the propellant to get you there. Present our Shapes PowerPoint Templates because You will get more than you ever bargained for. Download and present our Signs PowerPoint Templates because Our PowerPoint Templates and Slides are truly out of this world. Even the MIB duo has been keeping tabs on our team. Present our Metaphors-Visual Concepts PowerPoint Templates because Our PowerPoint Templates and Slides will bullet point your ideas. See them fall into place one by one.Use these PowerPoint slides for presentations relating to business, chart, circle, circular, diagram, economy, finance, framework, graph, isolated, percentage, pie chart, results, scheme, statistics, stats, strategy, success. The prominent colors used in the PowerPoint template are Red, Pink, Green. Become a genius with our Chart Data Comparison 7 Stages Examples Of Business Plans For PowerPoint Slides. You will come out on top.
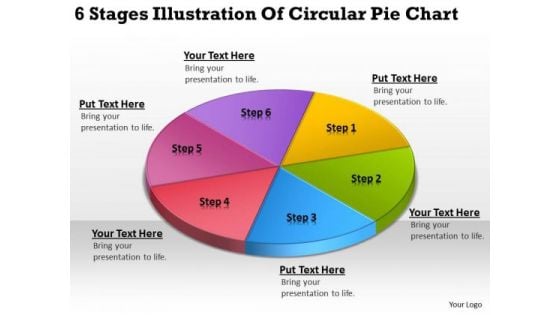
6 Stages Illustration Of Circular Pie Chart Simple Business Plan PowerPoint Slides
We present our 6 stages illustration of circular pie chart simple business plan PowerPoint Slides.Present our Circle Charts PowerPoint Templates because You have gained great respect for your brilliant ideas. Use our PowerPoint Templates and Slides to strengthen and enhance your reputation. Download our Business PowerPoint Templates because Our PowerPoint Templates and Slides are created by a hardworking bunch of busybees. Always flitting around with solutions gauranteed to please. Download and present our Shapes PowerPoint Templates because These PowerPoint Templates and Slides will give the updraft to your ideas. See them soar to great heights with ease. Use our Signs PowerPoint Templates because Our PowerPoint Templates and Slides are truly out of this world. Even the MIB duo has been keeping tabs on our team. Download and present our Metaphors-Visual Concepts PowerPoint Templates because Our PowerPoint Templates and Slides are a sure bet. Gauranteed to win against all odds. Use these PowerPoint slides for presentations relating to business, chart, circle, circular, diagram, economy, finance, framework, graph, isolated, percentage, pie chart, results, scheme, statistics, stats, strategy, success. The prominent colors used in the PowerPoint template are Purple, Yellow, Green. Resolve the feud with our 6 Stages Illustration Of Circular Pie Chart Simple Business Plan PowerPoint Slides. Take all different approaches into consideration.
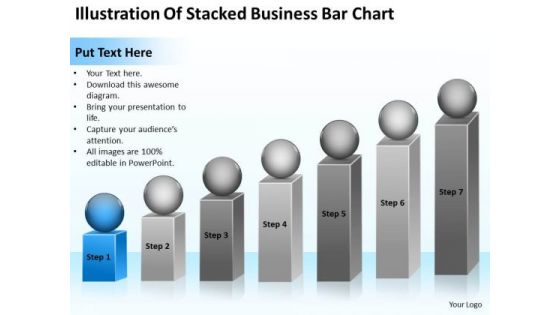
Illustration Of Stacked Business Bar Chart Ppt Consultant Plan PowerPoint Templates
We present our illustration of stacked business bar chart ppt consultant plan PowerPoint templates.Use our Process and Flows PowerPoint Templates because You will get more than you ever bargained for. Use our Spheres PowerPoint Templates because Our PowerPoint Templates and Slides provide you with a vast range of viable options. Select the appropriate ones and just fill in your text. Download our Flow Charts PowerPoint Templates because Our PowerPoint Templates and Slides are topically designed to provide an attractive backdrop to any subject. Present our Business PowerPoint Templates because You should Ascend the ladder of success with ease. Our PowerPoint Templates and Slides will provide strong and sturdy steps. Download our Shapes PowerPoint Templates because Our PowerPoint Templates and Slides will help you be quick off the draw. Just enter your specific text and see your points hit home.Use these PowerPoint slides for presentations relating to Diagram, chart, market, statistics, square, grow, infograph, bar, corporate, red, business, vector, success, presentation, growing, circle, finance,analyst, goal, report, marketing, different, accounting, management, graph, illustration, geometric, sphere, design, growth, infographic, progress, profit,information, increase, aim, analyze, financial, rising, measure, block. The prominent colors used in the PowerPoint template are Gray, Blue, Gray. Embark upon an epic journey. Chart it out to the last detail on our Illustration Of Stacked Business Bar Chart Ppt Consultant Plan PowerPoint Templates.
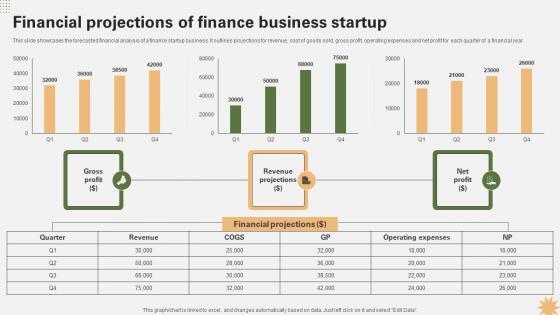
Financial Projections Of Finance Business Strategy For Launching A Financial Strategy SS V
This slide showcases the forecasted financial analysis of a finance startup business. It outlines projections for revenue, cost of goods sold, gross profit, operating expenses and net profit for each quarter of a financial year. Do you have an important presentation coming up Are you looking for something that will make your presentation stand out from the rest Look no further than Financial Projections Of Finance Business Strategy For Launching A Financial Strategy SS V. With our professional designs, you can trust that your presentation will pop and make delivering it a smooth process. And with Slidegeeks, you can trust that your presentation will be unique and memorable. So why wait Grab Financial Projections Of Finance Business Strategy For Launching A Financial Strategy SS V today and make your presentation stand out from the rest This slide showcases the forecasted financial analysis of a finance startup business. It outlines projections for revenue, cost of goods sold, gross profit, operating expenses and net profit for each quarter of a financial year.
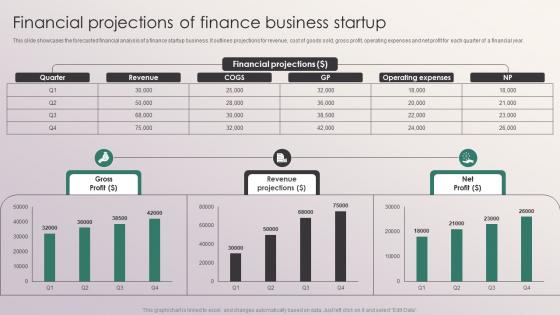
Financial Projections Of Finance Business Startup Penetrating Markets With Financial Strategy SS V
This slide showcases the forecasted financial analysis of a finance startup business. It outlines projections for revenue, cost of goods sold, gross profit, operating expenses and net profit for each quarter of a financial year. Do you have an important presentation coming up Are you looking for something that will make your presentation stand out from the rest Look no further than Financial Projections Of Finance Business Startup Penetrating Markets With Financial Strategy SS V. With our professional designs, you can trust that your presentation will pop and make delivering it a smooth process. And with Slidegeeks, you can trust that your presentation will be unique and memorable. So why wait Grab Financial Projections Of Finance Business Startup Penetrating Markets With Financial Strategy SS V today and make your presentation stand out from the rest This slide showcases the forecasted financial analysis of a finance startup business. It outlines projections for revenue, cost of goods sold, gross profit, operating expenses and net profit for each quarter of a financial year.

ASIA Pacific Medical Device Market Outlook Surgical Devices Ppt Example IR SS V
The slide represents overview of Asia Pacific medical device industry. The purpose of the slide is to provide comprehensive analysis and forecast, offering insights into market trends, growth opportunities, and key factors influencing the sectors trajectory. It cover countries such as India and China. Create an editable ASIA Pacific Medical Device Market Outlook Surgical Devices Ppt Example IR SS V that communicates your idea and engages your audience. Whether you are presenting a business or an educational presentation, pre-designed presentation templates help save time. ASIA Pacific Medical Device Market Outlook Surgical Devices Ppt Example IR SS V is highly customizable and very easy to edit, covering many different styles from creative to business presentations. Slidegeeks has creative team members who have crafted amazing templates. So, go and get them without any delay. The slide represents overview of Asia Pacific medical device industry. The purpose of the slide is to provide comprehensive analysis and forecast, offering insights into market trends, growth opportunities, and key factors influencing the sectors trajectory. It cover countries such as India and China.
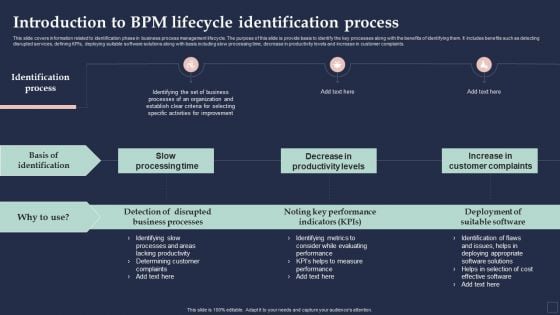
BPM System Methodology Introduction To BPM Lifecycle Identification Process Graphics PDF
This slide covers information related to identification phase in business process management lifecycle. The purpose of this slide is provide basis to identify the key processes along with the benefits of identifying them. It includes benefits such as detecting disrupted services, defining KPIs, deploying suitable software solutions along with basis including slow processing time, decrease in productivity levels and increase in customer complaints. Are you searching for a BPM System Methodology Introduction To BPM Lifecycle Identification Process Graphics PDF that is uncluttered, straightforward, and original Its easy to edit, and you can change the colors to suit your personal or business branding. For a presentation that expresses how much effort youve put in, this template is ideal With all of its features, including tables, diagrams, statistics, and lists, its perfect for a business plan presentation. Make your ideas more appealing with these professional slides. Download BPM System Methodology Introduction To BPM Lifecycle Identification Process Graphics PDF from Slidegeeks today.
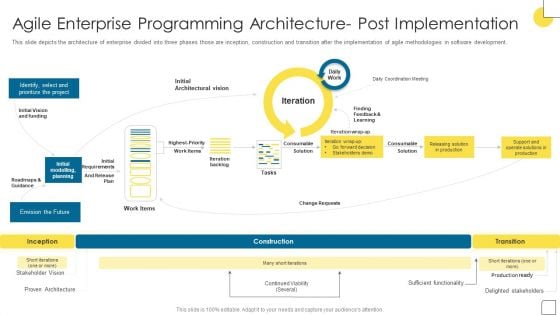
Agile Software Programming Module For IT Agile Enterprise Programming Architecture Information PDF
This slide depicts the architecture of enterprise divided into three phases those are inception, construction and transition after the implementation of agile methodologies in software development. Are you searching for a Agile Software Programming Module For IT Agile Enterprise Programming Architecture Information PDF that is uncluttered, straightforward, and original Its easy to edit, and you can change the colors to suit your personal or business branding. For a presentation that expresses how much effort youve put in, this template is ideal With all of its features, including tables, diagrams, statistics, and lists, its perfect for a business plan presentation. Make your ideas more appealing with these professional slides. Download Agile Software Programming Module For IT Agile Enterprise Programming Architecture Information PDF from Slidegeeks today.
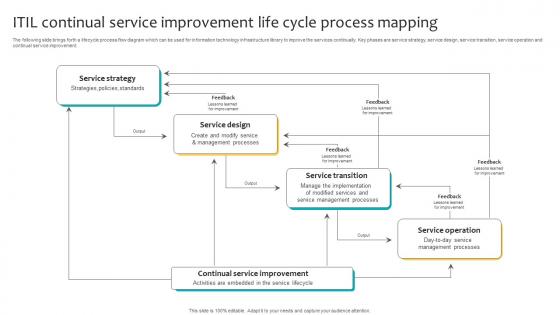
ITIL Continual Service Improvement Life Cycle Process Mapping Summary Pdf
The following slide brings forth a lifecycle process flow diagram which can be used for information technology infrastructure library to improve the services continually. Key phases are service strategy, service design, service transition, service operation and continual service improvement. Pitch your topic with ease and precision using this ITIL Continual Service Improvement Life Cycle Process Mapping Summary Pdf. This layout presents information on Service Design, Service Transition, Service Operation. It is also available for immediate download and adjustment. So, changes can be made in the color, design, graphics or any other component to create a unique layout. The following slide brings forth a lifecycle process flow diagram which can be used for information technology infrastructure library to improve the services continually. Key phases are service strategy, service design, service transition, service operation and continual service improvement.
System Deployment Project Challenges Faced By Company Due To Lack Of Effective Software Icons PDF
This slide represents the problems faced by organizations due to lack of an effective software solution. It includes challenges such as cybersecurity, workload, analysis and data management, project management and digital transformation. Slidegeeks is one of the best resources for PowerPoint templates. You can download easily and regulate System Deployment Project Challenges Faced By Company Due To Lack Of Effective Software Icons PDF for your personal presentations from our wonderful collection. A few clicks is all it takes to discover and get the most relevant and appropriate templates. Use our Templates to add a unique zing and appeal to your presentation and meetings. All the slides are easy to edit and you can use them even for advertisement purposes.
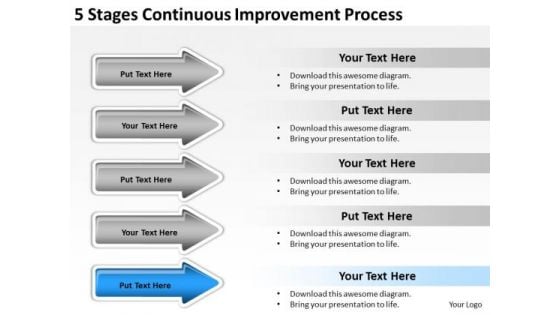
Arrows For Stages Continuous Improvement Process PowerPoint Templates
We present our arrows for stages continuous improvement process PowerPoint templates.Download our Business PowerPoint Templates because You aspire to touch the sky with glory. Let our PowerPoint Templates and Slides provide the fuel for your ascent. Present our Arrows PowerPoint Templates because Our PowerPoint Templates and Slides will generate and maintain the level of interest you desire. They will create the impression you want to imprint on your audience. Present our Process and Flows PowerPoint Templates because Our PowerPoint Templates and Slides will let your words and thoughts hit bullseye everytime. Download and present our Shapes PowerPoint Templates because You can Zap them with our PowerPoint Templates and Slides. See them reel under the impact. Download and present our Flow Charts PowerPoint Templates because Our PowerPoint Templates and Slides provide you with a vast range of viable options. Select the appropriate ones and just fill in your text. Use these PowerPoint slides for presentations relating to Accounting, arrow, bar, blue, business, chart, collection, company, diagram, directive, finance, forecast, future, growth, icon, illustration, market, measure, profit, progress, statistic, stock, success. The prominent colors used in the PowerPoint template are Blue, Gray, White. People tell us our arrows for stages continuous improvement process PowerPoint templates are aesthetically designed to attract attention. We guarantee that they will grab all the eyeballs you need. Presenters tell us our diagram PowerPoint templates and PPT Slides will get their audience's attention. Customers tell us our arrows for stages continuous improvement process PowerPoint templates are designed by professionals Customers tell us our blue PowerPoint templates and PPT Slides will make you look like a winner. Professionals tell us our arrows for stages continuous improvement process PowerPoint templates are effectively colour coded to prioritise your plans They automatically highlight the sequence of events you desire. Use our chart PowerPoint templates and PPT Slides are incredible easy to use. With our Arrows For Stages Continuous Improvement Process PowerPoint Templates you will feel up to it. Derive the confidence to go for it.
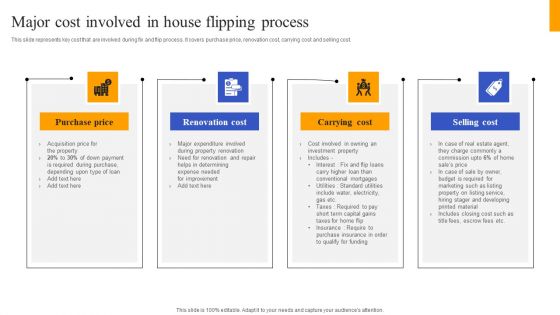
Fix And Flip Method For Renovating Real Estate Major Cost Involved In House Flipping Process Diagrams PDF
This slide represents key cost that are involved during fix and flip process. It covers purchase price, renovation cost, carrying cost and selling cost. Are you searching for a Fix And Flip Method For Renovating Real Estate Major Cost Involved In House Flipping Process Diagrams PDF that is uncluttered, straightforward, and original Its easy to edit, and you can change the colors to suit your personal or business branding. For a presentation that expresses how much effort you have put in, this template is ideal. With all of its features, including tables, diagrams, statistics, and lists, its perfect for a business plan presentation. Make your ideas more appealing with these professional slides. Download Fix And Flip Method For Renovating Real Estate Major Cost Involved In House Flipping Process Diagrams PDF from Slidegeeks today.
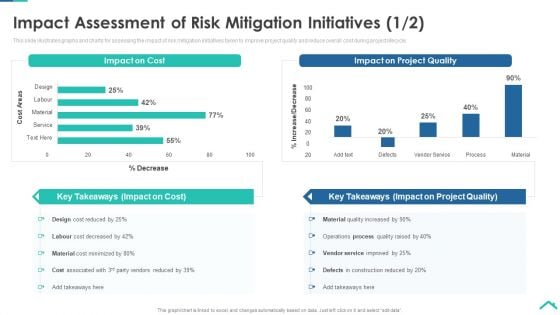
Risk Analysis Strategies For Real Estate Construction Project Impact Assessment Of Risk Mitigation Download PDF
This slide illustrates graphs and charts for assessing the impact of risk mitigation initiatives taken to improve personal skills, boost motivation and enhance project deadline meeting capability. Deliver and pitch your topic in the best possible manner with this risk analysis strategies for real estate construction project impact assessment of risk mitigation download pdf. Use them to share invaluable insights on planning, designing, construction, commissioning and impress your audience. This template can be altered and modified as per your expectations. So, grab it now.
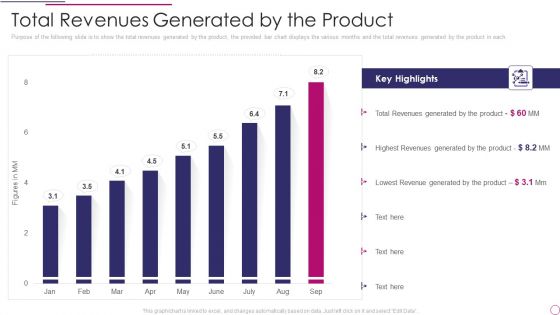
Performance Analysis Of New Product Development Total Revenues Generated By The Product Microsoft PDF
Purpose of the following slide is to show the total revenues generated by the product, the provided bar chart displays the various months and the total revenues generated by the product in each. Deliver and pitch your topic in the best possible manner with this performance analysis of new product development total revenues generated by the product microsoft pdf. Use them to share invaluable insights on total revenues generated by the product and impress your audience. This template can be altered and modified as per your expectations. So, grab it now.
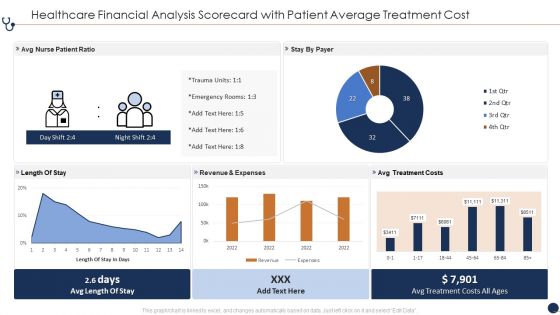
Healthcare Financial Analysis Scorecard With Patient Average Treatment Cost Ppt Infographic Template Slide Portrait PDF
This graph or chart is linked to excel, and changes automatically based on data. Just left click on it and select Edit Data. Deliver and pitch your topic in the best possible manner with this Healthcare Financial Analysis Scorecard With Patient Average Treatment Cost Ppt Infographic Template Slide Portrait PDF. Use them to share invaluable insights on Avg Nurse Patient, Revenue And Expenses, Avg Treatment Costs and impress your audience. This template can be altered and modified as per your expectations. So, grab it now.
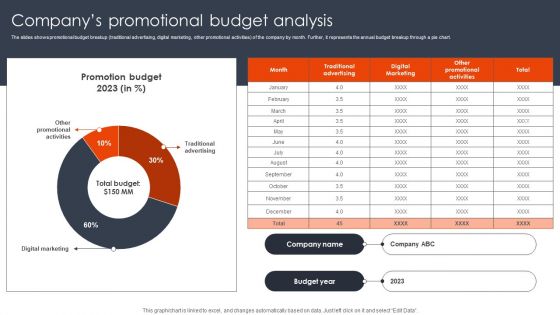
Companys Promotional Budget Analysis Client Acquisition Techniques To Boost Sales Guidelines PDF
The slides shows promotional budget breakup traditional advertising, digital marketing, other promotional activities of the company by month. Further, it represents the annual budget breakup through a pie chart. Boost your pitch with our creative Companys Promotional Budget Analysis Client Acquisition Techniques To Boost Sales Guidelines PDF. Deliver an awe-inspiring pitch that will mesmerize everyone. Using these presentation templates you will surely catch everyones attention. You can browse the ppts collection on our website. We have researchers who are experts at creating the right content for the templates. So you do not have to invest time in any additional work. Just grab the template now and use them.
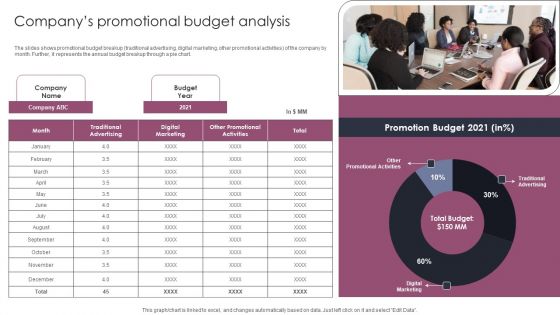
Companys Promotional Budget Analysis Stages To Develop Demand Generation Tactics Pictures PDF
The slides shows promotional budget breakup traditional advertising, digital marketing, other promotional activities of the company by month. Further, it represents the annual budget breakup through a pie chart. Slidegeeks is one of the best resources for PowerPoint templates. You can download easily and regulate Companys Promotional Budget Analysis Stages To Develop Demand Generation Tactics Pictures PDF for your personal presentations from our wonderful collection. A few clicks is all it takes to discover and get the most relevant and appropriate templates. Use our Templates to add a unique zing and appeal to your presentation and meetings. All the slides are easy to edit and you can use them even for advertisement purposes.
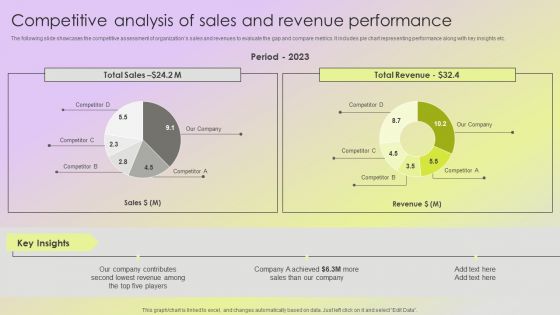
Mitigating Sales Risks With Strategic Action Planning Competitive Analysis Of Sales And Revenue Performance Slides PDF
The following slide showcases the competitive assessment of organizations sales and revenues to evaluate the gap and compare metrics. It includes pie chart representing performance along with key insights etc. Find a pre designed and impeccable Mitigating Sales Risks With Strategic Action Planning Competitive Analysis Of Sales And Revenue Performance Slides PDF. The templates can ace your presentation without additional effort. You can download these easy to edit presentation templates to make your presentation stand out from others. So, what are you waiting for Download the template from Slidegeeks today and give a unique touch to your presentation.


 Continue with Email

 Home
Home


