Survey

About Us With Founder Ceo Photo Powerpoint Slides
This PowerPoint template contains picture of founder CEO with performance analysis. You may use this as introduction slide for your presentation. Download this creative template to catch the attention of the people.
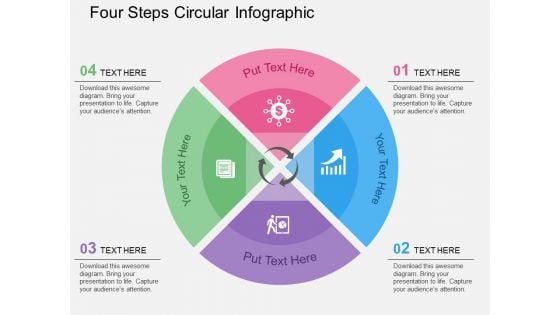
Four Steps Circular Infographic Powerpoint Templates
Our above slide contains diagram of three stage circular infographic. It helps to display global business analysis. Use this diagram to impart more clarity to data and to create more sound impact on viewers.
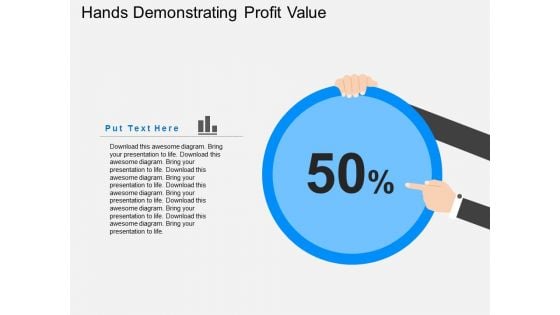
Hands Demonstrating Profit Value Powerpoint Templates
Our above slide contains diagram of zigzag arrow on monitor. It helps to display growth analysis and management. Use this diagram to impart more clarity to information and to create more sound impact on viewers.
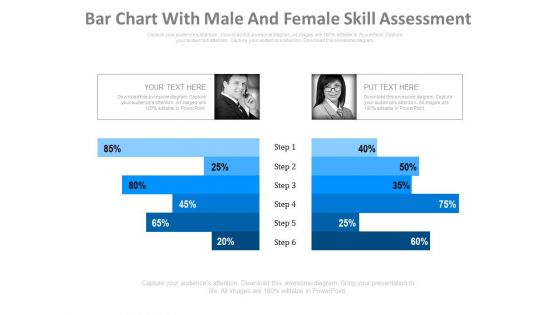
Chart For Employees Performance Measurement Powerpoint Slides
This PowerPoint template has been designed with graphics of compare chart. You may download this diagram slide for analysis of employee performance. Add this slide to your presentation and impress your superiors.
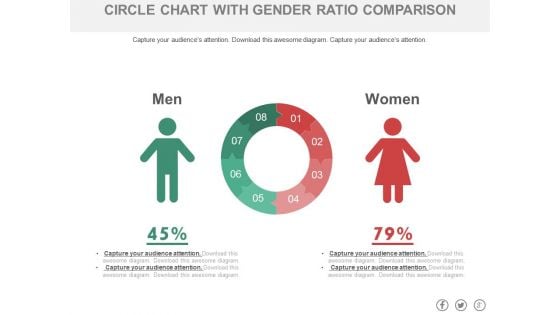
Circle Chart With Man And Woman Ratio Comparison Powerpoint Slides
This PowerPoint template has been designed with graphics of circle chart. You may download this PPT slide to depict man and woman ratio analysis. Add this slide to your presentation and impress your superiors.
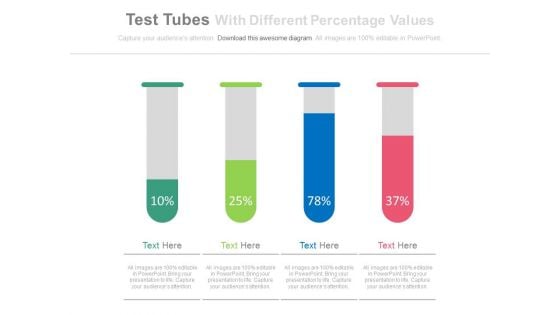
Test Tubes With Percentage Data For Comparison Powerpoint Slides
This PowerPoint template has been designed with test tubes and percentage data. You may download this PPT slide to display data comparison and analysis. Add this slide to your presentation and impress your superiors.
Three Text Boxes With Percentage Values And Icons Powerpoint Slides
This PowerPoint template has been designed with text boxes and percentage data. You may download this PPT slide to display data comparison and analysis. Add this slide to your presentation and impress your superiors.

Three Text Tags Compare Chart Powerpoint Slides
This PowerPoint template has been designed with text tags and percentage data. You may download this PPT slide to display data comparison and analysis. Add this slide to your presentation and impress your superiors.
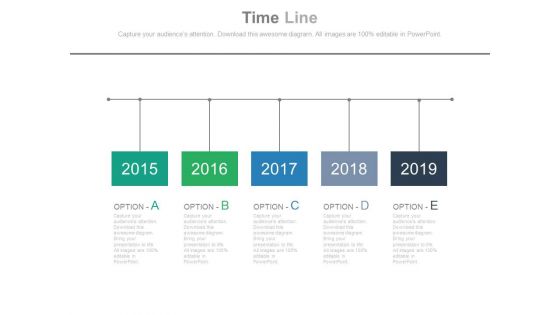
Five Options Timeline Diagram With Years Tags Powerpoint Slides
This PowerPoint template has been designed with five options timeline diagram with years tags. This PPT slide may be helpful to display year based business analysis. Download this PowerPoint timeline template to make impressive presentations.
Five Pointers Timeline Diagram With Icons Powerpoint Slides
This PowerPoint template has been designed with five pointers timeline diagram with icons. This PPT slide may be helpful to display business growth and analysis. Download this PowerPoint timeline template to make impressive presentations.
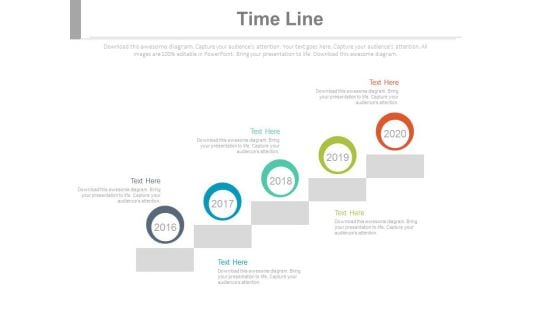
Five Steps Company Growth Timeline Powerpoint Slides
This PowerPoint timeline slide design can be used to display progress steps. It contains sequential timeline growth steps. This timeline template can be used in presentations where you need to display time planning and analysis.
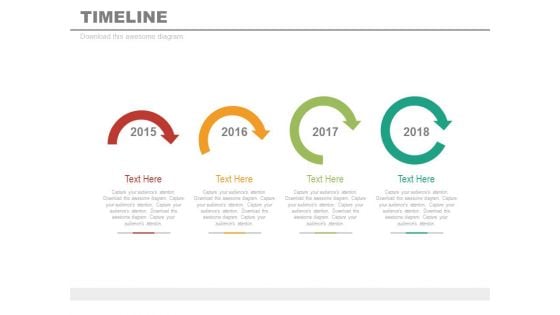
Four Sequential Arrows Timeline Diagram Powerpoint Slides
This PowerPoint timeline template can be used for multiple purposes including vision planning, new milestones and tasks. This PPT slide may be helpful to display timeline steps and year based analysis. Download this PowerPoint timeline template to make impressive presentations.
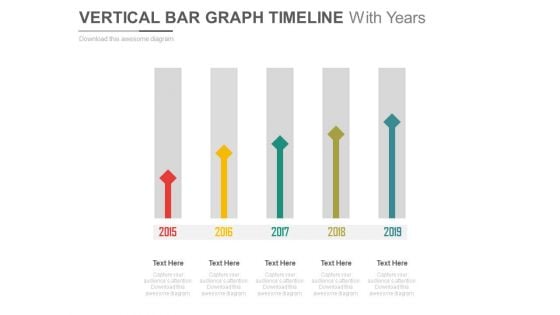
Vertical Arrows Timeline With Years Powerpoint Slides
This PowerPoint template has been designed with sequential arrows timeline diagram. This PPT slide may be helpful to display year based business analysis. Download this PowerPoint timeline template to make impressive presentations.
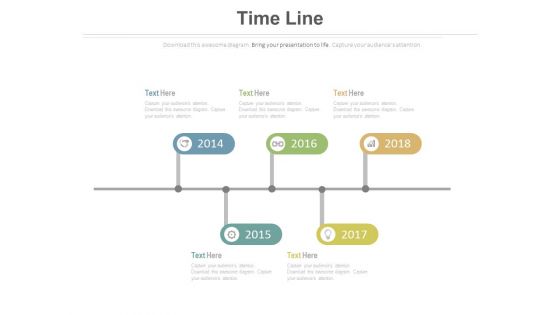
Year Based Timeline For Sales Planning Powerpoint Slides
This PowerPoint timeline slide design can be used to display progress steps. It contains sequential timeline tags. This timeline template can be used in presentations where you need to display sales planning and analysis.
Year Tags Sequential Timeline With Icons Powerpoint Slides
This PowerPoint timeline slide design can be used to display progress steps. It contains sequential timeline tags. This timeline template can be used in presentations where you need to display sales planning and analysis.
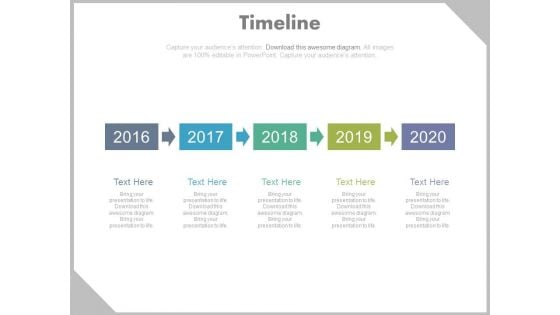
Year Tags Timeline Sequence Diagram Powerpoint Slides
This PowerPoint timeline slide design can be used to display progress steps. It contains sequential timeline tags. This timeline template can be used in presentations where you need to display sales planning and analysis.
Four Circles With Percentage Values And Icons Powerpoint Slides
This PowerPoint template displays info graphic diagram of linear circles. This diagram may be used to exhibit financial growth and analysis. Grab center stage with this slide and capture the attention of your audience.
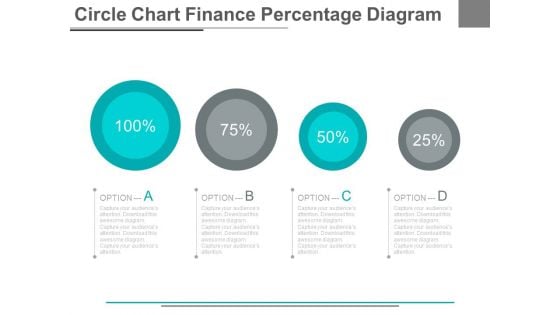
Four Options Circle Chart With Percentage Powerpoint Slides
This PowerPoint template has been designed with graphics of four options circle chart. This PowerPoint template may be used to display four steps of financial analysis. Prove the viability of your ideas using this impressive slide.
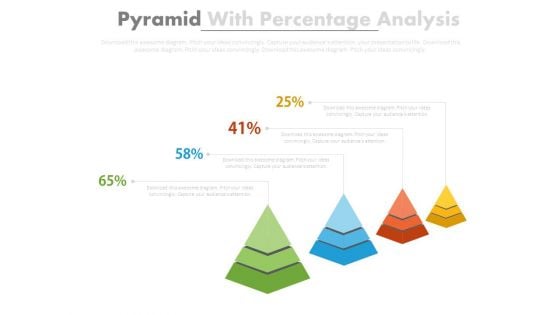
Four Pyramids With Growth Steps Powerpoint Slides
This business slide has been designed with four pyramids. This PowerPoint template may use to display sales growth and analysis. Prove the viability of your ideas using this impressive slide.

Three Stages Of Financial Growth Powerpoint Slides
Three stages of financial growth have been displayed in this power point template. This diagram helps to portray the concept of financial planning and analysis. Download this template to leave permanent impression on your audience.
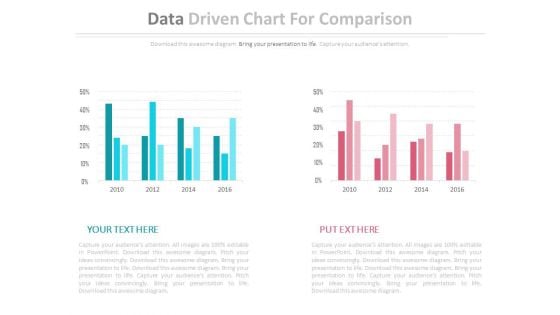
Two Data Driven Comparison Charts Powerpoint Slides
This PowerPoint template contains diagram of two data driven charts. You may use this PPT slide to depict strategic analysis for business. The color coding of this template is specifically designed to highlight you points.
Map Diagram With Bar Graph And Icons Powerpoint Slides
This PowerPoint template displays graphics of map diagram with bar graph and icons. This Map template can be used in business presentations to depict economic analysis. This slide can also be used by school students for educational projects.
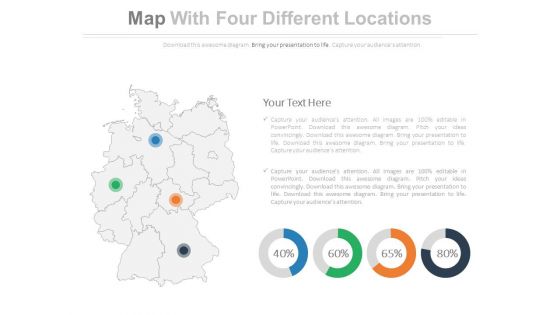
Map Diagram With Four Locations Powerpoint Slides
This PowerPoint template displays graphics of map diagram with four locations and percentage values. This Map template can be used in business presentations to depict economic analysis. This slide can also be used by school students for educational projects.
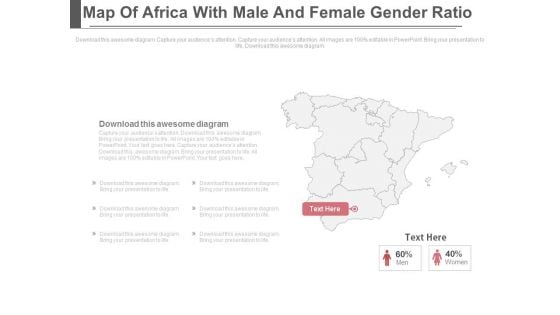
Map Of Africa With Men And Women Gender Ratio Powerpoint Slides
This PowerPoint template displays graphics of Africa map with men women icons. This PPT template can be used to display gender ratio analysis. This slide can also be used by school students for educational projects.
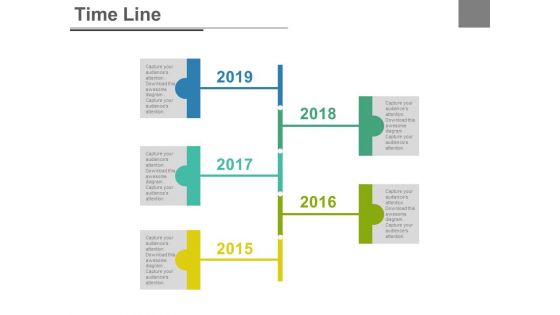
Five Staged Business Timeline Report Powerpoint Slides
This PowerPoint template has been designed with five staged business timeline report diagram. This PPT slide may be helpful to display year based business analysis. Download this PowerPoint timeline template to make impressive presentations.

Five Yearly Sequential Timeline With Percentage Values Powerpoint Slides
This PowerPoint timeline slide design can be used to display timeline operations. It contains sequential timeline diagram with percentage values. This timeline template can be used in presentations where you need to display time planning and analysis.
Four Circles With Icons Timeline Design Powerpoint Slides
This PowerPoint timeline template can be used for multiple purposes including vision planning, new milestones and tasks. This PPT slide may be helpful to display timeline steps and year based analysis. Download this PowerPoint timeline template to make impressive presentations.
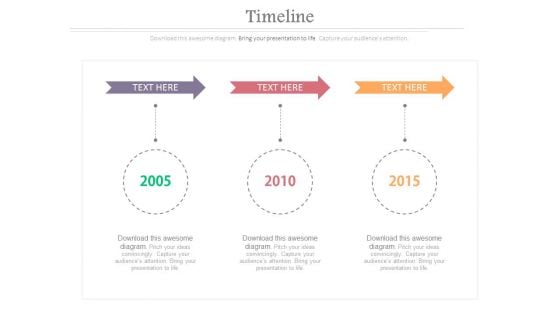
Three Arrows With Years For Timeline Planning Powerpoint Slides
This PowerPoint template has been designed with three arrows and years. This timeline template may be used to display business planning and analysis. Download this PowerPoint timeline template to make impressive presentations.
Five Circles Sequential Chart With Icons Powerpoint Slides
This PowerPoint template contains sequential chart of five circles with icons. You may download this PPT slide to depict corporate vision, mission and strategy analysis. Add this slide to your presentation and impress your superiors.
Market Trends Chart With Percentage And Icons Powerpoint Slides
This PowerPoint template has been designed with graphics of chart with percentage values and icons. This PowerPoint template may be used to market trends and financial analysis. Prove the viability of your ideas using this impressive slide.

Three Person Tags With Skill Percentage Charts Powerpoint Slides
This PowerPoint template has been designed with three person?s tags with percentage values. This Info graphic diagram may be used to display team skill analysis. Download this impressive diagram to build unique presentations.
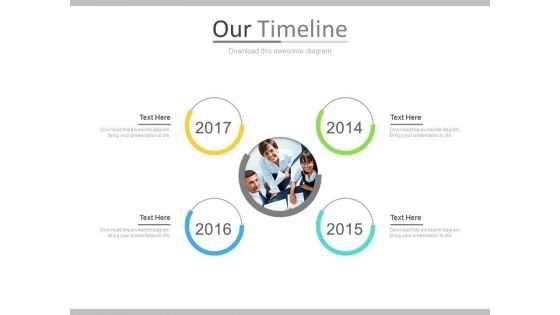
Timeline For Team Business Target Achievement Powerpoint Slides
This PowerPoint template contains circles around business team. It may be used to display analysis of team strategy. Download this PPT slide to demonstrate how you intend to navigate your steps towards the desired corporate goal.

Pyramid Design For Employees Performance Powerpoint Slides
This PPT slide contains graphics of pyramid diagram. Download this PowerPoint template to depict employee?s performance and analysis. Deliver amazing presentations to mesmerize your audience by using this slide design.
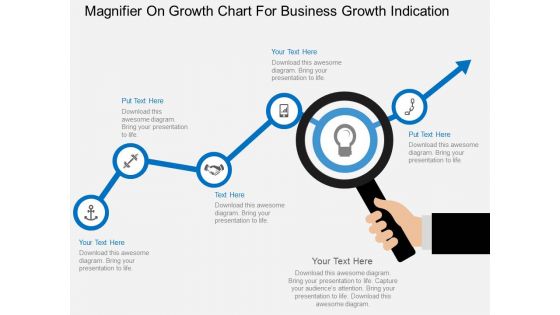
Magnifier On Growth Chart For Business Growth Indication Powerpoint Template
This business slide contains graphics of magnifier on growth chart. This PowerPoint template helps to display business planning and analysis. Use this diagram to impart more clarity to concept and to create more sound impact on viewers.
Four Circles Venn Diagram With Icons Powerpoint Slides
Four circles Venn diagram has been used to design this power point template. This PPT helps to portray the concept of business data analysis. Use this PPT for your business and marketing related presentations.
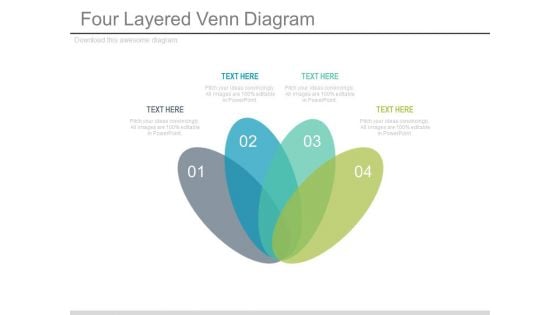
Four Layered Venn Design For Business Powerpoint Slides
This power point template has been designed with graphic of four layered Venn diagram. Use this Venn diagram for business strategy and analysis. Illustrate your ideas and imprint them in the minds of your team with this template.
Three Overlapping Circles With Business Icons Powerpoint Slides
This power point template has been designed with three overlapping circles and business icons. Use this Venn diagram for business planning and strategy analysis. Illustrate your ideas and imprint them in the minds of your team with this template.
Three Steps Venn Diagram With Icons Powerpoint Slides
This power point template has been designed with graphic of Venn diagram. Use this Venn diagram for business result analysis. Illustrate your ideas and imprint them in the minds of your team with this template.
Two Circles Venn Diagram With Icons Powerpoint Slides
Venn diagram of two circles has been used to design this power point template. This PPT helps to portray the concept of business data analysis. Use this PPT for your business and marketing related presentations.
Two Layered Venn Diagram With Icons Powerpoint Slides
This power point template has been designed with graphic of two layered Venn diagram. Use this Venn diagram for business strategy and analysis. Illustrate your ideas and imprint them in the minds of your team with this template.
Magnifying Glass With Team And Icons Powerpoint Slides
This PPT slide contains graphics of magnifying glass with team and icons. You may use this PowerPoint template team strategy and analysis. Download this team slide design to deliver amazing presentations.
Curve Line Diagram With Icons Powerpoint Template
Our above slide contains diagram of curve line infographic. This infographic slide helps to exhibit business analysis. Use this diagram to impart more clarity to data and to create more sound impact on viewers.
Six Text Boxes With Icons Powerpoint Template
This business slide contains pie chart infographic layout. This diagram is suitable to present business deal and analysis This diagram provides schematic representation of any information and provides more clarity to the subject.
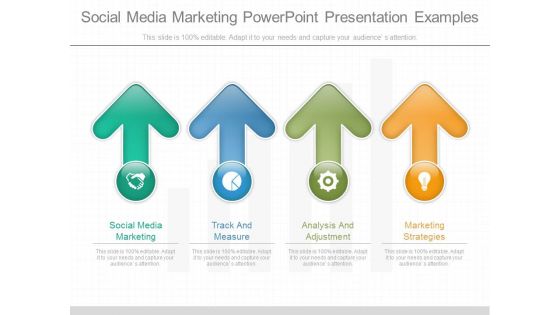
Social Media Marketing Power Point Presentation Examples
This is a social media marketing power point presentation examples. This is a four stage process. The stages in this process are social media marketing, track and measure, analysis and adjustment, marketing strategies.
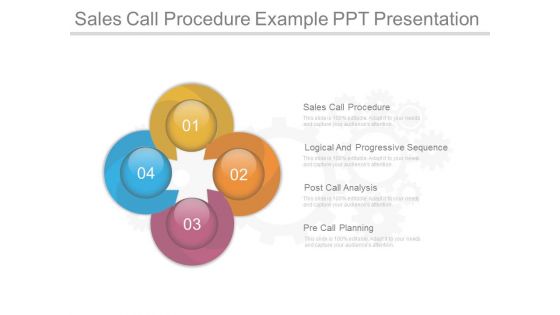
Sales Call Procedure Example Ppt Presentation
This is a sales call procedure example ppt presentation. This is a four stage process. The stages in this process are sales call procedure, logical and progressive sequence, post call analysis, pre call planning. \n \n
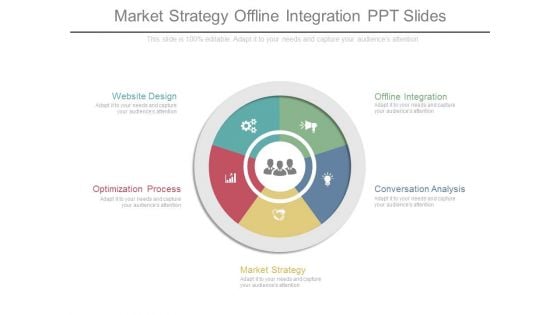
Market Strategy Offline Integration Ppt Slides
This is a market strategy offline integration ppt slides. This is a five stage process. The stages in this process are website design, offline integration, optimization process, conversation analysis, market strategy.
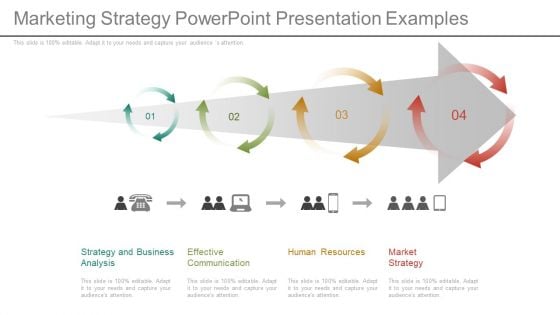
Marketing Strategy Powerpoint Presentation Examples
This is a marketing strategy powerpoint presentation examples. This is a four stage process. The stages in this process are strategy and business analysis, effective communication, human resources, market strategy.
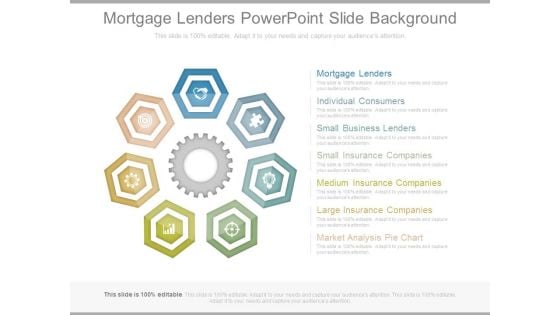
Mortgage Lenders Powerpoint Slide Background
This is a mortgage lenders powerpoint slide background. This is a seven stage process. The stages in this process are mortgage lenders, individual consumers, small business lenders, small insurance companies, medium insurance companies, large insurance companies, market analysis pie chart.
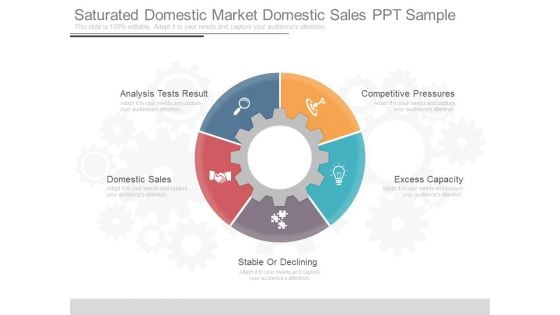
Saturated Domestic Market Domestic Sales Ppt Sample
This is a saturated domestic market domestic sales ppt sample. This is a five stage process. The stages in this process are analysis tests result, competitive pressures, domestic sales, excess capacity, stable or declining.
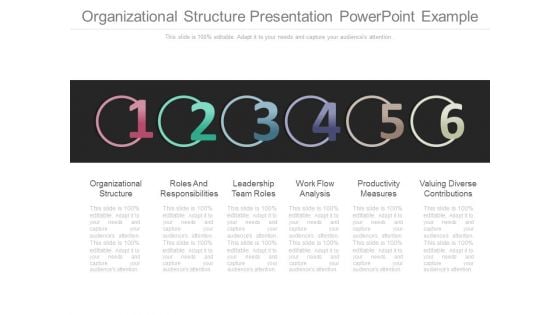
Organizational Structure Presentation Powerpoint Example
This is an organizational structure presentation powerpoint example. This is a six stage process. The stages in this process are organizational structure, roles and responsibilities, leadership team roles, work flow analysis, productivity measures, valuing diverse contributions.
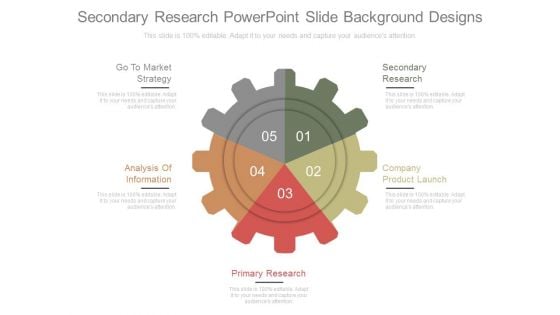
Secondary Research Powerpoint Slide Background Designs
This is a secondary research powerpoint slide background designs. This is a five stage process. The stages in this process are go to market strategy, analysis of information, secondary research, company product launch, primary research.
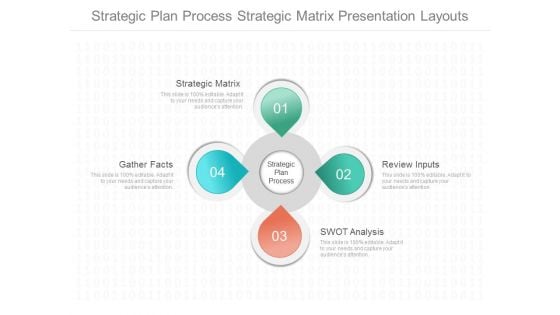
Strategic Plan Process Strategic Matrix Presentation Layouts
This is a strategic plan process strategic matrix presentation layouts. This is a four stage process. The stages in this process are strategic matrix, gather facts, review inputs, swot analysis, strategic plan process.
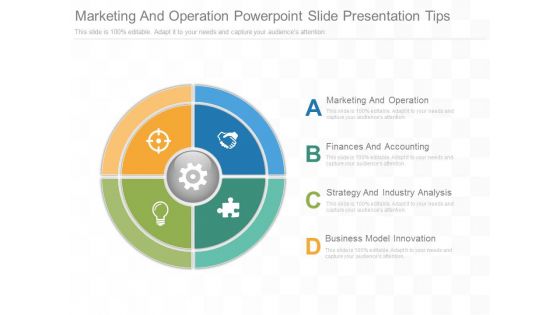
Marketing And Operation Powerpoint Slide Presentation Tips
This is a marketing and operation powerpoint slide presentation tips. This is a four stage process. The stages in this process are marketing and operation, finances and accounting, strategy and industry analysis, business model innovation.
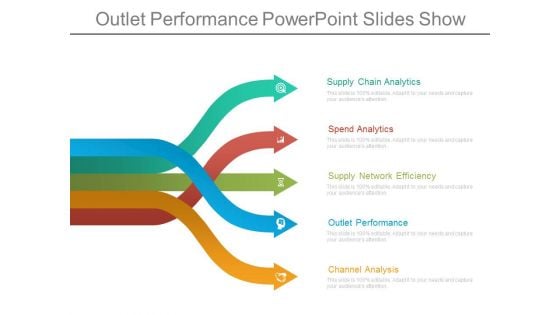
Outlet Performance Powerpoint Slides Show
This is an outlet performance powerpoint slides show. This is a five stage process. The stages in this process are supply chain analytics, spend analytics, supply network efficiency, outlet performance, channel analysis.
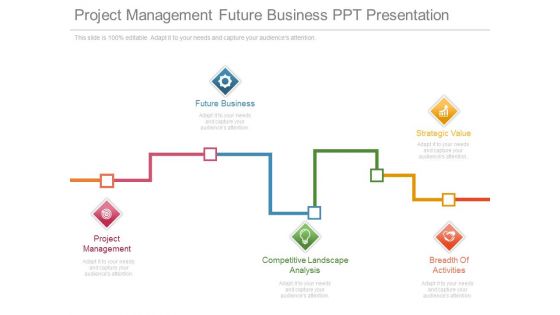
Project Management Future Business Ppt Presentation
This is a project management future business ppt presentation. This is a five stage process. The stages in this process are future business, strategic value, project management, competitive landscape analysis, breadth of activities.
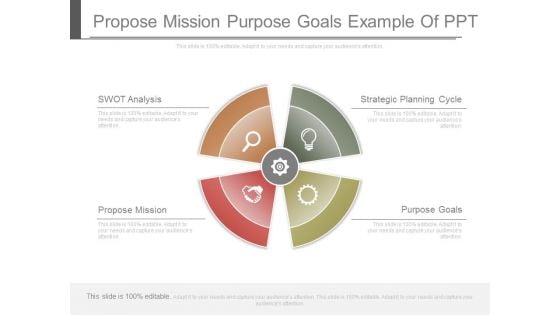
Propose Mission Purpose Goals Example Of Ppt
This is a propose mission purpose goals example of ppt. This is a four stage process. The stages in this process are swot analysis, propose mission, strategic planning cycle, purpose goals.
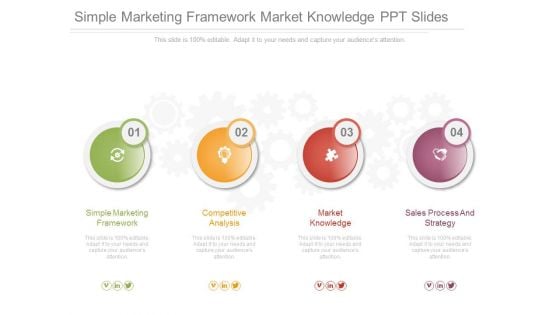
Simple Marketing Framework Market Knowledge Ppt Slides
This is a simple marketing framework market knowledge ppt slides. This is a four stage process. The stages in this process are simple marketing framework, competitive analysis, market knowledge, sales process and strategy.
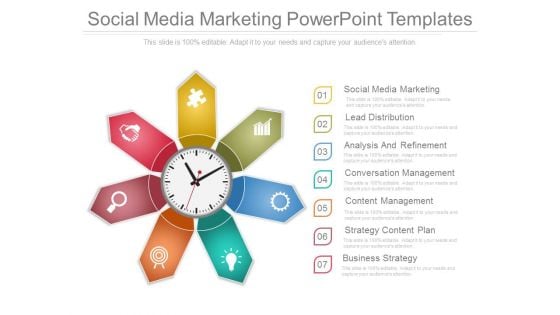
Social Media Marketing Powerpoint Templates
This is a social media marketing powerpoint templates. This is a seven stage process. The stages in this process are social media marketing, lead distribution, analysis and refinement, conversation management, content management, strategy content plan, business strategy.
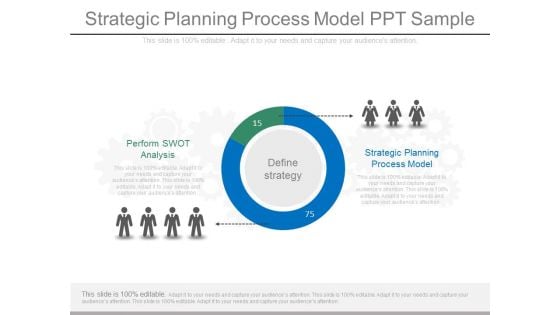
Strategic Planning Process Model Ppt Sample
This is a strategic planning process model ppt sample. This is a two stage process. The stages in this process are define strategy, perform swot analysis, strategic planning process model.
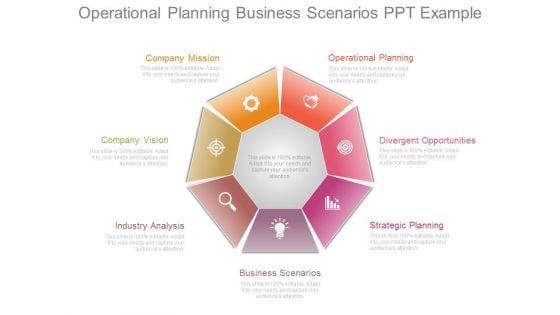
Operational Planning Business Scenarios Ppt Example
This is an operational planning business scenarios ppt example. This is a seven stage process. The stages in this process are company mission, operational planning, company vision, industry analysis, business scenarios, strategic planning, divergent opportunities.


 Continue with Email

 Home
Home


