System Benefits
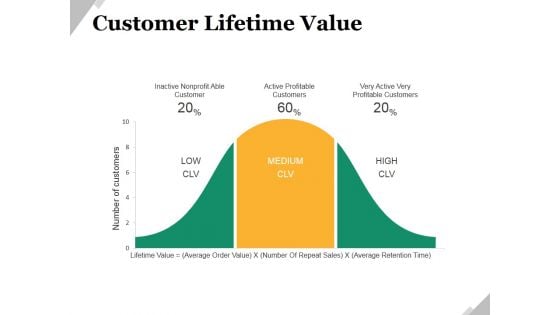
Customer Lifetime Value Ppt PowerPoint Presentation Styles Gridlines
This is a customer lifetime value ppt powerpoint presentation styles gridlines. This is a three stage process. The stages in this process are inactive nonprofit able customer, active profitable customers, very active very profitable customers.
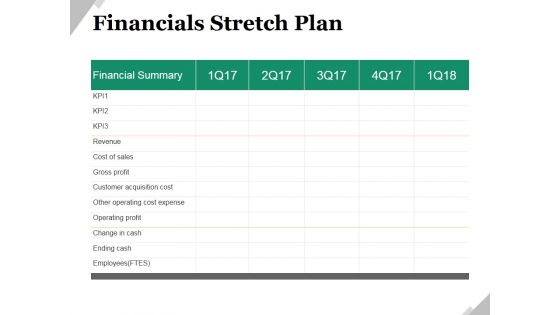
Financials Stretch Plan Ppt PowerPoint Presentation Ideas Shapes
This is a financials stretch plan ppt powerpoint presentation ideas shapes. This is a five stage process. The stages in this process are revenue, cost of sales, gross profit, customer acquisition cost, other operating cost expense, operating profit.
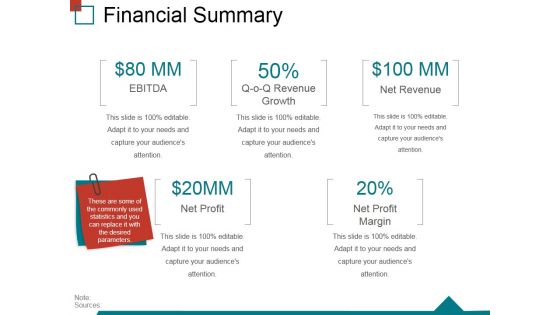
Financial Summary Ppt PowerPoint Presentation Ideas Slide Portrait
This is a financial summary ppt powerpoint presentation ideas slide portrait. This is a five stage process. The stages in this process are ebitda, revenue growth, net revenue, net profit, net profit, margin.
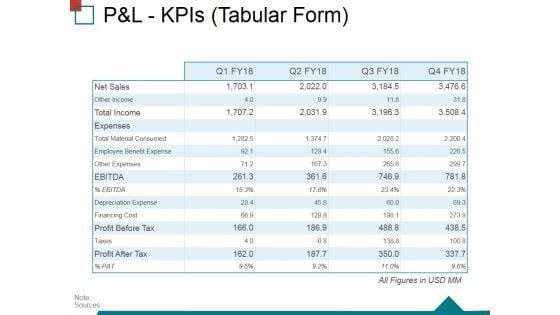
Pandl Kpis Tabular Form Ppt PowerPoint Presentation Ideas Structure
This is a pandl kpis tabular form ppt powerpoint presentation ideas structure. This is a four stage process. The stages in this process are operating profit, revenue, cogs, net profit.
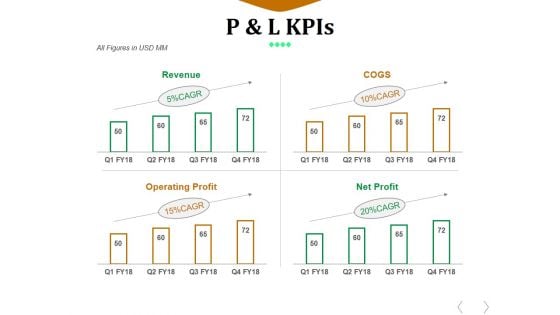
P And L Kpis Template 1 Ppt PowerPoint Presentation Design Ideas
This is a p and l kpis template 1 ppt powerpoint presentation design ideas. This is a four stage process. The stages in this process are revenue, cogs, operating profit, net profit.
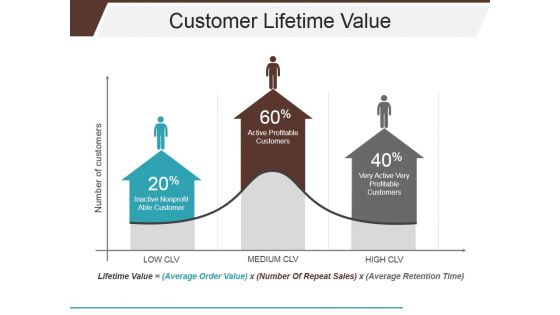
Customer Lifetime Value Ppt PowerPoint Presentation Portfolio Display
This is a customer lifetime value ppt powerpoint presentation portfolio display. This is a three stage process. The stages in this process are inactive nonprofit able customer, active profitable customers, very active very profitable customers.
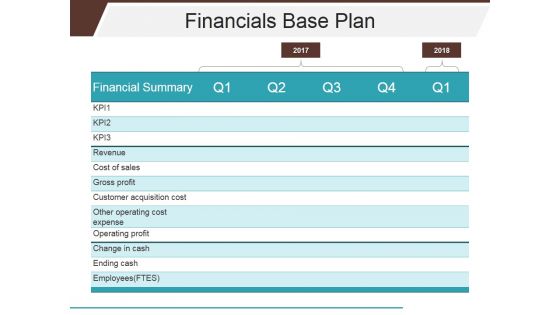
Financials Base Plan Ppt PowerPoint Presentation Styles Clipart Images
This is a financials base plan ppt powerpoint presentation styles clipart images. This is a five stage process. The stages in this process are revenue, cost of sales, gross profit, customer acquisition cost, other operating cost expense, operating profit.
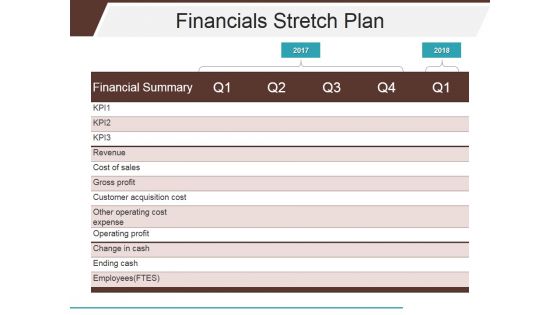
Financials Stretch Plan Ppt PowerPoint Presentation Slides Background Images
This is a financials stretch plan ppt powerpoint presentation slides background images. This is a five stage process. The stages in this process are revenue, cost of sales, gross profit, customer acquisition cost, other operating cost expense, operating profit.
Customer Lifetime Value Clv Ppt PowerPoint Presentation Icon Professional
This is a customer lifetime value clv ppt powerpoint presentation icon professional. This is a three stage process. The stages in this process are inactive nonprofit able, customer, active profitable customers, very active very profitable customers.
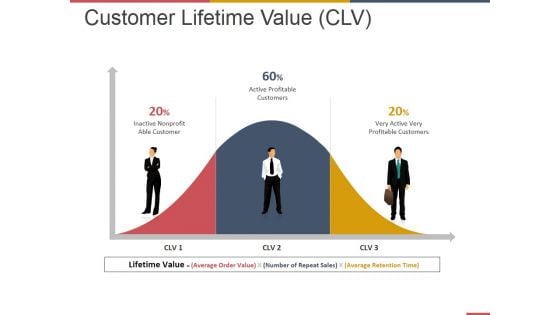
Customer Lifetime Value Ppt PowerPoint Presentation Summary Good
This is a customer lifetime value ppt powerpoint presentation summary good. This is a three stage process. The stages in this process are inactive nonprofit able customer, active profitable customers, very active very profitable customers.
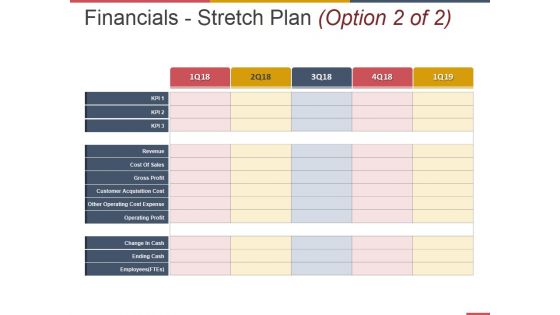
Financials Stretch Plan Template 1 Ppt PowerPoint Presentation Pictures Professional
This is a financials stretch plan template 1 ppt powerpoint presentation pictures professional. This is a three stage process. The stages in this process are cost of sales, gross profit, customer acquisition cost, other operating cost expense, operating profit.
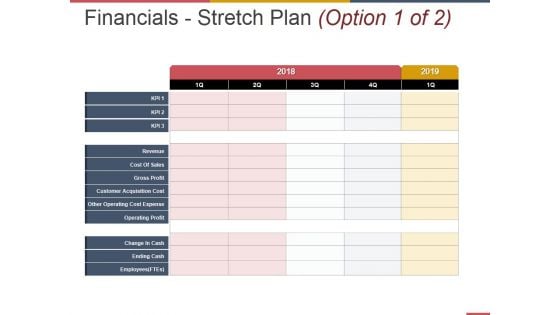
Financials Stretch Plan Template 2 Ppt PowerPoint Presentation Inspiration Background Image
This is a financials stretch plan template 2 ppt powerpoint presentation inspiration background image. This is a three stage process. The stages in this process are cost of sales, gross profit, customer acquisition cost, other operating cost expense, operating profit.
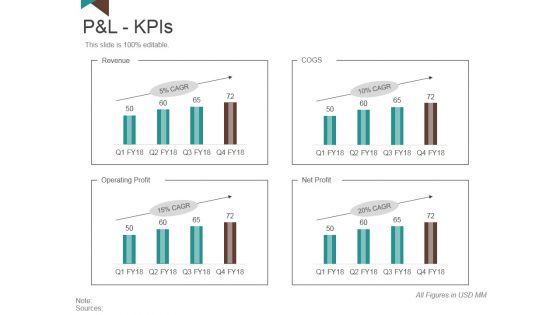
P And L Kpis Template 1 Ppt PowerPoint Presentation Slides Model
This is a p and l kpis template 1 ppt powerpoint presentation slides model. This is a four stage process. The stages in this process are revenue, operating profit, net profit, cogs.
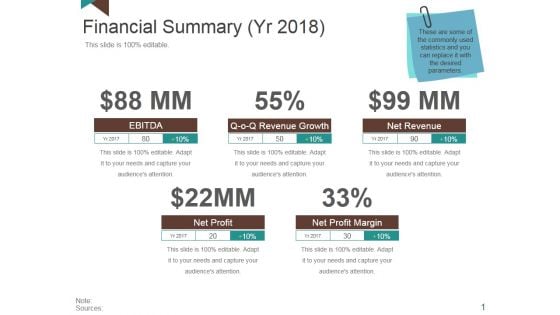
Financial Summary Ppt PowerPoint Presentation Layouts Portrait
This is a financial summary ppt powerpoint presentation layouts portrait. This is a four stage process. The stages in this process are ebitda, revenue growth, net revenue, net profit margin, net profit.

Financial Ppt PowerPoint Presentation Gallery Design Ideas
This is a financial ppt powerpoint presentation gallery design ideas. This is a five stage process. The stages in this process are ebitda, net profit, revenue, growth, net revenue, net profit, margin.
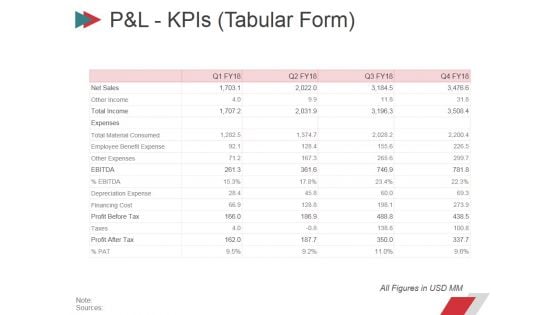
Pandl Kpis Tabular Form Ppt PowerPoint Presentation Summary Layout
This is a pandl kpis tabular form ppt powerpoint presentation summary layout. This is a four stage process. The stages in this process are revenue, cogs, operating profit, net profit.
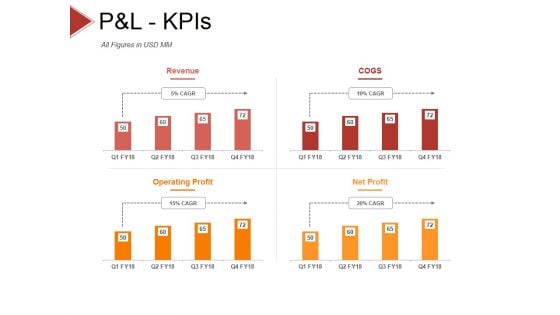
P And L Kpis Template 2 Ppt PowerPoint Presentation Styles Objects
This is a p and l kpis template 2 ppt powerpoint presentation styles objects. This is a four stage process. The stages in this process are revenue, cogs, operating profit, net profit.
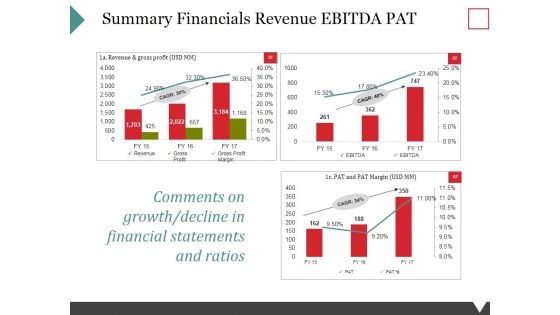
Summary Financials Revenue Ebitda Pat Ppt PowerPoint Presentation Ideas Files
This is a summary financials revenue ebitda pat ppt powerpoint presentation ideas files. This is a three stage process. The stages in this process are revenue, gross profit, gross profit margin.
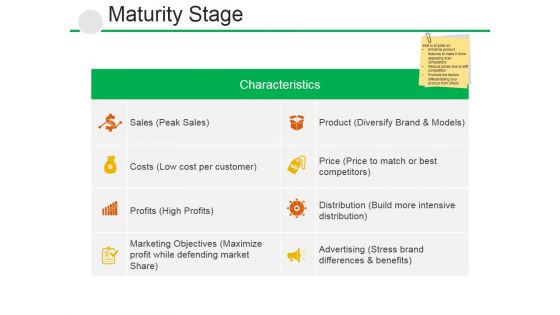
Maturity Stage Ppt PowerPoint Presentation Professional Ideas
This is a maturity stage ppt powerpoint presentation professional ideas. This is a two stage process. The stages in this process are sales peak sales, product diversify brand and models, profits high profits, distribution build more intensive distribution.

P And L Kpis Template 1 Ppt PowerPoint Presentation Model Inspiration
This is a p and l kpis template 1 ppt powerpoint presentation model inspiration. This is a four stage process. The stages in this process are revenue, cogs, operating profit, net profit.
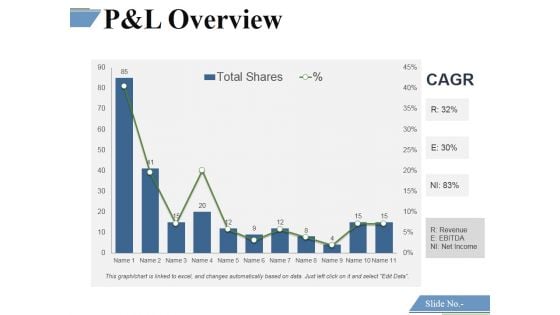
P And L Overview Template 3 Ppt PowerPoint Presentation Model Gridlines
This is a p and l overview template 3 ppt powerpoint presentation model gridlines. This is a eleven stage process. The stages in this process are financing cost, net sales, profit before tax, profit after tax.
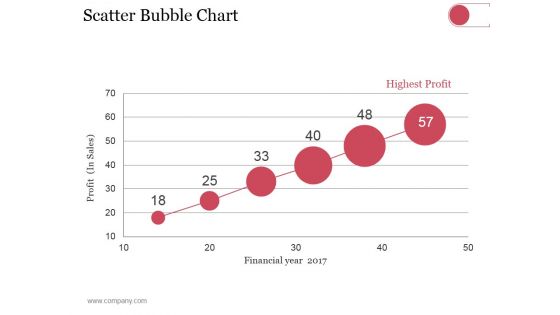
Scatter Bubble Chart Ppt PowerPoint Presentation Summary Pictures
This is a scatter bubble chart ppt powerpoint presentation summary pictures. This is a six stage process. The stages in this process are highest profit, financial year, profit in sales.
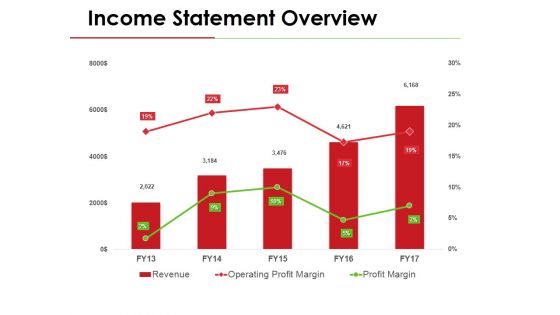
Income Statement Overview Ppt PowerPoint Presentation Gallery Template
This is a income statement overview ppt powerpoint presentation gallery template. This is a three stage process. The stages in this process are revenue, operating profit margin, profit margin.

Projected Key Financials Template 1 Ppt PowerPoint Presentation Infographic Template Graphics
This is a projected key financials template 1 ppt powerpoint presentation infographic template graphics. This is a three stage process. The stages in this process are sales, gross profit, net profit.
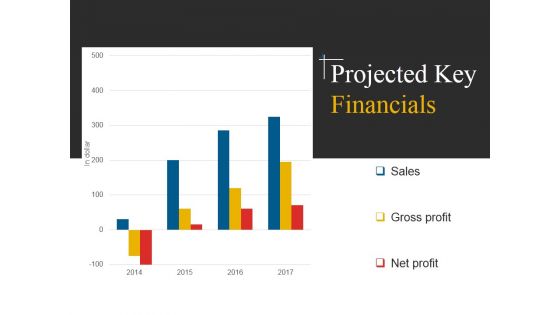
Projected Key Financials Template 2 Ppt PowerPoint Presentation Inspiration Example File
This is a projected key financials template 2 ppt powerpoint presentation inspiration example file. This is a four stage process. The stages in this process are sales, gross profit, net profit.

Projected Key Financials Template 1 Ppt PowerPoint Presentation Model Rules
This is a projected key financials template 1 ppt powerpoint presentation model rules. This is a three stage process. The stages in this process are sales, gross profit, net profit, finance.

Projected Key Financials Template 2 Ppt PowerPoint Presentation Professional Clipart
This is a projected key financials template 2 ppt powerpoint presentation professional clipart. This is a four stage process. The stages in this process are sales, gross profit, net profit, in dollar.
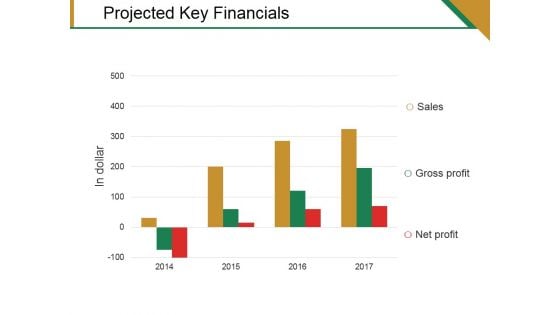
Projected Key Financials Template 1 Ppt PowerPoint Presentation File Portfolio
This is a projected key financials template 1 ppt powerpoint presentation file portfolio. This is a three stage process. The stages in this process are sales, gross profit, net profit.
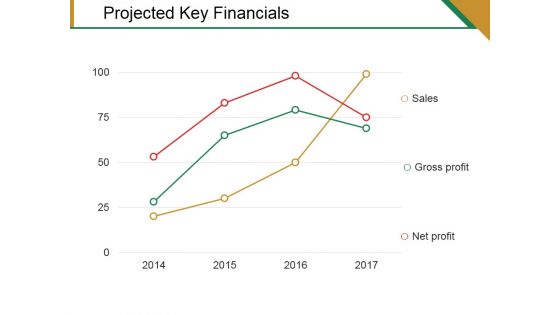
Projected Key Financials Template 2 Ppt PowerPoint Presentation Pictures Graphics Template
This is a projected key financials template 2 ppt powerpoint presentation pictures graphics template. This is a three stage process. The stages in this process are sales, gross profit, net profit.
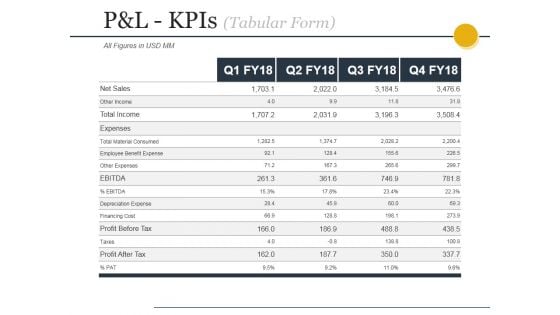
Pandl Kpis Tabular Form Ppt PowerPoint Presentation File Design Templates
This is a pandl kpis tabular form ppt powerpoint presentation file design templates. This is a four stage process. The stages in this process are revenue, cogs, operating profit, net profit.
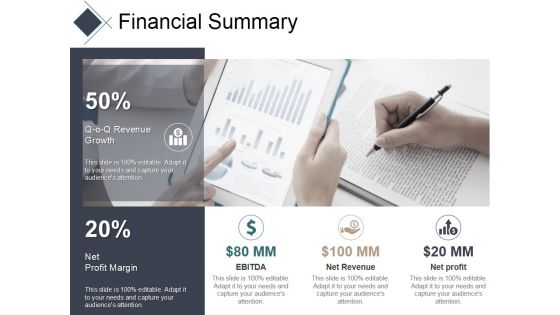
Financial Summary Ppt PowerPoint Presentation Professional Template
This is a financial summary ppt powerpoint presentation professional template. This is a two stage process. The stages in this process are revenue growth, net, profit margin, ebitda, net revenue, net profit.
Pandl Kpis Tabular Form Ppt PowerPoint Presentation Gallery Icon
This is a pandl kpis tabular form ppt powerpoint presentation gallery icon. This is a four stage process. The stages in this process are revenue, cogs, operating profit, net profit.
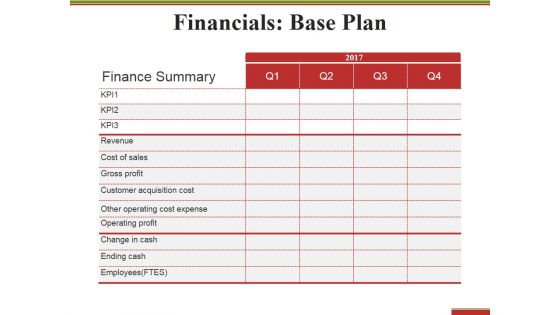
Financials Base Plan Ppt PowerPoint Presentation Styles Graphic Tips
This is a financials base plan ppt powerpoint presentation styles graphic tips. This is a four stage process. The stages in this process are finance summary, revenue, gross profit, operating profit, ending cash.
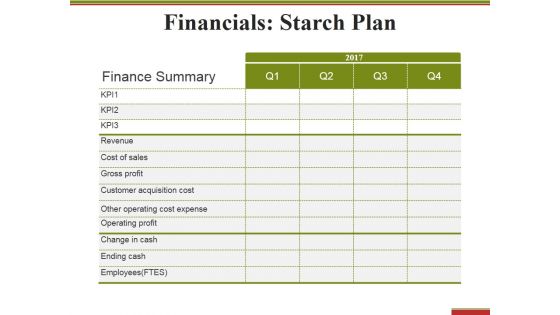
Financials Starch Plan Ppt PowerPoint Presentation Summary Professional
This is a financials starch plan ppt powerpoint presentation summary professional. This is a four stage process. The stages in this process are finance summary, revenue, gross profit, operating profit, ending cash.
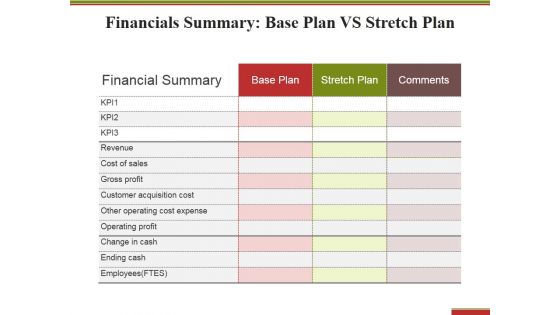
Financials Summary Base Plan Vs Stretch Plan Ppt PowerPoint Presentation File Shapes
This is a financials summary base plan vs stretch plan ppt powerpoint presentation file shapes. This is a three stage process. The stages in this process are finance summary, revenue, gross profit, operating profit, ending cash.
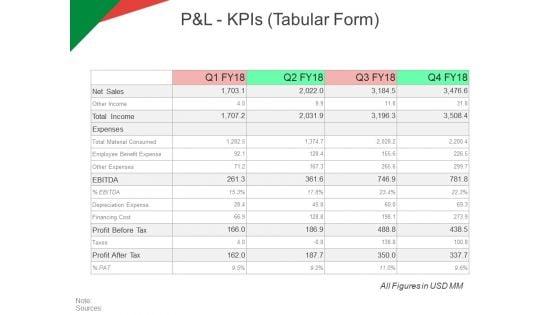
P And L Kpis Tabular Form Ppt PowerPoint Presentation Model Ideas
This is a p and l kpis tabular form ppt powerpoint presentation model ideas. This is a four stage process. The stages in this process are revenue, operating profit, cogs, net profit.

P And L Kpis Ppt PowerPoint Presentation Portfolio Slide
This is a p and l kpis ppt powerpoint presentation portfolio slide. This is a four stage process. The stages in this process are ebitda, profit before tax, profit after tax, expenses, net sales.
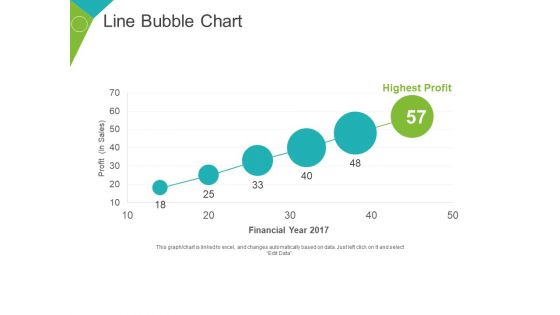
Line Bubble Chart Ppt PowerPoint Presentation Portfolio Slide Portrait
This is a line bubble chart ppt powerpoint presentation portfolio slide portrait. This is a six stage process. The stages in this process are highest profit, financial year, profit in sales, growth, business.
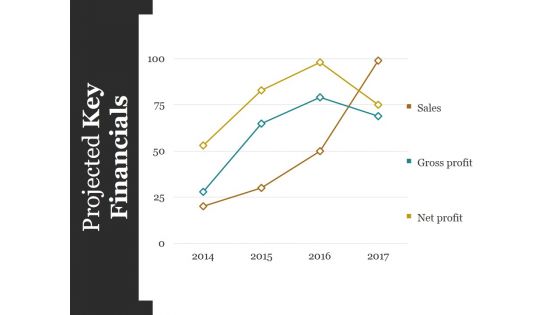
Projected Key Financials Template Ppt PowerPoint Presentation Styles Graphics Design
This is a projected key financials template ppt powerpoint presentation styles graphics design. This is a four stage process. The stages in this process are sales, gross profit, net profit.
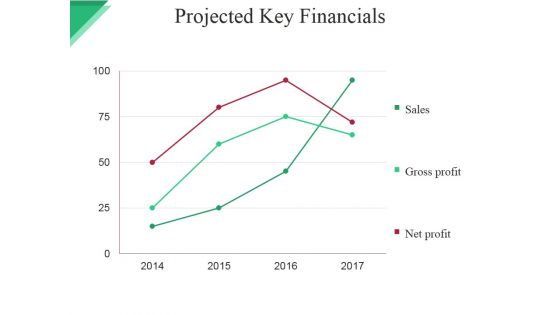
Projected Key Financials Template Ppt PowerPoint Presentation File Graphic Images
This is a projected key financials template ppt powerpoint presentation file graphic images. This is a four stage process. The stages in this process are sales, gross profit, net profit.
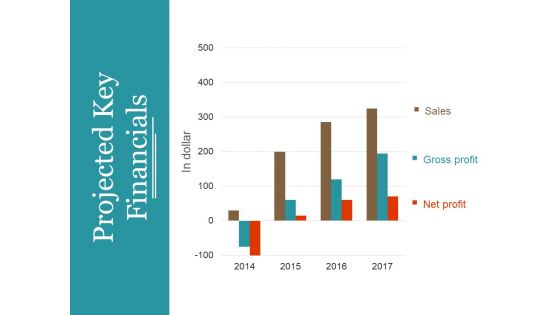
Projected Key Financials Template 1 Ppt PowerPoint Presentation Summary Professional
This is a projected key financials template 1 ppt powerpoint presentation summary professional. This is a three stage process. The stages in this process are in dollar, sales, gross profit, net profit, graph, year.
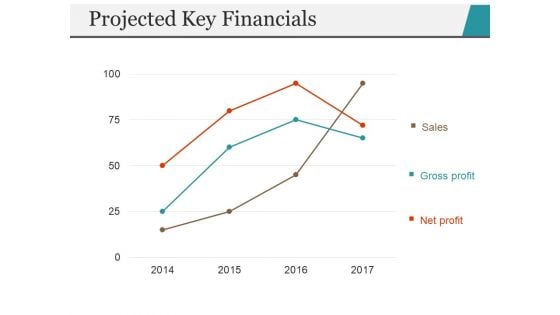
Projected Key Financials Template 2 Ppt PowerPoint Presentation Portfolio Inspiration
This is a projected key financials template 2 ppt powerpoint presentation portfolio inspiration. This is a three stage process. The stages in this process are sales, gross profit, net profit, year, finance.

Scatter Bubble Chart Ppt PowerPoint Presentation Professional Graphics Pictures
This is a scatter bubble chart ppt powerpoint presentation professional graphics pictures. This is a one stage process. The stages in this process are profit in sales, financial year, highest profit, product.
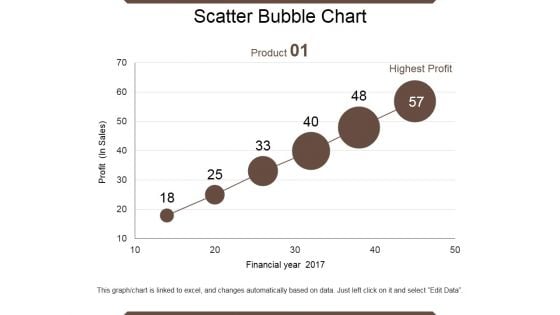
Scatter Bubble Chart Ppt PowerPoint Presentation Summary Files
This is a scatter bubble chart ppt powerpoint presentation summary files. This is a six stage process. The stages in this process are product, financial year, profit, highest profit.
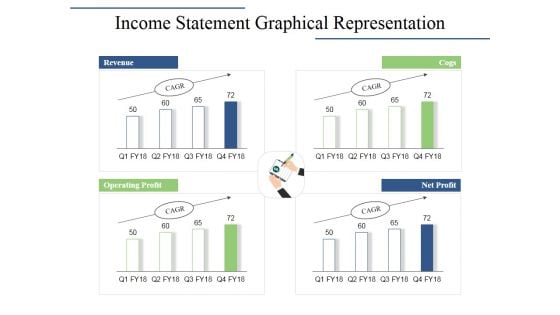
Income Statement Graphical Representation Ppt PowerPoint Presentation Infographics Layouts
This is a income statement graphical representation ppt powerpoint presentation infographics layouts. This is a four stage process. The stages in this process are revenue, cogs, operating profit, net profit.
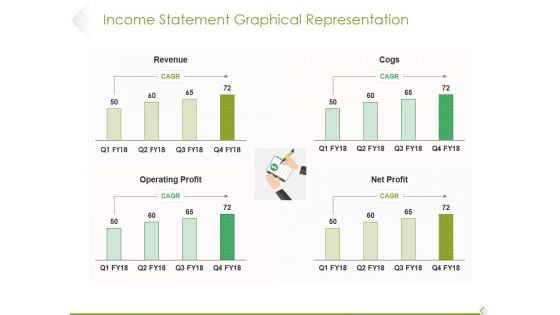
Income Statement Graphical Representation Ppt PowerPoint Presentation Infographic Template Influencers
This is a income statement graphical representation ppt powerpoint presentation infographic template influencers. This is a four stage process. The stages in this process are revenue, cogs, operating profit, profit.
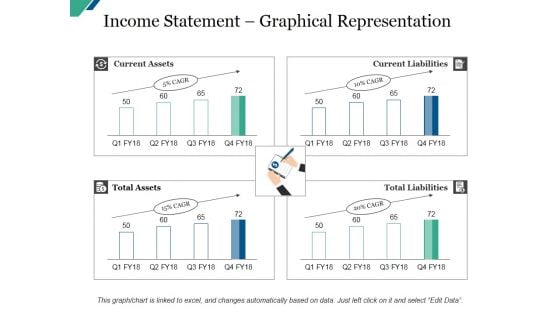
Income Statement Graphical Representation Template Ppt PowerPoint Presentation Model Infographic Template
This is a income statement graphical representation template ppt powerpoint presentation model infographic template. This is a four stage process. The stages in this process are revenue, cogs, operating profit, net profit.

Income Statement Graphical Representation Ppt PowerPoint Presentation Layouts Designs Download
This is a income statement graphical representation ppt powerpoint presentation layouts designs download. This is a four stage process. The stages in this process are revenue, cogs, operating profit, net profit.
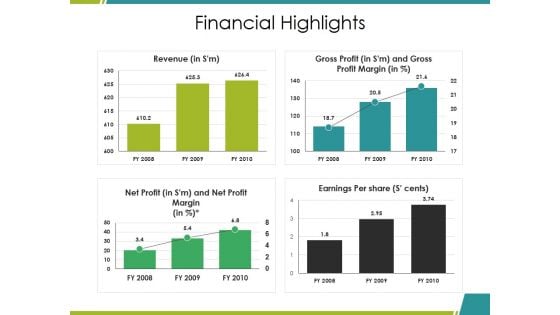
Financial Highlights Ppt PowerPoint Presentation Ideas Graphics Download
This is a financial highlights ppt powerpoint presentation ideas graphics download. This is a four stage process. The stages in this process are revenue, gross profit, net profit, earnings per share, bar graph.
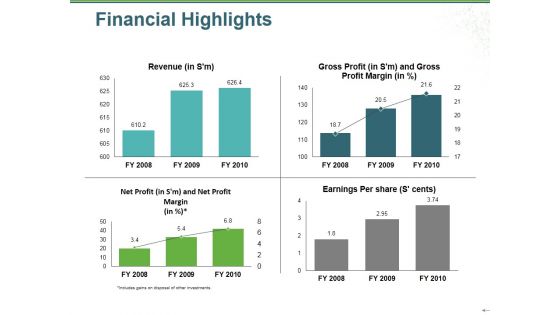
Financial Highlights Ppt PowerPoint Presentation Gallery Graphics Example
This is a financial highlights ppt powerpoint presentation gallery graphics example. This is a four stage process. The stages in this process are revenue, gross profit, net profit, earnings per share, bar graph.
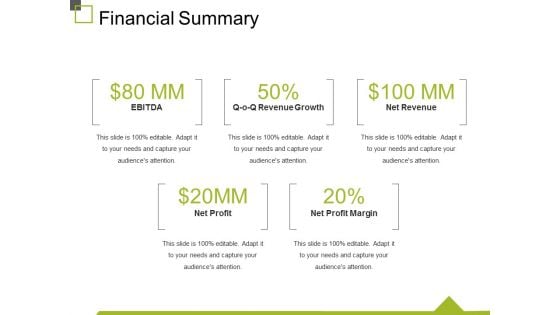
Financial Summary Ppt PowerPoint Presentation Model Demonstration
This is a financial summary ppt powerpoint presentation model demonstration. This is a five stage process. The stages in this process are ebitda, revenue growth, net revenue, net profit margin, net profit.
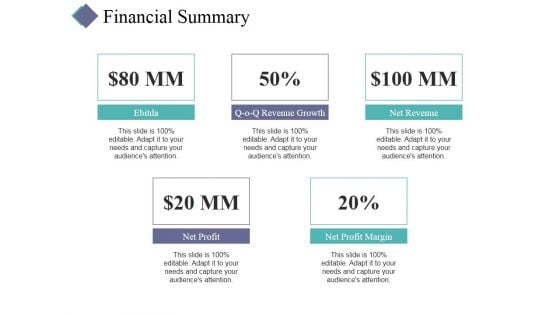
Financial Summary Ppt PowerPoint Presentation Summary Background
This is a financial summary ppt powerpoint presentation summary background. This is a five stage process. The stages in this process are net profit, net profit margin, net revenue, revenue growth.
P And L Kpis Template 2 Ppt PowerPoint Presentation Summary Icon
This is a p and l kpis template 2 ppt powerpoint presentation summary icon. This is a four stage process. The stages in this process are revenue, cogs, operating profit, net profit.
Pandl Kpis Template Ppt PowerPoint Presentation Model Icon
This is a pandl kpis template ppt powerpoint presentation model icon. This is a four stage process. The stages in this process are revenue, cogs, operating profit, net profit.
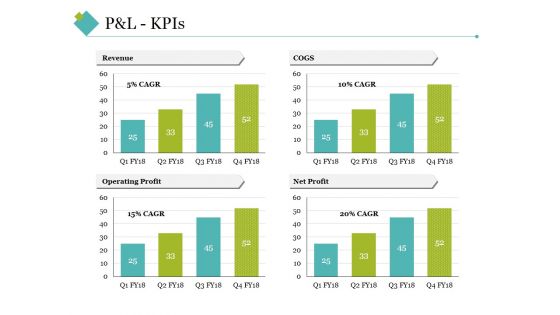
P And L Kpis Template 2 Ppt PowerPoint Presentation Inspiration Grid
This is a p and l kpis template 2 ppt powerpoint presentation inspiration grid. This is a four stage process. The stages in this process are revenue, cogs, operating profit, net profit.
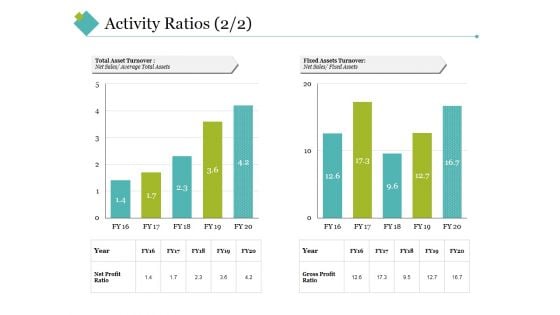
Activity Ratios Template 4 Ppt PowerPoint Presentation Styles Slideshow
This is a activity ratios template 4 ppt powerpoint presentation styles slideshow. This is a two stage process. The stages in this process are total asset turnover, fixed assets turnover, net sales, year, net profit ratio, gross profit ratio.
Income Statement Overview Ppt PowerPoint Presentation Infographic Template Icon
This is a income statement overview ppt powerpoint presentation infographic template icon. This is a five stage process. The stages in this process are revenue, profit margin, operating profit margin.
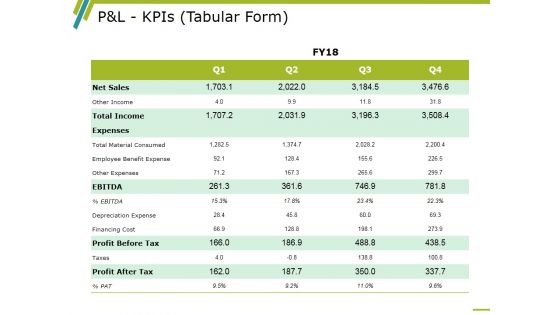
P And L Kpis Template 1 Ppt PowerPoint Presentation Infographics Professional
This is a p and l kpis template 1 ppt powerpoint presentation infographics professional. This is a four stage process. The stages in this process are Other Income, Total Income, Ebitda, Profit Before Tax, Profit After Tax.
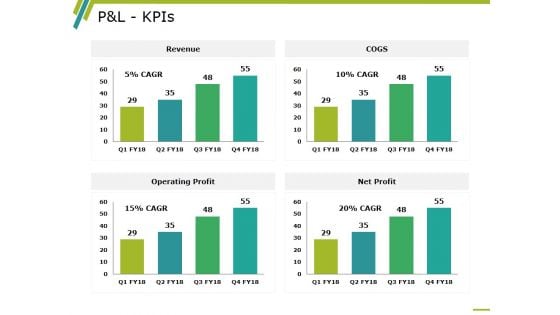
P And L Kpis Template 2 Ppt PowerPoint Presentation Professional Information
This is a p and l kpis template 2 ppt powerpoint presentation professional information. This is a four stage process. The stages in this process are revenue, operating profit, cogs, net profit, business.
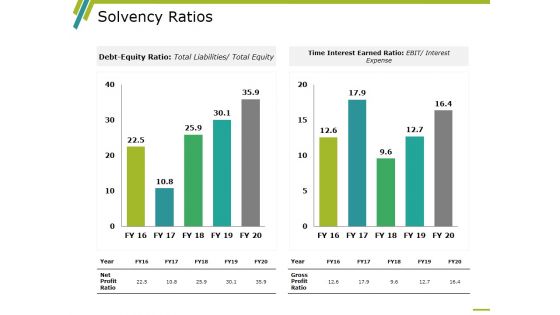
Solvency Ratios Template 1 Ppt PowerPoint Presentation Layouts Graphics Design
This is a solvency ratios template 1 ppt powerpoint presentation layouts graphics design. This is a two stage process. The stages in this process are time interest earned ratio, debt equity ratio, gross profit ratio, net profit ratio, year.


 Continue with Email

 Home
Home


