System Comparison
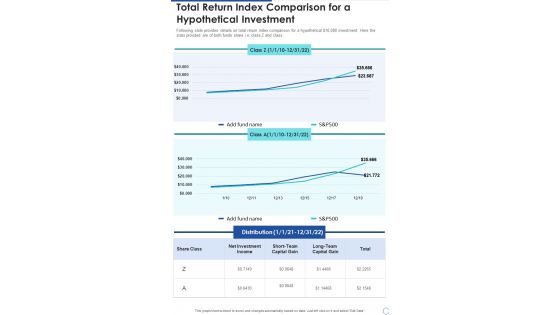
Total Return Index Comparison For A Hypothetical Investment One Pager Documents
Following slide provides details on total return index comparison for a hypothetical 10,000 investment. Here the stats provided are of both funds share i.e. class Z and class A. Presenting you a fantastic Total Return Index Comparison For A Hypothetical Investment One Pager Documents. This piece is crafted on hours of research and professional design efforts to ensure you have the best resource. It is completely editable and its design allow you to rehash its elements to suit your needs. Get this Total Return Index Comparison For A Hypothetical Investment One Pager Documents A4 One-pager now.
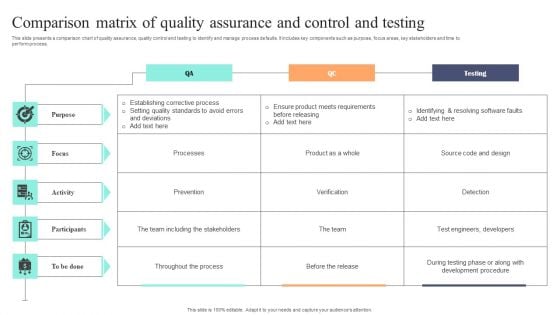
Comparison Matrix Of Quality Assurance And Control And Testing Graphics PDF
This slide presents a comparison chart of quality assurance, quality control and testing to identify and manage process defaults. It includes key components such as purpose, focus areas, key stakeholders and time to perform process. Showcasing this set of slides titled Comparison Matrix Of Quality Assurance And Control And Testing Graphics PDF. The topics addressed in these templates are Purpose, Focus, Activity. All the content presented in this PPT design is completely editable. Download it and make adjustments in color, background, font etc. as per your unique business setting.
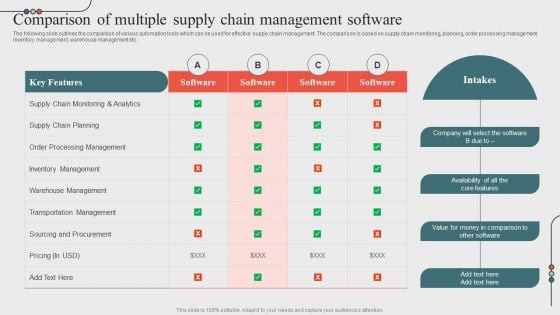
Comparison Of Multiple Supply Chain Managementoptimizing Business Processes Through Automation Themes PDF
The following slide outlines the comparison of various automation tools which can be used for effective supply chain management. The comparison is based on supply chain monitoring, planning, order processing management, inventory management, warehouse management etc. Crafting an eye catching presentation has never been more straightforward. Let your presentation shine with this tasteful yet straightforward Comparison Of Multiple Supply Chain Managementoptimizing Business Processes Through Automation Themes PDF template. It offers a minimalistic and classy look that is great for making a statement. The colors have been employed intelligently to add a bit of playfulness while still remaining professional. Construct the ideal Comparison Of Multiple Supply Chain Managementoptimizing Business Processes Through Automation Themes PDF that effortlessly grabs the attention of your audience. Begin now and be certain to wow your customers.

Various Billing Software Comparison Chart Ppt PowerPoint Presentation File Diagrams PDF
Following slide represents comparative analysis of various software for company billing system. It includes various parameters such as prices, installation, time tracking, individual invoices, expense tracking etc. Do you have an important presentation coming up Are you looking for something that will make your presentation stand out from the rest Look no further than Various Billing Software Comparison Chart Ppt PowerPoint Presentation File Diagrams PDF With our professional designs, you can trust that your presentation will pop and make delivering it a smooth process. And with Slidegeeks, you can trust that your presentation will be unique and memorable. So why wait Grab Various Billing Software Comparison Chart Ppt PowerPoint Presentation File Diagrams PDF today and make your presentation stand out from the rest.
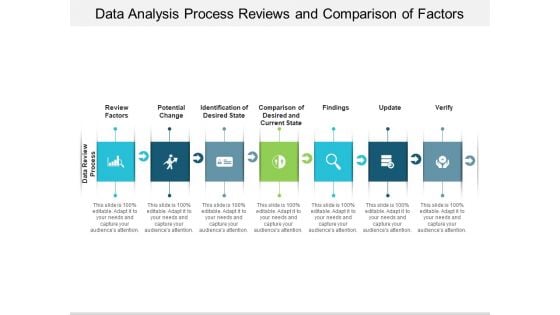
Data Analysis Process Reviews And Comparison Of Factors Ppt PowerPoint Presentation Infographic Template Graphics Template
This is a data analysis process reviews and comparison of factors ppt powerpoint presentation infographic template graphics template. This is a seven stage process. The stages in this process are data analysis, data review, data evaluation.
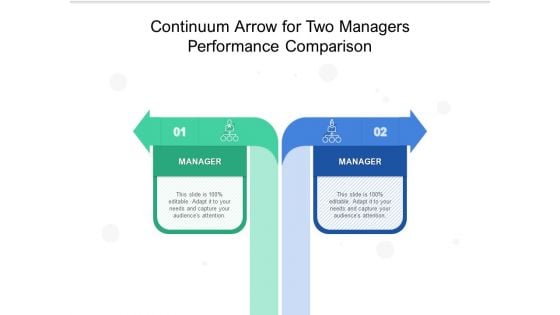
Continuum Arrow For Two Managers Performance Comparison Ppt PowerPoint Presentation Outline Layouts PDF
Persuade your audience using this continuum arrow for two managers performance comparison ppt powerpoint presentation outline layouts pdf. This PPT design covers two stages, thus making it a great tool to use. It also caters to a variety of topics including continuum arrow for two managers performance comparison. Download this PPT design now to present a convincing pitch that not only emphasizes the topic but also showcases your presentation skills.
Chart Illustrating Two Year Comparison Of Business Data Icon Ppt Outline Example Topics PDF
Persuade your audience using this Chart Illustrating Two Year Comparison Of Business Data Icon Ppt Outline Example Topics PDF. This PPT design covers three stages, thus making it a great tool to use. It also caters to a variety of topics including chart illustrating two year comparison of business data icon. Download this PPT design now to present a convincing pitch that not only emphasizes the topic but also showcases your presentation skills.
Icon For Comparison Of Employee Headcount Analysis In Organization Ppt PowerPoint Presentation Outline Rules PDF
Persuade your audience using this Icon For Comparison Of Employee Headcount Analysis In Organization Ppt PowerPoint Presentation Outline Rules PDF. This PPT design covers four stages, thus making it a great tool to use. It also caters to a variety of topics including Icon Comparison, Employee Headcount, Analysis Organization. Download this PPT design now to present a convincing pitch that not only emphasizes the topic but also showcases your presentation skills.
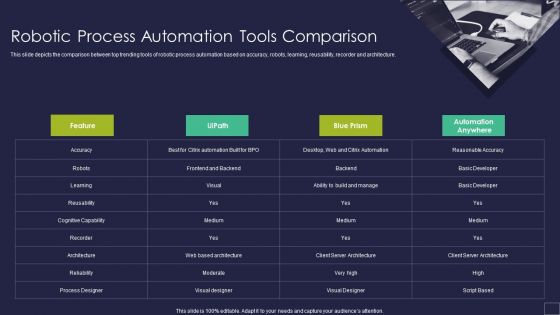
Robotic Process Automation Tools Comparison Robotic Process Automation Technology Rules PDF
This slide depicts the comparison between top trending tools of robotic process automation based on accuracy, robots, learning, reusability, recorder and architecture.Deliver an awe inspiring pitch with this creative Robotic Process Automation Tools Comparison Robotic Process Automation Technology Rules PDF bundle. Topics like Process Designer, Architecture, Cognitive Capability can be discussed with this completely editable template. It is available for immediate download depending on the needs and requirements of the user.
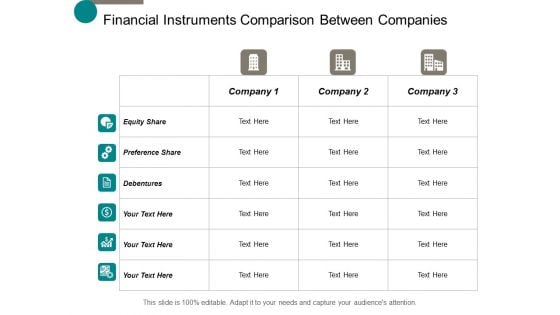
Financial Instruments Comparison Between Companies Ppt Powerpoint Presentation File Slide Portrait
This is a financial instruments comparison between companies ppt powerpoint presentation file slide portrait. This is a three stage process. The stages in this process are business, management, planning, strategy, marketing.
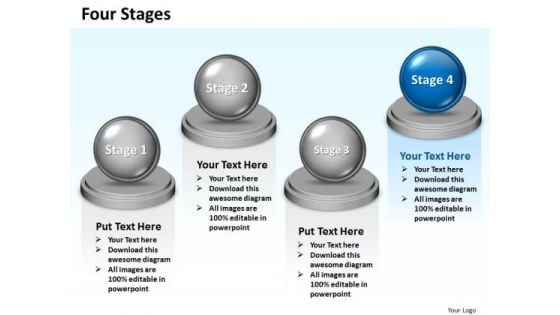
Ppt Comparison Swim Lane Diagram PowerPoint Template Of 4 State Templates
PPT comparison swim lane diagram powerpoint template of 4 state Templates-This image has been professionally designed to emphasize the concept of business strategy. Use this Swim Lane Diagram to map and improve the processes between departments and teams in your organization. This template is carefully considered and implemented with objectives of beauty, consistency, clarity, and most important, audience impact. Our template will make your presentation look impressive and stunning.-PPT comparison swim lane diagram powerpoint template of 4 state Templates-3d, Balance, Ball, Best, Board, Business, Clipart, Color, Compare, Comparison, Concept, Graphic, Heavy, Illustration, Isolated, Level, Nobody, Opposite, Orange, Parity, Render, Rendered, Reverse, Scale, Simple, Sphere Our Ppt Comparison Swim Lane Diagram PowerPoint Template Of 4 State Templates are cent per cent adaptable. They conform to all conditions.
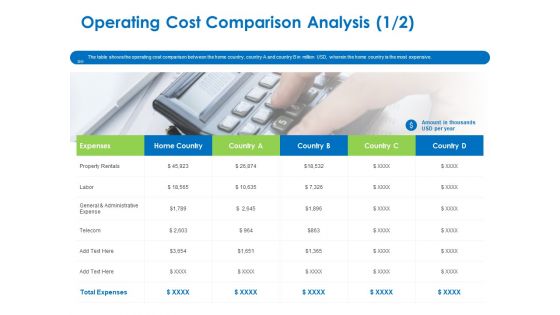
Relocation Of Business Process Offshoring Operating Cost Comparison Analysis Infographics PDF
The table shows the operating cost comparison between the home country, country A and country B in million USD, wherein the home country is the most expensive. Deliver an awe-inspiring pitch with this creative relocation of business process offshoring operating cost comparison analysis infographics pdf bundle. Topics like expenses, home country, property rentals, total expenses can be discussed with this completely editable template. It is available for immediate download depending on the needs and requirements of the user.
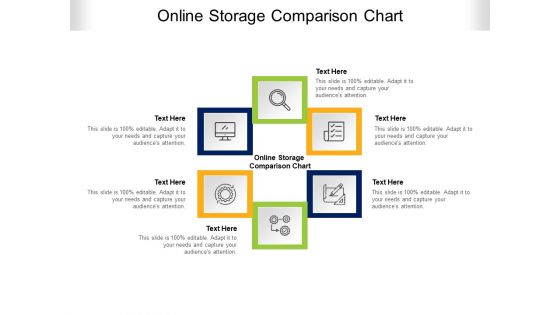
Online Storage Comparison Chart Ppt PowerPoint Presentation Show Topics Cpb Pdf
Presenting this set of slides with name online storage comparison chart ppt powerpoint presentation show topics cpb pdf. This is an editable Powerpoint six stages graphic that deals with topics like online storage comparison chart to help convey your message better graphically. This product is a premium product available for immediate download and is 100 percent editable in Powerpoint. Download this now and use it in your presentations to impress your audience.

Staff Skills Comparison In Self Introduction Ppt PowerPoint Presentation Model Ideas PDF
Persuade your audience using this staff skills comparison in self introduction ppt powerpoint presentation model ideas pdf. This PPT design covers four stages, thus making it a great tool to use. It also caters to a variety of topics including staff skills comparison in self introduction. Download this PPT design now to present a convincing pitch that not only emphasizes the topic but also showcases your presentation skills.
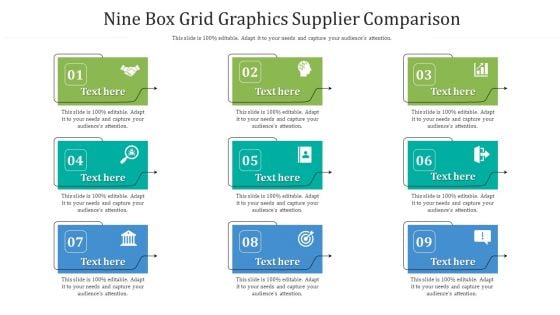
Nine Box Grid Graphics Supplier Comparison Ppt PowerPoint Presentation Gallery Smartart PDF
Persuade your audience using this nine box grid graphics supplier comparison ppt powerpoint presentation gallery smartart pdf. This PPT design covers nine stages, thus making it a great tool to use. It also caters to a variety of topics including nine box grid graphics supplier comparison. Download this PPT design now to present a convincing pitch that not only emphasizes the topic but also showcases your presentation skills.
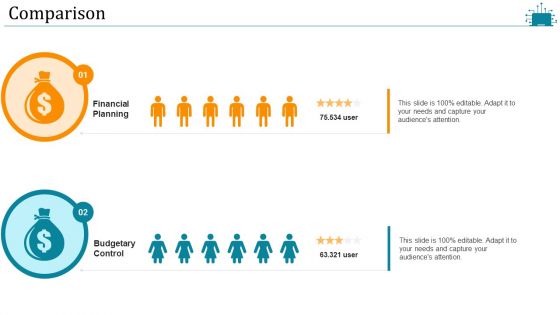
Cloud Intelligence Framework For Application Consumption Comparison Ppt Professional Gridlines PDF
This is a cloud intelligence framework for application consumption comparison ppt professional gridlines pdf template with various stages. Focus and dispense information on two stages using this creative set, that comes with editable features. It contains large content boxes to add your information on topics like comparison, financial planning, budgetary control. You can also showcase facts, figures, and other relevant content using this PPT layout. Grab it now.
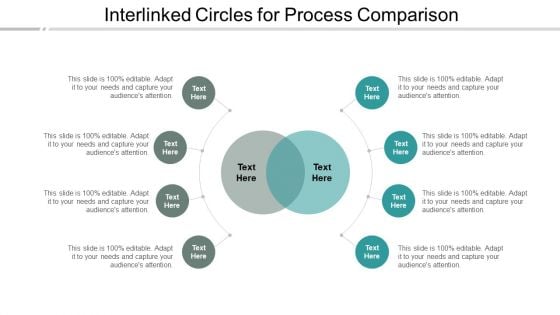
Interlinked Circles For Process Comparison Ppt Powerpoint Presentation File Slide Portrait
This is a interlinked circles for process comparison ppt powerpoint presentation file slide portrait. This is a eight stage process. The stages in this process are circle cluster, cyclic cluster, circular cluster.
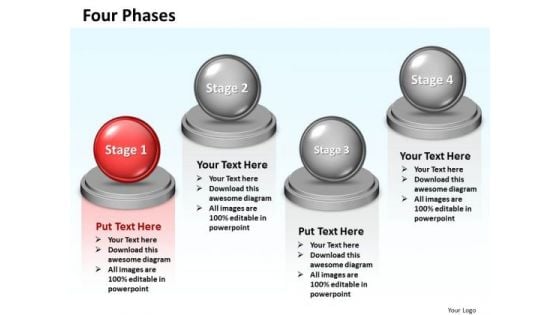
Ppt Comparison Swim Lane Diagram PowerPoint Template Of 4 Phases Templates
PPT comparison swim lane diagram powerpoint template of 4 phases Templates-This image has been professionally designed to displays the relationship between a business process and the functional units (such as departments) responsible for that process. It is a powerful tool conceived to enable you to define your message in your presentations. This Professional looking template of Swim lane diagram which help you create organizational presentations rapidly.-PPT comparison swim lane diagram powerpoint template of 4 phases Templates-3d, Balance, Ball, Best, Board, Business, Clipart, Color, Compare, Comparison, Concept, Graphic, Heavy, Illustration, Isolated, Level, Nobody, Opposite, Orange, Parity, Render, Rendered, Reverse, Scale, Simple, Sphere Being fashionable has advantages. Experience them with our Ppt Comparison Swim Lane Diagram PowerPoint Template Of 4 Phases Templates.

IOT Industry Assessment Revenue Model Comparison Of Leading Companies Ppt Example 2015 PDF
Following table shows leading companys business model comparison based on features like model, purpose and process. Business model covered are pay per usage, subscription based and asset sharing model. Deliver an awe inspiring pitch with this creative iot industry assessment revenue model comparison of leading companies ppt example 2015 pdf bundle. Topics like pricing model, purpose, process, monitor, business can be discussed with this completely editable template. It is available for immediate download depending on the needs and requirements of the user.
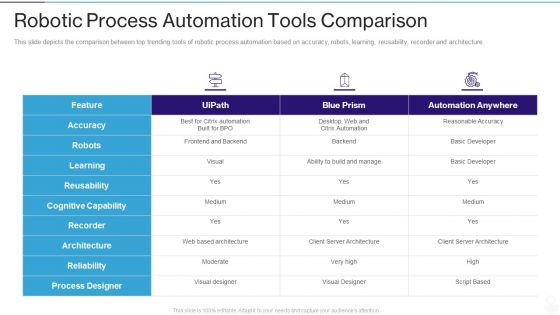
RPA IT Robotic Process Automation Tools Comparison Ppt File Slide Portrait PDF
This slide depicts the comparison between top trending tools of robotic process automation based on accuracy, robots, learning, reusability, recorder and architecture. Deliver and pitch your topic in the best possible manner with this rpa it robotic process automation tools comparison ppt file slide portrait pdf. Use them to share invaluable insights on reusability, process designer, accuracy, architecture, developer and impress your audience. This template can be altered and modified as per your expectations. So, grab it now.
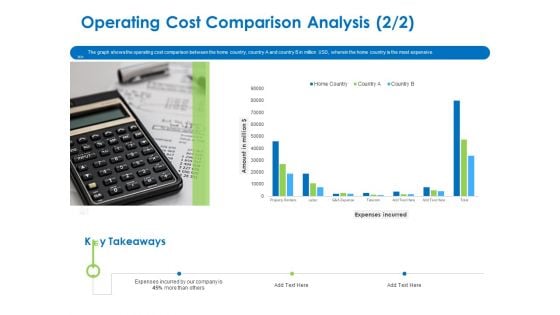
Relocation Of Business Process Offshoring Operating Cost Comparison Analysis Expenses Professional PDF
The graph shows the operating cost comparison between the home country, country A and country B in million USD, wherein the home country is the most expensive. Deliver an awe-inspiring pitch with this creative relocation of business process offshoring operating cost comparison analysis expenses professional pdf bundle. Topics like expenses incurred, property rentals, labor, g and a expense, telecom can be discussed with this completely editable template. It is available for immediate download depending on the needs and requirements of the user.
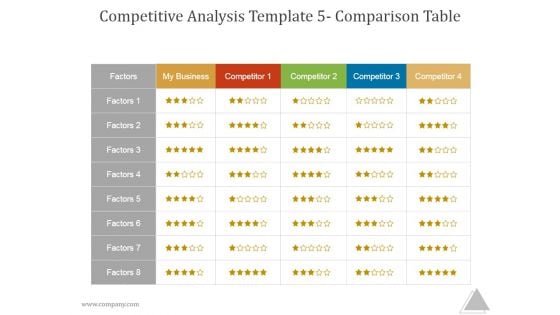
Competitive Analysis Template 5 Comparison Table Ppt PowerPoint Presentation Background Designs
This is a competitive analysis template 5 comparison table ppt powerpoint presentation background designs. This is a four stage process. The stages in this process are factors, my business, competitor, marketing, business.
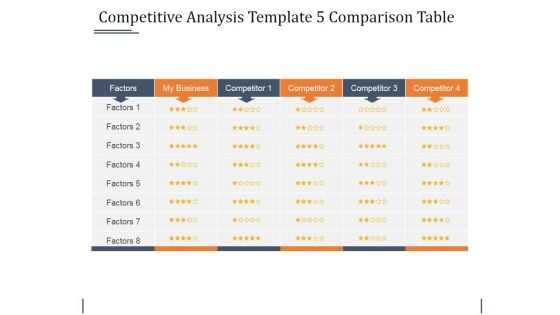
Competitive Analysis Template 5 Comparison Table Ppt PowerPoint Presentation Gallery Graphics Pictures
This is a competitive analysis template 5 comparison table ppt powerpoint presentation gallery graphics pictures. This is a four stage process. The stages in this process are factors, my business, competitor.
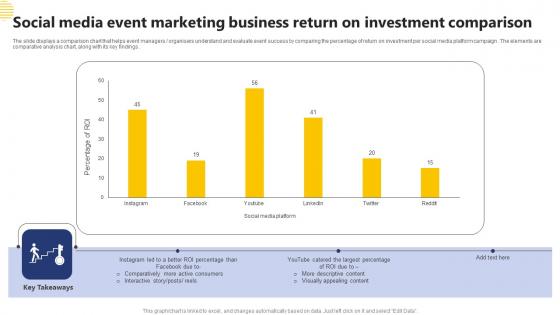
Social Media Event Marketing Business Return On Investment Comparison Microsoft Pdf
The slide displays a comparison chart that helps event managers organisers understand and evaluate event success by comparing the percentage of return on investment per social media platform campaign. The elements are comparative analysis chart, along with its key findings. Showcasing this set of slides titled Social Media Event Marketing Business Return On Investment Comparison Microsoft Pdf The topics addressed in these templates are Social Media Event, Marketing Business, Investment Comparison All the content presented in this PPT design is completely editable. Download it and make adjustments in color, background, font etc. as per your unique business setting. The slide displays a comparison chart that helps event managers organisers understand and evaluate event success by comparing the percentage of return on investment per social media platform campaign. The elements are comparative analysis chart, along with its key findings.
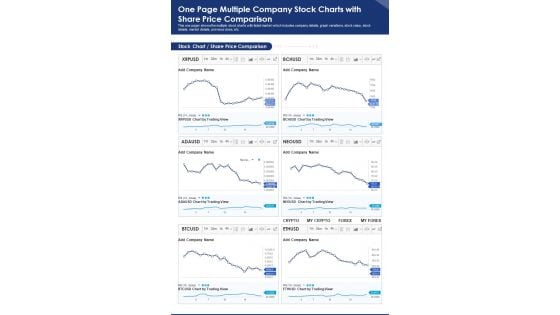
One Page Multiple Company Stock Charts With Share Price Comparison PDF Document PPT Template
Presenting you an exemplary One Page Multiple Company Stock Charts With Share Price Comparison PDF Document PPT Template. Our one-pager template comprises all the must-have essentials of an inclusive document. You can edit it with ease, as its layout is completely editable. With such freedom, you can tweak its design and other elements to your requirements. Download this One Page Multiple Company Stock Charts With Share Price Comparison PDF Document PPT Template Download now.
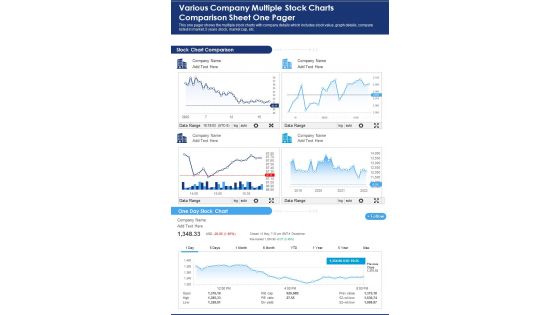
Various Company Multiple Stock Charts Comparison Sheet One Pager PDF Document PPT Template
Presenting you a fantastic Various Company Multiple Stock Charts Comparison Sheet One Pager PDF Document PPT Template. This one-pager document is crafted on hours of research and professional design efforts to ensure you have the best resource. It is completely editable and its design allow you to rehash its elements to suit your needs. Get this Various Company Multiple Stock Charts Comparison Sheet One Pager PDF Document PPT Template Download now.
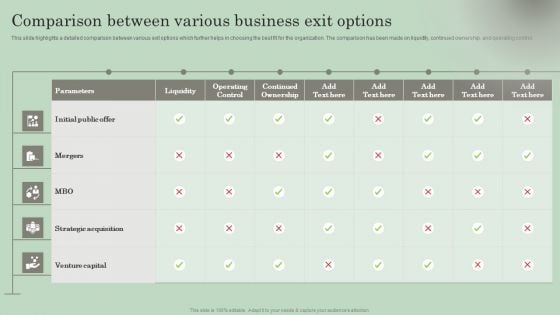
Exit Strategies For Coaching Start Up Comparison Between Various Business Exit Options Sample PDF
This slide highlights a detailed comparison between various exit options which further helps in choosing the best fit for the organization. The comparison has been made on liquidity, continued ownership, and operating control. Explore a selection of the finest Exit Strategies For Coaching Start Up Comparison Between Various Business Exit Options Sample PDF here. With a plethora of professionally designed and pre-made slide templates, you can quickly and easily find the right one for your upcoming presentation. You can use our Exit Strategies For Coaching Start Up Comparison Between Various Business Exit Options Sample PDF to effectively convey your message to a wider audience. Slidegeeks has done a lot of research before preparing these presentation templates. The content can be personalized and the slides are highly editable. Grab templates today from Slidegeeks.

Comparison Chart Return On Capital Employed Ppt PowerPoint Presentation Portfolio Templates
This is a comparison chart return on capital employed ppt powerpoint presentation portfolio templates. This is a two stage process. The stages in this process are accounting ratio, roce, return on capital employed.
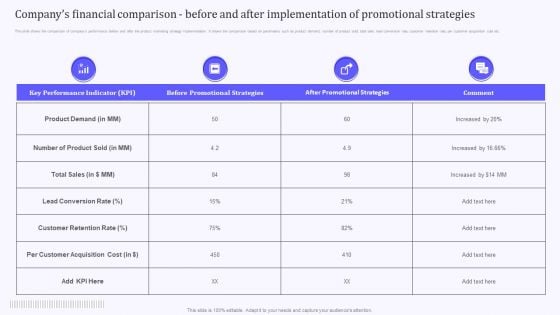
Product Marketing And Awareness Programs Companys Financial Comparison Before And After Rules PDF
This slide shows the comparison of companys performance before and after the product marketing strategy implementation. It shows the comparison based on parameters such as product demand, number of product sold, total sale, lead conversion rate, customer retention rate, per customer acquisition cost etc. Do you have an important presentation coming up Are you looking for something that will make your presentation stand out from the rest Look no further than Product Marketing And Awareness Programs Companys Financial Comparison Before And After Rules PDF. With our professional designs, you can trust that your presentation will pop and make delivering it a smooth process. And with Slidegeeks, you can trust that your presentation will be unique and memorable. So why wait Grab Product Marketing And Awareness Programs Companys Financial Comparison Before And After Rules PDF today and make your presentation stand out from the rest.
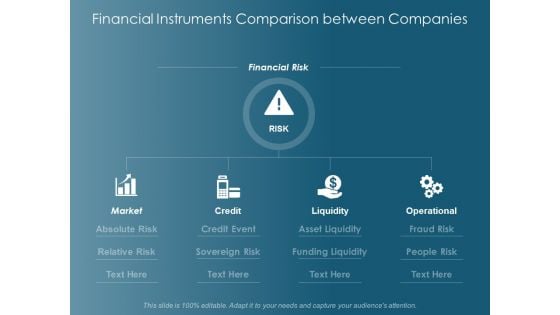
Financial Instruments Comparison Between Companies Operational Ppt Powerpoint Presentation Inspiration Samples
This is a financial instruments comparison between companies operational ppt powerpoint presentation inspiration samples. This is a five stage process. The stages in this process are financial risk, market, credit, liquidity, operational.
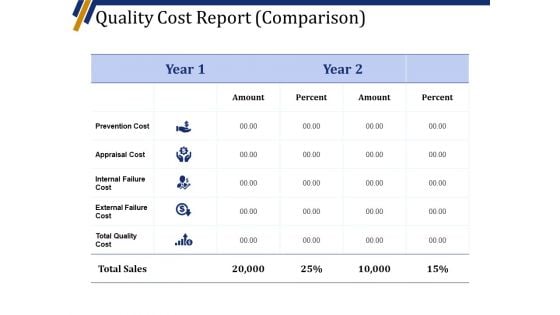
Quality Cost Report Comparison Template 1 Ppt PowerPoint Presentation Pictures Infographics
This is a quality cost report comparison template 1 ppt powerpoint presentation pictures infographics. This is a five stage process. The stages in this process are amount, percent, year, appraisal cost, prevention cost.
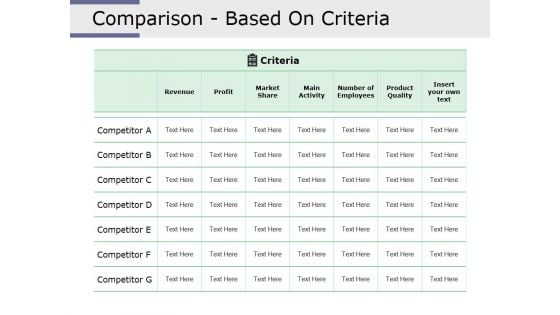
Comparison Based On Criteria Ppt PowerPoint Presentation Infographic Template Layout Ideas
This is a comparison based on criteria ppt powerpoint presentation infographic template layout ideas. This is a seven stage process. The stages in this process are revenue, profit, market share, main activity, number of employees, product quality.

Comparison Based On Criteria Ppt PowerPoint Presentation Infographic Template Graphic Tips
This is a comparison based on criteria ppt powerpoint presentation infographic template graphic tips. This is a seven stage process. The stages in this process are revenue, market share, main activity, number of employee, product quality.
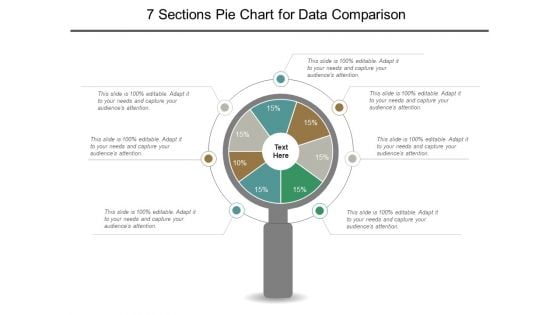
7 Sections Pie Chart For Data Comparison Ppt PowerPoint Presentation File Graphics Template
This is a 7 sections pie chart for data comparison ppt powerpoint presentation file graphics template. This is a seven stage process. The stages in this process are 6 piece pie chart, 6 segment pie chart, 6 parts pie chart.

Revenue Cost Per Employee Comparison Ppt PowerPoint Presentation Summary Background Image
This is a revenue cost per employee comparison ppt powerpoint presentation summary background image. This is a two stage process. The stages in this process are company, business, marketing, management, success.
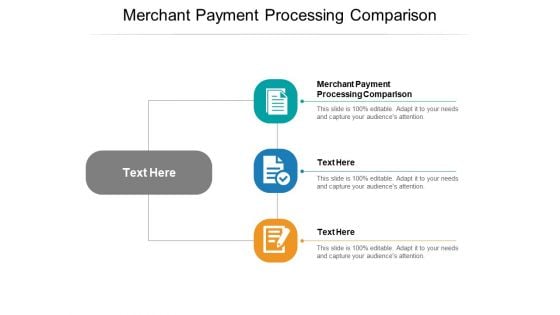
Merchant Payment Processing Comparison Ppt PowerPoint Presentation Model Graphics Tutorials Cpb Pdf
Presenting this set of slides with name merchant payment processing comparison ppt powerpoint presentation model graphics tutorials cpb pdf. This is an editable Powerpoint three stages graphic that deals with topics like merchant payment processing comparison to help convey your message better graphically. This product is a premium product available for immediate download and is 100 percent editable in Powerpoint. Download this now and use it in your presentations to impress your audience.
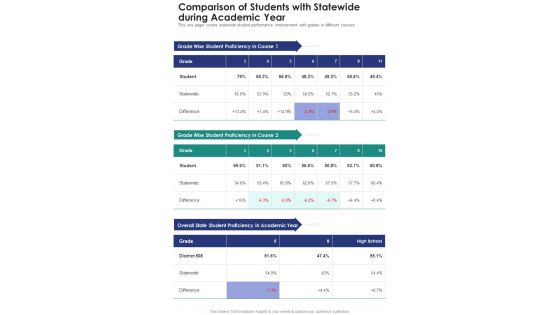
Comparison Of Students With Statewide During Academic Year One Pager Documents
This one pager covers statewide student performance improvement with grades in different courses. Presenting you an exemplary Comparison Of Students With Statewide During Academic Year One Pager Documents. Our one-pager comprises all the must-have essentials of an inclusive document. You can edit it with ease, as its layout is completely editable. With such freedom, you can tweak its design and other elements to your requirements. Download this Comparison Of Students With Statewide During Academic Year One Pager Documents brilliant piece now.
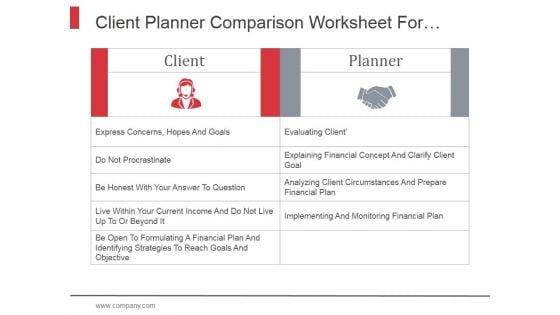
Client Planner Comparison Worksheet For Establishing Financial Direction Ppt PowerPoint Presentation Deck
This is a client planner comparison worksheet for establishing financial direction ppt powerpoint presentation deck. This is a two stage process. The stages in this process are worksheet, financial direction, communication, financial analysis.
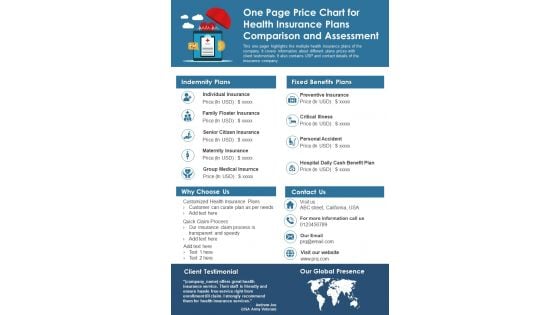
One Page Price Chart For Health Insurance Plans Comparison And Assessment PDF Document PPT Template
Presenting you an exemplary One Page Price Chart For Health Insurance Plans Comparison And Assessment PDF Document PPT Template. Our one-pager template comprises all the must-have essentials of an inclusive document. You can edit it with ease, as its layout is completely editable. With such freedom, you can tweak its design and other elements to your requirements. Download this One Page Price Chart For Health Insurance Plans Comparison And Assessment PDF Document PPT Template Download now.
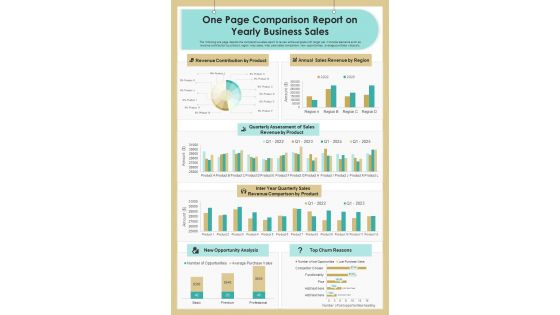
One Page Comparison Report On Yearly Business Sales PDF Document PPT Template
Presenting you an exemplary One Page Comparison Report On Yearly Business Sales PDF Document PPT Template. Our one-pager template comprises all the must-have essentials of an inclusive document. You can edit it with ease, as its layout is completely editable. With such freedom, you can tweak its design and other elements to your requirements. Download this One Page Comparison Report On Yearly Business Sales PDF Document PPT Template Download now.
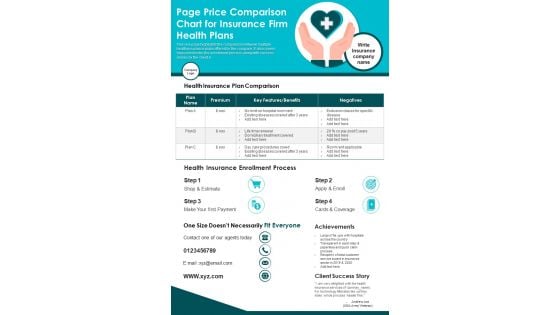
Page Price Comparison Chart For Insurance Firm Health Plans PDF Document PPT Template
Presenting you a fantastic Page Price Comparison Chart For Insurance Firm Health Plans PDF Document PPT Template. This one-pager document is crafted on hours of research and professional design efforts to ensure you have the best resource. It is completely editable and its design allow you to rehash its elements to suit your needs. Get this Page Price Comparison Chart For Insurance Firm Health Plans PDF Document PPT Template Download now.
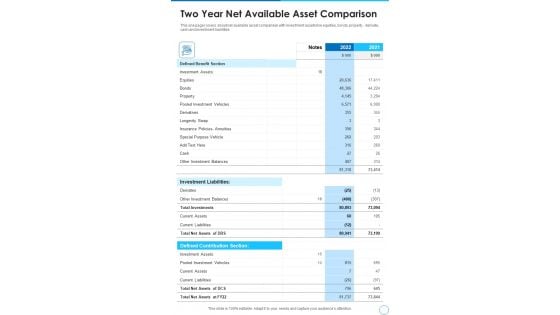
Two Year Net Available Asset Comparison Template 139 One Pager Documents
Presenting you a fantastic Two Year Net Available Asset Comparison Template 139 One Pager Documents. This piece is crafted on hours of research and professional design efforts to ensure you have the best resource. It is completely editable and its design allow you to rehash its elements to suit your needs. Get this Two Year Net Available Asset Comparison Template 139 One Pager Documents A4 One-pager now.
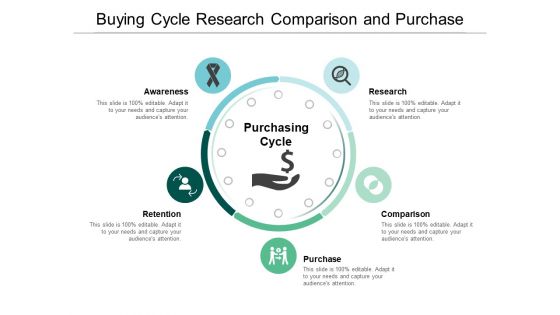
Buying Cycle Research Comparison And Purchase Ppt PowerPoint Presentation Ideas Aids
This is a buying cycle research comparison and purchase ppt powerpoint presentation ideas aids. This is a five stage process. The stages in this process are purchasing process, purchasing cycle, procurement cycle.
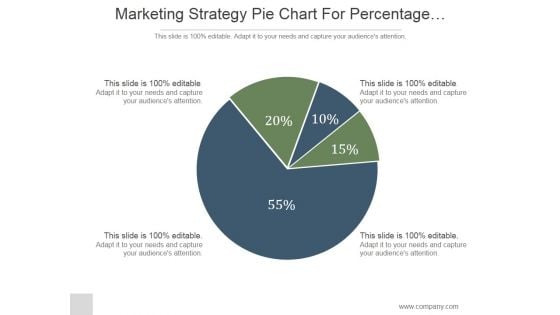
Marketing Strategy Pie Chart For Percentage Comparison Ppt PowerPoint Presentation Ideas
This is a marketing strategy pie chart for percentage comparison ppt powerpoint presentation ideas. This is a four stage process. The stages in this process are marketing, pie, strategy, finance, percentage.
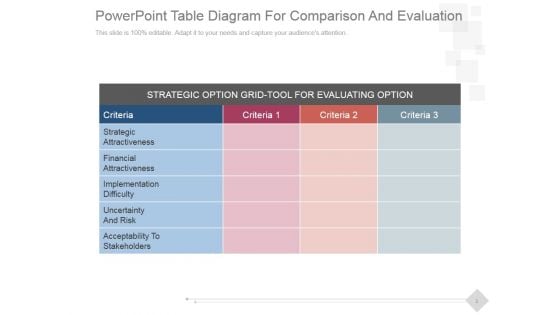
PowerPoint Table Diagram For Comparison And Evaluation Ppt PowerPoint Presentation Microsoft
This is a powerpoint table diagram for comparison and evaluation ppt powerpoint presentation microsoft. This is a three stage process. The stages in this process are financial, attractiveness, strategic, implementation, difficulty.
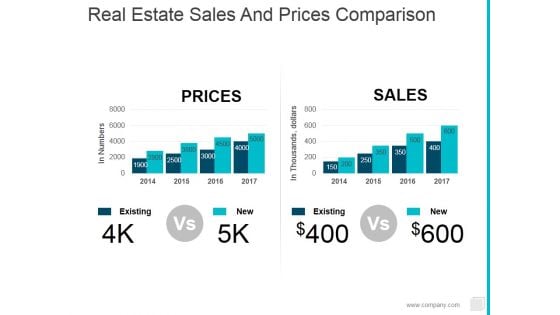
Real Estate Sales And Prices Comparison Ppt PowerPoint Presentation Show Rules
This is a real estate sales and prices comparison ppt powerpoint presentation show rules. This is a two stage process. The stages in this process are existing, new, prices, sales.
Current State Analysis Financial Comparison Ppt PowerPoint Presentation Icon Clipart Images
This is a current state analysis financial comparison ppt powerpoint presentation icon clipart images. This is a five stage process. The stages in this process are business, finance, analysis, marketing, growth, success.

Current State Analysis Financial Comparison Ppt Powerpoint Presentation File Graphic Tips
This is a current state analysis financial comparison ppt powerpoint presentation file graphic tips. This is a five stage process. The stages in this process are revenue, profits, cash balance.
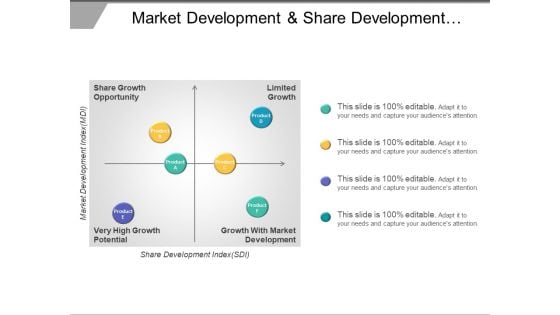
Market Development And Share Development Comparison Matrix Ppt PowerPoint Presentation File Graphics Example
This is a market development and share development comparison matrix ppt powerpoint presentation file graphics example. This is a four stage process. The stages in this process are market overview, market potential, market assessments.
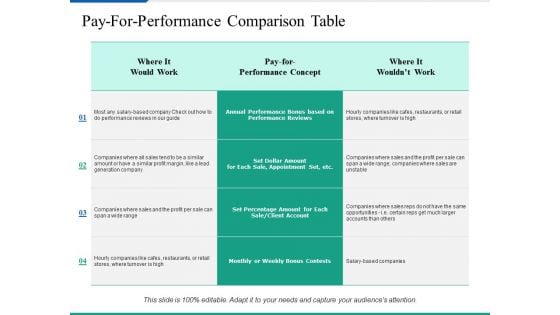
Pay For Performance Comparison Table Ppt PowerPoint Presentation Inspiration Layout Ideas
This is a pay for performance comparison table ppt powerpoint presentation inspiration layout ideas. This is a four stage process. The stages in this process are table, management, business, marketing.
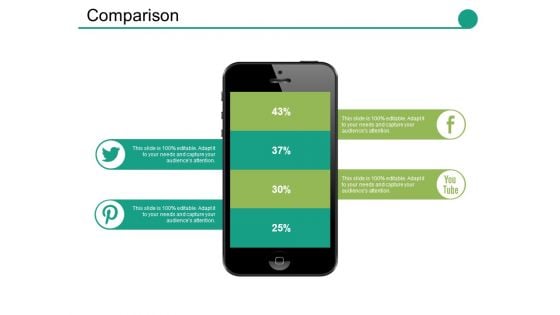
Comparison Ppt PowerPoint Presentation Show Slide Download Ppt PowerPoint Presentation Professional Smartart
This is a comparison ppt powerpoint presentation show slide download ppt powerpoint presentation professional smartart. This is a four stage process. The stages in this process are compare, percentage, finance, business, marketing.
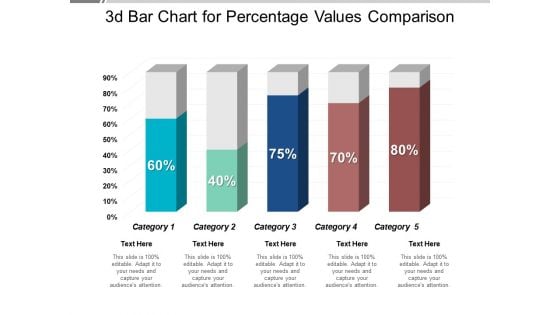
3D Bar Chart For Percentage Values Comparison Ppt PowerPoint Presentation Professional Visual Aids
This is a 3d bar chart for percentage values comparison ppt powerpoint presentation professional visual aids. This is a five stage process. The stages in this process are art, colouring, paint brush.
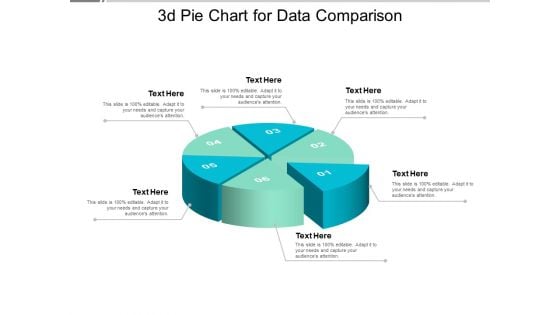
3D Pie Chart For Data Comparison Ppt PowerPoint Presentation Model Design Ideas
This is a 3d pie chart for data comparison ppt powerpoint presentation model design ideas. This is a six stage process. The stages in this process are art, colouring, paint brush.
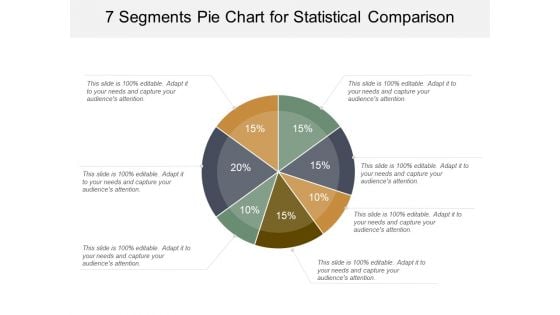
7 Segments Pie Chart For Statistical Comparison Ppt PowerPoint Presentation Gallery Visual Aids
This is a 7 segments pie chart for statistical comparison ppt powerpoint presentation gallery visual aids. This is a seven stage process. The stages in this process are 6 piece pie chart, 6 segment pie chart, 6 parts pie chart.
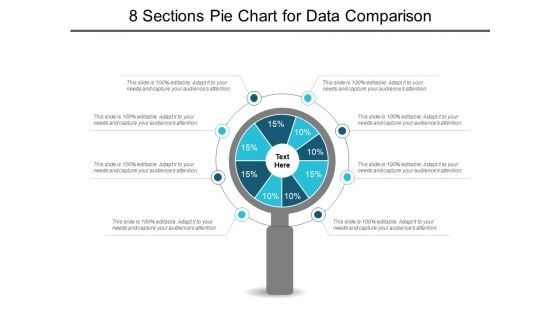
8 Sections Pie Chart For Data Comparison Ppt PowerPoint Presentation Show Slideshow
This is a 8 sections pie chart for data comparison ppt powerpoint presentation show slideshow. This is a eight stage process. The stages in this process are 6 piece pie chart, 6 segment pie chart, 6 parts pie chart.
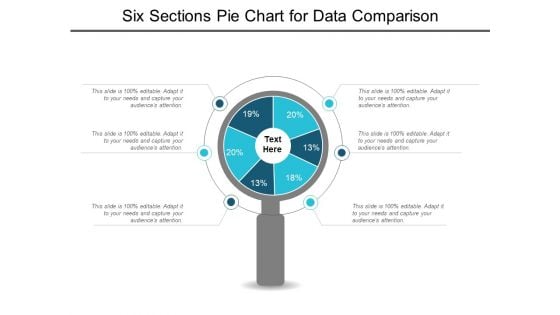
Six Sections Pie Chart For Data Comparison Ppt PowerPoint Presentation Styles Graphics Example
This is a six sections pie chart for data comparison ppt powerpoint presentation styles graphics example. This is a six stage process. The stages in this process are 6 piece pie chart, 6 segment pie chart, 6 parts pie chart.
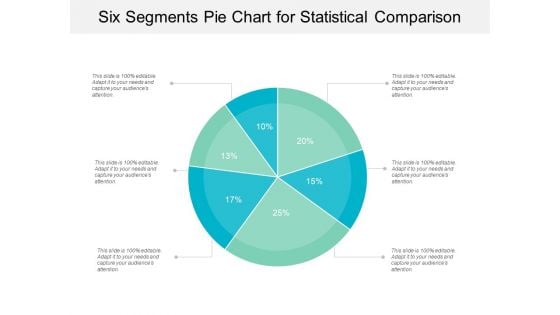
Six Segments Pie Chart For Statistical Comparison Ppt PowerPoint Presentation Gallery Background
This is a six segments pie chart for statistical comparison ppt powerpoint presentation gallery background. This is a six stage process. The stages in this process are 6 piece pie chart, 6 segment pie chart, 6 parts pie chart.
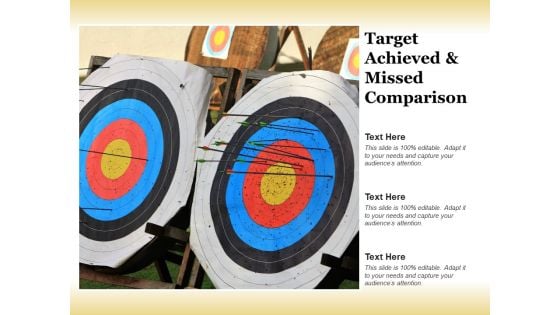
Target Achieved And Missed Comparison Ppt Powerpoint Presentation Visual Aids Deck
This is a target achieved and missed comparison ppt powerpoint presentation visual aids deck. This is a three stage process. The stages in this process are hits and misses, thumb up and thumb down, okay and not okay.
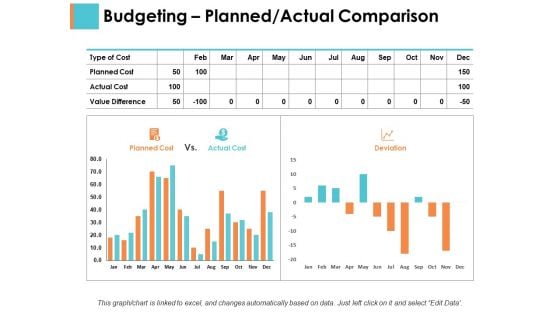
Budgeting Planned Actual Comparison Sample Budget Ppt Ppt PowerPoint Presentation Portfolio Inspiration
This is a budgeting planned actual comparison sample budget ppt ppt powerpoint presentation portfolio inspiration. This is a two stage process. The stages in this process are business, management, strategy, analysis, marketing.
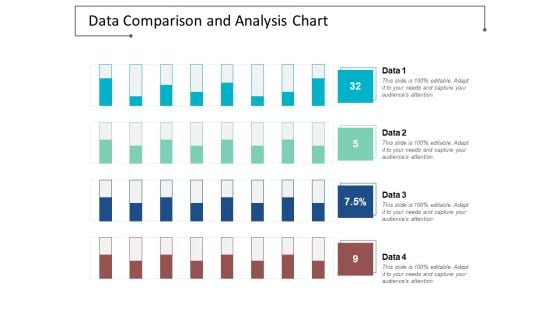
Data Comparison And Analysis Chart Ppt Powerpoint Presentation File Background Images
This is a data comparison and analysis chart ppt powerpoint presentation file background images. This is a four stage process. The stages in this process are data presentation, content presentation, information presentation.


 Continue with Email

 Home
Home


