System Features

Budgeting Planned Actual Comparison Ppt PowerPoint Presentation Portfolio Information
This is a budgeting planned actual comparison ppt powerpoint presentation portfolio information. This is a three stage process. The stages in this process are planned cost, actual cost, deviation.
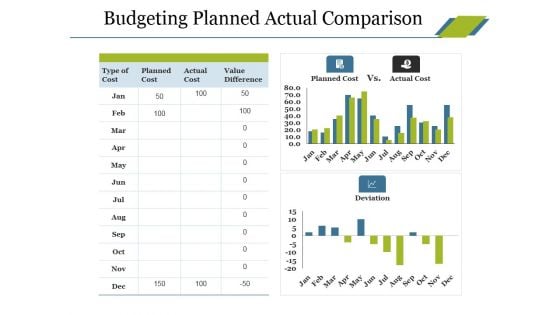
Budgeting Planned Actual Comparison Ppt PowerPoint Presentation Portfolio Display
This is a budgeting planned actual comparison ppt powerpoint presentation portfolio display. This is a three stage process. The stages in this process are type of cost, planned cost, actual cost, deviation, value difference.
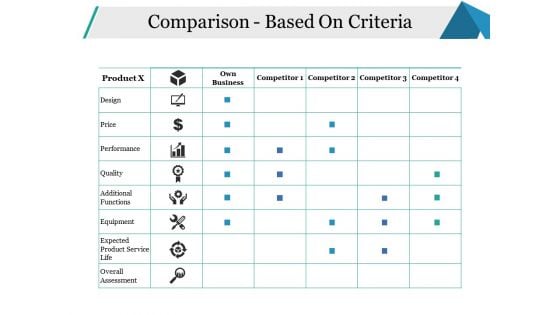
Comparison Based On Criteria Ppt PowerPoint Presentation Styles Show
This is a comparison based on criteria ppt powerpoint presentation styles show. This is a four stage process. The stages in this process are own business, design, price, performance, quality.
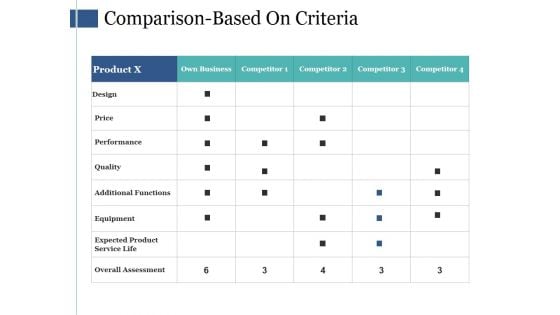
Comparison Based On Criteria Ppt PowerPoint Presentation Inspiration
This is a comparison based on criteria ppt powerpoint presentation inspiration. This is a four stage process. The stages in this process are design, price, performance, quality, additional functions.
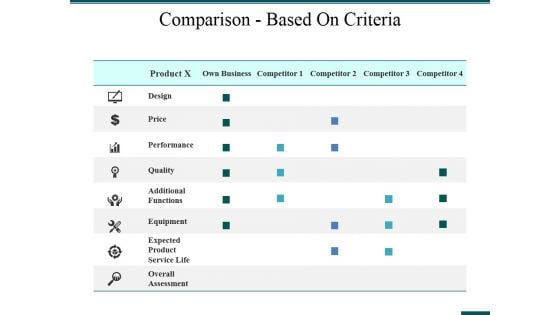
Comparison Based On Criteria Ppt PowerPoint Presentation Inspiration Graphic Tips
This is a comparison based on criteria ppt powerpoint presentation inspiration graphic tips. This is afour stage process. The stages in this process are design, price, quality, additional functions, equipment.
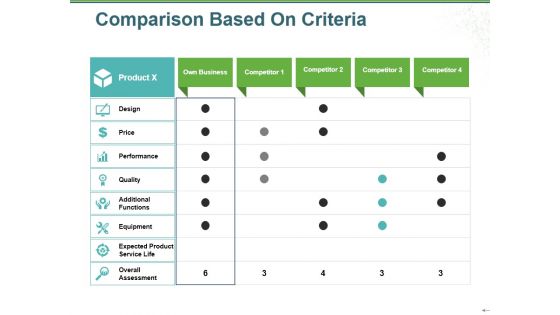
Comparison Based On Criteria Ppt PowerPoint Presentation Summary Good
This is a comparison based on criteria ppt powerpoint presentation summary good. This is a four stage process. The stages in this process are product, design, price, performance, quality.
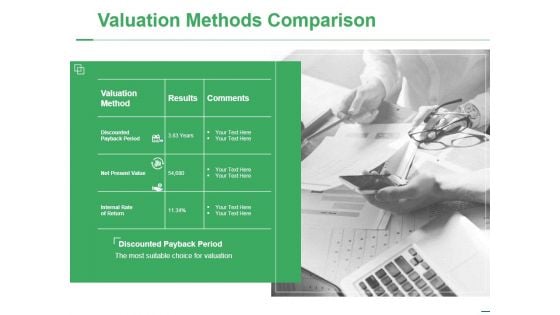
Valuation Methods Comparison Ppt PowerPoint Presentation Inspiration Background Images
This is a valuation methods comparison ppt powerpoint presentation inspiration background images. This is a two stage process. The stages in this process are valuation method, results, comments, internal rate of return, net present value.

Valuation Methods Comparison Ppt PowerPoint Presentation Ideas Picture
This is a valuation methods comparison ppt powerpoint presentation ideas picture. This is a two stage process. The stages in this process are valuation method, results, comments, business, marketing.
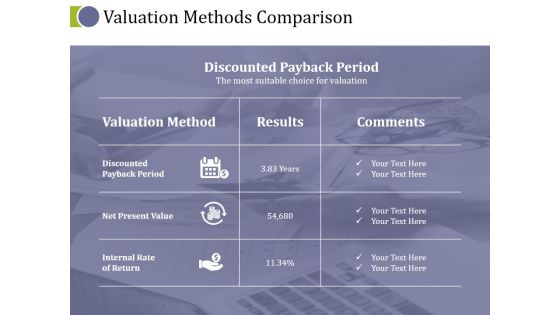
Valuation Methods Comparison Ppt PowerPoint Presentation Ideas Background Image
This is a valuation methods comparison ppt powerpoint presentation ideas background image. This is a two stage process. The stages in this process are valuation method, discounted payback period, net present value, internal rate of return.
Valuation Methods Comparison Ppt PowerPoint Presentation Icon Graphic Tips
This is a valuation methods comparison ppt powerpoint presentation icon graphic tips. This is a two stage process. The stages in this process are compare, business, marketing, strategy, management.
Quality Cost Report Comparison Ppt PowerPoint Presentation Icon Background Designs
This is a quality cost report comparison ppt powerpoint presentation icon background designs. This is a two stage process. The stages in this process are compare, business, table, marketing, strategy.
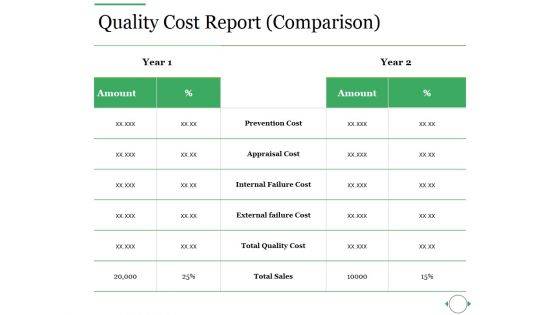
Quality Cost Report Comparison Ppt PowerPoint Presentation Ideas Slides
This is a quality cost report comparison ppt powerpoint presentation ideas slides. This is a two stage process. The stages in this process are prevention cost, appraisal cost, internal failure cost, external failure cost, total quality cost.
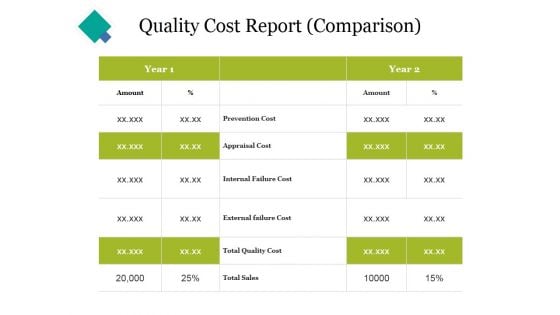
Quality Cost Report Comparison Ppt PowerPoint Presentation Portfolio Themes
This is a quality cost report comparison ppt powerpoint presentation portfolio themes. This is a two stage process. The stages in this process are prevention cost, appraisal cost, internal failure cost, external failure cost, total quality cost.
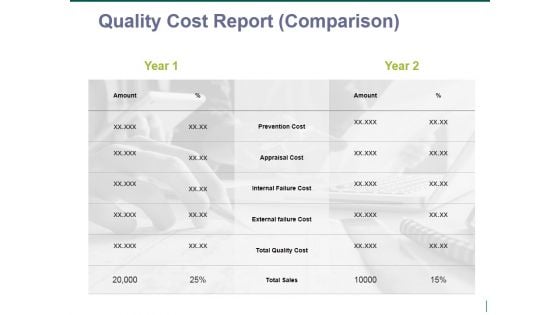
quality cost report comparison ppt powerpoint presentation portfolio information
This is a quality cost report comparison ppt powerpoint presentation portfolio information. This is a two stage process. The stages in this process are prevention cost, appraisal cost, internal failure cost, external failure cost, total quality cost.
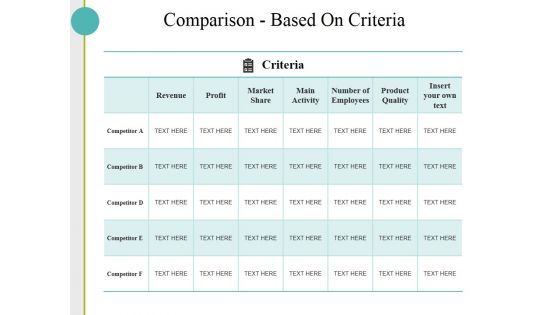
Comparison Based On Criteria Ppt PowerPoint Presentation Slides Skills
This is a comparison based on criteria ppt powerpoint presentation slides skills. This is a five stage process. The stages in this process are revenue, profit, market share, main activity, number of employees, product quality.

Comparison Based On Criteria Ppt PowerPoint Presentation Show Graphics Pictures
This is a comparison based on criteria ppt powerpoint presentation show graphics pictures. This is a seven stage process. The stages in this process are competitor, revenue, profit, market share, main activity.
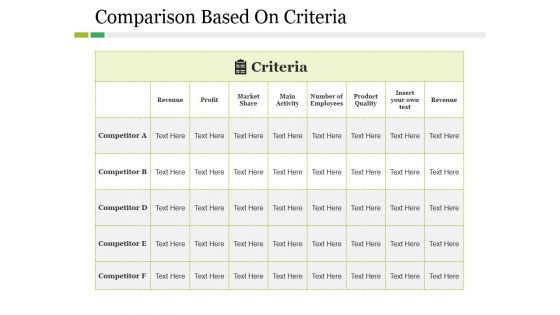
Comparison Based On Criteria Ppt PowerPoint Presentation Styles Picture
This is a comparison based on criteria ppt powerpoint presentation styles picture. This is a five stage process. The stages in this process are competitor, revenue, profit, criteria, market share.
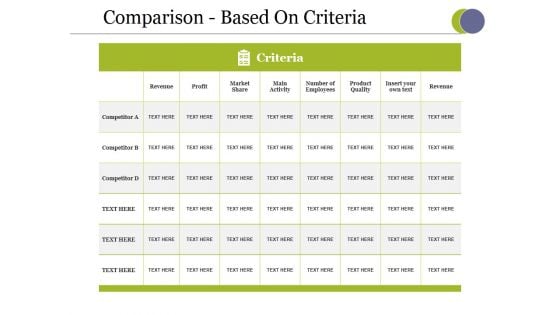
Comparison Based On Criteria Ppt PowerPoint Presentation Styles Designs
This is a comparison based on criteria ppt powerpoint presentation styles designs. This is a three stage process. The stages in this process are revenue, profit, market share, main activity, number of employees, product quality.

Budgeting Planned Actual Comparison Ppt PowerPoint Presentation Show Background Image
This is a budgeting planned actual comparison ppt powerpoint presentation show background image. This is a three stage process. The stages in this process are planned cost, actual cost, value difference, deviation.
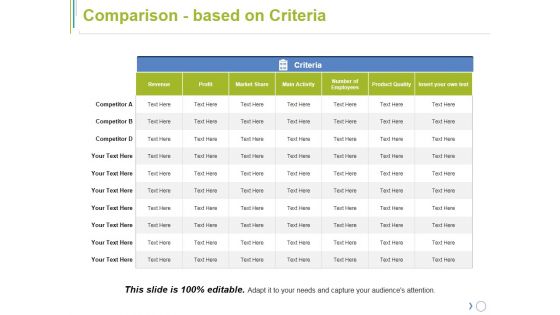
Comparison Based On Criteria Ppt PowerPoint Presentation Model Inspiration
This is a comparison based on criteria ppt powerpoint presentation model inspiration. This is a seven stage process. The stages in this process are revenue, profit, market share, number of employees, product quality.
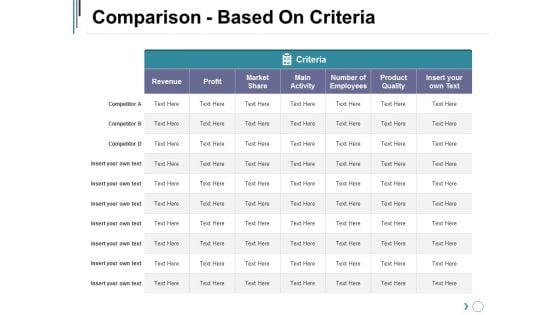
Comparison Based On Criteria Ppt PowerPoint Presentation Show Background Image
This is a comparison based on criteria ppt powerpoint presentation show background image. This is a seven stage process. The stages in this process are revenue, market share, main activity, number of employees, product quality, insert your own text.
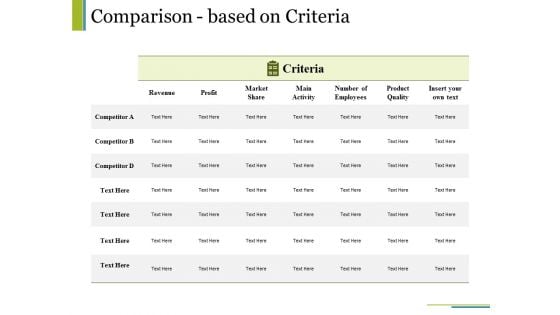
Comparison Based On Criteria Ppt PowerPoint Presentation File Templates
This is a comparison based on criteria ppt powerpoint presentation file templates. This is a seven stage process. The stages in this process are revenue, market share, main activity, number of employees, product quality, insert your own text.
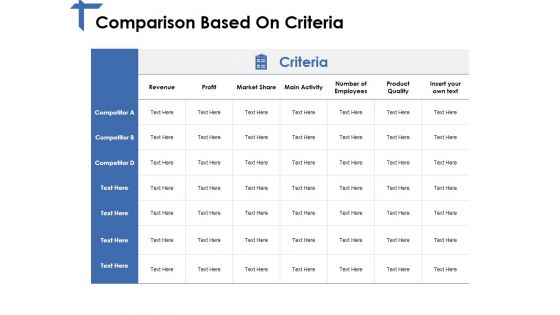
Comparison Based On Criteria Ppt PowerPoint Presentation Model Layouts
This is a comparison based on criteria ppt powerpoint presentation model layouts. This is a seven stage process. The stages in this process are revenue, profit, market share, main activity, product quality.
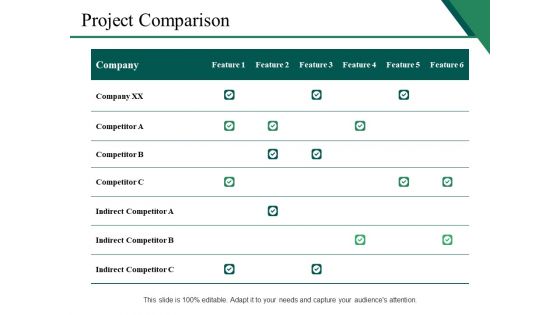
Project Comparison Ppt PowerPoint Presentation Styles Example File
This is a project comparison ppt powerpoint presentation styles example file. This is a six stage process. The stages in this process are company xx, competitor, indirect competitor, business, marketing.
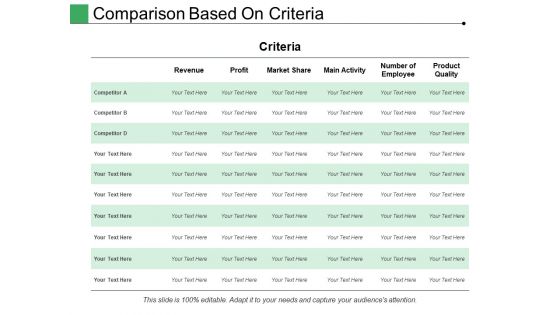
Comparison Based On Criteria Ppt PowerPoint Presentation Gallery Information
This is a comparison based on criteria ppt powerpoint presentation gallery information. This is a six stage process. The stages in this process are criteria, revenue, profit, business, competitor.
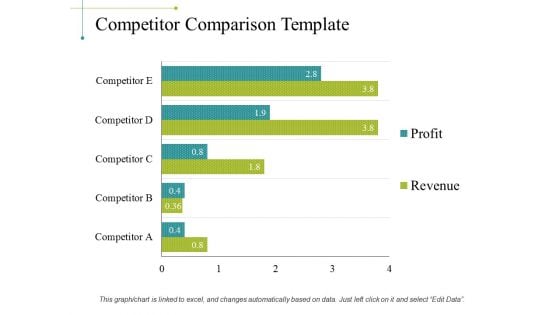
Competitor Comparison Template 1 Ppt PowerPoint Presentation Infographic Template Mockup
This is a competitor comparison template 1 ppt powerpoint presentation infographic template mockup. This is a five stage process. The stages in this process are business, marketing, graph, finance, strategy.
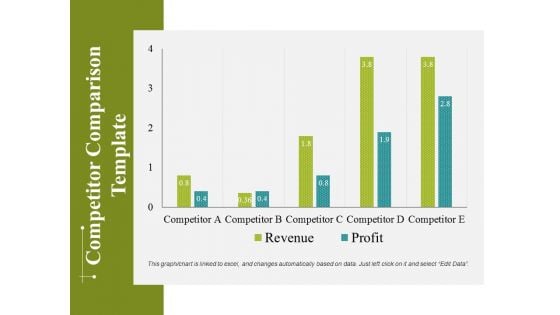
Competitor Comparison Template 2 Ppt PowerPoint Presentation Infographics Objects
This is a competitor comparison template 2 ppt powerpoint presentation infographics objects. This is a five stage process. The stages in this process are business, marketing, graph, finance, strategy.
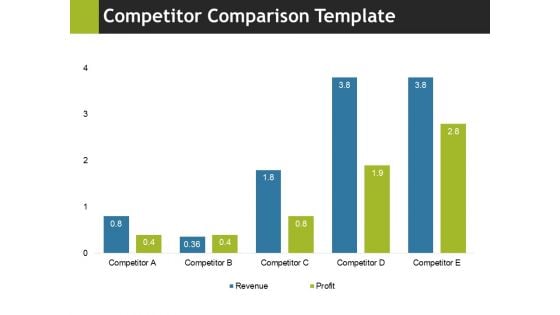
Competitor Comparison Template 1 Ppt PowerPoint Presentation Layouts Slide Portrait
This is a competitor comparison template 1 ppt powerpoint presentation layouts slide portrait. This is a four stage process. The stages in this process are business, marketing, graph, finance, strategy.
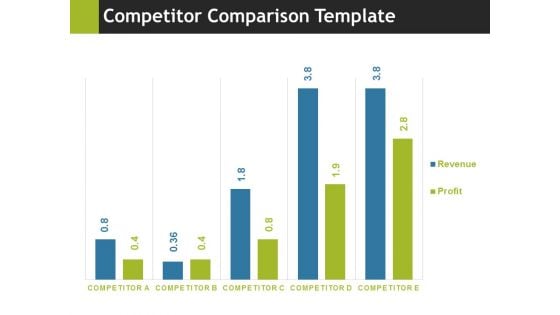
Competitor Comparison Template 2 Ppt PowerPoint Presentation Inspiration Images
This is a competitor comparison template 2 ppt powerpoint presentation inspiration images. This is a five stage process. The stages in this process are business, marketing, graph, finance, strategy.
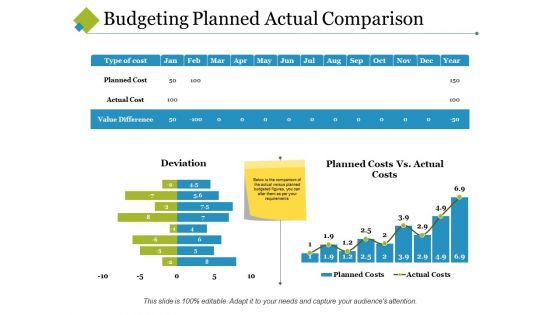
Budgeting Planned Actual Comparison Ppt PowerPoint Presentation File Skills
This is a budgeting planned actual comparison ppt powerpoint presentation file skills. This is a three stage process. The stages in this process are value difference, planned cost, actual cost, deviation.
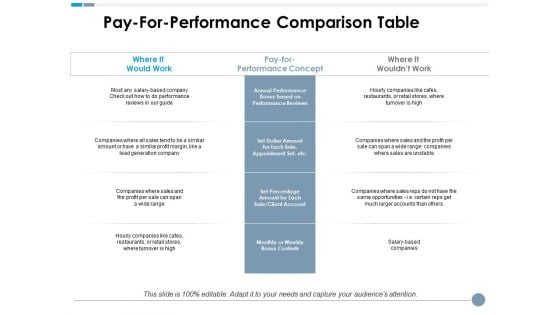
Pay For Performance Comparison Table Ppt PowerPoint Presentation Styles Summary
This is a pay for performance comparison table ppt powerpoint presentation styles summary. This is a three stage process. The stages in this process are business, where it would work, pay for performance concept, where it would t work, marketing.
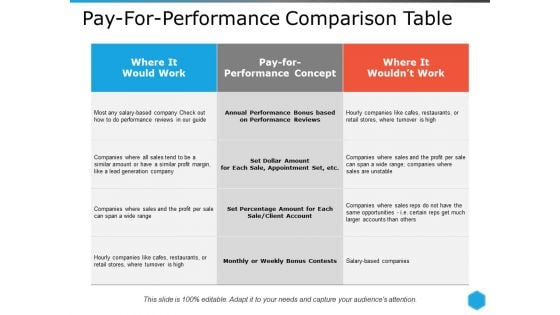
Pay For Performance Comparison Table Ppt PowerPoint Presentation Inspiration Microsoft
This is a pay for performance comparison table ppt powerpoint presentation inspiration microsoft. This is a three stage process. The stages in this process are business, management, analysis, strategy, marketing.
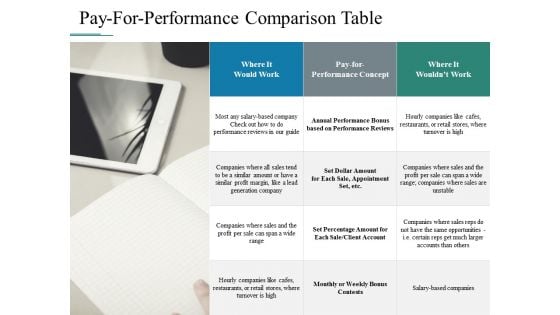
Pay For Performance Comparison Table Ppt PowerPoint Presentation Inspiration Show
This is a pay for performance comparison table ppt powerpoint presentation inspiration show. This is a three stage process. The stages in this process are business, compare, management, strategy, analysis, table.
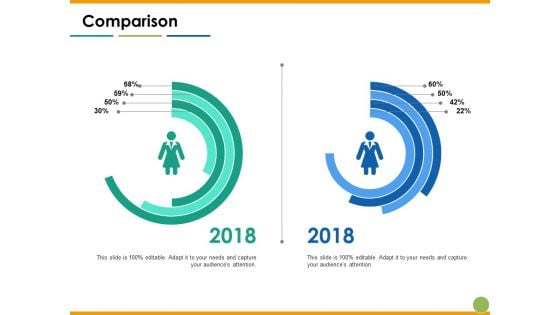
Comparison Capability Maturity Matrix Ppt PowerPoint Presentation Slides Microsoft
This is a comparison capability maturity matrix ppt powerpoint presentation slides microsoft. This is a two stage process. The stages in this process are compare, percentage, finance, business, marketing.
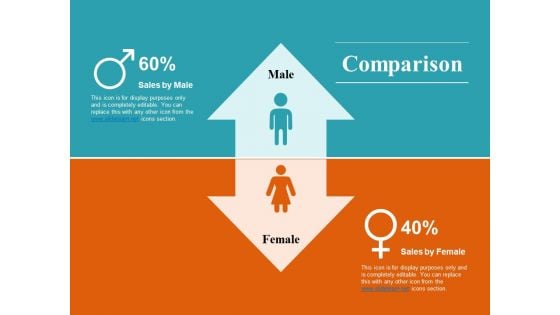
Comparison Human Resource Timeline Ppt PowerPoint Presentation Ideas Template
This is a comparison human resource timeline ppt powerpoint presentation ideas template. This is a two stage process. The stages in this process are compare, percentage, finance, business, marketing.
Pie Chart For Data Comparison Ppt PowerPoint Presentation Portfolio Layouts
This is a pie chart for data comparison ppt powerpoint presentation portfolio layouts. This is a four stage process. The stages in this process are sectioned circle, segmented circle, partitioned circle.
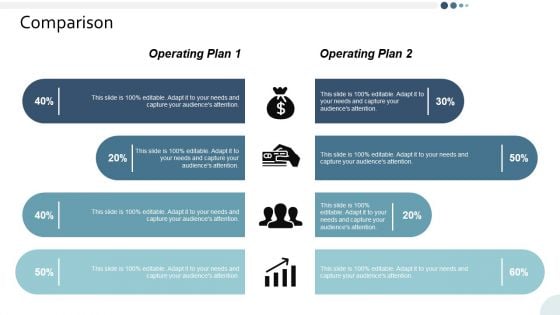
Comparison Yearly Operating Plan Ppt PowerPoint Presentation Professional Model
This is a comparison yearly operating plan ppt powerpoint presentation professional model. This is a two stage process. The stages in this process are business, management, strategy, analysis, icons.
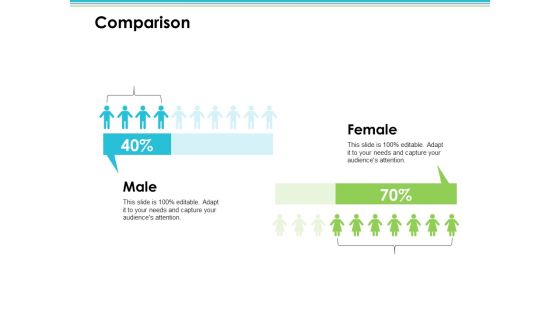
Comparison Employee Value Proposition Ppt PowerPoint Presentation Infographics Master Slide
This is a comparison employee value proposition ppt powerpoint presentation infographics master slide. This is a two stage process. The stages in this process are business, management, strategy, analysis, marketing.
Comparison Sample Budget Ppt Ppt PowerPoint Presentation Gallery Icon
This is a comparison sample budget ppt ppt powerpoint presentation gallery icon. This is a two stage process. The stages in this process are business, management, strategy, analysis, icons.
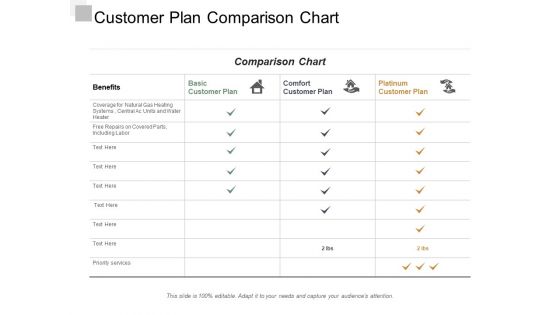
Customer Plan Comparison Chart Ppt Powerpoint Presentation Infographic Template Portrait
This is a customer plan comparison chart ppt powerpoint presentation infographic template portrait. This is a four stage process. The stages in this process are customer service strategy, customer service plan, customer service approach.
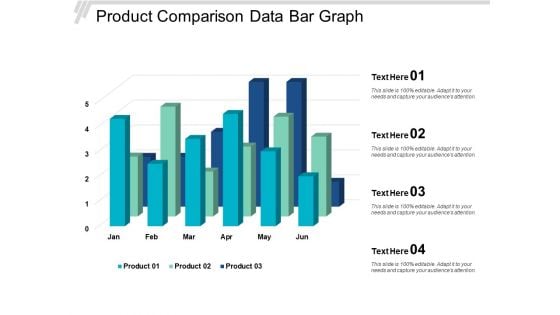
Product Comparison Data Bar Graph Ppt Powerpoint Presentation Slides Show
This is a product comparison data bar graph ppt powerpoint presentation slides show. This is a four stage process. The stages in this process are data presentation, content presentation, information presentation.
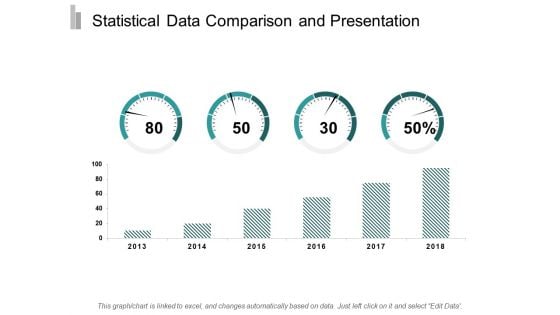
Statistical Data Comparison And Presentation Ppt Powerpoint Presentation Gallery Backgrounds
This is a statistical data comparison and presentation ppt powerpoint presentation gallery backgrounds. This is a two stage process. The stages in this process are data presentation, content presentation, information presentation.
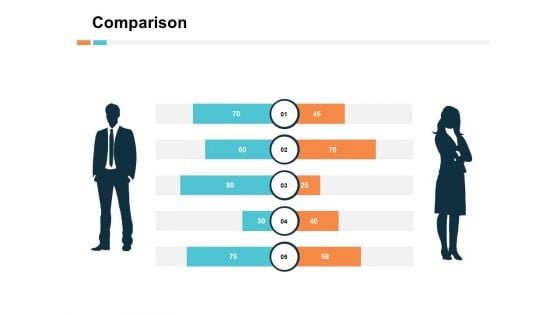
Comparison Male And Female Ppt PowerPoint Presentation Infographic Template Layouts
This is a comparison male and female ppt powerpoint presentation infographic template layouts. This is a five stage process. The stages in this process are business, management, marketing, compare.
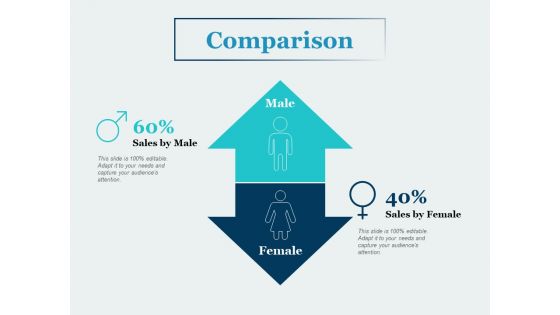
Comparison Male Of Female Ppt PowerPoint Presentation Slides Background Images
This is a comparison male of female ppt powerpoint presentation slides background images. This is a two stage process. The stages in this process are business, management, marketing, compare.
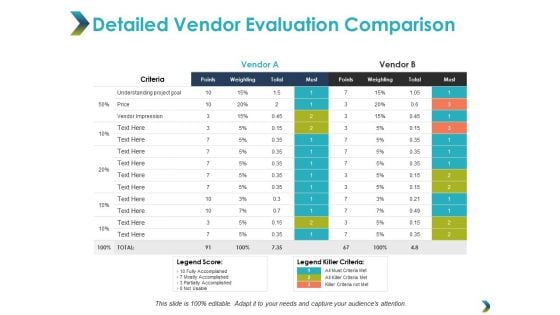
Detailed Vendor Evaluation Comparison Ppt PowerPoint Presentation Styles Background Image
This is a detailed vendor evaluation comparison ppt powerpoint presentation styles background image. This is a two stage process. The stages in this process are business, management, planning, strategy, marketing.

Trend Analysis Yearly Comparison Ppt Powerpoint Presentation Professional Example
This is a trend analysis yearly comparison ppt powerpoint presentation professional example. This is a two stage process. The stages in this process are finance, marketing, management, investment, analysis.
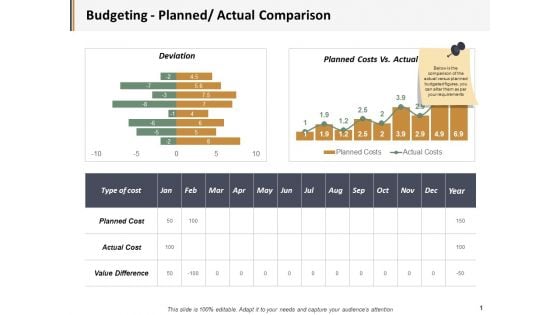
Budgeting Planned Actual Comparison Ppt PowerPoint Presentation Visual Aids Gallery
This is a budgeting planned actual comparison ppt powerpoint presentation visual aids gallery. This is a three stage process. The stages in this process are business, management, marketing, percentage, product.
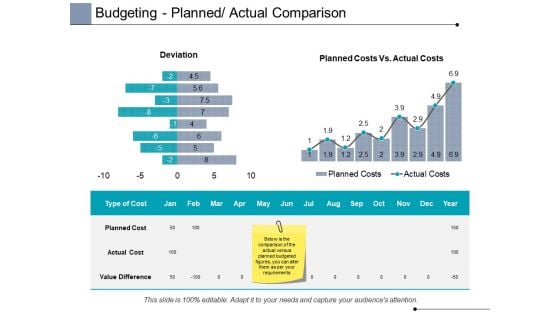
Budgeting Planned Actual Comparison Ppt PowerPoint Presentation Portfolio Ideas
This is a budgeting planned actual comparison ppt powerpoint presentation portfolio ideas. This is a two stage process. The stages in this process are finance, analysis, business, investment, marketing.
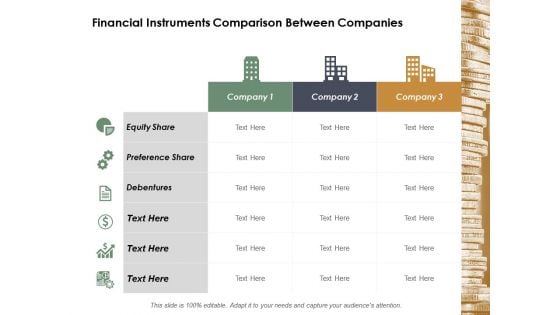
Financial Instruments Comparison Between Companies Ppt Powerpoint Presentation Portfolio Gallery
This is a financial instruments comparison between companies ppt powerpoint presentation portfolio gallery. This is a three stage process. The stages in this process are business, management, planning, strategy, marketing.
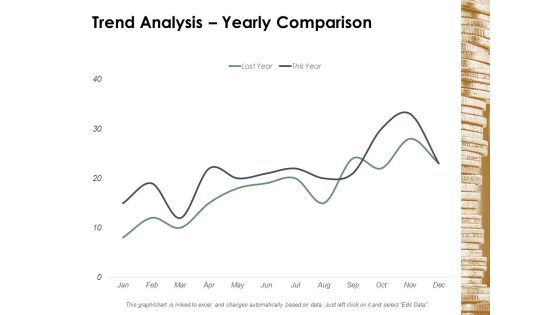
Trend Analysis Yearly Comparison Ppt Powerpoint Presentation Professional Show
This is a trend analysis yearly comparison ppt powerpoint presentation professional show. This is a two stage process. The stages in this process are finance, marketing, management, investment, analysis.
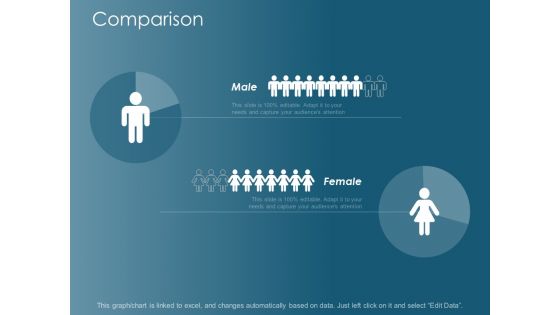
Comparison Male Female Ppt Powerpoint Presentation Visual Aids Inspiration
This is a comparison male female ppt powerpoint presentation visual aids inspiration. This is a two stage process. The stages in this process are finance, marketing, management, investment, analysis.
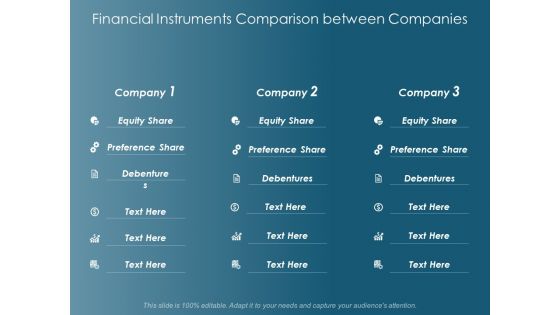
Financial Instruments Comparison Between Companies Ppt Powerpoint Presentation Gallery Images
This is a financial instruments comparison between companies ppt powerpoint presentation gallery images. This is a three stage process. The stages in this process are business, management, planning, strategy, marketing.
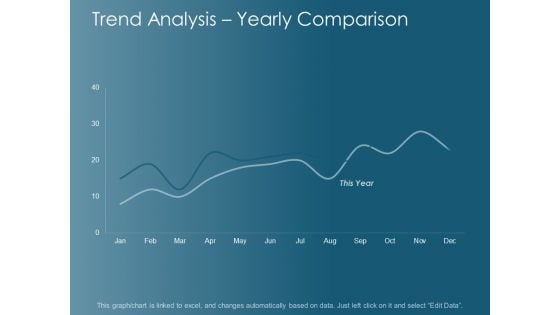
Trend Analysis Yearly Comparison Ppt Powerpoint Presentation Layouts Slideshow
This is a trend analysis yearly comparison ppt powerpoint presentation layouts slideshow. This is a two stage process. The stages in this process are finance, marketing, management, investment, analysis.
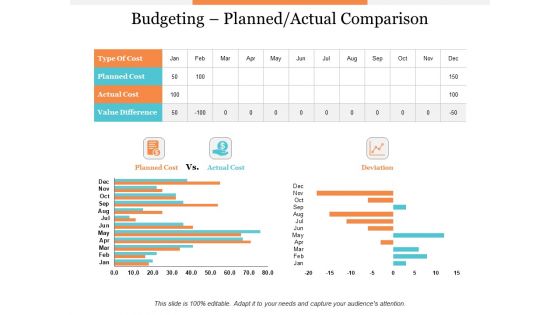
Budgeting Planned Actual Comparison Ppt PowerPoint Presentation Styles File Formats
This is a budgeting planned actual comparison ppt powerpoint presentation styles file formats. This is a three stage process. The stages in this process are product, percentage, business, management, marketing.
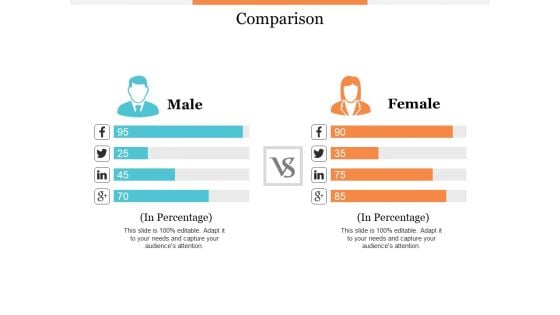
Comparison Male And Female Ppt PowerPoint Presentation Professional Skills
This is a comparison male and female ppt powerpoint presentation professional skills. This is a two stage process. The stages in this process are product, percentage, business, management, marketing.
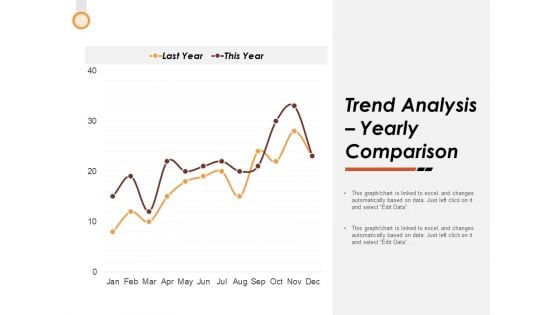
Trend Analysis Yearly Comparison Ppt PowerPoint Presentation Summary Visual Aids
This is a trend analysis yearly comparison ppt powerpoint presentation summary visual aids. This is a two stage process. The stages in this process are finance, strategy, marketing, management, business.
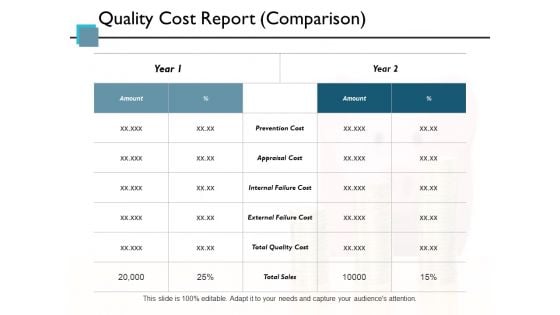
Quality Cost Report Comparison Ppt PowerPoint Presentation Diagram Lists
This is a quality cost report comparison ppt powerpoint presentation diagram lists. This is a two stage process. The stages in this process are business, management, analysis, strategy, marketing.

Comparison Male Female Ppt Powerpoint Presentation Professional Background Designs
This is a comparison male female ppt powerpoint presentation professional background designs. This is a two stage process. The stages in this process are finance, marketing, management, investment, analysis.

Comparison Male And Female Ppt PowerPoint Presentation Infographic Template Show
This is a comparison male and female ppt powerpoint presentation infographic template show. This is a four stage process. The stages in this process are compare, business, marketing, management.

Comparison Male And Female Ppt PowerPoint Presentation Summary Example File
This is a comparison male and female ppt powerpoint presentation summary example file. This is a two stage process. The stages in this process are business, management, marketing, compare.


 Continue with Email

 Home
Home


