System Icon
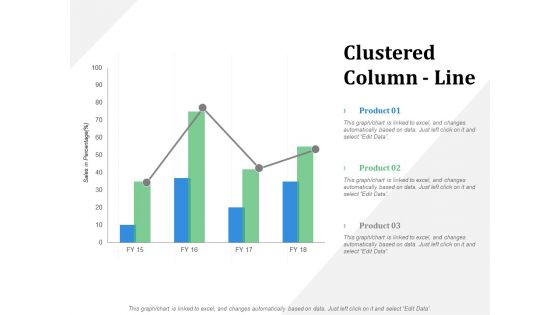
Clustered Column Line Financial Ppt PowerPoint Presentation Summary Slide
This is a clustered column line financial ppt powerpoint presentation summary slide. This is a three stage process. The stages in this process are business, management, marketing, product, percentage.

Stacked Area Clustered Column Marketing Ppt PowerPoint Presentation Infographic Template Vector
This is a stacked area clustered column marketing ppt powerpoint presentation infographic template vector. This is a three stage process. The stages in this process are business, management, marketing, product, percentage.
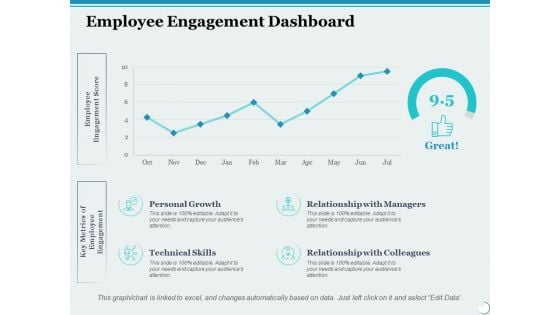
Employee Engagement Dashboard Ppt PowerPoint Presentation Inspiration Format
This is a employee engagement dashboard ppt powerpoint presentation inspiration format. This is a four stage process. The stages in this process are personal growth, relationship with managers, business, management, marketing.
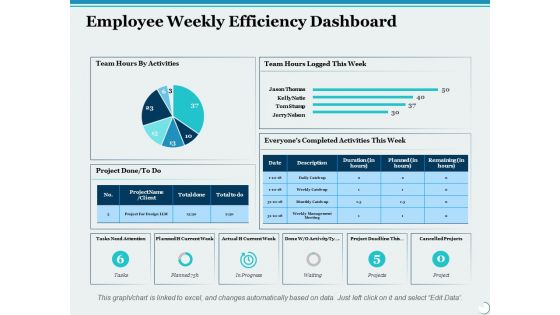
Employee Weekly Efficiency Dashboard Ppt PowerPoint Presentation Infographic Template Graphic Images
This is a employee weekly efficiency dashboard ppt powerpoint presentation infographic template graphic images. This is a six stage process. The stages in this process are percentage, product, business, management, marketing.
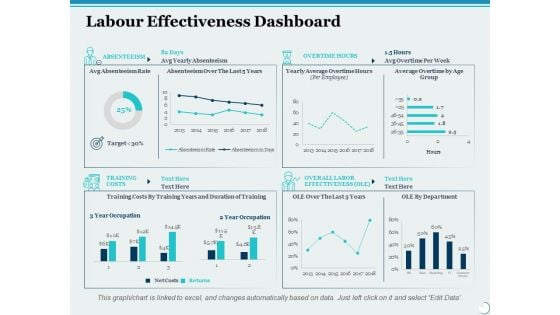
Labour Effectiveness Dashboard Ppt PowerPoint Presentation Slides File Formats
This is a labour effectiveness dashboard ppt powerpoint presentation slides file formats. This is a four stage process. The stages in this process are percentage, product, management, marketing, business.
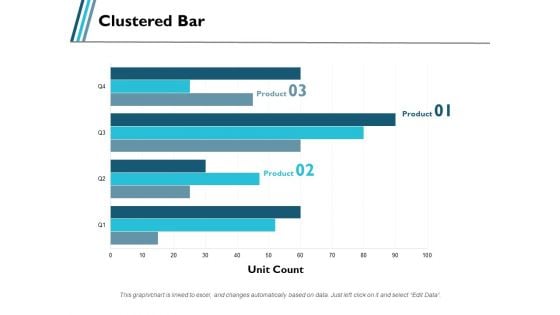
Clustered Bar Business Product Ppt PowerPoint Presentation Gallery Background
This is a clustered bar business product ppt powerpoint presentation gallery background. This is a three stage process. The stages in this process are business, management, marketing, percentage, product.
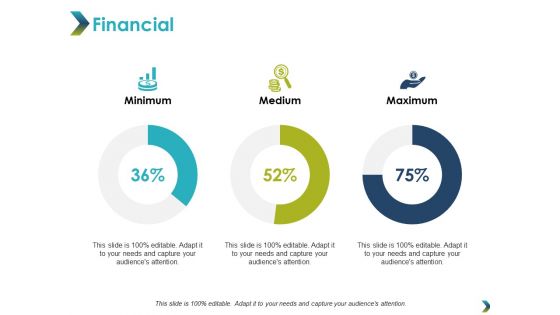
Financial Minimum Maximum Ppt PowerPoint Presentation Infographic Template Picture
This is a financial minimum maximum ppt powerpoint presentation infographic template picture. This is a three stage process. The stages in this process are financial, minimum, maximum, marketing, strategy.

Man Standing With Stack Of Us Currency Notes Bundles Ppt Powerpoint Presentation File Slides
This is a man standing with stack of us currency notes bundles ppt powerpoint presentation file slides. This is a three stage process. The stages in this process are stacked bar, pile bar, heap bar.
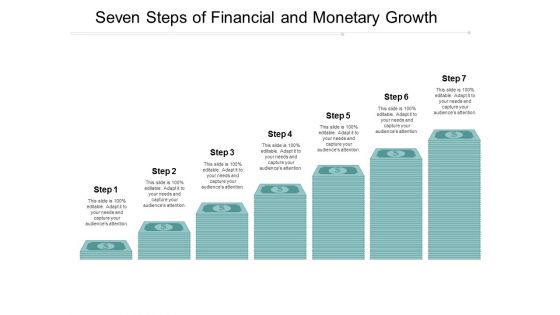
Seven Steps Of Financial And Monetary Growth Ppt Powerpoint Presentation Inspiration Backgrounds
This is a seven steps of financial and monetary growth ppt powerpoint presentation inspiration backgrounds. This is a seven stage process. The stages in this process are stacked bar, pile bar, heap bar.

Stack Of Dollar Currency Banknotes For Financial Success Ppt Powerpoint Presentation Slides Background
This is a stack of dollar currency banknotes for financial success ppt powerpoint presentation slides background. This is a five stage process. The stages in this process are stacked bar, pile bar, heap bar.

Stack Of Gold Bars In Shape Of Triangle Ppt Powerpoint Presentation Infographic Template Guidelines
This is a stack of gold bars in shape of triangle ppt powerpoint presentation infographic template guidelines. This is a four stage process. The stages in this process are stacked bar, pile bar, heap bar.

Stack Of Shiny Gold Bars Ppt Powerpoint Presentation Gallery Show
This is a stack of shiny gold bars ppt powerpoint presentation gallery show. This is a four stage process. The stages in this process are stacked bar, pile bar, heap bar.
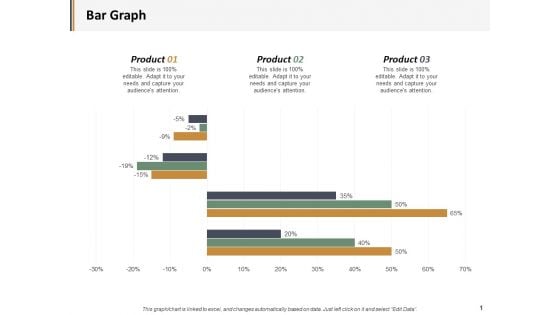
Bar Graph Percentage Product Ppt PowerPoint Presentation Layouts Microsoft
This is a bar graph percentage product ppt powerpoint presentation layouts microsoft. This is a three stage process. The stages in this process are business, management, marketing, percentage, product.
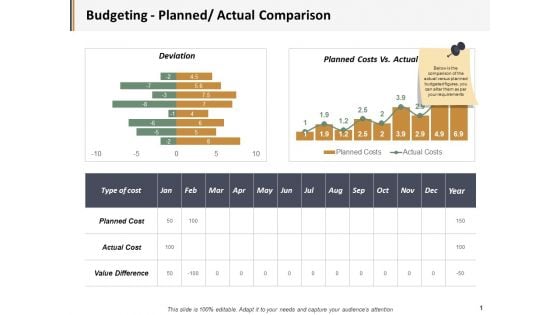
Budgeting Planned Actual Comparison Ppt PowerPoint Presentation Visual Aids Gallery
This is a budgeting planned actual comparison ppt powerpoint presentation visual aids gallery. This is a three stage process. The stages in this process are business, management, marketing, percentage, product.
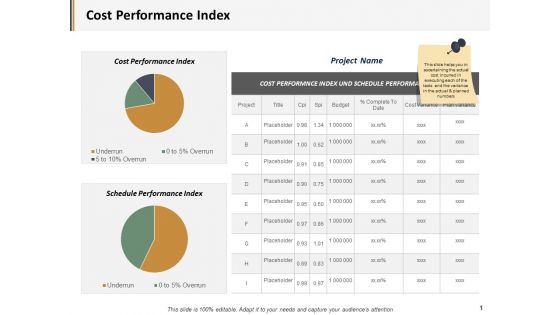
Cost Performance Index Ppt PowerPoint Presentation Inspiration Graphics Example
This is a cost performance index ppt powerpoint presentation inspiration graphics example. This is a three stage process. The stages in this process are business, management, marketing, percentage, product.
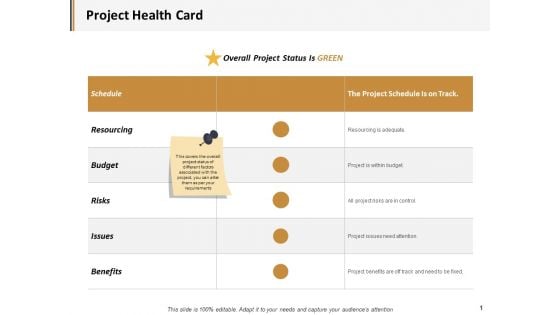
Project Health Card Resourcing Ppt PowerPoint Presentation Summary Graphics Download
This is a project health card resourcing ppt powerpoint presentation summary graphics download. This is a six stage process. The stages in this process are business, management, marketing, percentage, product.
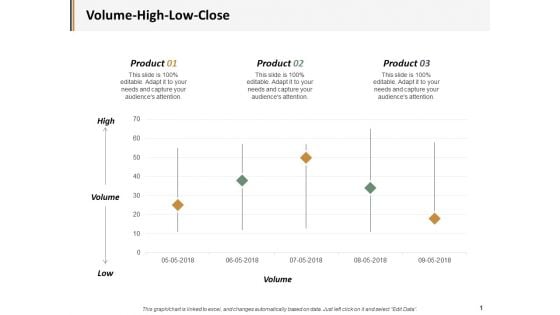
Volume High Low Close Ppt PowerPoint Presentation Ideas Example Introduction
This is a volume high low close ppt powerpoint presentation ideas example introduction. This is a three stage process. The stages in this process are business, management, marketing, percentage, product.
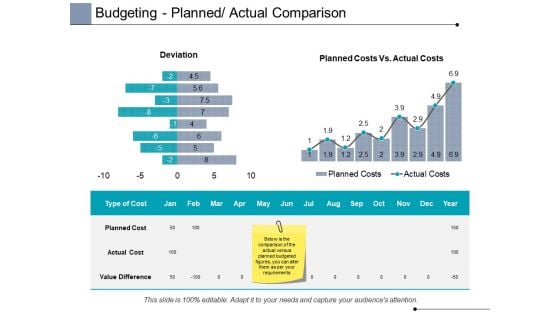
Budgeting Planned Actual Comparison Ppt PowerPoint Presentation Portfolio Ideas
This is a budgeting planned actual comparison ppt powerpoint presentation portfolio ideas. This is a two stage process. The stages in this process are finance, analysis, business, investment, marketing.
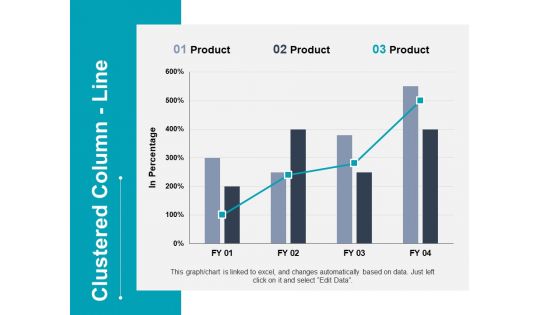
Clustered Column Line Investment Ppt PowerPoint Presentation Styles Smartart
This is a clustered column line investment ppt powerpoint presentation styles smartart. This is a three stage process. The stages in this process are finance, analysis, business, investment, marketing.
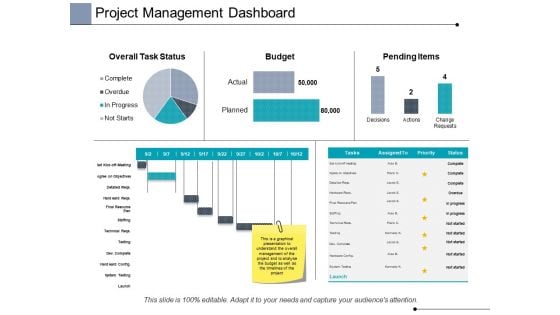
Project Management Dashboard Ppt PowerPoint Presentation Infographic Template Graphics
This is a project management dashboard ppt powerpoint presentation infographic template graphics. This is a three stage process. The stages in this process are finance, analysis, business, investment, marketing.
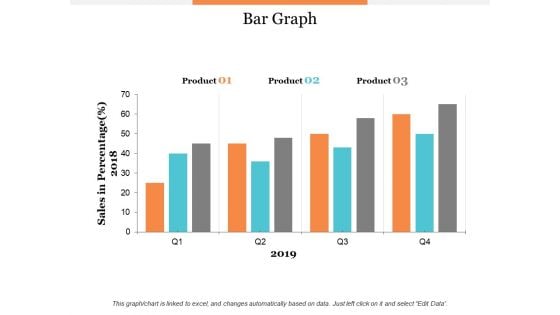
Bar Graph Product Ppt PowerPoint Presentation Model Graphic Tips
This is a bar graph product ppt powerpoint presentation model graphic tips. This is a three stage process. The stages in this process are product, percentage, business, management, marketing.
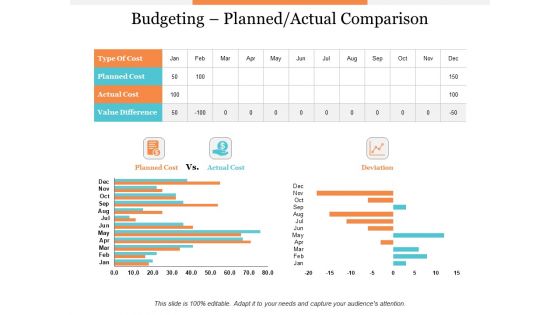
Budgeting Planned Actual Comparison Ppt PowerPoint Presentation Styles File Formats
This is a budgeting planned actual comparison ppt powerpoint presentation styles file formats. This is a three stage process. The stages in this process are product, percentage, business, management, marketing.
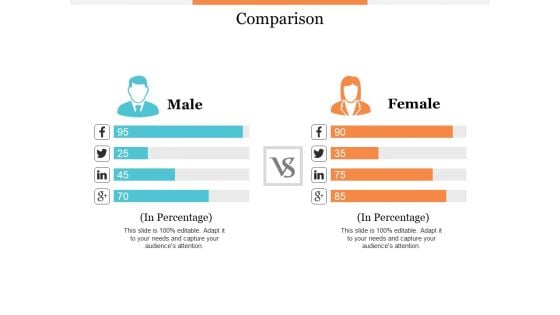
Comparison Male And Female Ppt PowerPoint Presentation Professional Skills
This is a comparison male and female ppt powerpoint presentation professional skills. This is a two stage process. The stages in this process are product, percentage, business, management, marketing.
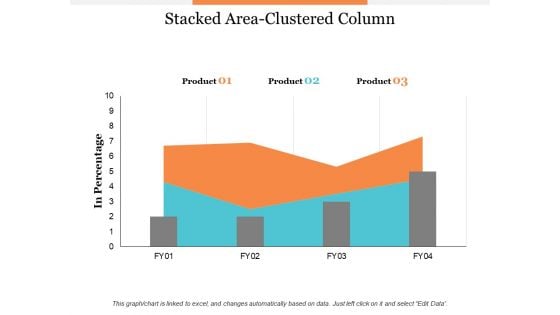
Stacked Area Clustered Column Ppt PowerPoint Presentation Infographic Template Summary
This is a stacked area clustered column ppt powerpoint presentation infographic template summary. This is a three stage process. The stages in this process are business, management, marketing, percentage, product.
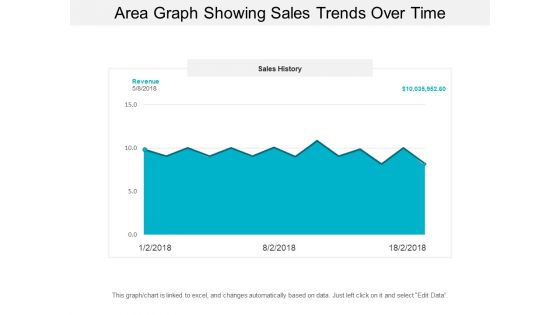
Area Graph Showing Sales Trends Over Time Ppt PowerPoint Presentation Model Background Designs
This is a area graph showing sales trends over time ppt powerpoint presentation model background designs. This is a three stage process. The stages in this process are financial analysis, quantitative, statistical modelling.
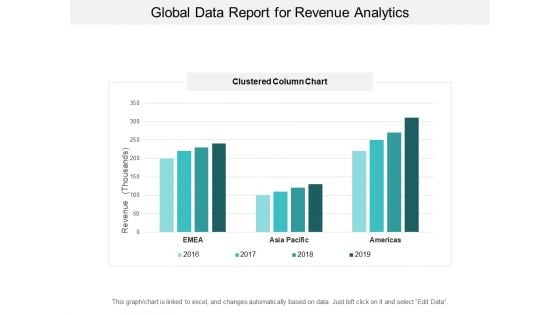
Global Data Report For Revenue Analytics Ppt PowerPoint Presentation Inspiration Visuals
This is a global data report for revenue analytics ppt powerpoint presentation inspiration visuals. This is a four stage process. The stages in this process are financial analysis, quantitative, statistical modelling.
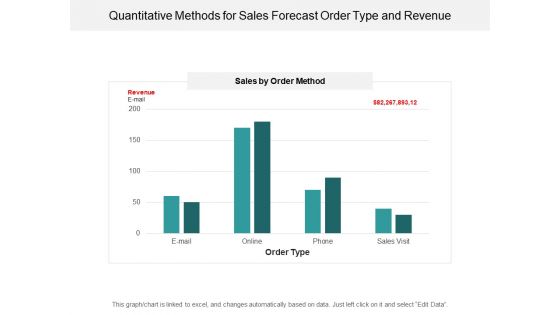
Quantitative Methods For Sales Forecast Order Type And Revenue Ppt PowerPoint Presentation Styles Show
This is a quantitative methods for sales forecast order type and revenue ppt powerpoint presentation styles show. This is a four stage process. The stages in this process are financial analysis, quantitative, statistical modelling.
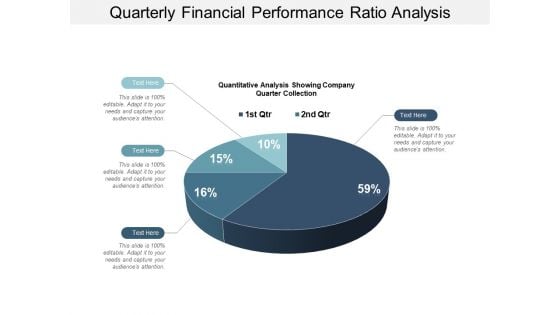
Quarterly Financial Performance Ratio Analysis Ppt PowerPoint Presentation Model Format Ideas
This is a quarterly financial performance ratio analysis ppt powerpoint presentation model format ideas. This is a four stage process. The stages in this process are financial analysis, quantitative, statistical modelling.
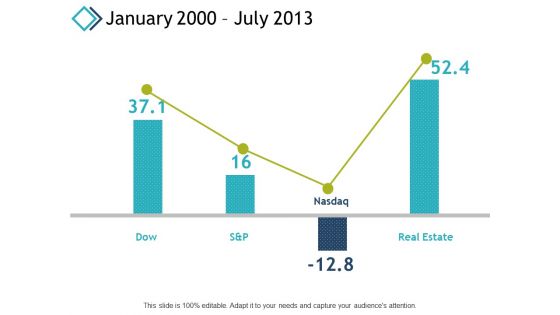
January 2000 July 2013 Marketing Ppt PowerPoint Presentation File Slide Download
This is a january 2000 july 2013 marketing ppt powerpoint presentation file slide download. This is a four stage process. The stages in this process are finance, analysis, business, investment, marketing.
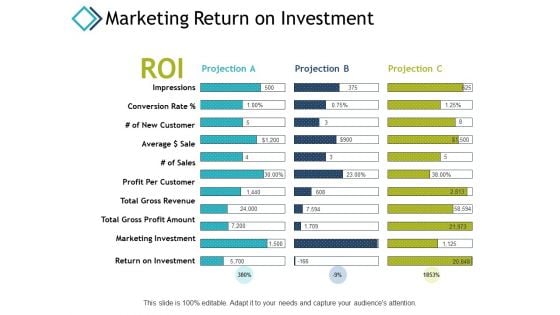
Marketing Return On Investment Ppt PowerPoint Presentation Infographics Files
This is a marketing return on investment ppt powerpoint presentation infographics files. This is a three stage process. The stages in this process are marketing investment, impressions, return on investment, finance, marketing.
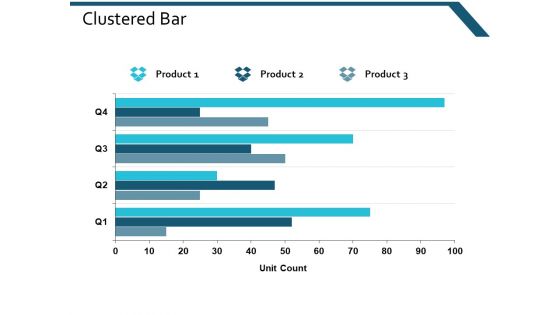
Clustered Bar Investment Ppt Powerpoint Presentation Gallery Clipart
This is a clustered bar investment ppt powerpoint presentation gallery clipart. This is a three stage process. The stages in this process are clustered bar, finance, marketing, management, analysis.
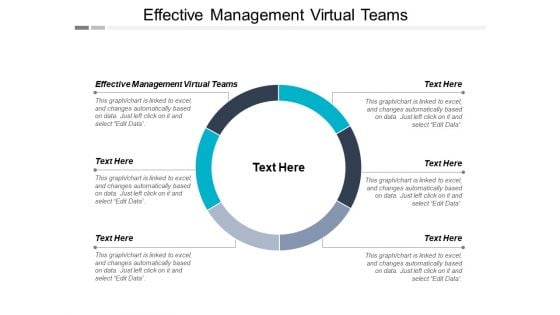
Effective Management Virtual Teams Ppt PowerPoint Presentation Infographics Ideas Cpb
This is a effective management virtual teams ppt powerpoint presentation infographics ideas cpb. This is a six stage process. The stages in this process are effective management virtual teams.
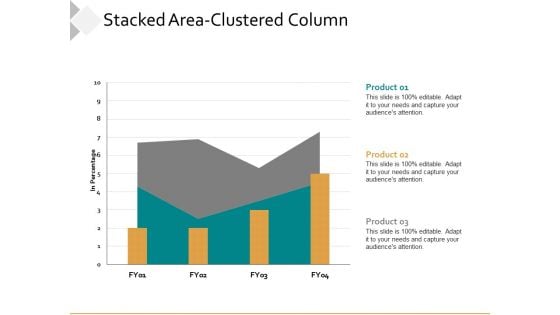
Stacked Area Clustered Column Ppt PowerPoint Presentation Model Slides
This is a stacked area clustered column ppt powerpoint presentation model slides. This is a three stage process. The stages in this process are business, management, percentage, product, marketing.
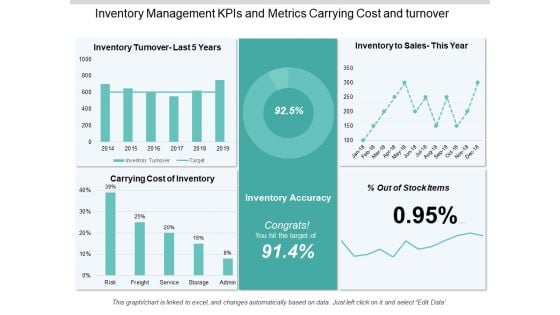
Inventory Management Kpis And Metrics Carrying Cost And Turnover Ppt PowerPoint Presentation Information
This is a inventory management kpis and metrics carrying cost and turnover ppt powerpoint presentation information. This is a five stage process. The stages in this process are logistics performance, logistics dashboard, logistics kpis.
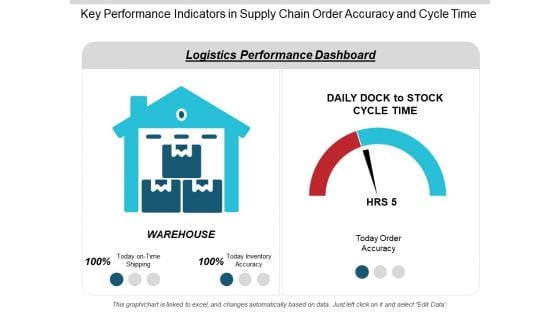
Key Performance Indicators In Supply Chain Order Accuracy And Cycle Time Ppt PowerPoint Presentation Infographics Slideshow
This is a key performance indicators in supply chain order accuracy and cycle time ppt powerpoint presentation infographics slideshow. This is a two stage process. The stages in this process are logistics performance, logistics dashboard, logistics kpis.

Kpis In Shipping Perfect Order Rate And On Time Shipment Ppt PowerPoint Presentation Show Guide
This is a kpis in shipping perfect order rate and on time shipment ppt powerpoint presentation show guide. This is a six stage process. The stages in this process are logistics performance, logistics dashboard, logistics kpis.
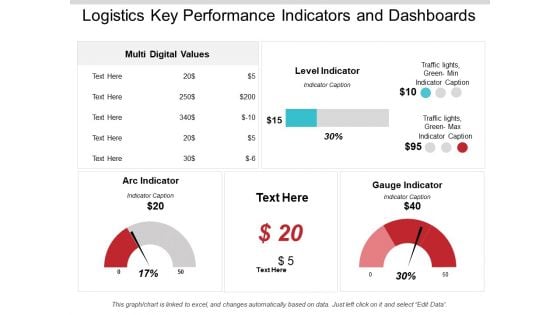
Logistics Key Performance Indicators And Dashboards Ppt PowerPoint Presentation Infographics Background Image
This is a logistics key performance indicators and dashboards ppt powerpoint presentation infographics background image. This is a three stage process. The stages in this process are logistics performance, logistics dashboard, logistics kpis.
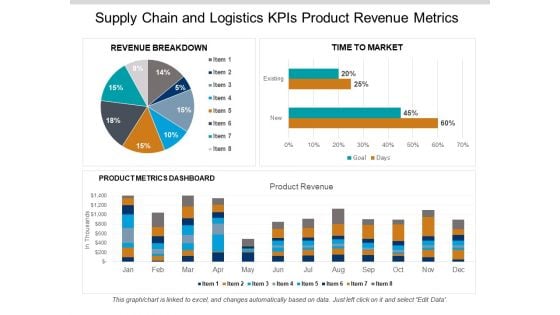
Supply Chain And Logistics Kpis Product Revenue Metrics Ppt PowerPoint Presentation Gallery Aids
This is a supply chain and logistics kpis product revenue metrics ppt powerpoint presentation gallery aids. This is a three stage process. The stages in this process are logistics performance, logistics dashboard, logistics kpis.
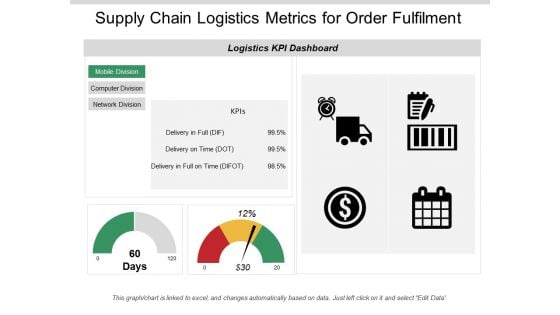
Supply Chain Logistics Metrics For Order Fulfilment Ppt PowerPoint Presentation Infographic Template Information
This is a supply chain logistics metrics for order fulfilment ppt powerpoint presentation infographic template information. This is a two stage process. The stages in this process are logistics performance, logistics dashboard, logistics kpis.

Supply Chain Metrics Fleet Efficiency Loading Time And Weight Ppt PowerPoint Presentation Portfolio Guidelines
This is a supply chain metrics fleet efficiency loading time and weight ppt powerpoint presentation portfolio guidelines. This is a four stage process. The stages in this process are logistics performance, logistics dashboard, logistics kpis.
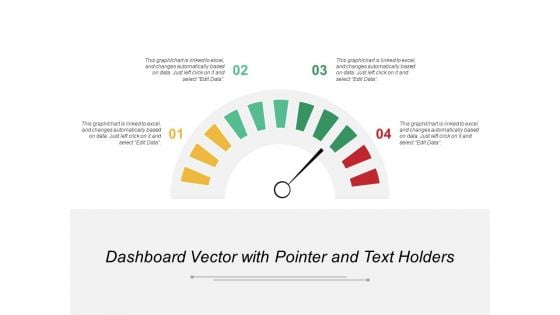
Dashboard Vector With Pointer And Text Holders Ppt PowerPoint Presentation Portfolio Format Ideas
This is a dashboard vector with pointer and text holders ppt powerpoint presentation portfolio format ideas. This is a four stage process. The stages in this process are performance dashboard, performance meter, performance kpi.
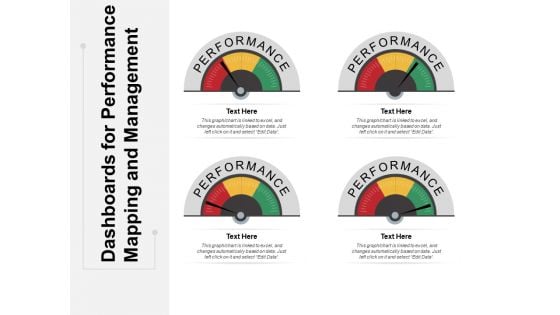
Dashboards For Performance Mapping And Management Ppt PowerPoint Presentation Ideas File Formats
This is a dashboards for performance mapping and management ppt powerpoint presentation ideas file formats. This is a four stage process. The stages in this process are performance dashboard, performance meter, performance kpi.
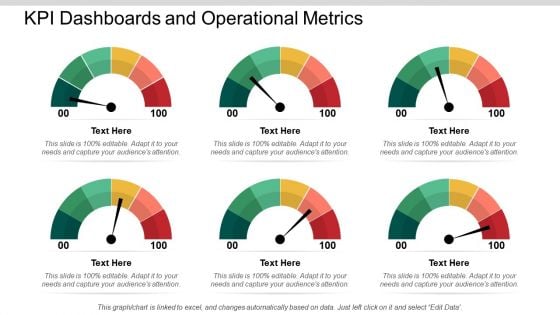
KPI Dashboards And Operational Metrics Ppt PowerPoint Presentation Portfolio Infographics

Low High Performance Measurement Indicator Dashboard Ppt PowerPoint Presentation Summary Images
This is a low high performance measurement indicator dashboard ppt powerpoint presentation summary images. This is a five stage process. The stages in this process are performance dashboard, performance meter, performance kpi.

100 Percent Stacked Bar Finance Ppt PowerPoint Presentation Model Templates
This is a 100 percent stacked bar finance ppt powerpoint presentation model templates. This is a three stage process. The stages in this process are finance, analysis, business, investment, marketing.
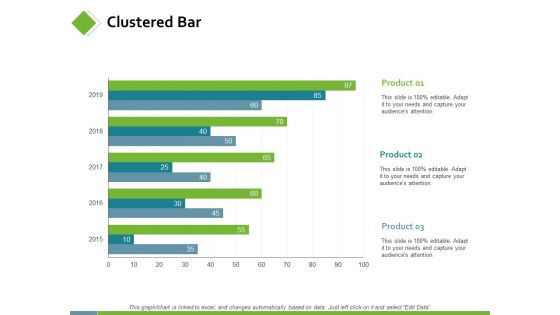
Clustered Bar Investment Planning Ppt PowerPoint Presentation Infographic Template Deck
This is a clustered bar investment planning ppt powerpoint presentation infographic template deck. This is a three stage process. The stages in this process are finance, analysis, business, investment, marketing.

Future Trends In Multi Channel Retailing Ppt PowerPoint Presentation Infographic Template Rules
This is a future trends in multi channel retailing ppt powerpoint presentation infographic template rules. This is a four stage process. The stages in this process are mobile commerce, online shopping, planning, marketing, business.
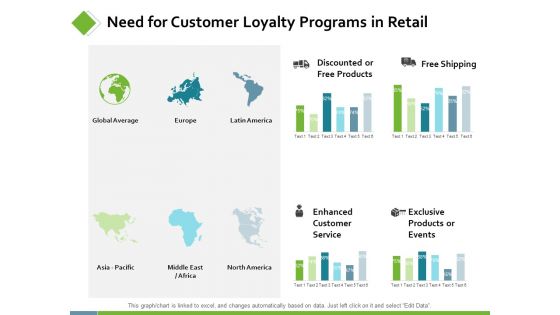
Need For Customer Loyalty Programs In Retail Ppt PowerPoint Presentation Infographic Template Introduction
This is a need for customer loyalty programs in retail ppt powerpoint presentation infographic template introduction. This is a four stage process. The stages in this process are finance, analysis, business, investment, marketing.
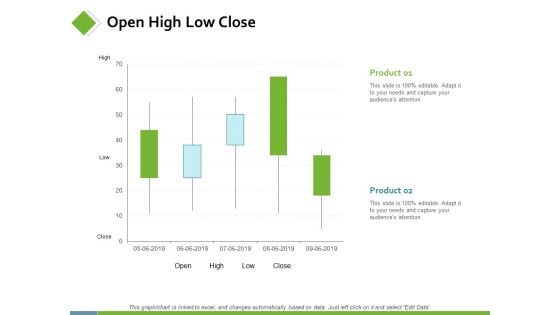
Open High Low Close Ppt PowerPoint Presentation Slides Guidelines
This is a open high low close ppt powerpoint presentation slides guidelines. This is a two stage process. The stages in this process are finance, analysis, business, investment, marketing.
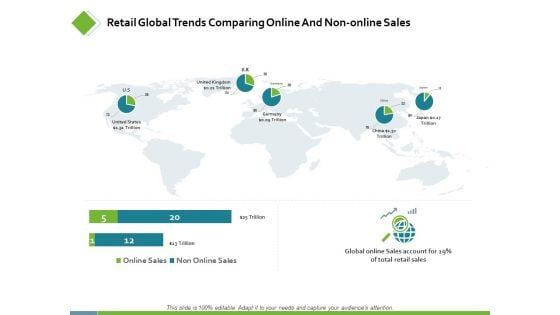
Retail Global Trends Comparing Online Ppt PowerPoint Presentation Infographics Guide
This is a retail global trends comparing online ppt powerpoint presentation infographics guide. This is a two stage process. The stages in this process are finance, analysis, business, investment, marketing.

Retail KPI Dashboard Showing Revenue Vs Units Sold Ppt PowerPoint Presentation Professional Smartart
This is a retail kpi dashboard showing revenue vs units sold ppt powerpoint presentation professional smartart. This is a four stage process. The stages in this process are finance, analysis, business, investment, marketing.
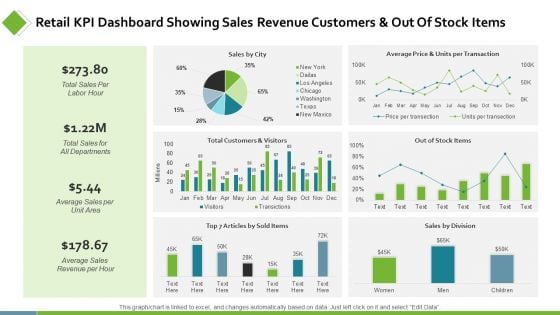
Retail KPI Dashboard Showing Sales Revenue Customers Ppt PowerPoint Presentation Show Background Designs
This is a retail kpi dashboard showing sales revenue customers ppt powerpoint presentation show background designs. This is a six stage process. The stages in this process are finance, analysis, business, investment, marketing.
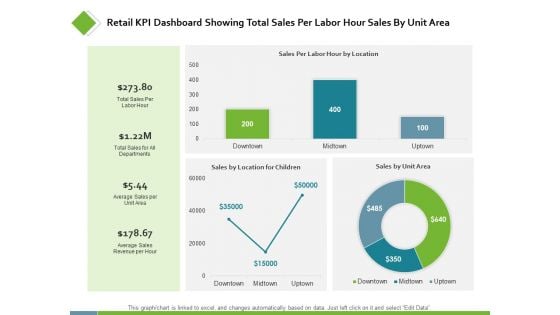
Retail KPI Dashboard Showing Total Sales Per Labor Ppt PowerPoint Presentation Styles Examples
This is a retail kpi dashboard showing total sales per labor ppt powerpoint presentation styles examples. This is a three stage process. The stages in this process are finance, analysis, business, investment, marketing.
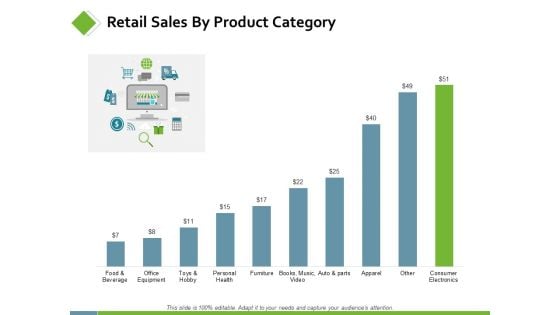
Retail Sales By Product Category Ppt PowerPoint Presentation Infographic Template Images
This is a retail sales by product category ppt powerpoint presentation infographic template images. This is a two stage process. The stages in this process are finance, analysis, business, investment, marketing.
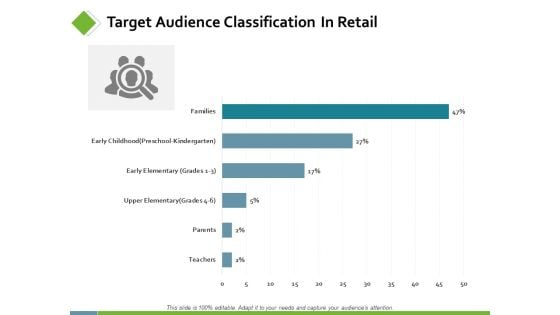
Target Audience Classification In Retail Ppt PowerPoint Presentation Summary Infographics
This is a target audience classification in retail ppt powerpoint presentation summary infographics. This is a two stage process. The stages in this process are finance, analysis, business, investment, marketing.
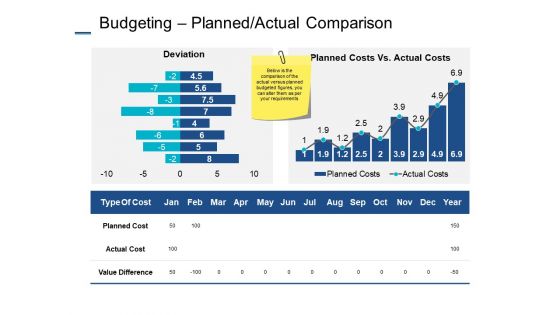
Budgeting Planned Actual Comparison Ppt PowerPoint Presentation Infographics Samples
This is a budgeting planned actual comparison ppt powerpoint presentation infographics samples. This is a two stage process. The stages in this process are deviation, planned cost, actual cost, value difference, planning.
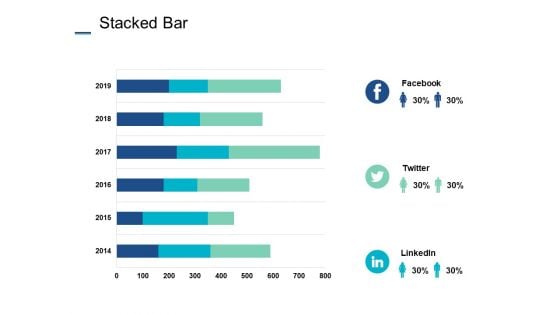
Stacked Bar Investment Ppt PowerPoint Presentation Ideas Graphics Tutorials
This is a stacked bar investment ppt powerpoint presentation ideas graphics tutorials. This is a three stage process. The stages in this process are stacked bar, finance, marketing, analysis, business, investment.
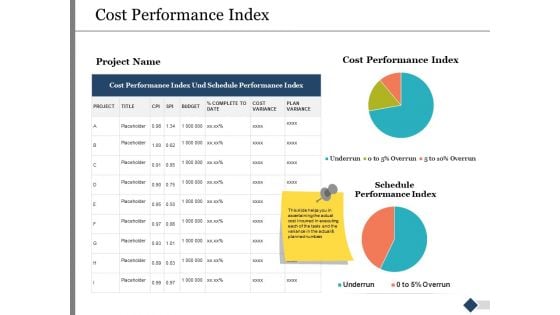
Cost Performance Index Ppt PowerPoint Presentation Infographics Mockup
This is a cost performance index ppt powerpoint presentation infographics mockup. This is a three stage process. The stages in this process are finance, marketing, management, investment, product, percentage.
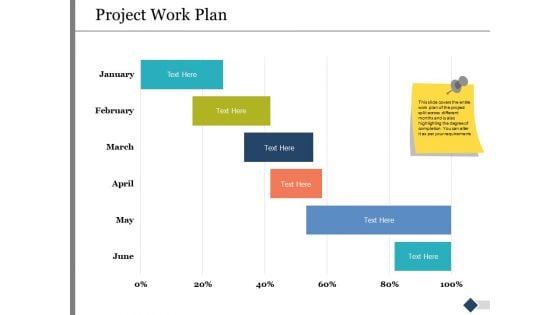
Project Work Plan Ppt PowerPoint Presentation Infographic Template Slides
This is a project work plan ppt powerpoint presentation infographic template slides. This is a six stage process. The stages in this process are finance, marketing, management, investment, analysis.
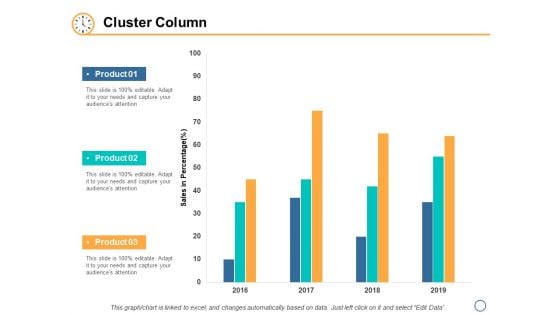
Cluster Column Marketing Planning Ppt PowerPoint Presentation Ideas Vector
This is a cluster column marketing planning ppt powerpoint presentation ideas vector. This is a three stage process. The stages in this process are finance, analysis, business, investment, marketing.
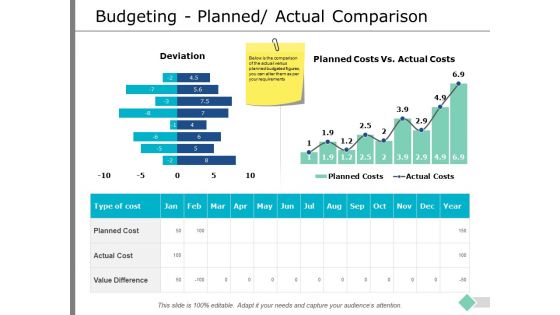
Budgeting Planned Actual Comparison Ppt PowerPoint Presentation Inspiration Gallery
This is a budgeting planned actual comparison ppt powerpoint presentation inspiration gallery. This is a two stage process. The stages in this process are finance, analysis, business, investment, marketing.
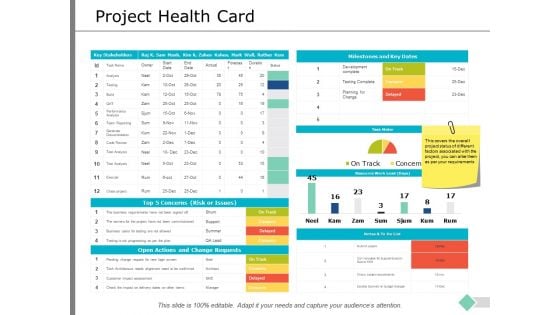
Project Health Card Business Ppt PowerPoint Presentation Summary Samples
This is a project health card business ppt powerpoint presentation summary samples. This is a three stage process. The stages in this process are finance, analysis, business, investment, marketing.
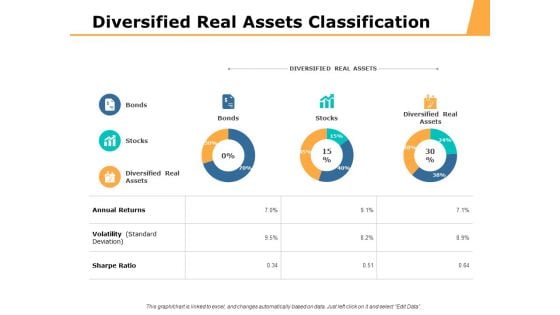
Diversified Real Assets Classification Ppt PowerPoint Presentation Ideas Tips
This is a diversified real assets classification ppt powerpoint presentation ideas tips. This is a three stage process. The stages in this process are percentage, product, business, management, marketing.
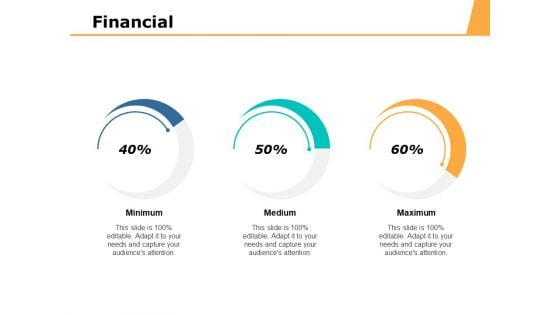
Financial Investment Analysis Ppt PowerPoint Presentation Layouts Design Inspiration
This is a financial investment analysis ppt powerpoint presentation layouts design inspiration. This is a three stage process. The stages in this process are finance, marketing, management, investment, analysis.
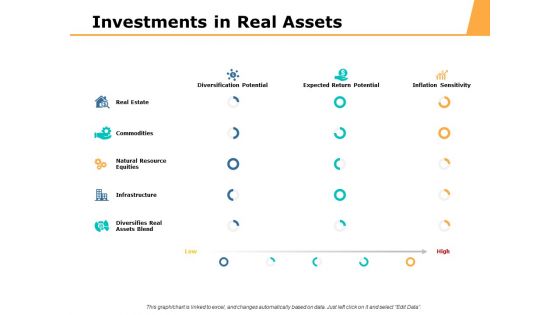
Investments In Real Assets Ppt PowerPoint Presentation Styles Pictures
This is a investments in real assets ppt powerpoint presentation styles pictures. This is a three stage process. The stages in this process are percentage, product, business, management, marketing.
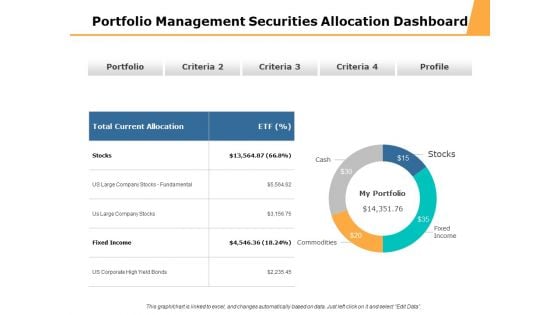
Portfolio Management Securities Allocation Dashboard Ppt PowerPoint Presentation Professional Design Ideas
This is a portfolio management securities allocation dashboard ppt powerpoint presentation professional design ideas. This is a four stage process. The stages in this process are percentage product, business, management, marketing.

Portfolio Summary Management Dashboard Ppt PowerPoint Presentation File Design Templates
This is a portfolio summary management dashboard ppt powerpoint presentation file design templates. This is a five stage process. The stages in this process are percentage product, business, management, marketing.
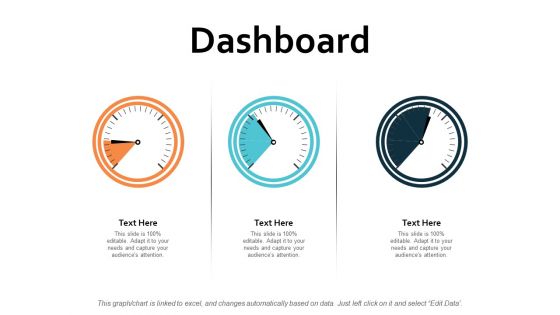
Dashboard Finance Ppt PowerPoint Presentation Infographic Template Graphic Tips
This is a dashboard finance ppt powerpoint presentation infographic template graphic tips. This is a three stage process. The stages in this process are dashboard, finance, analysis, business, investment.
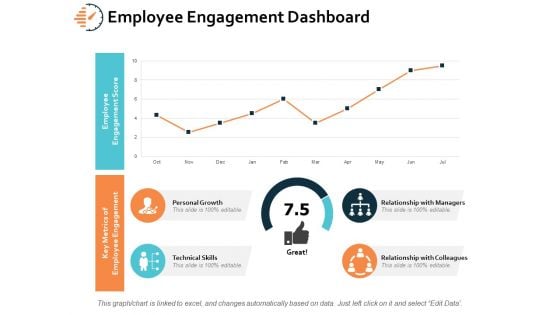
Employee Engagement Dashboard Ppt PowerPoint Presentation Layouts Inspiration
This is a employee engagement dashboard ppt powerpoint presentation layouts inspiration. This is a four stage process. The stages in this process are personal growth, technical skills, marketing, planning, strategy.
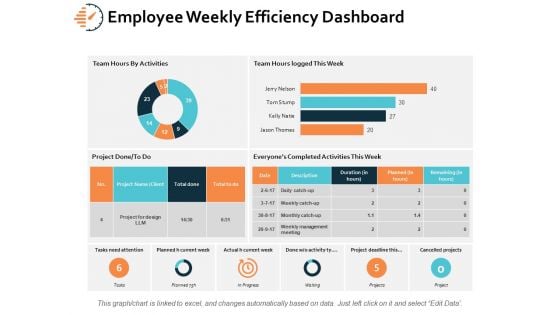
Employee Weekly Efficiency Dashboard Ppt PowerPoint Presentation Infographics Microsoft
This is a employee weekly efficiency dashboard ppt powerpoint presentation infographics microsoft. This is a six stage process. The stages in this process are finance, analysis, business, investment, marketing.
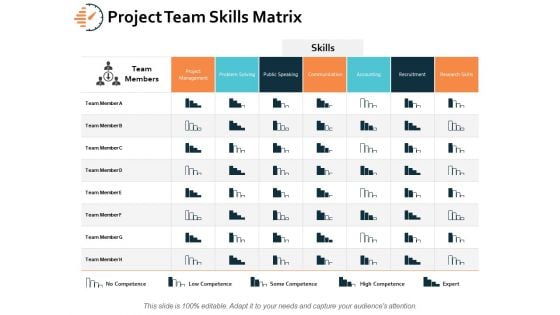
Project Team Skills Matrix Ppt PowerPoint Presentation Styles Example Introduction
This is a project team skills matrix ppt powerpoint presentation styles example introduction. This is a seven stage process. The stages in this process are communication, accounting, problem solving, project management, recruitment.
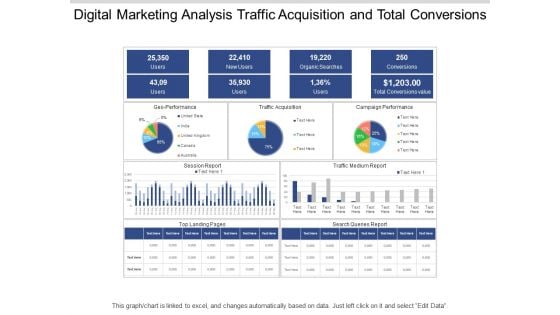
Digital Marketing Analysis Traffic Acquisition And Total Conversions Ppt PowerPoint Presentation Pictures Layouts
This is a digital marketing analysis traffic acquisition and total conversions ppt powerpoint presentation pictures layouts. This is a three stage process. The stages in this process are digital analytics, digital dashboard, marketing.
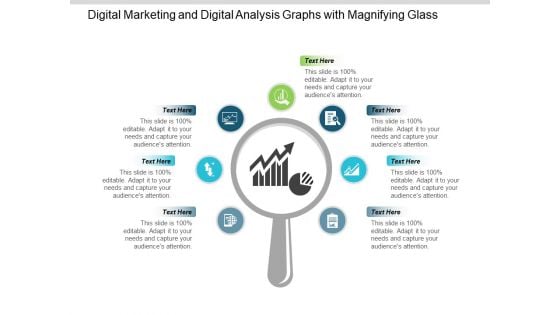
Digital Marketing And Digital Analysis Graphs With Magnifying Glass Ppt PowerPoint Presentation Portfolio Show
This is a digital marketing and digital analysis graphs with magnifying glass ppt powerpoint presentation portfolio show. This is a seven stage process. The stages in this process are digital analytics, digital dashboard, marketing.
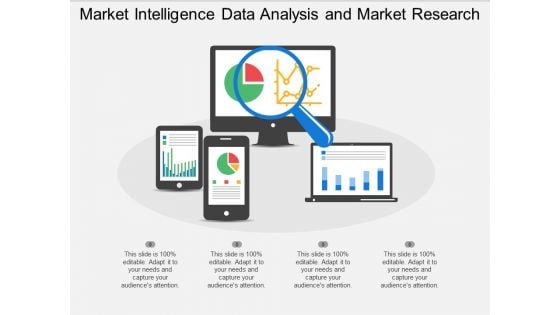
Market Intelligence Data Analysis And Market Research Ppt PowerPoint Presentation Professional Templates
This is a market intelligence data analysis and market research ppt powerpoint presentation professional templates. This is a four stage process. The stages in this process are digital analytics, digital dashboard, marketing.
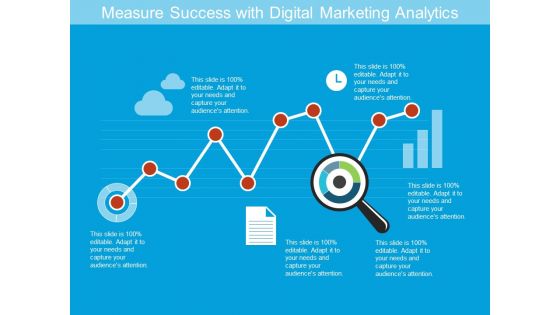
Measure Success With Digital Marketing Analytics Ppt PowerPoint Presentation Gallery Infographics
This is a measure success with digital marketing analytics ppt powerpoint presentation gallery infographics. This is a five stage process. The stages in this process are digital analytics, digital dashboard, marketing.
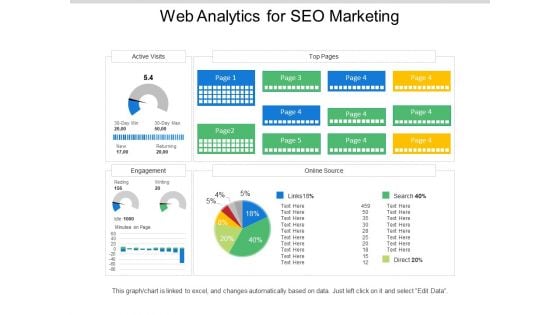
Web Analytics For Seo Marketing Ppt PowerPoint Presentation Examples
This is a web analytics for seo marketing ppt powerpoint presentation examples. This is a five stage process. The stages in this process are digital analytics, digital dashboard, marketing.
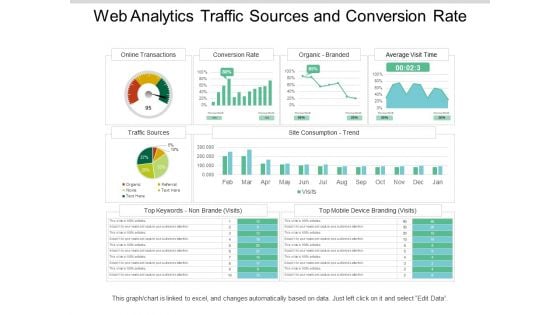
Web Analytics Traffic Sources And Conversion Rate Ppt PowerPoint Presentation Picture
This is a web analytics traffic sources and conversion rate ppt powerpoint presentation picture. This is a four stage process. The stages in this process are digital analytics, digital dashboard, marketing.
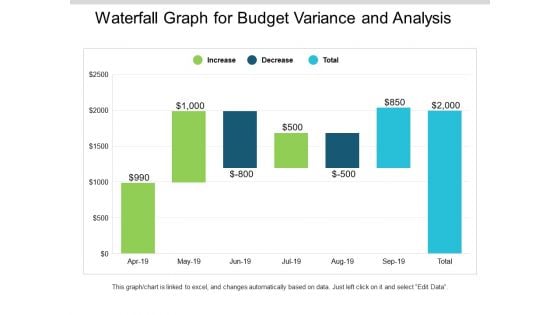
Waterfall Graph For Budget Variance And Analysis Ppt PowerPoint Presentation Slides Mockup
This is a waterfall graph for budget variance and analysis ppt powerpoint presentation slides mockup. This is a three stage process. The stages in this process are profit and loss, balance sheet, income statement, benefit and loss.
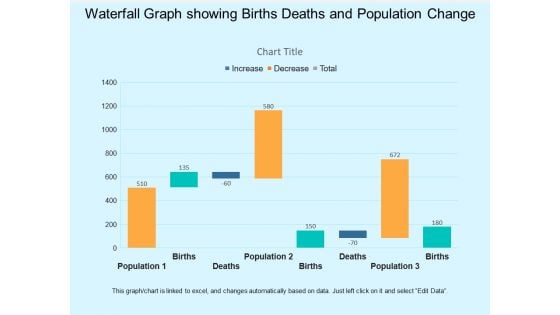
Waterfall Graph Showing Births Deaths And Population Change Ppt PowerPoint Presentation Infographic Template Visual Aids
This is a waterfall graph showing births deaths and population change ppt powerpoint presentation infographic template visual aids. This is a three stage process. The stages in this process are profit and loss, balance sheet, income statement, benefit and loss.
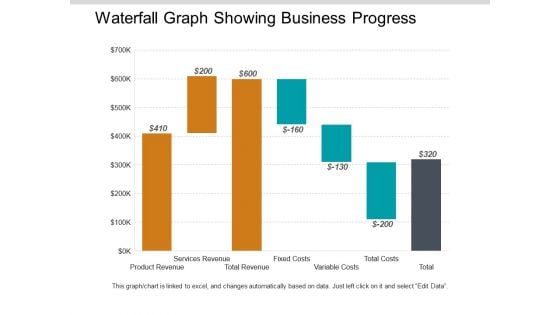
Waterfall Graph Showing Business Progress Ppt PowerPoint Presentation Styles Model
This is a waterfall graph showing business progress ppt powerpoint presentation styles model. This is a three stage process. The stages in this process are profit and loss, balance sheet, income statement, benefit and loss.
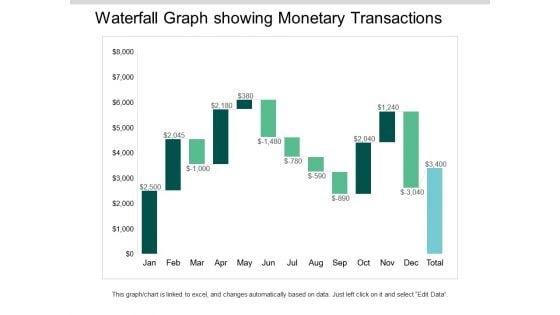
Waterfall Graph Showing Monetary Transactions Ppt PowerPoint Presentation Ideas Visuals
This is a waterfall graph showing monetary transactions ppt powerpoint presentation ideas visuals. This is a three stage process. The stages in this process are profit and loss, balance sheet, income statement, benefit and loss.
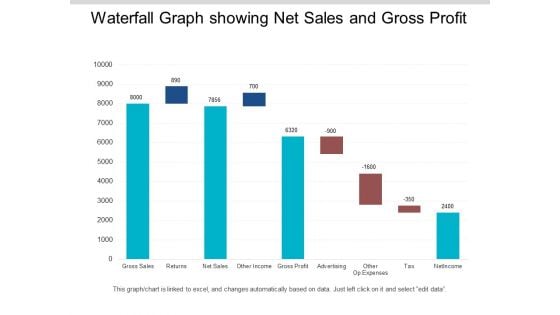
Waterfall Graph Showing Net Sales And Gross Profit Ppt PowerPoint Presentation Infographics Format
This is a waterfall graph showing net sales and gross profit ppt powerpoint presentation infographics format. This is a three stage process. The stages in this process are profit and loss, balance sheet, income statement, benefit and loss.
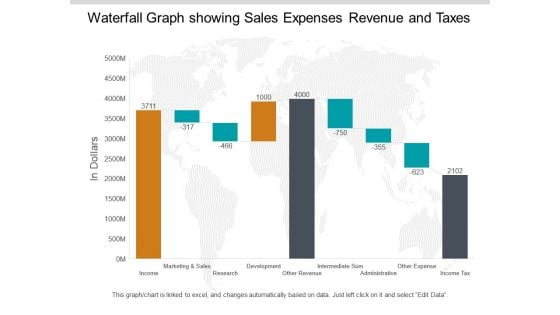
Waterfall Graph Showing Sales Expenses Revenue And Taxes Ppt PowerPoint Presentation Pictures Summary
This is a waterfall graph showing sales expenses revenue and taxes ppt powerpoint presentation pictures summary. This is a three stage process. The stages in this process are profit and loss, balance sheet, income statement, benefit and loss.
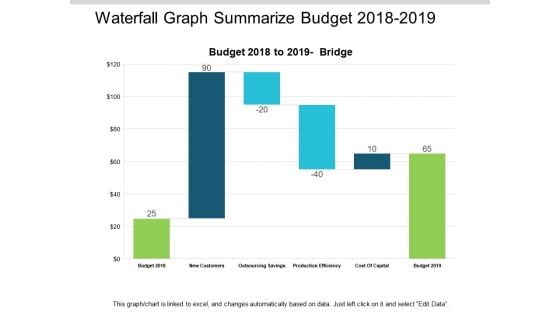
Waterfall Graph Summarize Budget 2018 To 2019 Ppt PowerPoint Presentation Summary Slides
This is a waterfall graph summarize budget 2018 to 2019 ppt powerpoint presentation summary slides. This is a three stage process. The stages in this process are profit and loss, balance sheet, income statement, benefit and loss.
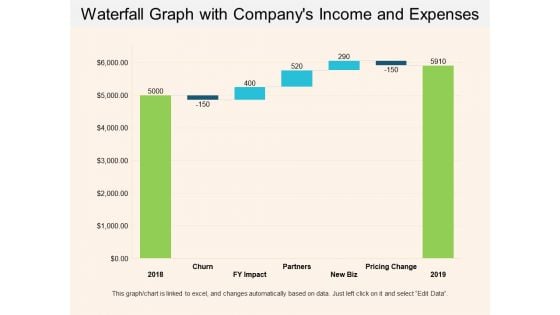
Waterfall Graph With Companys Income And Expenses Ppt PowerPoint Presentation Show Example Introduction
This is a waterfall graph with companys income and expenses ppt powerpoint presentation show example introduction. This is a three stage process. The stages in this process are profit and loss, balance sheet, income statement, benefit and loss.
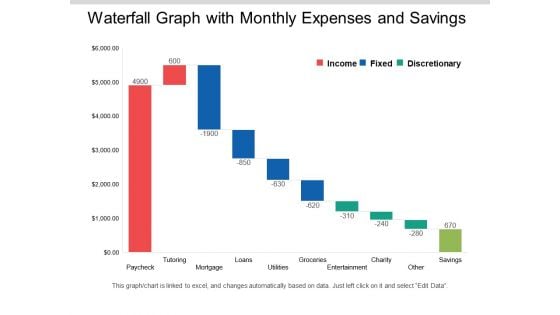
Waterfall Graph With Monthly Expenses And Savings Ppt PowerPoint Presentation Layouts Clipart Images
This is a waterfall graph with monthly expenses and savings ppt powerpoint presentation layouts clipart images. This is a three stage process. The stages in this process are profit and loss, balance sheet, income statement, benefit and loss.
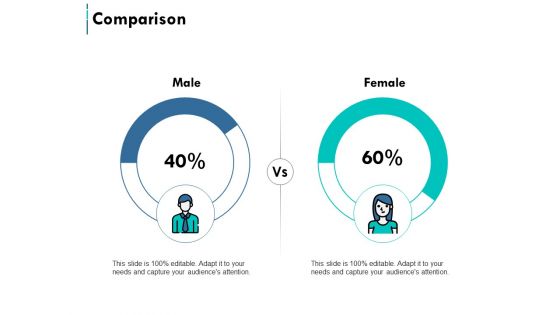
Comparison Male And Female Ppt PowerPoint Presentation Styles Infographic Template
This is a comparison male and female ppt powerpoint presentation styles infographic template. This is a two stage process. The stages in this process are business, management, marketing, comparison.
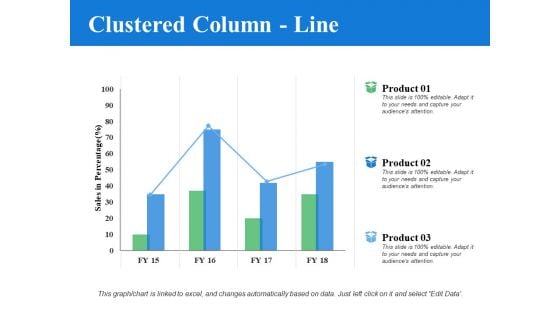
Clustered Column Line Analysis Ppt PowerPoint Presentation Layouts Visual Aids
This is a clustered column line analysis ppt powerpoint presentation layouts visual aids. This is a three stage process. The stages in this process are percentage, product, business, management.

Stacked Column Percentage Product Ppt PowerPoint Presentation Infographics Outfit
This is a stacked column percentage product ppt powerpoint presentation infographics outfit. This is a two stage process. The stages in this process are marketing, business, management, percentage, product.
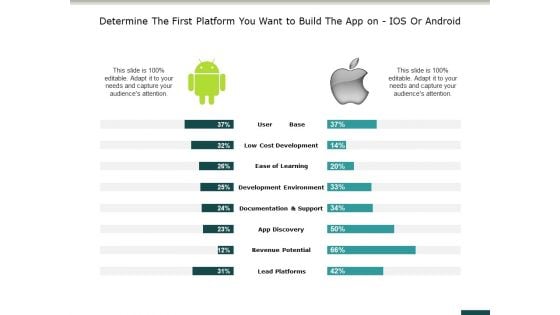
Determine The First Platform You Want To Build The App On Ios Or Android Ppt PowerPoint Presentation Pictures Master Slide
This is a determine the first platform you want to build the app on ios or android ppt powerpoint presentation pictures master slide. This is a two stage process. The stages in this process are business, management, marketing, percentage, product.
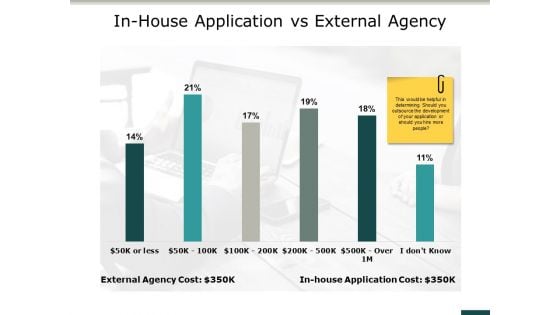
In House Application Vs External Agency Ppt PowerPoint Presentation Portfolio Images
This is a in house application vs external agency ppt powerpoint presentation portfolio images. This is a two stage process. The stages in this process are business, management, marketing, parentage, product.
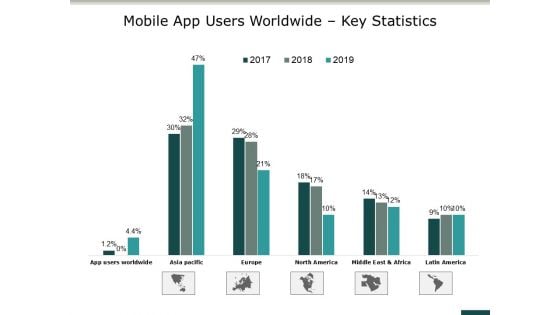
Mobile App Users Worldwide Key Statistics Ppt PowerPoint Presentation File Design Templates
This is a mobile app users worldwide key statistics ppt powerpoint presentation file design templates. This is a three stage process. The stages in this process are finance, marketing, management, investment, analysis.
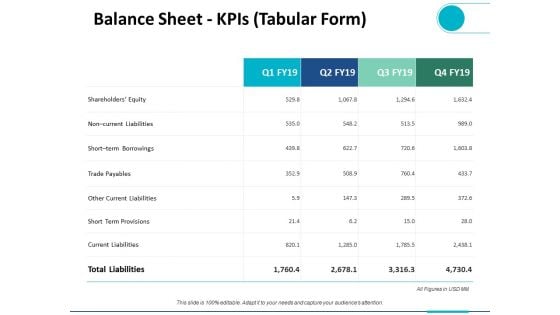
Balance Sheet Kpis Tabular Form Ppt PowerPoint Presentation Ideas Design Templates
This is a balance sheet kpis tabular form ppt powerpoint presentation ideas design templates. This is a four stage process. The stages in this process are finance, analysis, business, investment, marketing.
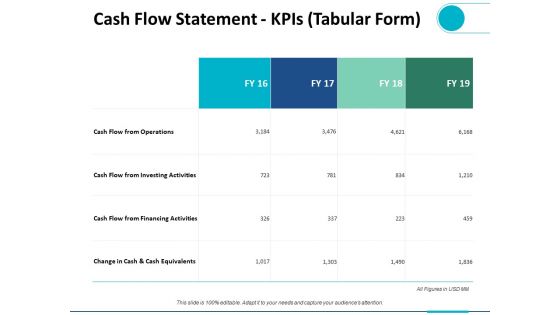
Cash Flow Statement Kpis Tabular Form Ppt PowerPoint Presentation Summary Infographic Template
This is a cash flow statement kpis tabular form ppt powerpoint presentation summary infographic template. This is a four stage process. The stages in this process are finance, analysis, business, investment, marketing.
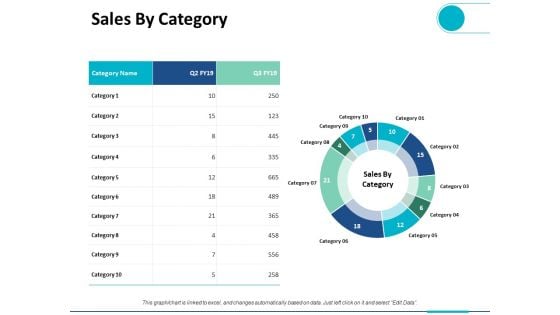
Sales By Category Ppt PowerPoint Presentation Ideas Graphics Design
This is a sales by category ppt powerpoint presentation ideas graphics design. This is a three stage process. The stages in this process are finance, analysis, business, investment, marketing.
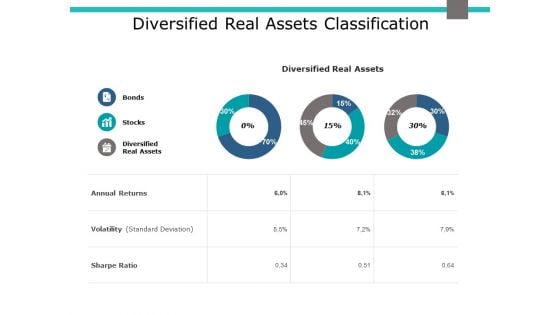
Diversified Real Assets Classification Ppt PowerPoint Presentation Slides Grid
This is a diversified real assets classification ppt powerpoint presentation slides grid. This is a three stage process. The stages in this process are business, management, marketing, percentage, product.
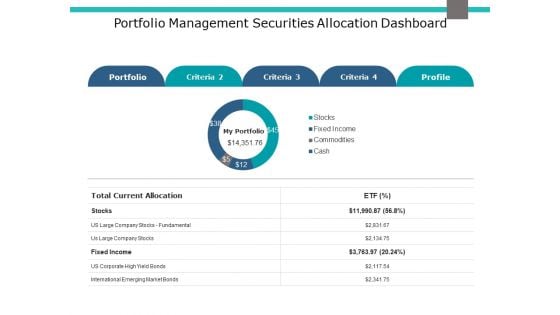
Portfolio Management Securities Allocation Dashboard Ppt PowerPoint Presentation Pictures Objects
This is a portfolio management securities allocation dashboard ppt powerpoint presentation pictures objects. This is a five stage process. The stages in this process are finance, marketing, management, investment.

Comparison Slide Male Female Marketing Ppt PowerPoint Presentation File Slideshow
This is a comparison slide male female marketing ppt powerpoint presentation file slideshow. This is a three stage process. The stages in this process are finance, marketing, management, comparison.
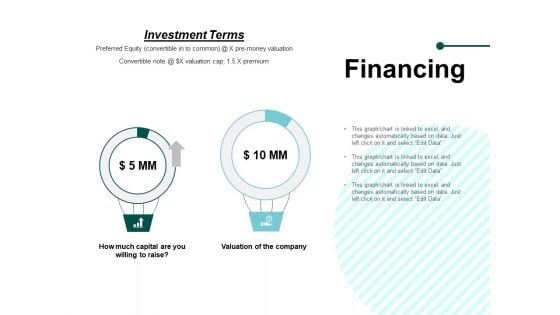
Financing Management Investment Ppt PowerPoint Presentation Inspiration Slide Portrait
This is a financing management investment ppt powerpoint presentation inspiration slide portrait. This is a three stage process. The stages in this process are finance, marketing, management, investment, analysis.
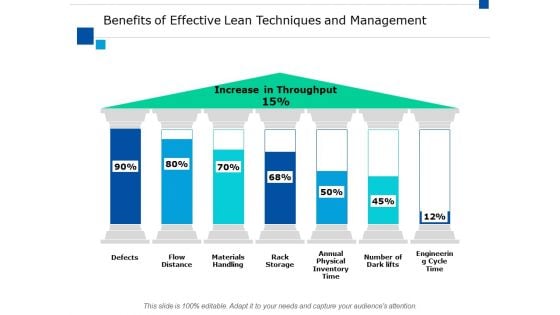
Benefits Of Effective Lean Techniques And Management Ppt PowerPoint Presentation Styles Design Inspiration
This is a benefits of effective lean techniques and management ppt powerpoint presentation styles design inspiration. This is a seven stage process. The stages in this process are finance, marketing, management, investment, analysis.
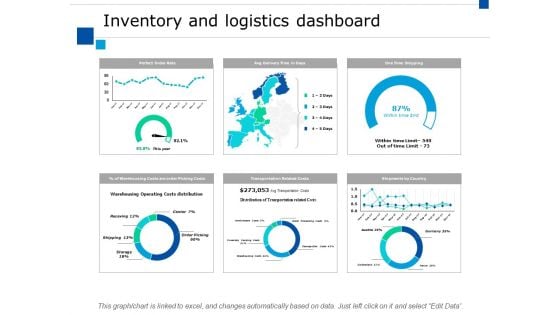
Inventory And Logistics Dashboard Ppt PowerPoint Presentation Professional Styles
This is a inventory and logistics dashboard ppt powerpoint presentation professional styles. This is a four stage process. The stages in this process are finance, marketing, management, investment, analysis.
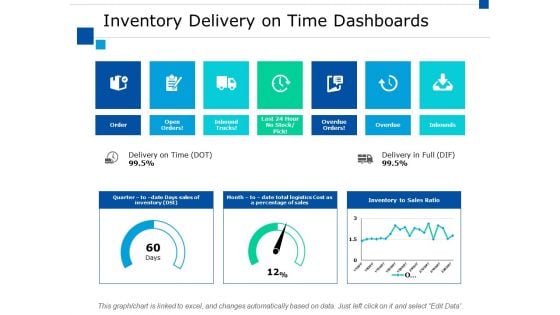
Inventory Delivery On Time Dashboards Ppt PowerPoint Presentation Slides Download
This is a inventory delivery on time dashboards ppt powerpoint presentation slides download. This is a seven stage process. The stages in this process are finance, marketing, management, investment, analysis.
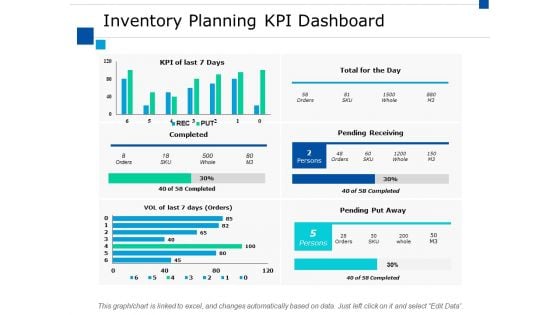
Inventory Planning Kpi Dashboard Ppt PowerPoint Presentation Summary Layout Ideas
This is a inventory planning kpi dashboard ppt powerpoint presentation summary layout ideas. This is a two stage process. The stages in this process are finance, marketing, management, investment, analysis.
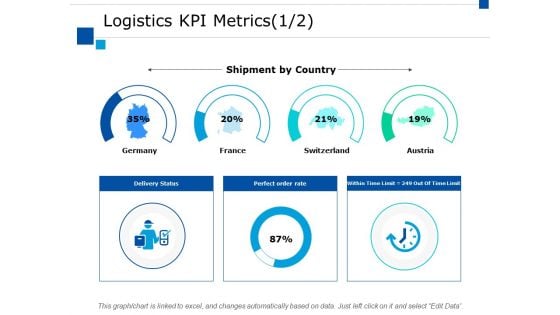
Logistics Kpi Metrics Business Ppt PowerPoint Presentation Ideas Infographics
This is a logistics kpi metrics business ppt powerpoint presentation ideas infographics. This is a four stage process. The stages in this process are finance, marketing, management, investment, analysis.
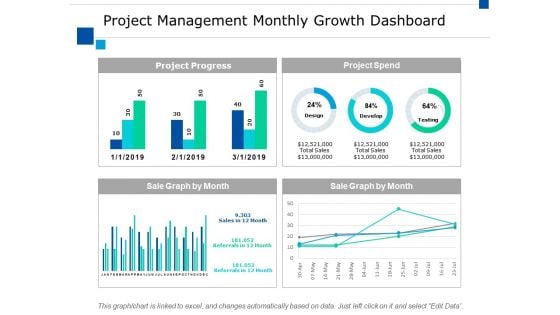
Project Management Monthly Growth Dashboard Ppt PowerPoint Presentation Pictures Guide
This is a project management monthly growth dashboard ppt powerpoint presentation pictures guide. This is a four stage process. The stages in this process are finance, marketing, management, investment, analysis.
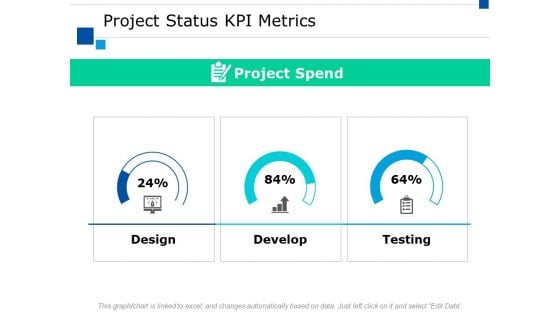
Project Status Kpi Metrics Slide Ppt PowerPoint Presentation Model Picture
This is a project status kpi metrics slide ppt powerpoint presentation model picture. This is a two stage process. The stages in this process are finance, marketing, management, investment, analysis.
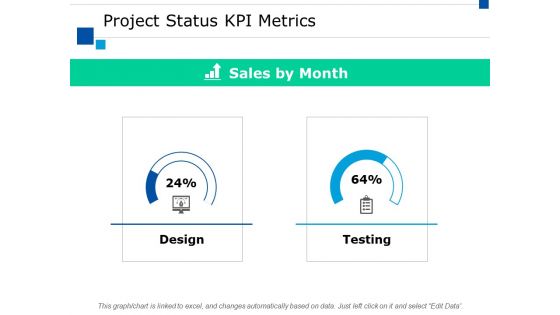
Project Status Kpi Metrics Ppt PowerPoint Presentation Show Format Ideas
This is a project status kpi metrics ppt powerpoint presentation show format ideas. This is a three stage process. The stages in this process are finance, marketing, management, investment, analysis.
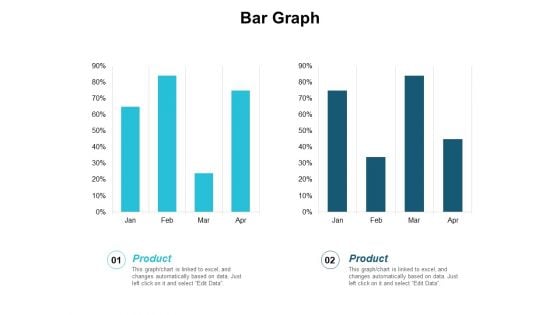
Bar Graph Finance Planning Ppt PowerPoint Presentation Infographic Template Master Slide
This is a bar graph finance planning ppt powerpoint presentation infographic template master slide. This is a two stage process. The stages in this process are finance, analysis, business, investment, marketing.
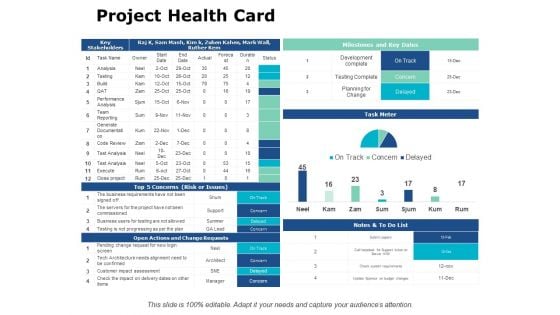
Project Health Card Management Ppt PowerPoint Presentation File Template
This is a project health card management ppt powerpoint presentation file template. This is a three stage process. The stages in this process are finance, analysis, business, investment, marketing.

Project Management Lifecycle Ppt PowerPoint Presentation Professional Designs Download
This is a project management lifecycle ppt powerpoint presentation professional designs download. This is a four stage process. The stages in this process are execution, planning, conceive, develop, concept.
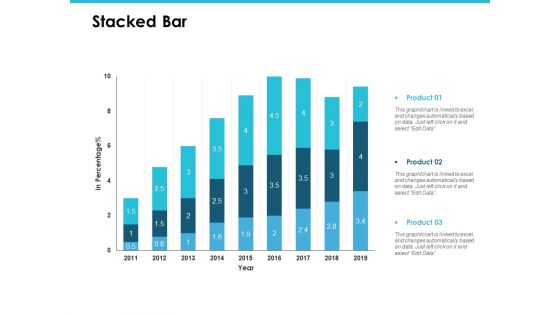
Stacked Bar Finance Marketing Ppt PowerPoint Presentation Portfolio Graphics Pictures
This is a stacked bar finance marketing ppt powerpoint presentation portfolio graphics pictures. This is a three stage process. The stages in this process are finance, marketing, management, investment, analysis.
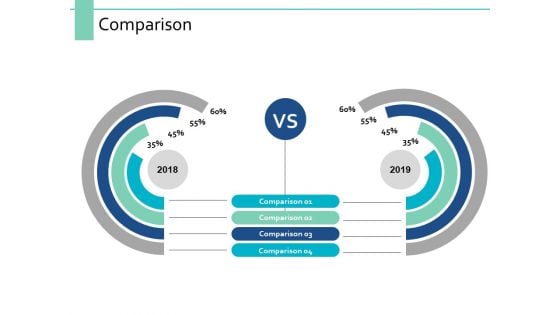
Comparison Marketing Strategy Ppt PowerPoint Presentation Infographic Template Example 2015
This is a comparison marketing strategy ppt powerpoint presentation infographic template example 2015. This is a two stage process. The stages in this process are finance, marketing, management, investment, analysis.
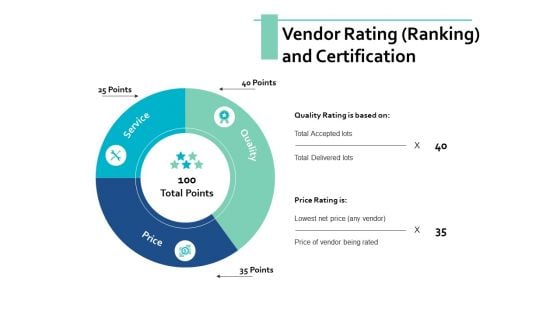
Vendor Rating Ranking And Certification Ppt PowerPoint Presentation Model Clipart
This is a vendor rating ranking and certification ppt powerpoint presentation model clipart. This is a three stage process. The stages in this process are finance, marketing, management, investment, analysis.
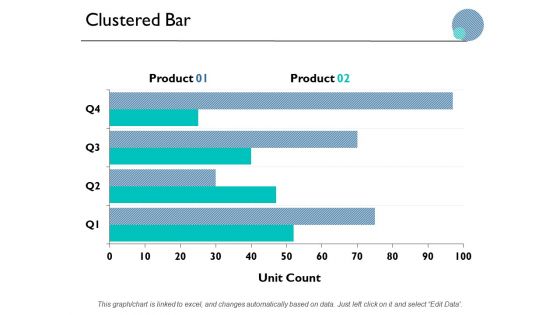
Clustered Bar Finance Marketing Ppt PowerPoint Presentation Inspiration Infographics
This is a clustered bar finance marketing ppt powerpoint presentation inspiration infographics. This is a two stage process. The stages in this process are finance, marketing, management, investment, analysis.
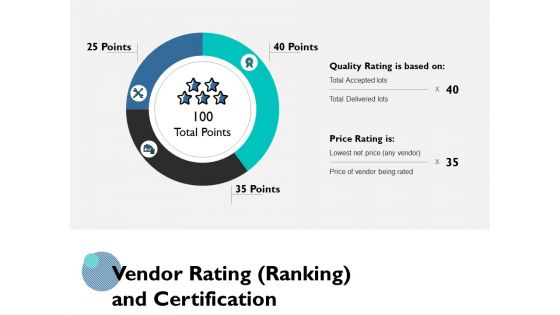
Vendor Rating Ranking And Certification Ppt PowerPoint Presentation Gallery Ideas
This is a vendor rating ranking and certification ppt powerpoint presentation gallery ideas. This is a three stage process. The stages in this process are finance, marketing, management, investment, analysis.
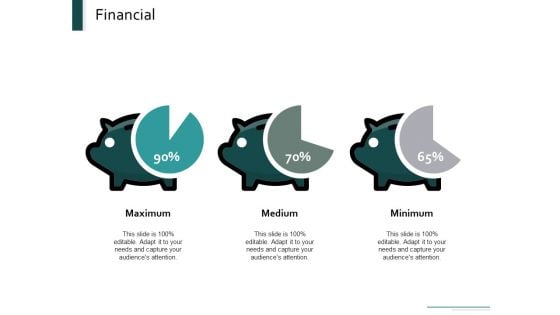
Financial Maximum Medium Minimum Ppt Powerpoint Presentation Portfolio Master Slide
This is a financial maximum medium minimum ppt powerpoint presentation portfolio master slide.This is a three stage process. The stages in this process are financial, maximum, medium, minimum, management.
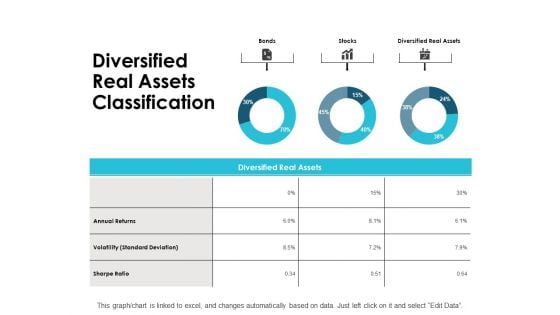
Diversified Real Assets Classification Ppt PowerPoint Presentation Ideas Graphics
This is a diversified real assets classification ppt powerpoint presentation ideas graphics. This is a three stage process. The stages in this process are management, marketing, business, strategy, finance.
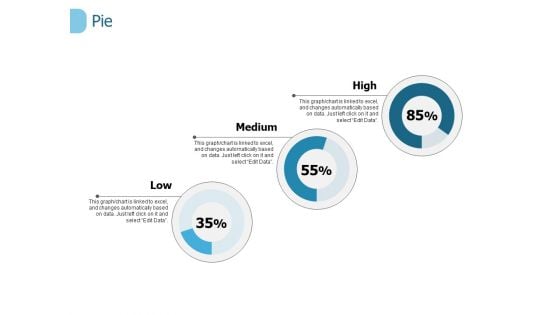
Pie Finance Management Ppt PowerPoint Presentation Styles Master Slide
This is a pie finance management ppt powerpoint presentation styles master slide. This is a three stage process. The stages in this process are finance, marketing, analysis, investment, management.
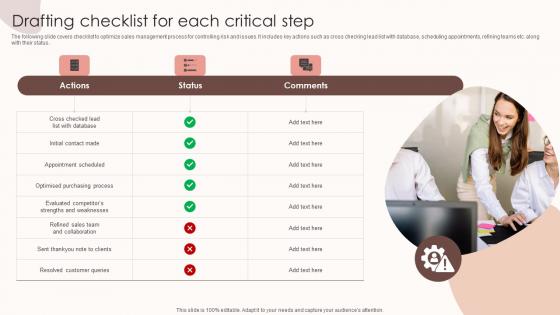
Assessing Sales Risks Drafting Checklist For Each Critical Step Structure PDF
The following slide covers checklist to optimize sales management process for controlling risk and issues. It includes key actions such as cross checking lead list with database, scheduling appointments, refining teams etc. along with their status. If you are looking for a format to display your unique thoughts, then the professionally designed Assessing Sales Risks Drafting Checklist For Each Critical Step Structure PDF is the one for you. You can use it as a Google Slides template or a PowerPoint template. Incorporate impressive visuals, symbols, images, and other charts. Modify or reorganize the text boxes as you desire. Experiment with shade schemes and font pairings. Alter, share or cooperate with other people on your work. Download Assessing Sales Risks Drafting Checklist For Each Critical Step Structure PDF and find out how to give a successful presentation. Present a perfect display to your team and make your presentation unforgettable. The following slide covers checklist to optimize sales management process for controlling risk and issues. It includes key actions such as cross checking lead list with database, scheduling appointments, refining teams etc. along with their status.
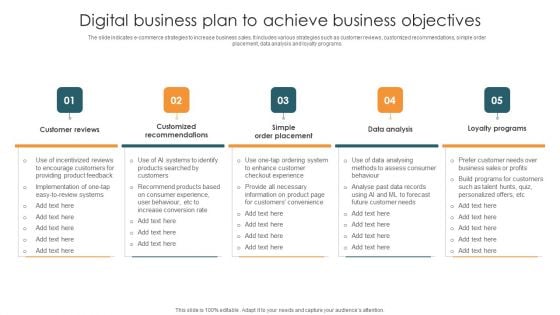
Digital Business Plan To Achieve Business Objectives Slides PDF
The slide indicates e-commerce strategies to increase business sales. It includes various strategies such as customer reviews, customized recommendations, simple order placement, data analysis and loyalty programs.Presenting Digital Business Plan To Achieve Business Objectives Slides PDF to dispense important information. This template comprises five stages. It also presents valuable insights into the topics including Customer Reviews, Customized Recommendations, Order Placement. This is a completely customizable PowerPoint theme that can be put to use immediately. So, download it and address the topic impactfully.

 Home
Home