System Icon
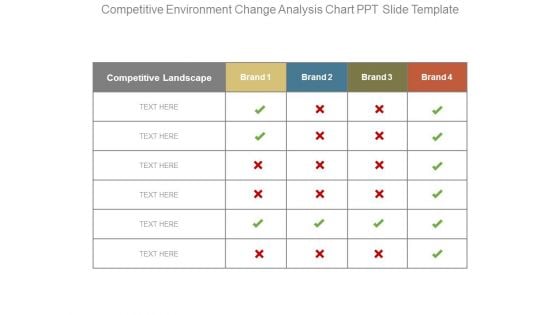
Competitive Environment Change Analysis Chart Ppt Slide Template
This is a competitive environment change analysis chart ppt slide template. This is a four stage process. The stages in this process are competitive landscape, brand.
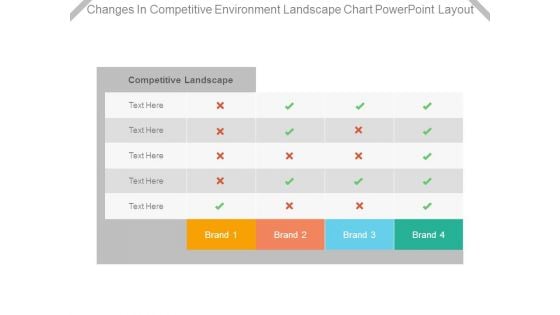
Changes In Competitive Environment Landscape Chart Powerpoint Layout
This is a changes in competitive environment landscape chart powerpoint layout. This is a four stage process. The stages in this process are competitive landscape, brand.
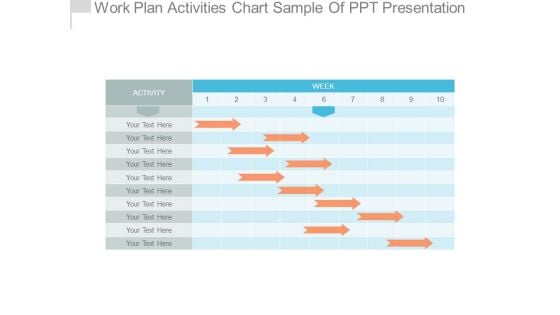
Work Plan Activities Chart Sample Of Ppt Presentation
This is a work plan activities chart sample of ppt presentation. This is a ten stage process. The stages in this process are table, management, business, strategy, presentation.
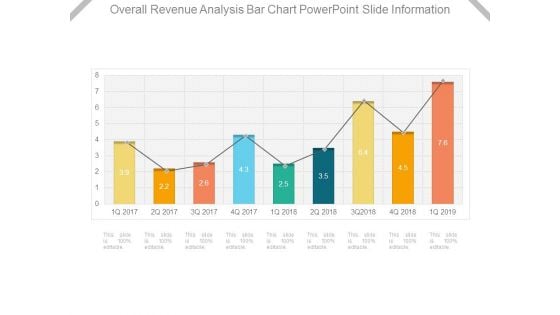
Overall Revenue Analysis Bar Chart Powerpoint Slide Information
This is a overall revenue analysis bar chart powerpoint slide information. This is a nine stage process. The stages in this process are finance, success, business, marketing, percentage.
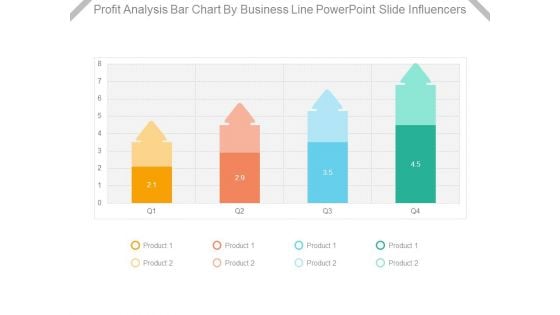
Profit Analysis Bar Chart By Business Line Powerpoint Slide Influencers
This is a profit analysis bar chart by business line powerpoint slide influencers. This is a four stage process. The stages in this process are product.
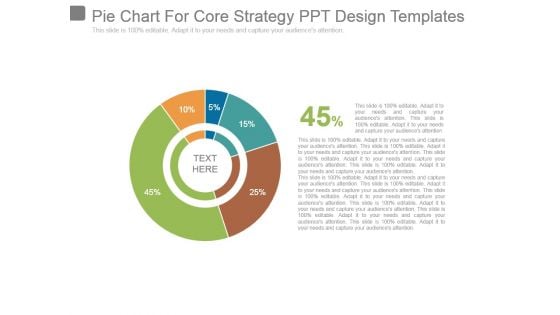
Pie Chart For Core Strategy Ppt Design Templates
This is a pie chart for core strategy ppt design templates. This is a five stage process. The stages in this process are business, marketing, strategy, finance, percentage.
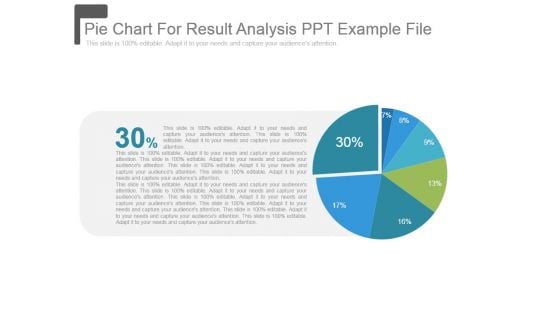
Pie Chart For Result Analysis Ppt Example File
This is a pie chart for result analysis ppt example file. This is a seven stage process. The stages in this process are pie, marketing, strategy, finance, percentage.
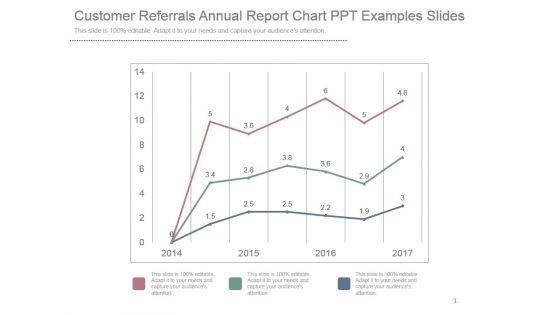
Customer Referrals Annual Report Chart Ppt Examples Slides
This is a customer referrals annual report chart ppt examples slides. This is a three stage process. The stages in this process are business, marketing, graph, success, years.
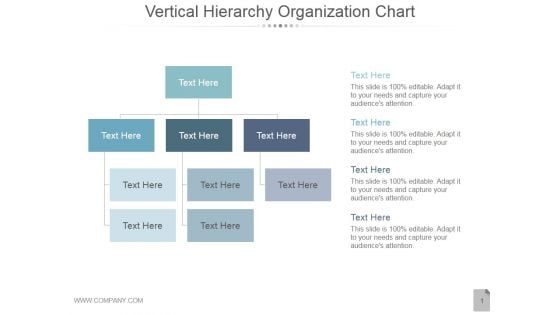
Vertical Hierarchy Organization Chart Ppt PowerPoint Presentation Layouts
This is a vertical hierarchy organization chart ppt powerpoint presentation layouts. This is a four stage process. The stages in this process are text, marketing, business, success, tables.
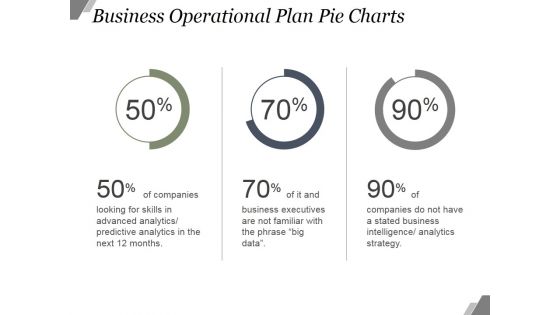
Business Operational Plan Pie Charts Ppt PowerPoint Presentation Templates
This is a business operational plan pie charts ppt powerpoint presentation templates. This is a three stage process. The stages in this process are finance, business, marketing, percentage.
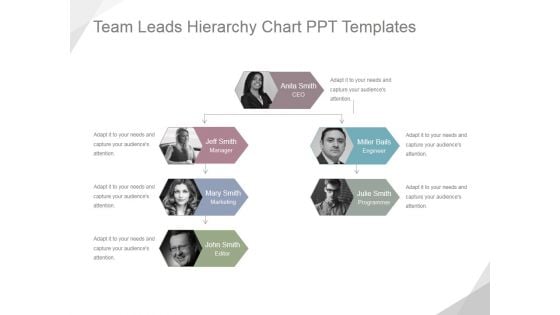
Team Leads Hierarchy Chart Ppt PowerPoint Presentation Ideas
This is a team leads hierarchy chart ppt powerpoint presentation ideas. This is a four stage process. The stages in this process are ceo, manager, marketing, editor, programmer.
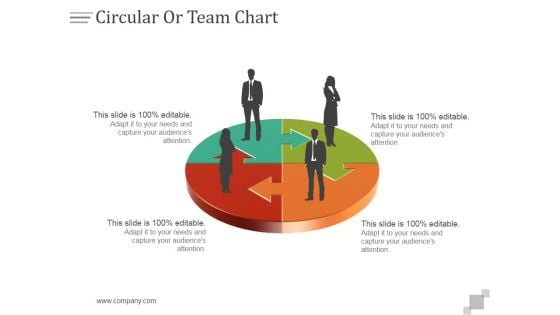
Circular Or Team Chart Ppt PowerPoint Presentation Samples
This is a circular or team chart ppt powerpoint presentation samples. This is a four stage process. The stages in this process are business, teamwork, communication, management, success.
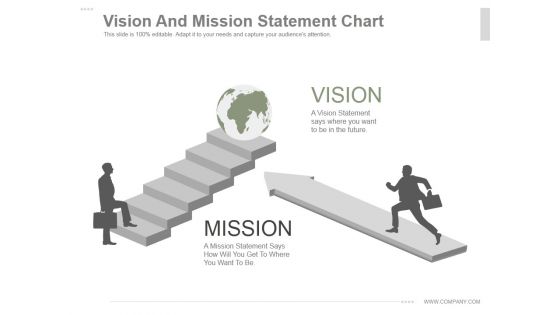
Vision And Mission Statement Chart Ppt PowerPoint Presentation Ideas
This is a vision and mission statement chart ppt powerpoint presentation ideas. This is a two stage process. The stages in this process are vision, mission.
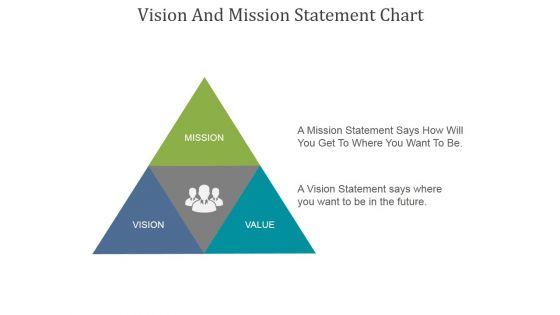
Vision And Mission Statement Chart Ppt PowerPoint Presentation Deck
This is a vision and mission statement chart ppt powerpoint presentation deck. This is a three stage process. The stages in this process are mission, vision, value.
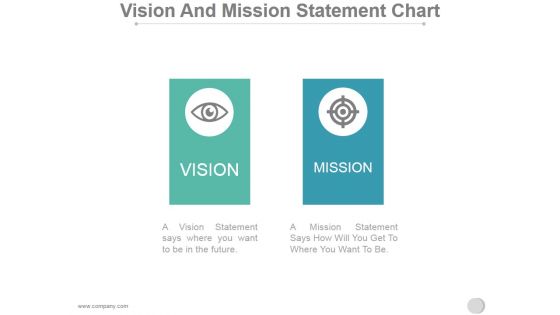
Vision And Mission Statement Chart Ppt PowerPoint Presentation Topics
This is a vision and mission statement chart ppt powerpoint presentation topics. This is a two stage process. The stages in this process are vision, mission.
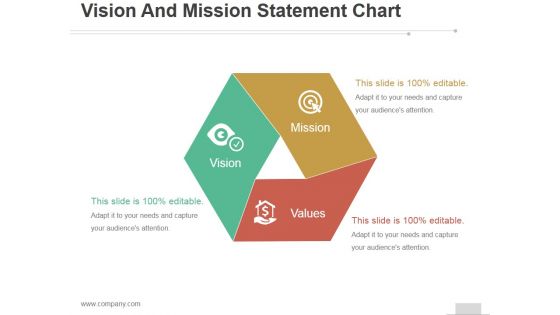
Vision And Mission Statement Chart Ppt PowerPoint Presentation Background Images
This is a vision and mission statement chart ppt powerpoint presentation background images. This is a three stage process. The stages in this process are mission, vision, values.
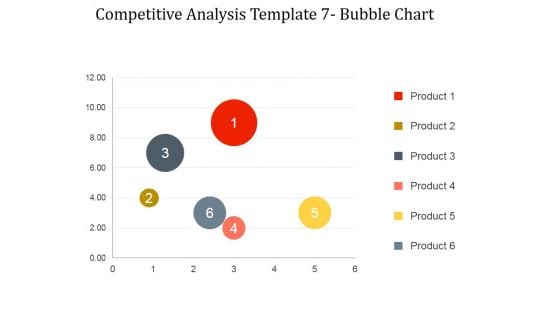
Competitive Analysis Bubble Chart Ppt PowerPoint Presentation Templates
This is a competitive analysis bubble chart ppt powerpoint presentation templates. This is a six stage process. The stages in this process are product, business, management, marketing, strategy.
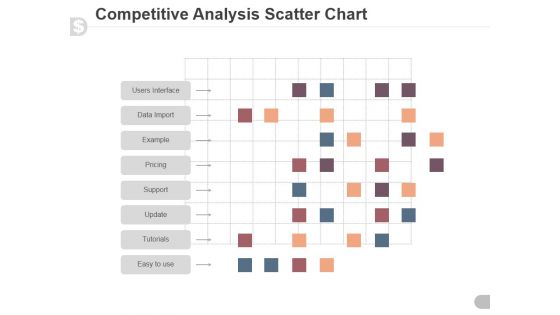
Competitive Analysis Scatter Chart Ppt PowerPoint Presentation Samples
This is a competitive analysis scatter chart ppt powerpoint presentation samples. This is a six stage process. The stages in this process are competitive, analysis, business, marketing, management.
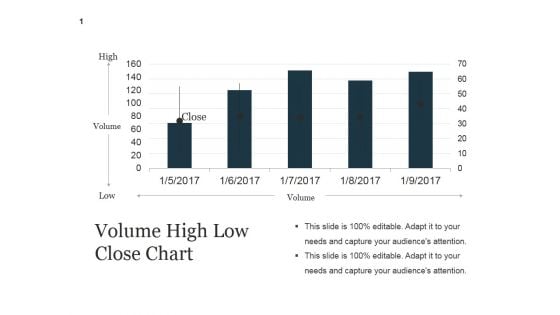
Volume High Low Close Chart Ppt PowerPoint Presentation Guide
This is a volume high low close chart ppt powerpoint presentation guide. This is a five stage process. The stages in this process are high, volume, close, low.
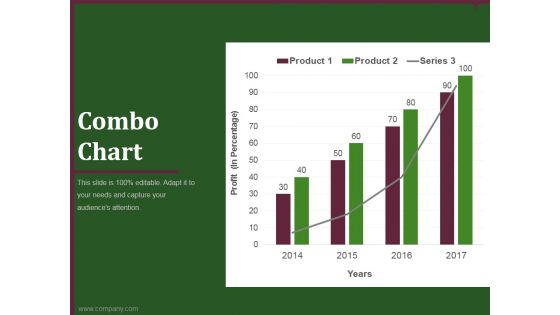
combo chart template 1 ppt powerpoint presentation show
This is a combo chart template 1 ppt powerpoint presentation show. This is a four stage process. The stages in this process are business, marketing, finance, analysis, growth.
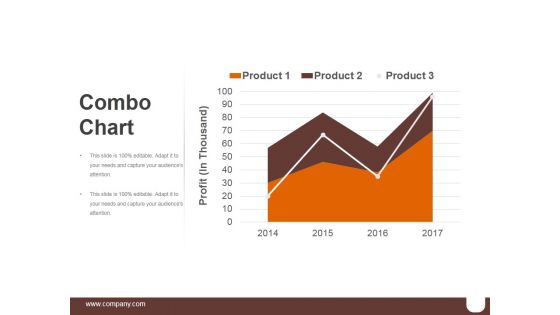
Combo Chart Template 2 Ppt PowerPoint Presentation Graphics
This is a combo chart template 2 ppt powerpoint presentation graphics. This is a three stage process. The stages in this process are business, marketing, finance, growth, management.
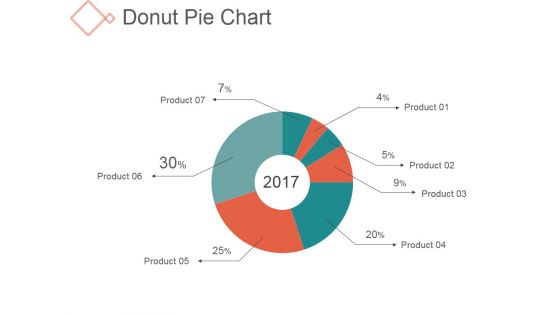
Donut Pie Chart Ppt PowerPoint Presentation Background Images
This is a donut pie chart ppt powerpoint presentation background images. This is a seven stage process. The stages in this process are management, business, finance, percentage.
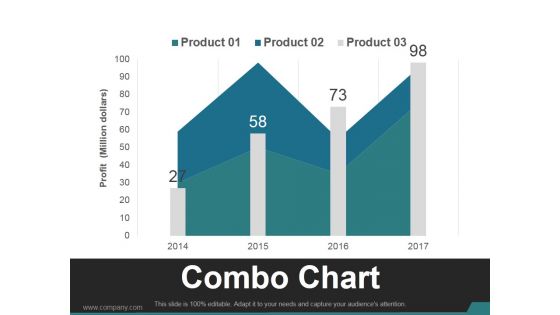
Combo Chart Template 2 Ppt PowerPoint Presentation Guidelines
This is a combo chart template 2 ppt powerpoint presentation guidelines. This is a four stage process. The stages in this process are business, marketing, growth, product, timeline.
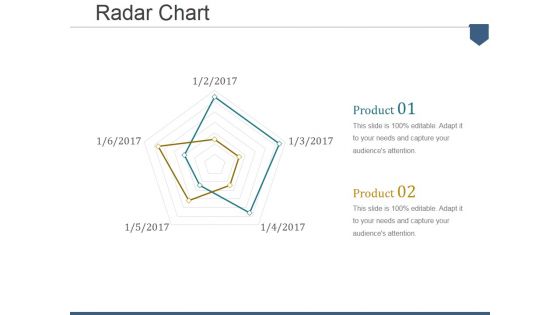
Radar Chart Ppt PowerPoint Presentation Inspiration Clipart Images
This is a radar chart ppt powerpoint presentation inspiration clipart images. This is a two stage process. The stages in this process are business, management, strategy, marketing, planning.
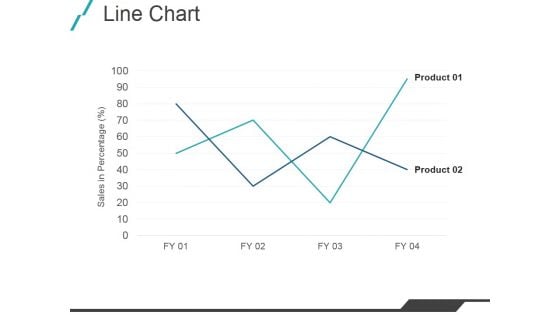
Line Chart Ppt PowerPoint Presentation Model Example File
This is a line chart ppt powerpoint presentation model example file. This is a two stage process. The stages in this process are product, graph, growth, management.
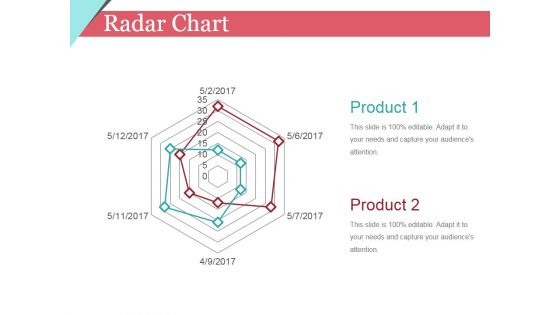
Radar Chart Ppt PowerPoint Presentation Infographic Template Design Templates
This is a radar chart ppt powerpoint presentation infographic template design templates. This is a seven stage process. The stages in this process are business, shapes, product, marketing.
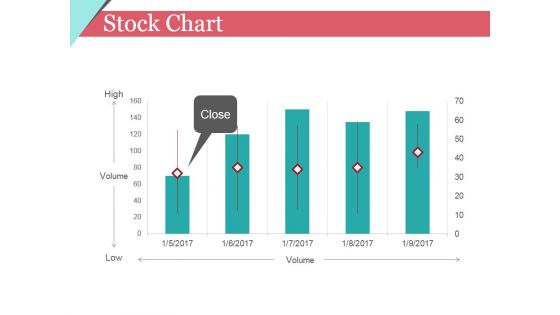
Stock Chart Ppt PowerPoint Presentation Infographic Template Clipart Images
This is a stock chart ppt powerpoint presentation infographic template clipart images. This is a five stage process. The stages in this process are high, volume, low, close.
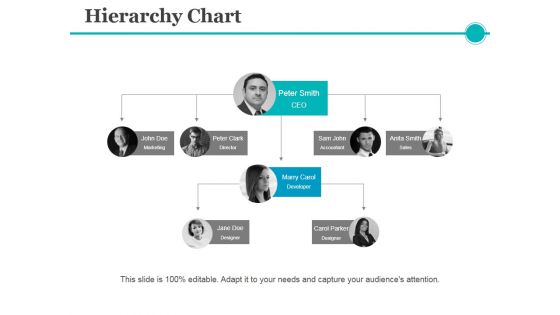
Hierarchy Chart Ppt PowerPoint Presentation Model Graphics Pictures
This is a hierarchy chart ppt powerpoint presentation model graphics pictures. This is a four stage process. The stages in this process are ceo, accountant, sales, developer, designer.

Line Chart Ppt PowerPoint Presentation Professional Slide Download
This is a line chart ppt powerpoint presentation professional slide download. This is a two stage process. The stages in this process are growth, business, management, marketing.
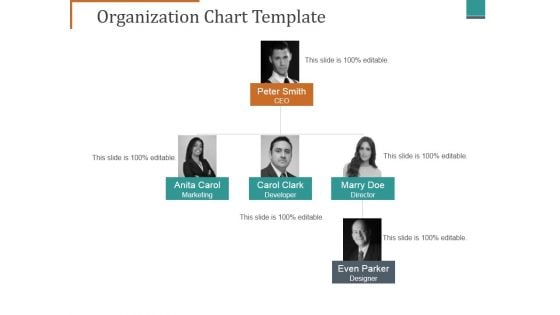
Organization Chart Template Ppt PowerPoint Presentation File Topics
This is a organization chart template ppt powerpoint presentation file topics. This is a three stage process. The stages in this process are ceo, marketing, developer, director, designer.

Organization Chart Template Ppt PowerPoint Presentation Gallery Microsoft
This is a organization chart template ppt powerpoint presentation gallery microsoft. This is a two stage process. The stages in this process are carter, parker, engineer, marketing, manager.

Scatter Chart Ppt PowerPoint Presentation Portfolio Design Inspiration
This is a scatter chart ppt powerpoint presentation portfolio design inspiration. This is a twelve stage process. The stages in this process are graph, growth, success, business.
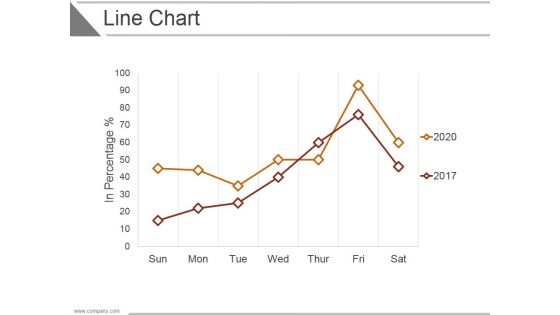
Line Chart Ppt PowerPoint Presentation Infographic Template Shapes
This is a line chart ppt powerpoint presentation infographic template shapes. This is a seven stage process. The stages in this process are business, strategy, analysis, marketing, growth.
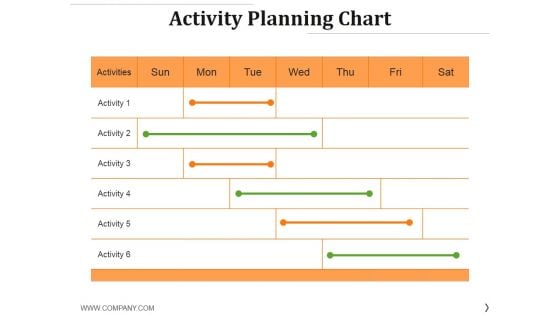
Activity Planning Chart Ppt PowerPoint Presentation Show Layout
This is a activity planning chart ppt powerpoint presentation show layout. This is a six stage process. The stages in this process are activities, activity, business, table, management.
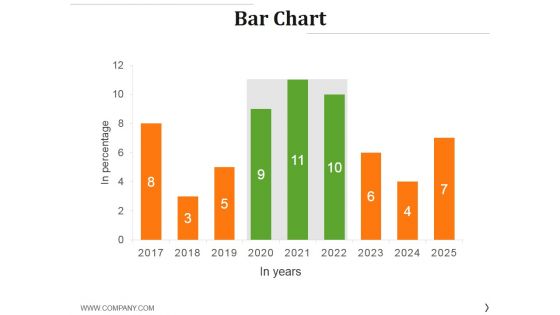
Bar Chart Ppt PowerPoint Presentation Styles Graphics Example
This is a bar chart ppt powerpoint presentation styles graphics example. This is a nine stage process. The stages in this process are graph, growth, success, business, finance.
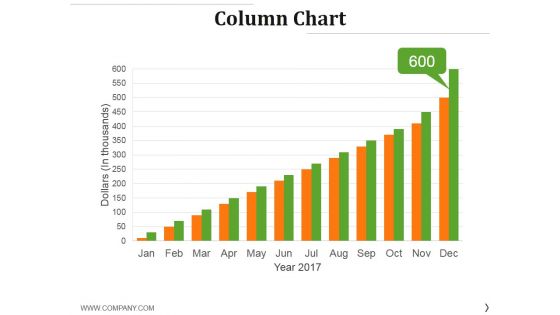
Column Chart Ppt PowerPoint Presentation Inspiration Example Topics
This is a column chart ppt powerpoint presentation inspiration example topics. This is a twelve stage process. The stages in this process are dollar, growth, business, marketing, success.
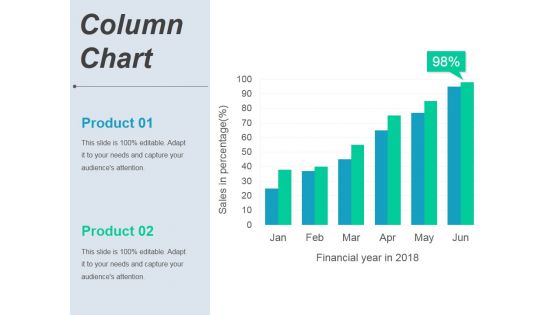
Column Chart Ppt PowerPoint Presentation Portfolio Graphics Template
This is a column chart ppt powerpoint presentation portfolio graphics template. This is a six stage process. The stages in this process are product, finance, growth, success, business.

Combo Chart Ppt PowerPoint Presentation Professional Graphics Example
This is a combo chart ppt powerpoint presentation professional graphics example. This is a eight stage process. The stages in this process are product, finance, growth, success, business.

Area Chart Ppt PowerPoint Presentation Show Graphic Images
This is a area chart ppt powerpoint presentation show graphic images. This is a two stage process. The stages in this process are business, marketing, management, finance, growth.
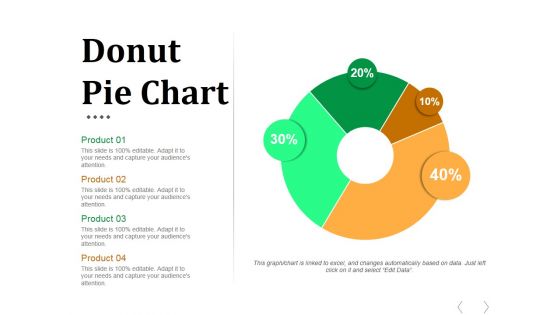
Donut Pie Chart Ppt PowerPoint Presentation Infographics Graphics
This is a donut pie chart ppt powerpoint presentation infographics graphics. This is a four stage process. The stages in this process are business, marketing, donut, finance, management.
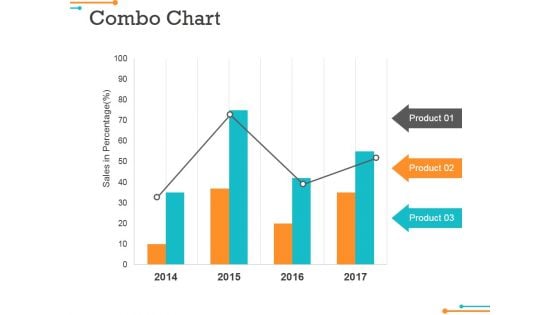
Combo Chart Ppt Powerpoint Presentation Infographic Template File Formats
This is a combo chart ppt powerpoint presentation infographic template file formats. This is a four stage process. The stages in this process are product, growth, management, business.
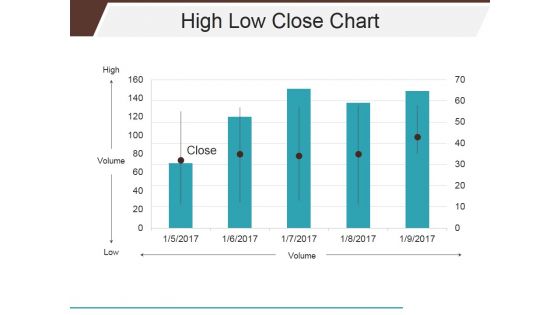
High Low Close Chart Ppt PowerPoint Presentation Infographics Shapes
This is a high low close chart ppt powerpoint presentation infographics shapes. This is a five stage process. The stages in this process are close, volume, high, low.
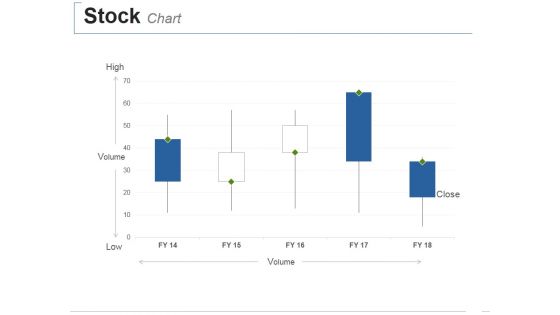
Stock Chart Ppt PowerPoint Presentation Styles Visual Aids
This is a stock chart ppt powerpoint presentation styles visual aids. This is a three stage process. The stages in this process are high, volume, low, close.
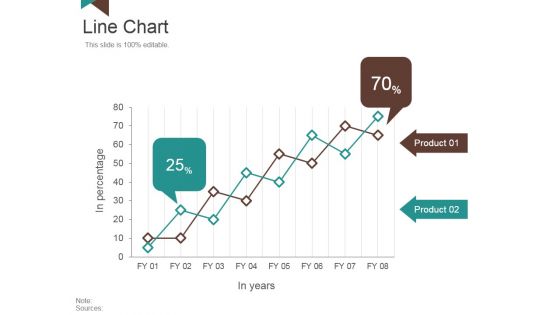
Line Chart Ppt PowerPoint Presentation Layouts Background Image
This is a line chart ppt powerpoint presentation layouts background image. This is a two stage process. The stages in this process are in percentage, in years, product.
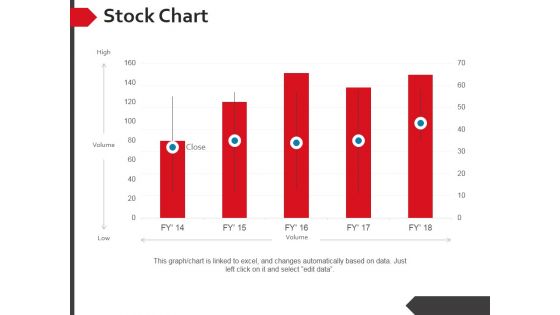
Stock Chart Ppt PowerPoint Presentation Summary Background Designs
This is a stock chart ppt powerpoint presentation summary background designs. This is a five stage process. The stages in this process are high, volume, low.
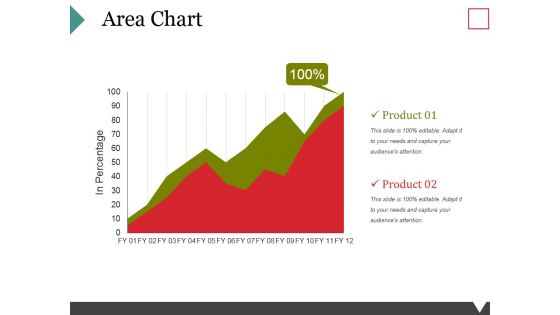
Area Chart Ppt PowerPoint Presentation Gallery Example Topics
This is a area chart ppt powerpoint presentation gallery example topics. This is a two stage process. The stages in this process are product, growth, finance, management, business.
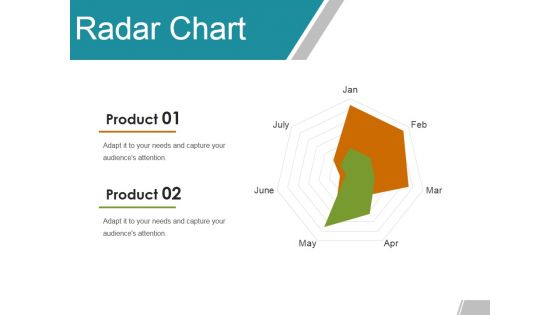
Radar Chart Ppt PowerPoint Presentation Gallery Example Topics
This is a radar chart ppt powerpoint presentation gallery example topics. This is a seven stage process. The stages in this process are product, business, marketing, shapes.
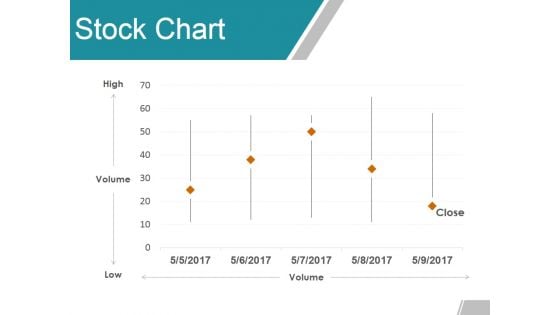
Stock Chart Ppt PowerPoint Presentation Summary Graphics Pictures
This is a stock chart ppt powerpoint presentation summary graphics pictures. This is a five stage process. The stages in this process are high, volume, low, close, finance.
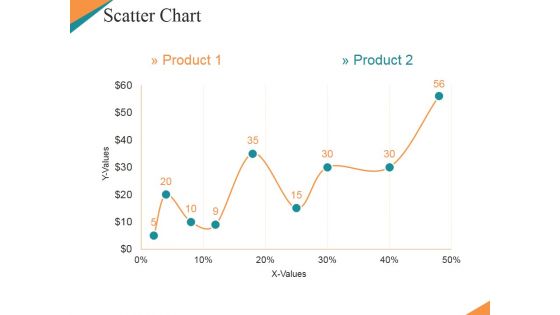
Scatter Chart Ppt PowerPoint Presentation Model Clipart Images
This is a scatter chart ppt powerpoint presentation model clipart images. This is a nine stage process. The stages in this process are finance, management, strategy, marketing, business.
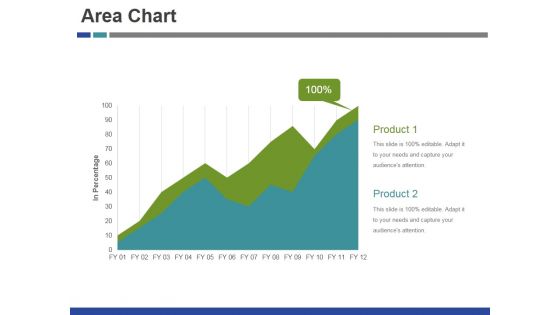
Area Chart Ppt PowerPoint Presentation Infographic Template Show
This is a area chart ppt powerpoint presentation infographic template show. This is a two stage process. The stages in this process are product, marketing, management, business, success.
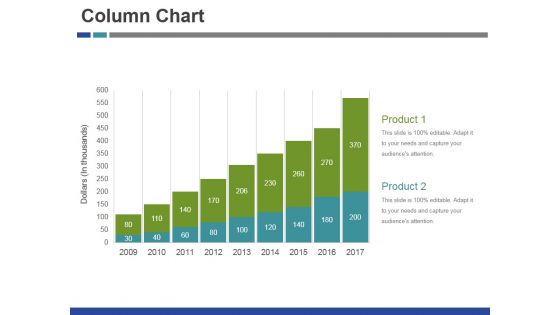
Column Chart Ppt PowerPoint Presentation Infographic Template Layouts
This is a column chart ppt powerpoint presentation infographic template layouts. This is a nine stage process. The stages in this process are product, growth, success, business, graph.
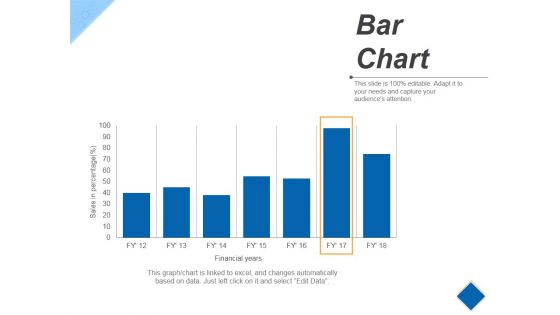
Bar Chart Ppt PowerPoint Presentation Infographic Template Example
This is a bar chart ppt powerpoint presentation infographic template example. This is a seven stage process. The stages in this process are business, finance, marketing, percentage.
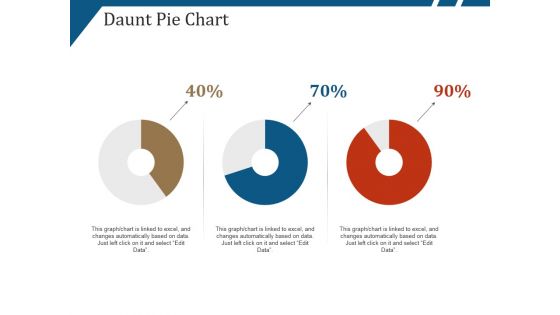
Daunt Pie Chart Ppt PowerPoint Presentation Layouts Portrait
This is a daunt pie chart ppt powerpoint presentation layouts portrait. This is a three stage process. The stages in this process are percentage, finance, donut, business.

Donut Pie Chart Ppt PowerPoint Presentation Professional Templates
This is a donut pie chart ppt powerpoint presentation professional templates. This is a three stage process. The stages in this process are finance, donut, business, marketing, strategy.
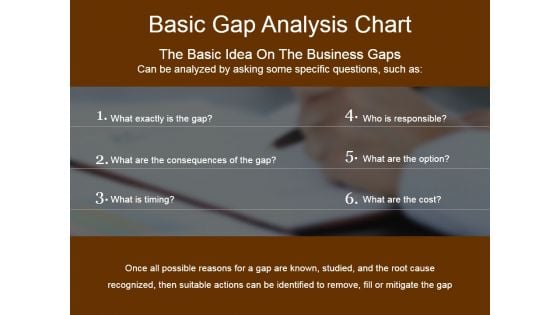
Basic Gap Analysis Chart Ppt PowerPoint Presentation Professional Portfolio
This is a basic gap analysis chart ppt powerpoint presentation professional portfolio. This is a six stage process. The stages in this process are business, step, marketing, management.
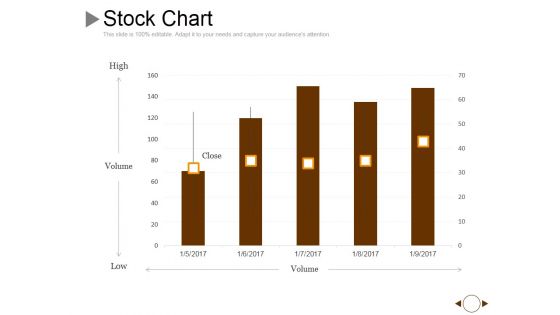
Stock Chart Ppt PowerPoint Presentation Gallery Graphics Example
This is a stock chart ppt powerpoint presentation gallery graphics example. This is a five stage process. The stages in this process are volume, high, low, close.
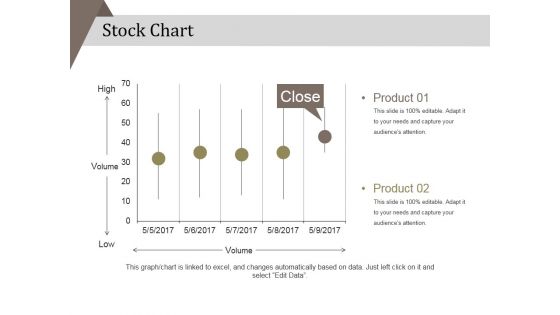
Stock Chart Ppt PowerPoint Presentation Portfolio Background Designs
This is a stock chart ppt powerpoint presentation portfolio background designs. This is a five stage process. The stages in this process are product, high, low .

Radar Chart Ppt PowerPoint Presentation Infographic Template Graphics Template
This is a radar chart ppt powerpoint presentation infographic template graphics template. This is a six stage process. The stages in this process are product, business, marketing, shapes.
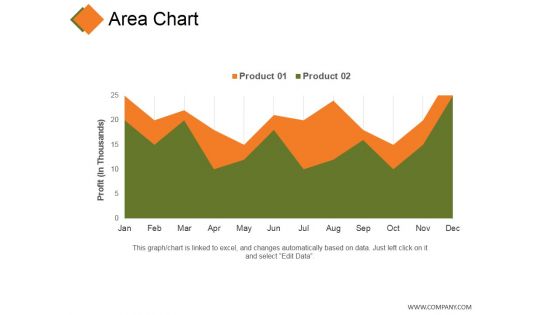
Area Chart Ppt PowerPoint Presentation Gallery Clipart Images
This is a area chart ppt powerpoint presentation gallery clipart images. This is a two stage process. The stages in this process are product, profit, business, finance, marketing.
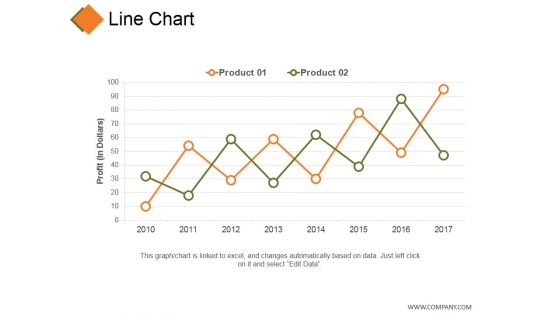
Line Chart Ppt PowerPoint Presentation Visual Aids Inspiration
This is a line chart ppt powerpoint presentation visual aids inspiration. This is a two stage process. The stages in this process are product, profit, growth, decline, success.

Line Chart Ppt PowerPoint Presentation Styles Graphics Example
This is a line chart ppt powerpoint presentation styles graphics example. This is a two stage process. The stages in this process are graph, business, success, marketing, line.
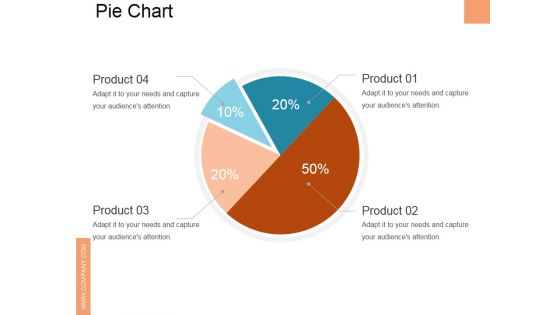
Pie Chart Ppt PowerPoint Presentation Slides Graphics Download
This is a pie chart ppt powerpoint presentation slides graphics download. This is a four stage process. The stages in this process are business, marketing, pie, finance, analysis.

Column Chart Ppt PowerPoint Presentation Inspiration Design Ideas
This is a column chart ppt powerpoint presentation inspiration design ideas. This is a nine stage process. The stages in this process are product, growth, success, graph, business.
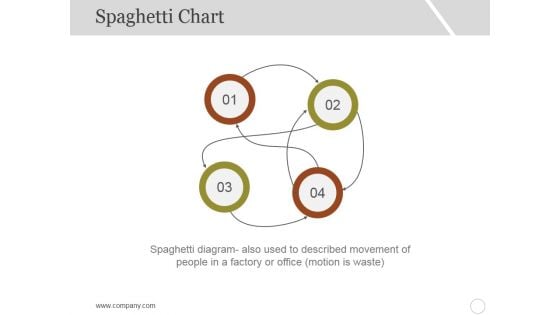
Spaghetti Chart Template 2 Ppt PowerPoint Presentation Inspiration Professional
This is a spaghetti chart template 2 ppt powerpoint presentation inspiration professional. This is a four stage process. The stages in this process are business, marketing, management, numbering.
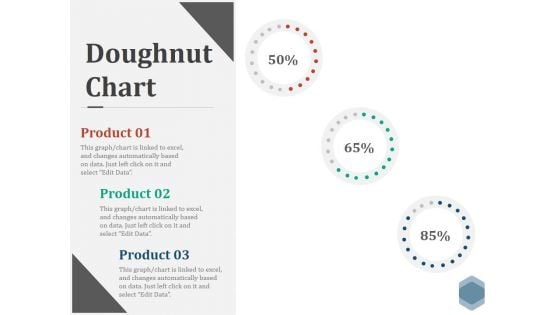
Doughnut Chart Ppt PowerPoint Presentation Visual Aids Files
This is a doughnut chart ppt powerpoint presentation visual aids files. This is a three stage process. The stages in this process are finance, donut, percentage, business, marketing.
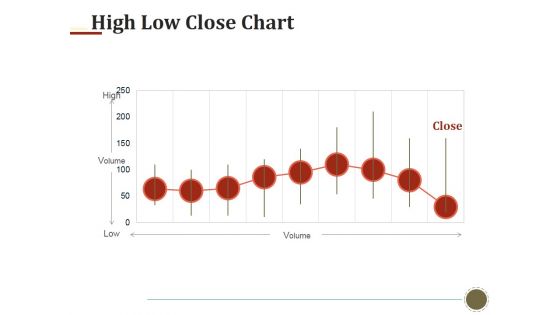
High Low Close Chart Ppt PowerPoint Presentation Infographics Templates
This is a high low close chart ppt powerpoint presentation infographics templates. This is a nine stage process. The stages in this process are high, volume, low, close.
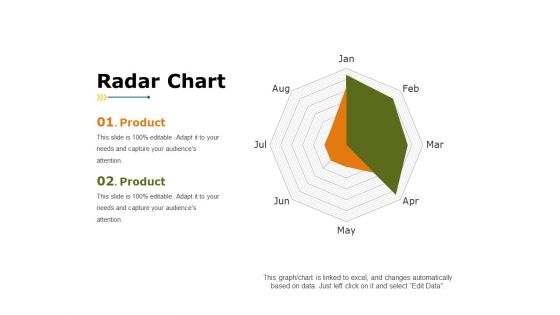
Radar Chart Ppt PowerPoint Presentation Summary Background Designs
This is a radar chart ppt powerpoint presentation summary background designs. This is a two stage process. The stages in this process are product, finance, business, marketing.
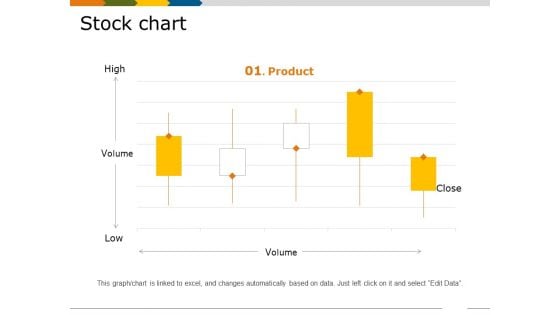
Stock Chart Ppt PowerPoint Presentation Pictures Graphics Tutorials
This is a stock chart ppt powerpoint presentation pictures graphics tutorials. This is a five stage process. The stages in this process are high, volume, low, product, business.
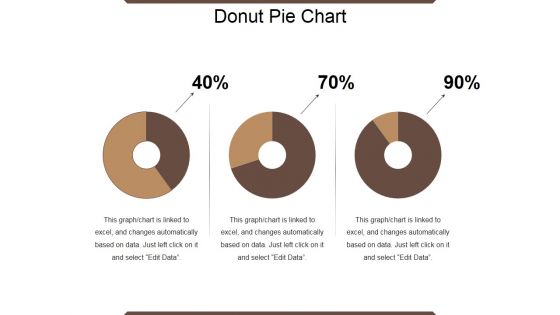
Donut Pie Chart Ppt PowerPoint Presentation Show Topics
This is a donut pie chart ppt powerpoint presentation show topics. This is a three stage process. The stages in this process are percentage, finance, donut, business.
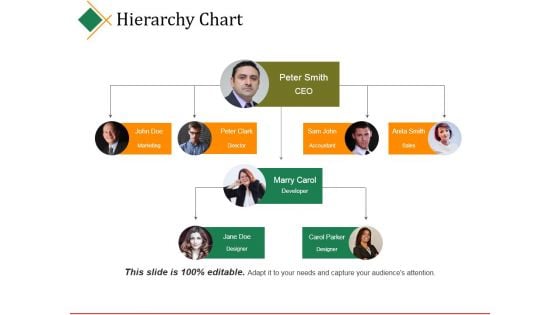
Hierarchy Chart Ppt PowerPoint Presentation Infographic Template Graphics
This is a hierarchy chart ppt powerpoint presentation infographic template graphics. This is a four stage process. The stages in this process are ceo, director, accountant, sales, developer.
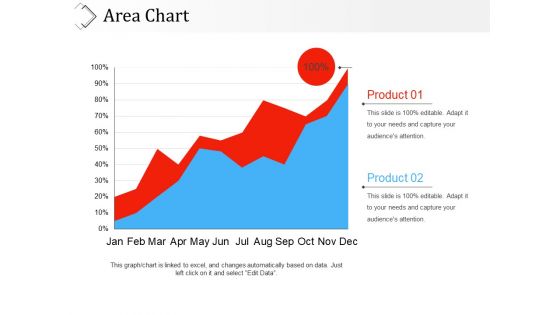
Area Chart Ppt PowerPoint Presentation Model Example Topics
This is a area chart ppt powerpoint presentation model example topics. This is a two stage process. The stages in this process are product, percentage, business, marketing, finance.
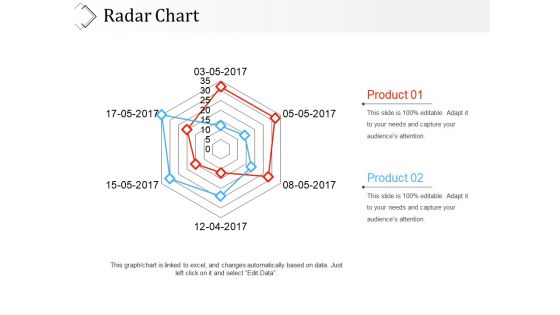
Radar Chart Ppt PowerPoint Presentation File Graphic Tips
This is a radar chart ppt powerpoint presentation file graphic tips. This is a two stage process. The stages in this process are product, finance, marketing, business.
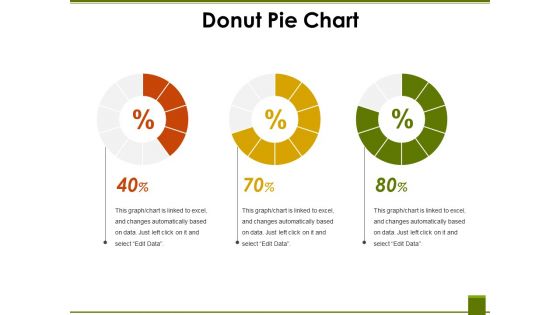
Donut Pie Chart Ppt PowerPoint Presentation File Mockup
This is a donut pie chart ppt powerpoint presentation file mockup. This is a three stage process. The stages in this process are finance, business, percentage, marketing.
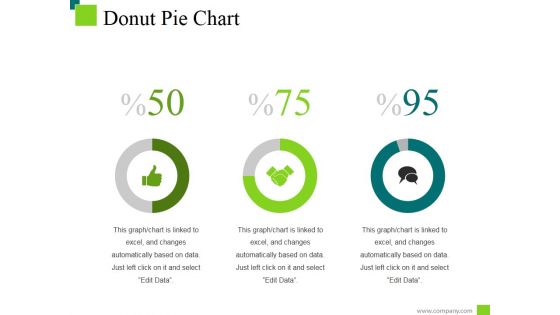
Donut Pie Chart Ppt PowerPoint Presentation Inspiration Deck
This is a donut pie chart ppt powerpoint presentation inspiration deck. This is a three stage process. The stages in this process are percentage, finance, donut, business.

Radar Chart Ppt PowerPoint Presentation Summary Slide Portrait
This is a radar chart ppt powerpoint presentation summary slide portrait. This is a two stage process. The stages in this process are product, business, marketing, finance.
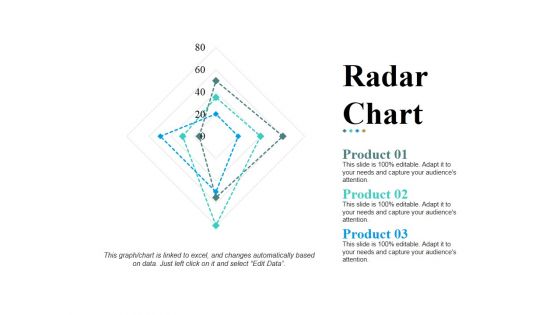
Radar Chart Ppt PowerPoint Presentation Pictures Design Templates
This is a radar chart ppt powerpoint presentation pictures design templates. This is a three stage process. The stages in this process are product, shapes, business, marketing, management.
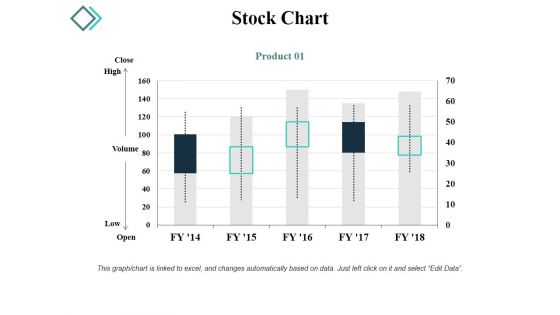
Stock Chart Ppt PowerPoint Presentation Gallery Graphic Images
This is a stock chart ppt powerpoint presentation gallery graphic images. This is a five stage process. The stages in this process are close, high, volume, low, open.
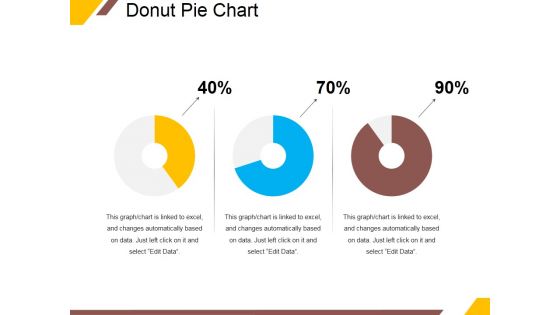
Donut Pie Chart Ppt PowerPoint Presentation Ideas Portrait
This is a donut pie chart ppt powerpoint presentation ideas portrait. This is a three stage process. The stages in this process are percentage, finance, donut, business.
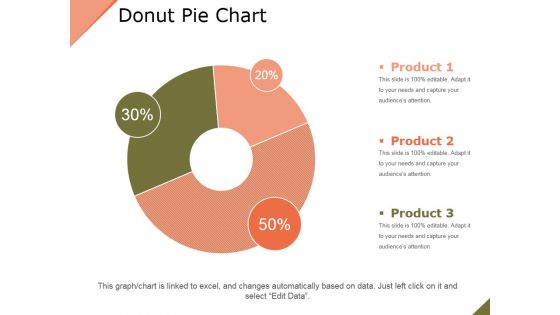
Donut Pie Chart Ppt PowerPoint Presentation Layouts Outfit
This is a donut pie chart ppt powerpoint presentation layouts outfit. This is a three stage process. The stages in this process are product, business, percentage, finance, marketing.

Scatter Chart Ppt PowerPoint Presentation Infographic Template Objects
This is a scatter chart ppt powerpoint presentation infographic template objects. This is a nine stage process. The stages in this process are product, growth, success, graph.
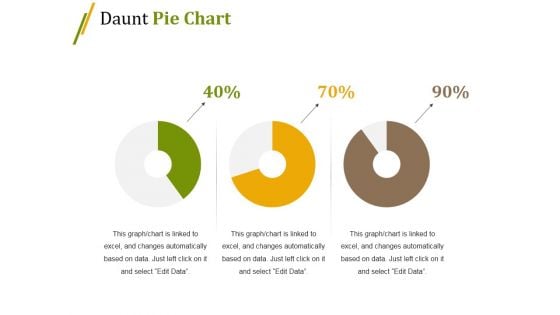
Daunt Pie Chart Ppt PowerPoint Presentation Show Gallery
This is a daunt pie chart ppt powerpoint presentation show gallery. This is a five stage process. The stages in this process are business, marketing, teamwork, communication, strategy.
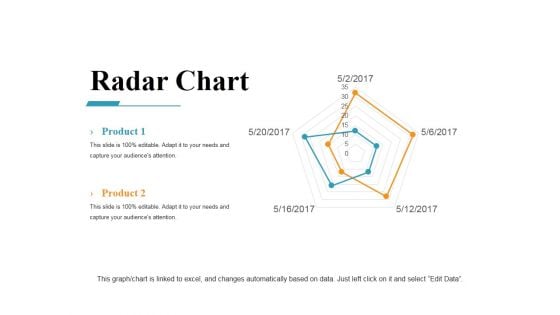
Radar Chart Ppt PowerPoint Presentation Ideas Master Slide
This is a radar chart ppt powerpoint presentation ideas master slide. This is a five stage process. The stages in this process are radar, business, marketing, strategy, finance.
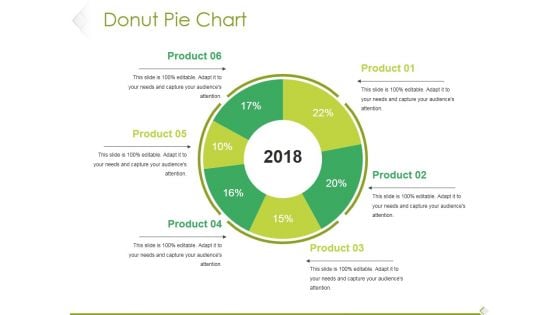
Donut Pie Chart Ppt PowerPoint Presentation Model Pictures
This is a donut pie chart ppt powerpoint presentation model pictures. This is a six stage process. The stages in this process are product, percentage, finance, year, business.
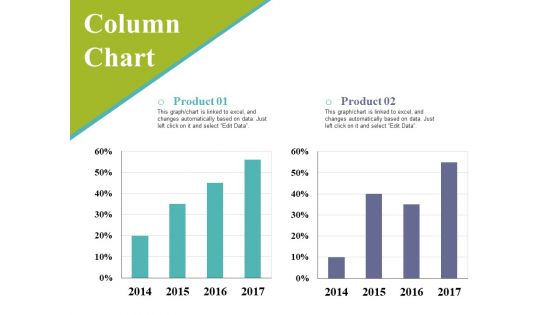
Column Chart Ppt PowerPoint Presentation Styles Background Image
This is a column chart ppt powerpoint presentation styles background image. This is a two stage process. The stages in this process are business, graph, percentage, marketing, strategy.
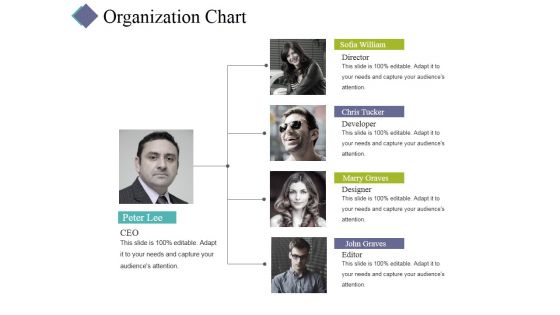
Organization Chart Ppt PowerPoint Presentation Infographic Template Gallery
This is a organization chart ppt powerpoint presentation infographic template gallery. This is a four stage process. The stages in this process are ceo, director, developer, designer, editor.
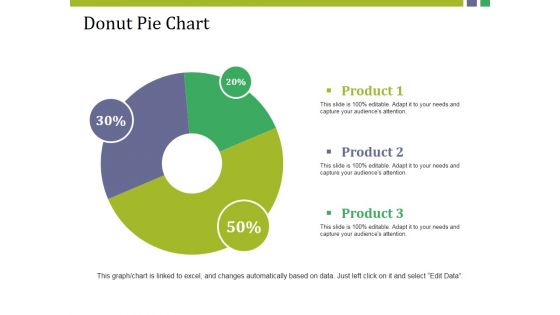
Donut Pie Chart Ppt PowerPoint Presentation Model Show
This is a donut pie chart ppt powerpoint presentation model show. This is a three stage process. The stages in this process are product, donut, percentage, finance, business.
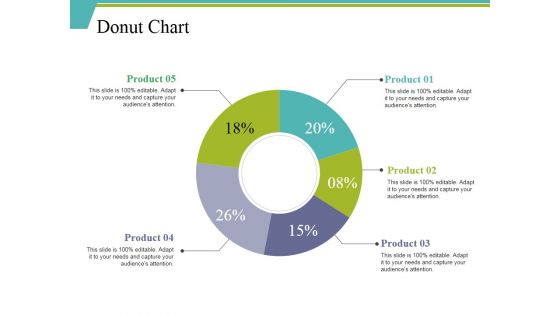
Donut Chart Ppt PowerPoint Presentation Ideas Background Designs
This is a donut chart ppt powerpoint presentation ideas background designs. This is a five stage process. The stages in this process are percentage, finance, donut, business, product.
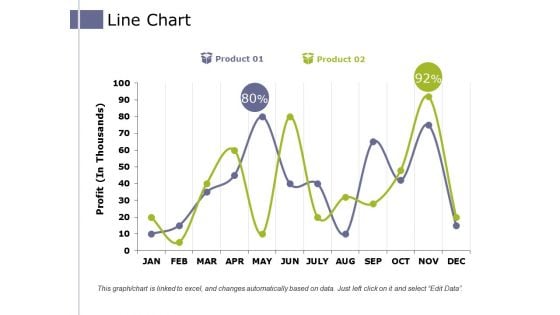
Line Chart Ppt PowerPoint Presentation Pictures Example Introduction
This is a line chart ppt powerpoint presentation pictures example introduction. This is a two stage process. The stages in this process are product, profit, business, growth, success.
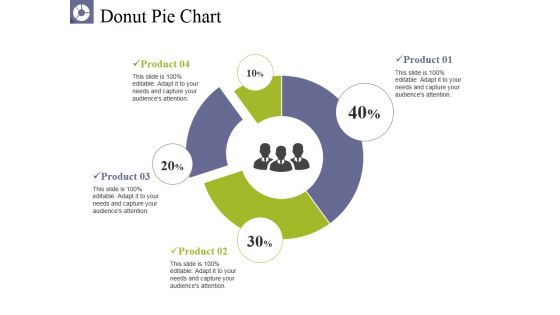
Donut Pie Chart Ppt PowerPoint Presentation Pictures Graphics
This is a donut pie chart ppt powerpoint presentation pictures graphics. This is a four stage process. The stages in this process are product, business, percentage, donut, finance.
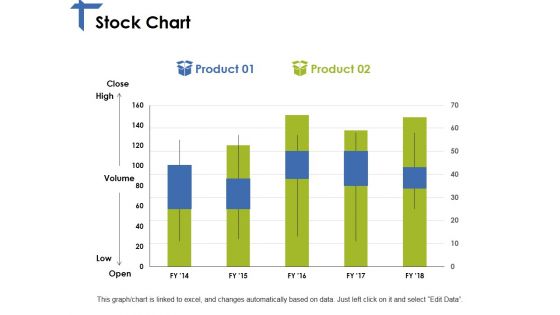
Stock Chart Ppt PowerPoint Presentation Slides Graphics Pictures
This is a stock chart ppt powerpoint presentation slides graphics pictures. This is a two stage process. The stages in this process are product, high, volume, low, open.
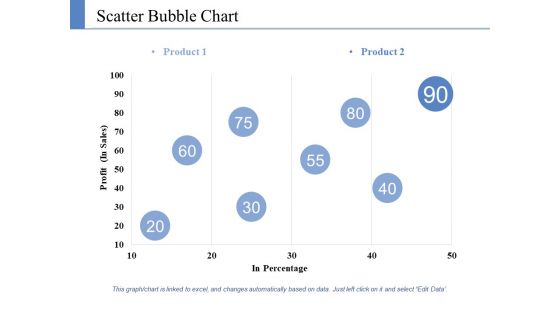
Scatter Bubble Chart Ppt PowerPoint Presentation Styles Information
This is a scatter bubble chart ppt powerpoint presentation styles information. This is a two stage process. The stages in this process are product, profit, in percentage.
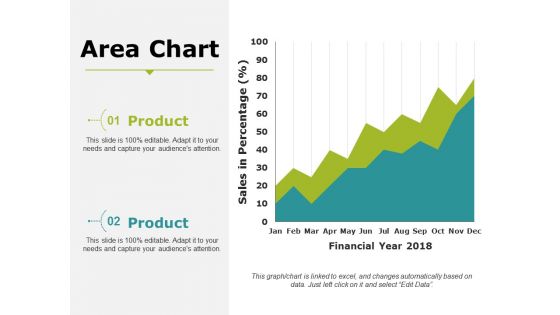
Area Chart Ppt PowerPoint Presentation Infographic Template Portrait
This is a area chart ppt powerpoint presentation infographic template portrait. This is a two stage process. The stages in this process are business, marketing, strategy, planning, finance.
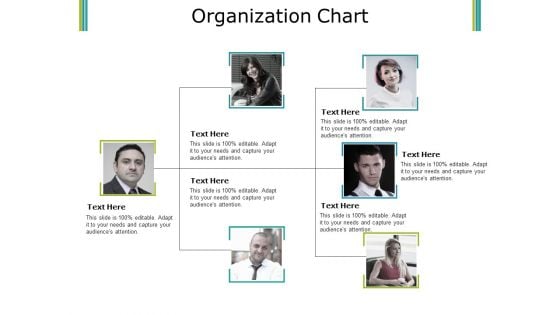
Organization Chart Ppt PowerPoint Presentation Ideas Graphics Download
This is a organization chart ppt powerpoint presentation ideas graphics download. This is a three stage process. The stages in this process are hierarchy, step, teamwork, communication, business.
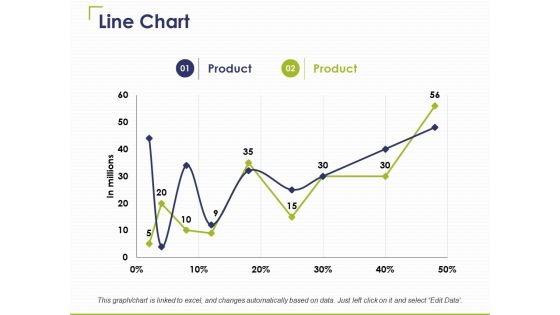
Line Chart Ppt PowerPoint Presentation Inspiration Slide Download
This is a line chart ppt powerpoint presentation inspiration slide download. This is a two stage process. The stages in this process are product, in millions, business, marketing.
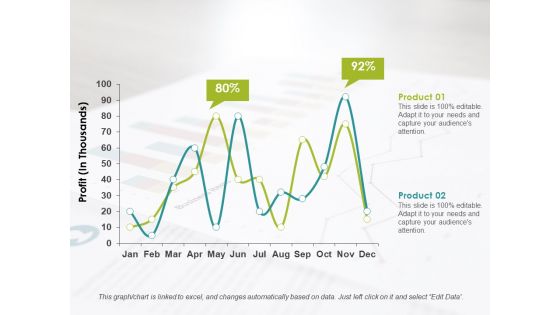
Line Chart Ppt PowerPoint Presentation Infographics Format Ideas
This is a line chart ppt powerpoint presentation infographics format ideas. This is a two stage process. The stages in this process are product, profit, business.
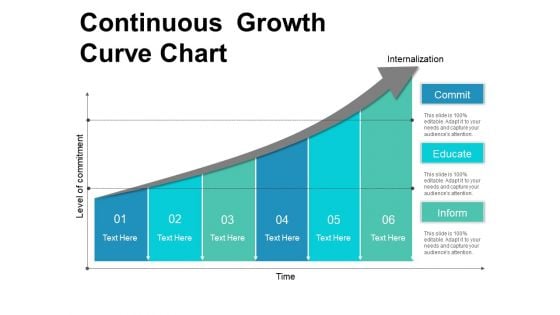
Continuous Growth Curve Chart Ppt PowerPoint Presentation Inspiration Slideshow
This is a continuous growth curve chart ppt powerpoint presentation inspiration slideshow. This is a six stage process. The stages in this process are circular, continuity, continuum.

Eight Stages Sequential Function Chart Ppt PowerPoint Presentation Slides Graphics
This is a eight stages sequential function chart ppt powerpoint presentation slides graphics. This is a eight stage process. The stages in this process are circular, continuity, continuum.
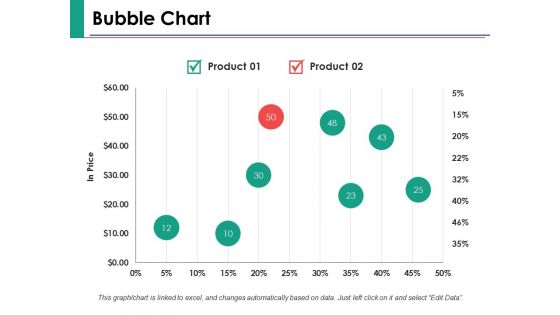
Bubble Chart Finance Ppt PowerPoint Presentation Ideas Graphics
This is a bubble chart finance ppt powerpoint presentation ideas graphics. This is a two stage process. The stages in this process are finance, marketing, management, investment, analysis.
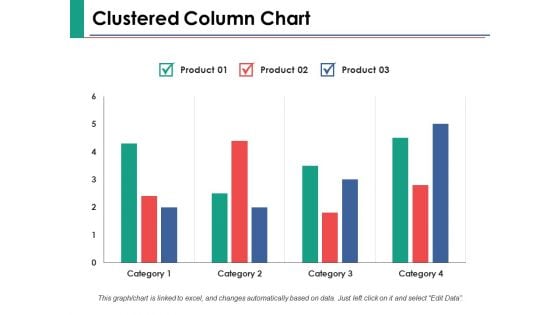
Clustered Column Chart Ppt PowerPoint Presentation Show Samples
This is a clustered column chart ppt powerpoint presentation show samples. This is a three stage process. The stages in this process are finance, marketing, management, investment, analysis.
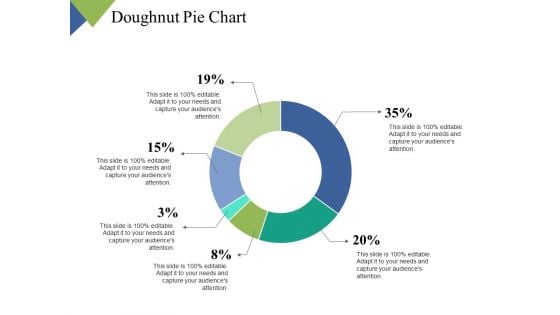
Doughnut Pie Chart Ppt PowerPoint Presentation Model Skills
This is a doughnut pie chart ppt powerpoint presentation model skills. This is a six stage process. The stages in this process are business, management, planning, strategy, marketing.
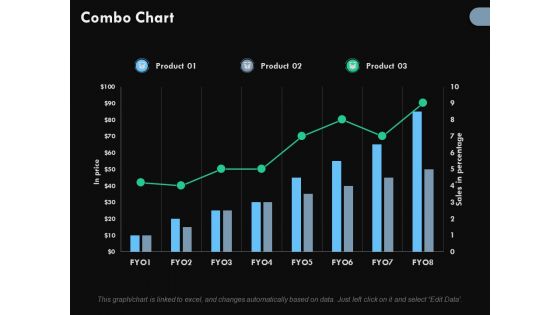
Combo Chart Ppt PowerPoint Presentation Infographic Template Maker
This is a combo chart ppt powerpoint presentation infographic template maker. This is a three stage process. The stages in this process are business, finance, growth, investment, marketing.
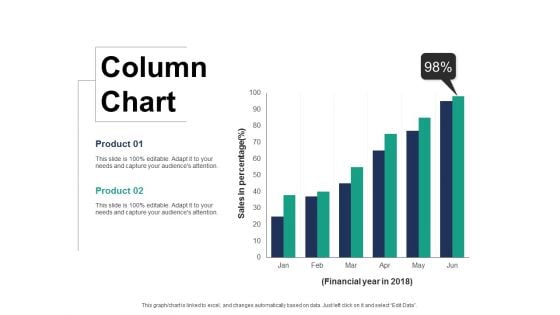
Column Chart Finance Ppt PowerPoint Presentation Layouts Display
This is a column chart finance ppt powerpoint presentation layouts display. This is a two stage process. The stages in this process are finance, marketing, management, investment, analysis.
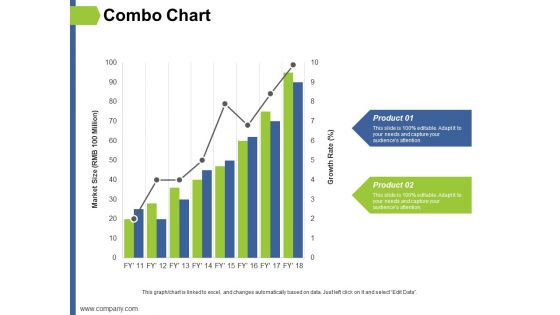
Combo Chart Ppt PowerPoint Presentation Layouts Example Topics
This is a combo chart ppt powerpoint presentation layouts example topics. This is a two stage process. The stages in this process are finance, marketing, management, investment, analysis.
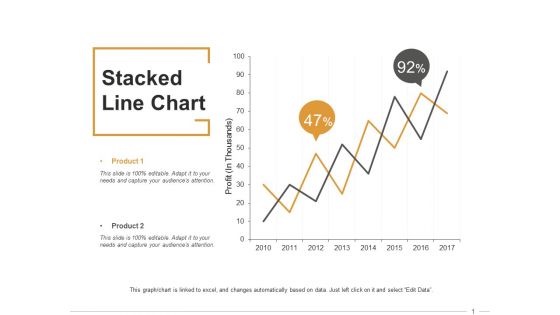
Stacked Line Chart Ppt PowerPoint Presentation Inspiration Format
This is a stacked line chart ppt powerpoint presentation inspiration format. This is a two stage process. The stages in this process are finance, marketing, management, investment, analysis.
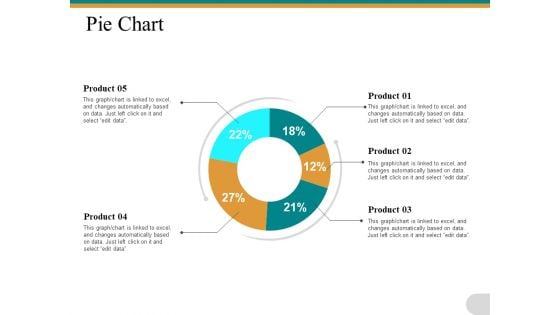
Pie Chart Ppt PowerPoint Presentation File Slide Download
This is a pie chart ppt powerpoint presentation file slide download. This is a five stage process. The stages in this process are business, management, strategy, analysis, planning.
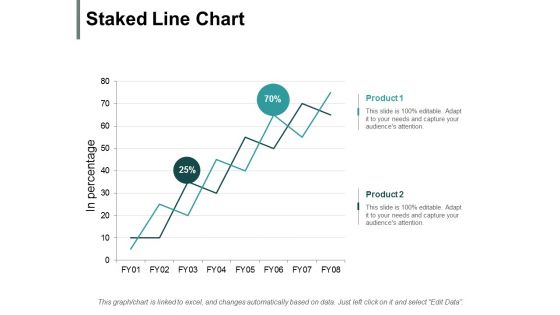
Staked Line Chart Ppt PowerPoint Presentation Ideas Influencers
This is a staked line chart ppt powerpoint presentation ideas influencers. This is a two stage process. The stages in this process are finance, marketing, management, investment, analysis.
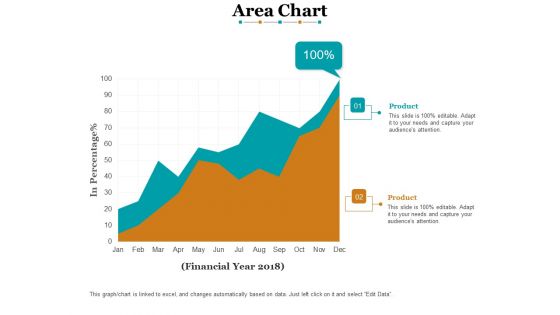
Area Chart Finance Ppt PowerPoint Presentation Model Ideas
This is a area chart finance ppt powerpoint presentation model ideas. This is a two stage process. The stages in this process are finance, marketing, analysis, business, investment.
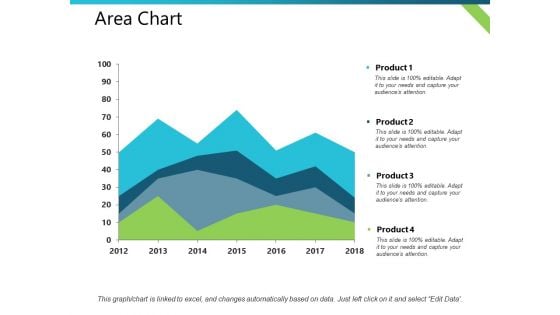
Area Chart Product Finance Ppt PowerPoint Presentation Guide
This is a area chart product finance ppt powerpoint presentation guide. This is a four stage process. The stages in this process are business, management, financial, marketing, sales.
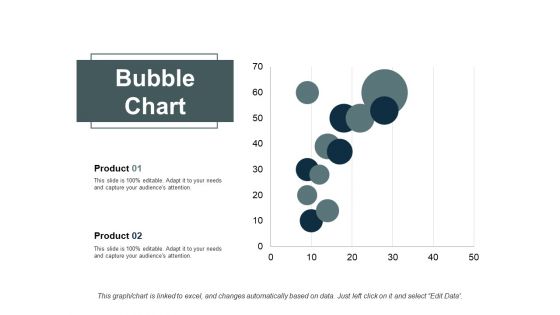
Bubble Chart Finance Ppt PowerPoint Presentation Slides Show
This is a bubble chart finance ppt powerpoint presentation slides show. This is a two stage process. The stages in this process are finance, marketing, analysis, business, investment.
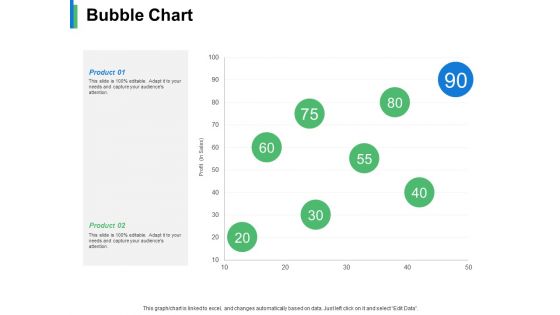
Bubble Chart Product Ppt PowerPoint Presentation Infographics Backgrounds
This is a bubble chart product ppt powerpoint presentation infographics backgrounds. This is a two stage process. The stages in this process are business, management, strategy, marketing, sales.
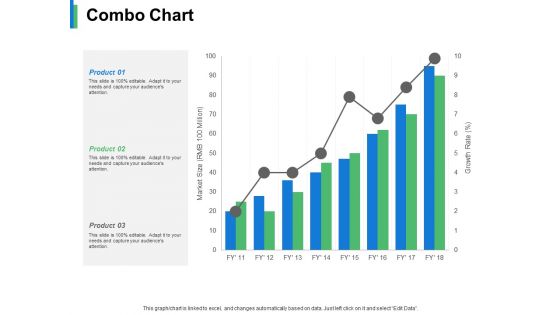
Combo Chart Product Ppt PowerPoint Presentation Slides Aids
This is a combo chart product ppt powerpoint presentation slides aids. This is a three stage process. The stages in this process are business, management, marketing, strategy, sales.
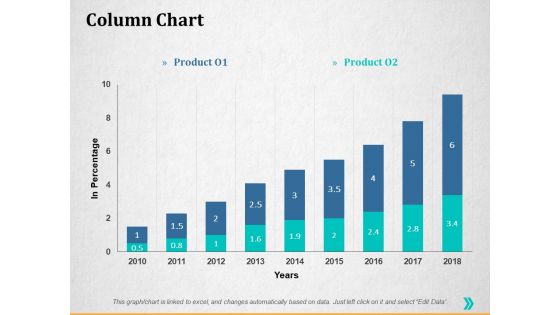
Column Chart Ppt PowerPoint Presentation Infographics Graphics Template
This is a column chart ppt powerpoint presentation infographics graphics template. This is a two stage process. The stages in this process are percentage, product, business, management, marketing.
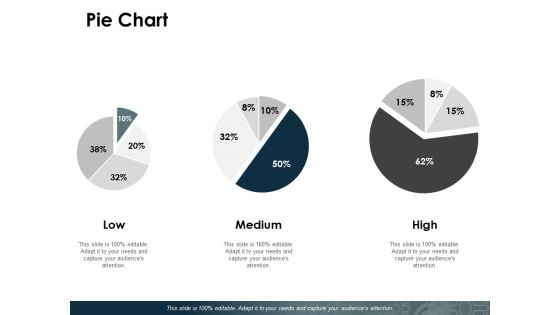
Pie Chart Ppt PowerPoint Presentation Infographic Template Topics
This is a pie chart ppt powerpoint presentation infographic template topics. This is a three stage process. The stages in this process are percentage, management, marketing, business.
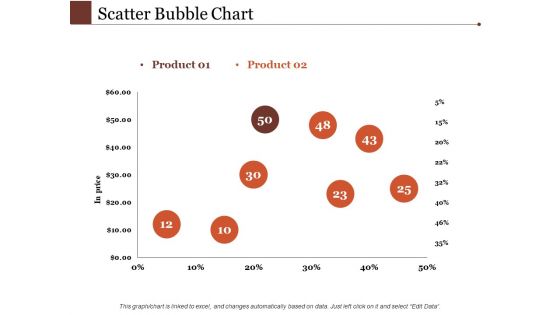
Scatter Bubble Chart Ppt PowerPoint Presentation Inspiration Demonstration
This is a scatter bubble chart ppt powerpoint presentation inspiration demonstration. This is a two stage process. The stages in this process are percentage, product, business, management, marketing.
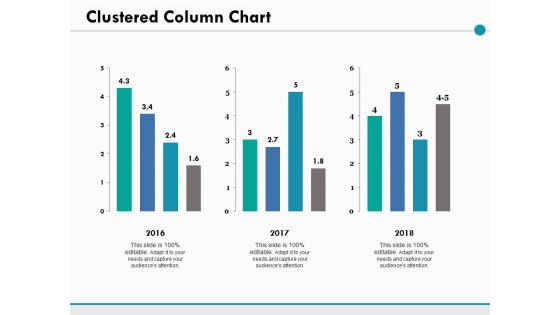
Clustered Column Chart Ppt PowerPoint Presentation Ideas Picture
This is a clustered column chart ppt powerpoint presentation ideas picture. This is a three stage process. The stages in this process are percentage, product, management, marketing.
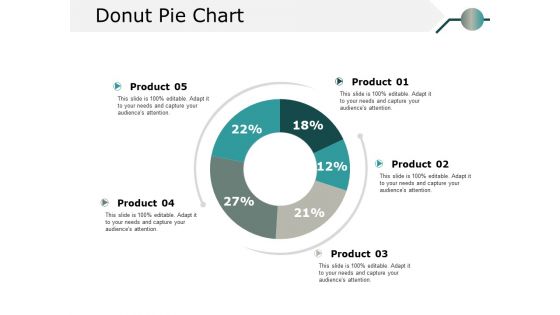
Donut Pie Chart Ppt PowerPoint Presentation Model Information
This is a donut pie chart ppt powerpoint presentation model information. This is a five stage process. The stages in this process are percentage, product, business.
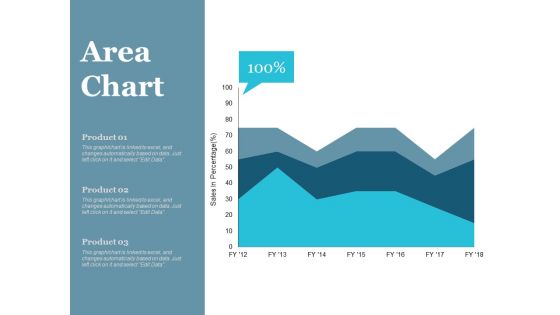
Area Chart Finance Ppt PowerPoint Presentation Infographics Deck
This is a area chart finance ppt powerpoint presentation infographics deck. This is a three stage process. The stages in this process are finance, marketing, management, investment, analysis.
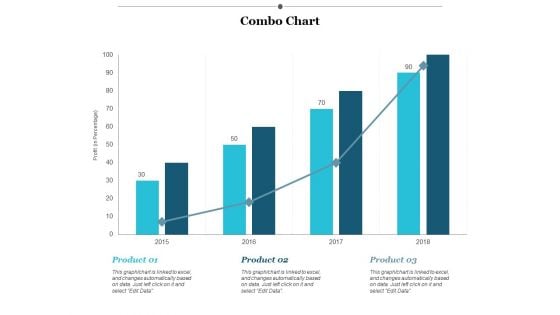
Combo Chart Finance Ppt PowerPoint Presentation Styles Example
This is a combo chart finance ppt powerpoint presentation styles example. This is a three stage process. The stages in this process are finance, marketing, management, investment, analysis.
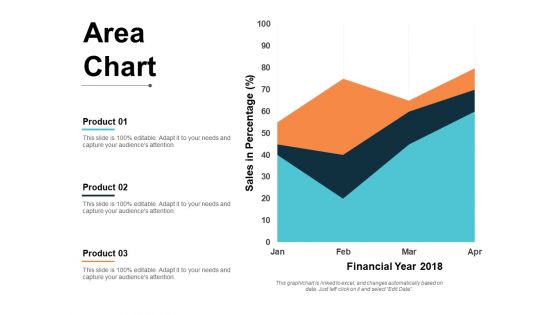
area chart finance ppt powerpoint presentation pictures format
This is a area chart finance ppt powerpoint presentation pictures format. This is a three stage process. The stages in this process are finance, marketing, management, investment, analysis.
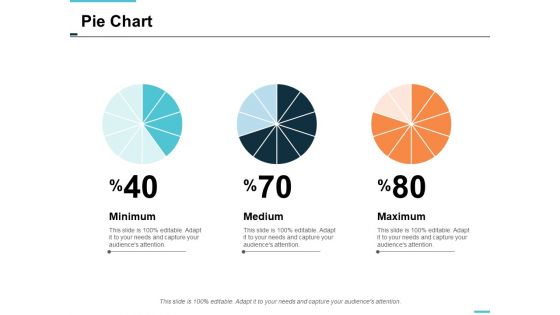
pie chart finance ppt powerpoint presentation styles skills
This is a pie chart finance ppt powerpoint presentation styles skills. This is a three stage process. The stages in this process are finance, marketing, management, investment, analysis.
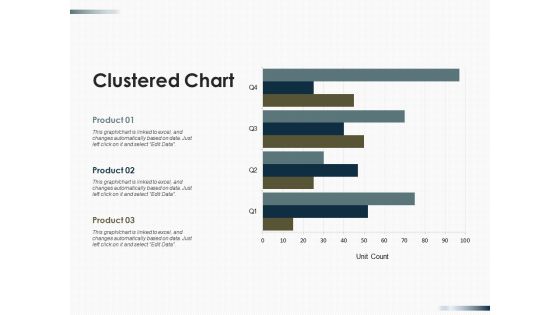
Clustered Chart Finance Ppt PowerPoint Presentation Summary Guide
This is a clustered chart finance ppt powerpoint presentation summary guide. This is a three stage process. The stages in this process are finance, marketing, management, investment, analysis.

Combo Chart Finance Ppt PowerPoint Presentation Portfolio Guidelines
This is a combo chart finance ppt powerpoint presentation portfolio guidelines. This is a three stage process. The stages in this process are finance, marketing, management, investment, analysis.
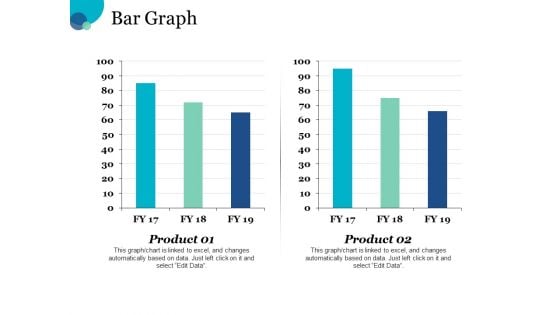
Bar Graph Chart Ppt PowerPoint Presentation Portfolio Templates
This is a bar graph chart ppt powerpoint presentation portfolio templates. This is a two stage process. The stages in this process are financial, minimum, medium, maximum.
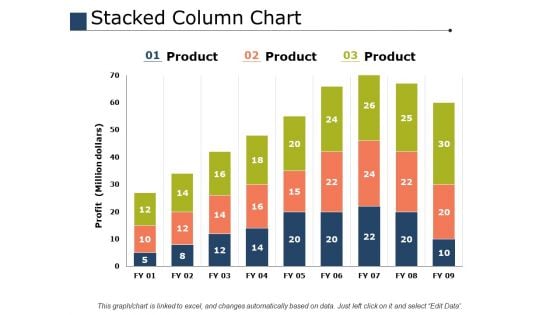
Stacked Column Chart Ppt PowerPoint Presentation Slides Files
This is a stacked column chart ppt powerpoint presentation slides files. This is a three stage process. The stages in this process are percentage, product, business, marketing.
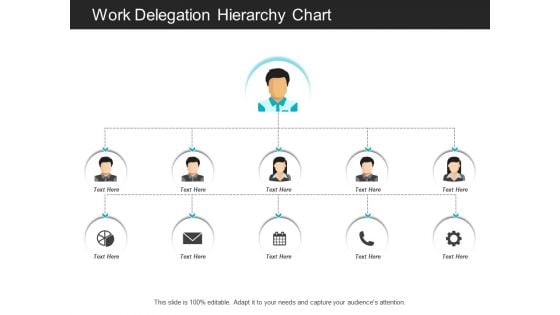
Work Delegation Hierarchy Chart Ppt PowerPoint Presentation File Graphic Images
This is a work delegation hierarchy chart ppt powerpoint presentation file graphic images. This is a five stage process. The stages in this process are delegation, deputation, delegacy.
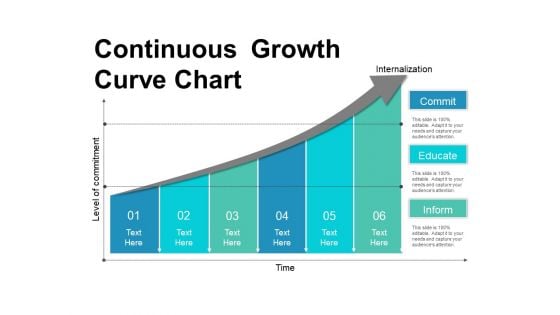
Continuous Growth Curve Chart Ppt PowerPoint Presentation Inspiration Portrait
This is a continuous growth curve chart ppt powerpoint presentation inspiration portrait. This is a six stage process. The stages in this process are circular, continuity, continuum.
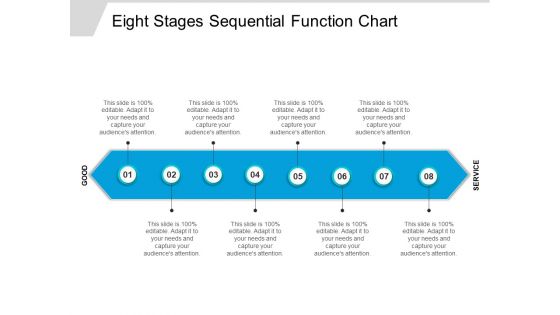
Eight Stages Sequential Function Chart Ppt PowerPoint Presentation Professional Maker
This is a eight stages sequential function chart ppt powerpoint presentation professional maker. This is a eight stage process. The stages in this process are circular, continuity, continuum.
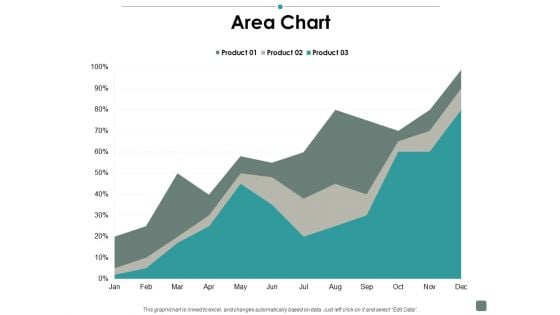
Area Chart Contribution Ppt PowerPoint Presentation Gallery Structure
This is a area chart contribution ppt powerpoint presentation gallery structure. This is a three stage process. The stages in this process are business, management, strategy, analysis, marketing.
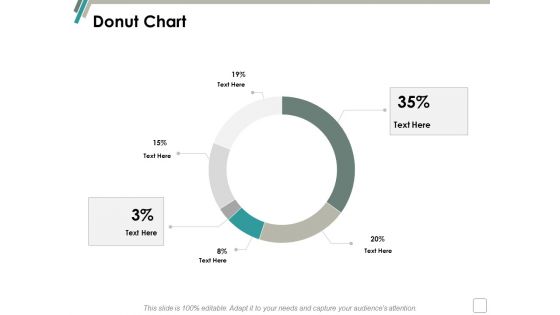
Donut Chart Management Ppt Powerpoint Presentation Slides Aids
This is a donut chart management ppt powerpoint presentation slides aids. This is a six stage process. The stages in this process are finance, marketing, management, investment, analysis.
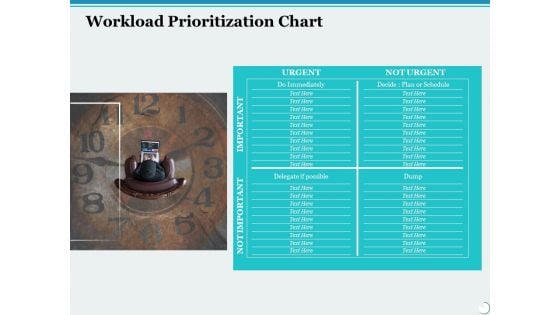
Workload Prioritization Chart Ppt PowerPoint Presentation Infographic Template Images
This is a workload prioritization chart ppt powerpoint presentation infographic template images. This is a four stage process. The stages in this process are business, management, marketing.
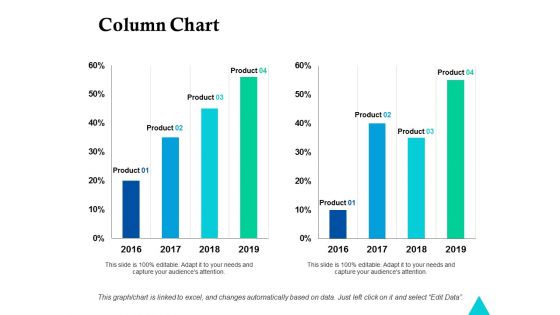
Column Chart Finance Ppt Powerpoint Presentation Summary Visuals
This is a column chart finance ppt powerpoint presentation summary visuals. This is a four stage process. The stages in this process are finance, marketing, management, investment, analysis.

area chart finance ppt powerpoint presentation layouts ideas
This is a area chart finance ppt powerpoint presentation layouts ideas. This is a three stage process. The stages in this process are finance, marketing, management, investment, analysis.
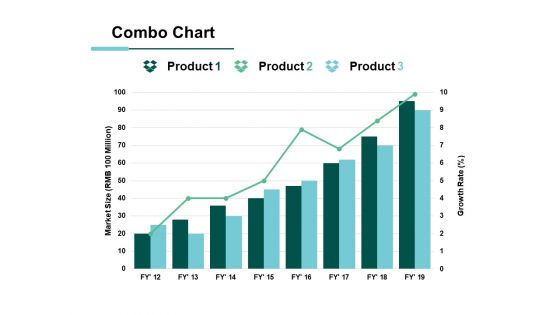
Combo Chart Product Ppt PowerPoint Presentation Ideas Styles
This is a combo chart product ppt powerpoint presentation ideas styles. This is a three stage process. The stages in this process are business, management, marketing, percentage, product.
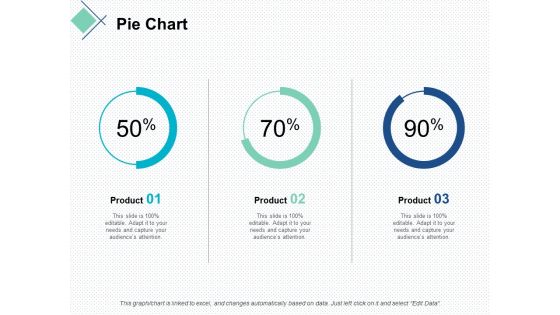
pie chart finance marketing ppt powerpoint presentation slides demonstration
This is a pie chart finance marketing ppt powerpoint presentation slides demonstration. This is a stage process. The stages in this process are finance, marketing, management, investment, analysis.
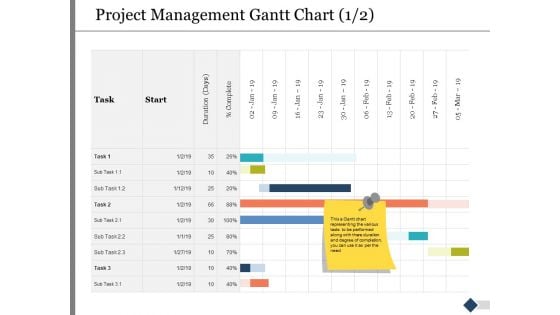
Project Management Gantt Chart Ppt PowerPoint Presentation Summary Images
This is a project management gantt chart ppt powerpoint presentation summary images. This is a two stage process. The stages in this process are marketing, business, management, compare.
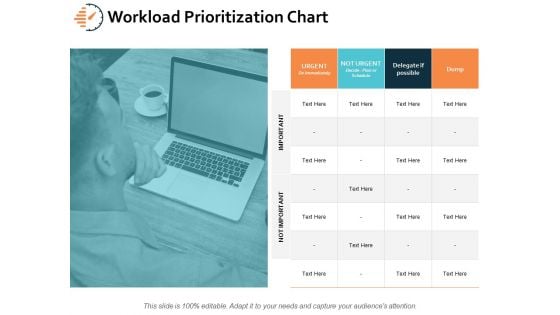
Workload Prioritization Chart Ppt PowerPoint Presentation Styles Designs
This is a workload prioritization chart ppt powerpoint presentation styles designs. This is a four stage process. The stages in this process are technology, business, planning, marketing, knowledge.
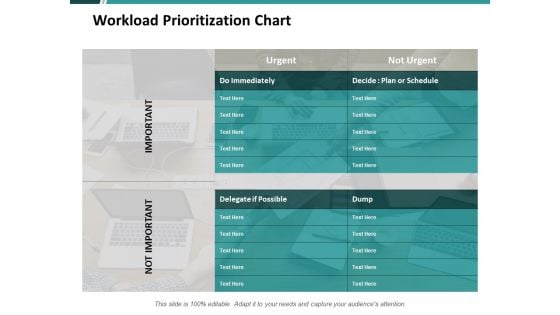
Workload Prioritization Chart Ppt PowerPoint Presentation Pictures Show
This is a workload prioritization chart ppt powerpoint presentation pictures show. This is a two stage process. The stages in this process are compare, marketing, business, management, planning.
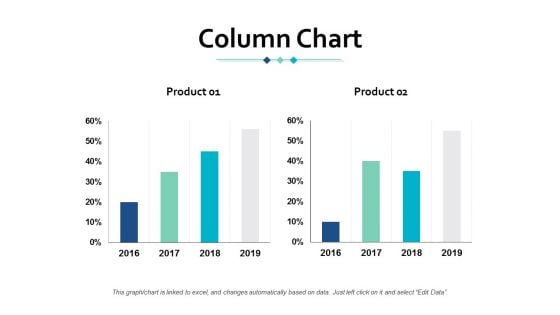
Column Chart Finance Ppt Powerpoint Presentation Gallery Maker
This is a column chart finance ppt powerpoint presentation gallery maker. This is a two stage process. The stages in this process are finance, marketing, management, investment, analysis.
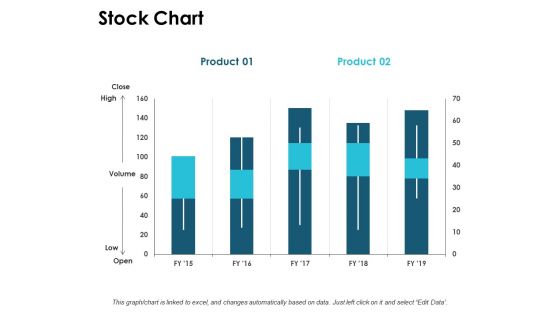
Stock Chart Graph Ppt PowerPoint Presentation Ideas Demonstration
This is a stock chart graph ppt powerpoint presentation ideas demonstration. This is a three stage process. The stages in this process are finance, marketing, management, investment, analysis.
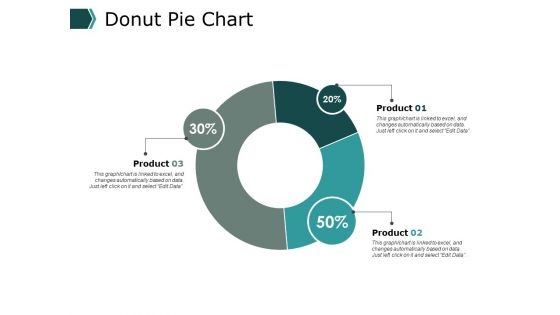
Donut Pie Chart Ppt PowerPoint Presentation Model Deck
This is a donut pie chart ppt powerpoint presentation model deck. This is a three stage process. The stages in this process are finance, marketing, management, investment, analysis.

Stacked Column Chart Ppt PowerPoint Presentation Professional Show
This is a stacked column chart ppt powerpoint presentation professional show. This is a three stage process. The stages in this process are business, management, marketing, growth.
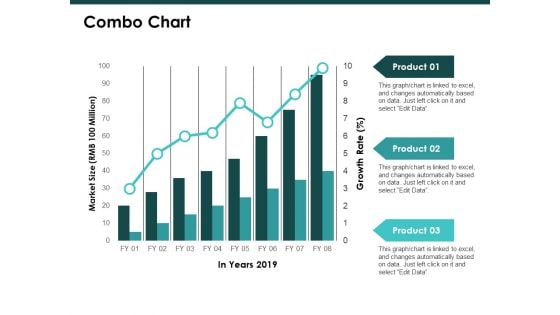
Combo Chart Graph Ppt PowerPoint Presentation Inspiration Template
This is a combo chart graph ppt powerpoint presentation inspiration template. This is a three stage process. The stages in this process are finance, marketing, management, investment, analysis.
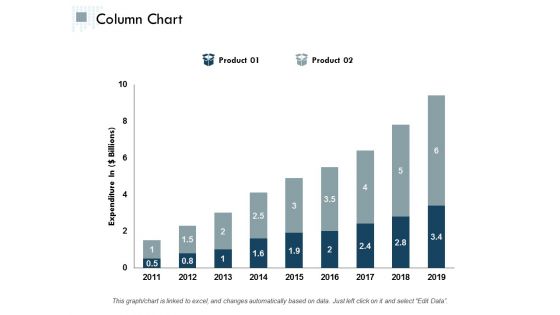
Column Chart Finance Ppt Powerpoint Presentation Styles Examples
This is a column chart finance ppt powerpoint presentation styles examples. This is a two stage process. The stages in this process are finance, marketing, management, investment, analysis.
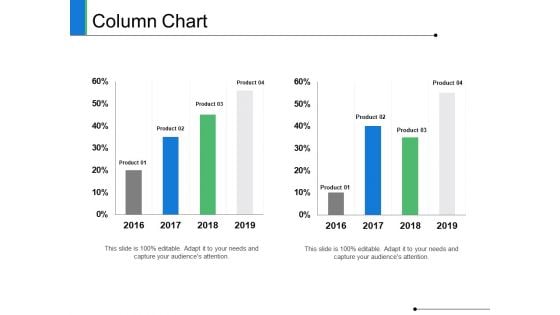
Column Chart Finance Ppt PowerPoint Presentation Summary Grid
This is a column chart finance ppt powerpoint presentation summary grid. This is a three stage process. The stages in this process are finance, marketing, management, investment, analysis.
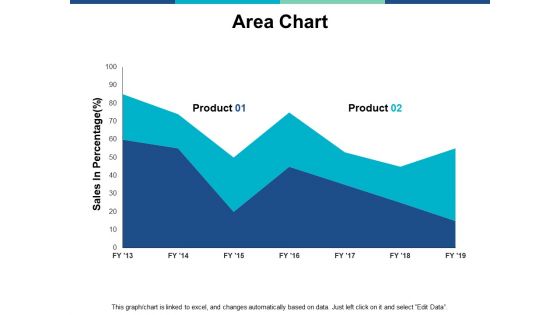
Area Chart Finance Ppt PowerPoint Presentation Summary Structure
This is a area chart finance ppt powerpoint presentation summary structure. This is a two stage process. The stages in this process are finance, marketing, management, investment, analysis.
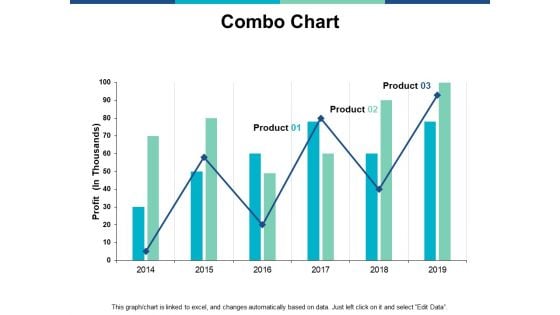
Combo Chart Graph Ppt PowerPoint Presentation Infographics Guide
This is a combo chart graph ppt powerpoint presentation infographics guide. This is a two stage process. The stages in this process are marketing, business, management, planning, strategy.
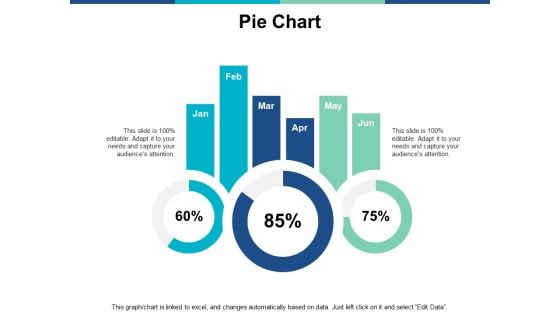
Pie Chart Finance Ppt PowerPoint Presentation Ideas Templates
This is a pie chart finance ppt powerpoint presentation ideas templates. This is a three stage process. The stages in this process are finance, marketing, management, investment, analysis.
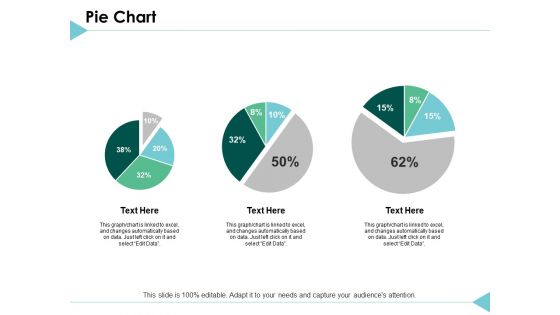
Pie Chart Finance Ppt PowerPoint Presentation Styles Templates
This is a pie chart finance ppt powerpoint presentation styles templates. This is a three stage process. The stages in this process are finance, marketing, analysis, investment, million.
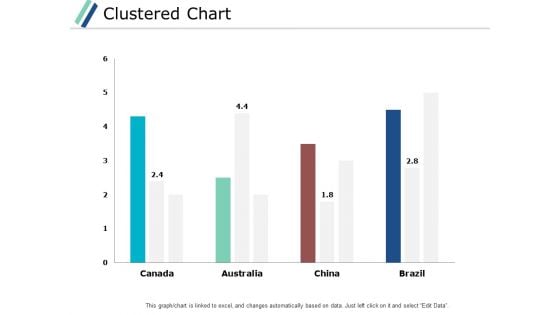
Clustered Chart Graph Ppt PowerPoint Presentation Gallery Backgrounds
This is a clustered chart graph ppt powerpoint presentation gallery backgrounds. This is a three stage process. The stages in this process are finance, marketing, analysis, investment, million.
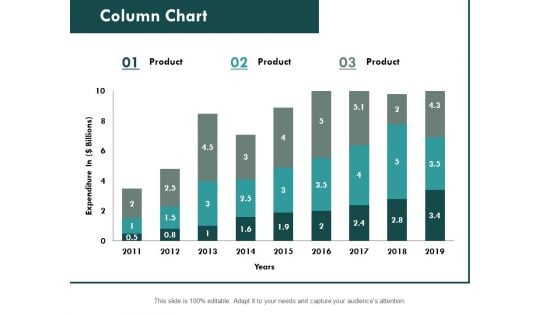
Column Chart Graph Ppt PowerPoint Presentation Slides File Formats
This is a combo chart bar ppt powerpoint presentation slides portfolio. This is a three stage process. The stages in this process are finance, marketing, analysis, investment, million.
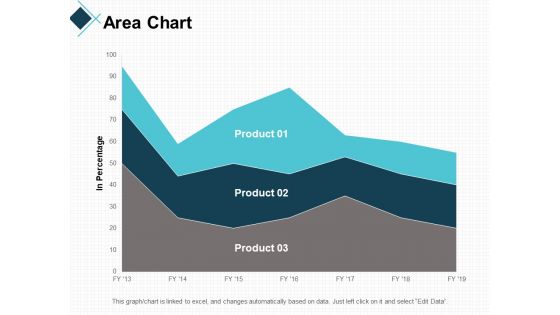
Area Chart Finance Ppt PowerPoint Presentation Gallery Information
This is a area chart finance ppt powerpoint presentation gallery information. This is a three stage process. The stages in this process are finance, marketing, analysis, investment, million.
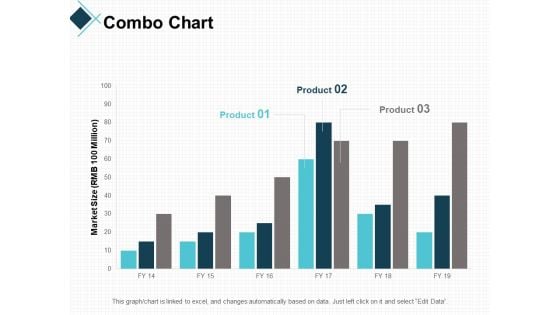
Combo Chart Graph Ppt PowerPoint Presentation Professional Guidelines
This is a combo chart graph ppt powerpoint presentation professional guidelines. This is a three stage process. The stages in this process are finance, marketing, analysis, investment, million.
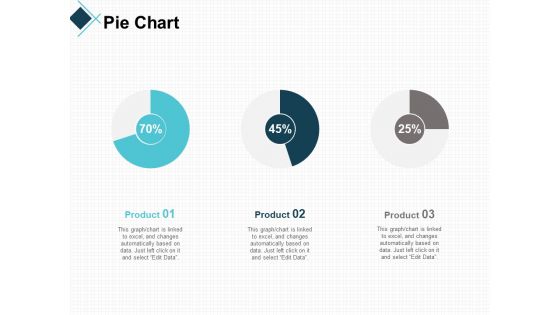
Pie Chart Bar Ppt PowerPoint Presentation Layouts Examples
This is a pie chart bar ppt powerpoint presentation layouts examples. This is a three stage process. The stages in this process are finance, marketing, analysis, investment, million.
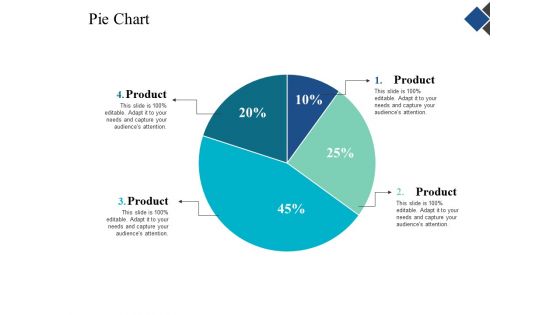
Pie Chart Finance Ppt Powerpoint Presentation Gallery Templates
This is a pie chart finance ppt powerpoint presentation gallery templates. This is a four stage process. The stages in this process are finance, marketing, management, investment, analysis.
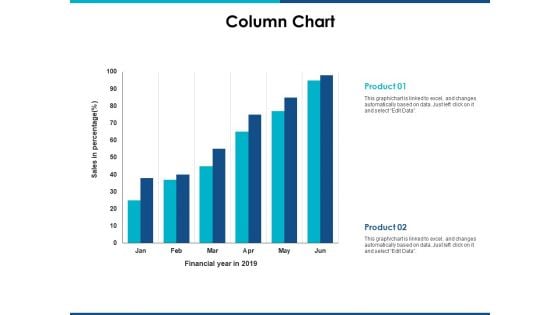
Column Chart Finance Ppt Powerpoint Presentation Inspiration Images
This is a column chart finance ppt powerpoint presentation inspiration images. This is a two stage process. The stages in this process are finance, marketing, management, investment, analysis.
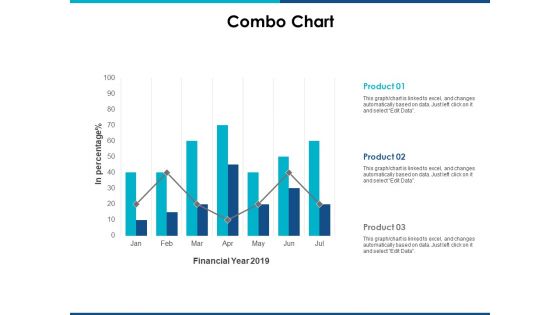
Combo Chart Finance Ppt Powerpoint Presentation Ideas Slides
This is a combo chart finance ppt powerpoint presentation ideas slides. This is a three stage process. The stages in this process are finance, marketing, management, investment, analysis.
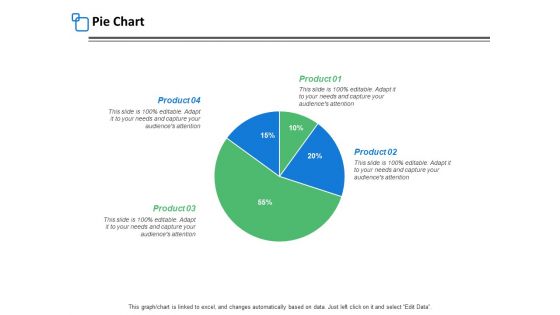
Pie Chart Finance Ppt PowerPoint Presentation Inspiration Templates
This is a pie chart finance ppt powerpoint presentation inspiration templates. This is a four stage process. The stages in this process are finance, marketing, management, investment, analysis.
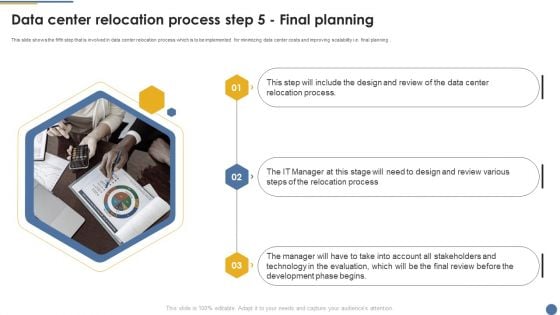
Assessment And Workflow Data Center Relocation Process Step 5 Final Planning Diagrams PDF
This slide shows the fifth step that is involved in data center relocation process which is to be implemented for minimizing data center costs and improving scalability i.e. final planning. Do you have an important presentation coming up Are you looking for something that will make your presentation stand out from the rest Look no further than Assessment And Workflow Data Center Relocation Process Step 5 Final Planning Diagrams PDF. With our professional designs, you can trust that your presentation will pop and make delivering it a smooth process. And with Slidegeeks, you can trust that your presentation will be unique and memorable. So why wait Grab Assessment And Workflow Data Center Relocation Process Step 5 Final Planning Diagrams PDF today and make your presentation stand out from the rest.
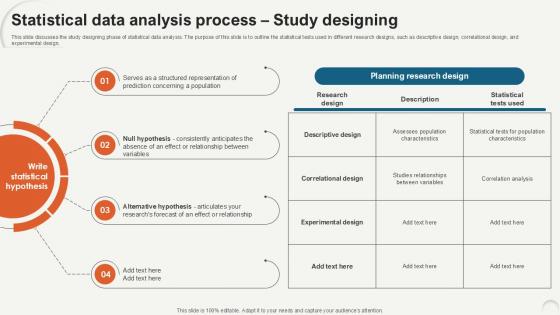
Statistical Data Analysis Process Study Designing Ppt Presentation
This slide discusses the study designing phase of statistical data analysis. The purpose of this slide is to outline the statistical tests used in different research designs, such as descriptive design, correlational design, and experimental design. Do you have to make sure that everyone on your team knows about any specific topic I yes, then you should give Statistical Data Analysis Process Study Designing Ppt Presentation a try. Our experts have put a lot of knowledge and effort into creating this impeccable Statistical Data Analysis Process Study Designing Ppt Presentation. You can use this template for your upcoming presentations, as the slides are perfect to represent even the tiniest detail. You can download these templates from the Slidegeeks website and these are easy to edit. So grab these today This slide discusses the study designing phase of statistical data analysis. The purpose of this slide is to outline the statistical tests used in different research designs, such as descriptive design, correlational design, and experimental design.
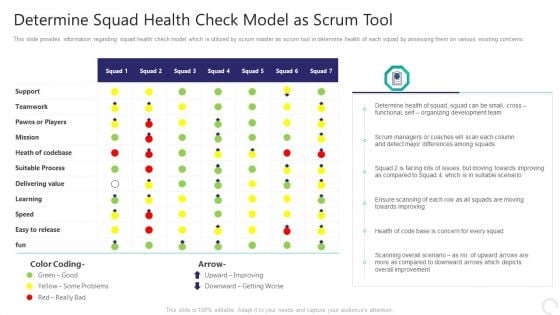
Determine Squad Health Check Model As Scrum Tool Themes PDF
Deliver and pitch your topic in the best possible manner with this determine squad health check model as scrum tool themes pdf. Use them to share invaluable insights on teamwork, suitable process, overall improvement and impress your audience. This template can be altered and modified as per your expectations. So, grab it now.
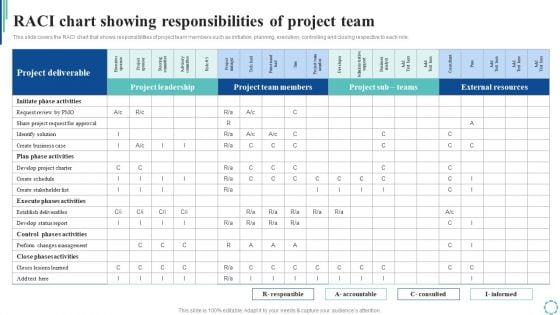
Raci Chart Showing Responsibilities Of Project Team Strategies To Enhance Project Lifecycle Designs PDF
This slide covers the RACI chart that shows responsibilities of project team members such as initiation, planning, execution, controlling and closing respective to each role.Whether you have daily or monthly meetings, a brilliant presentation is necessary. Raci Chart Showing Responsibilities Of Project Team Strategies To Enhance Project Lifecycle Designs PDF can be your best option for delivering a presentation. Represent everything in detail using Raci Chart Showing Responsibilities Of Project Team Strategies To Enhance Project Lifecycle Designs PDF and make yourself stand out in meetings. The template is versatile and follows a structure that will cater to your requirements. All the templates prepared by Slidegeeks are easy to download and edit. Our research experts have taken care of the corporate themes as well. So, give it a try and see the results.
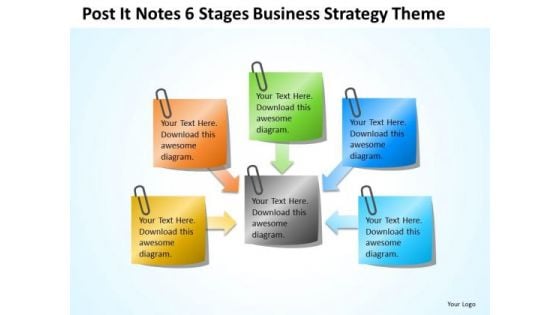
Notes 6 Stages Company Business Strategy Theme Ppt Plan PowerPoint Slides
We present our notes 6 stages company business strategy theme ppt plan PowerPoint Slides.Download our Advertising PowerPoint Templates because Our PowerPoint Templates and Slides help you pinpoint your timelines. Highlight the reasons for your deadlines with their use. Present our Competition PowerPoint Templates because You can Connect the dots. Fan expectations as the whole picture emerges. Download our Boxes PowerPoint Templates because Our PowerPoint Templates and Slides will definately Enhance the stature of your presentation. Adorn the beauty of your thoughts with their colourful backgrounds. Present our Process and Flows PowerPoint Templates because Our PowerPoint Templates and Slides are the chords of your song. String them along and provide the lilt to your views. Present our Business PowerPoint Templates because It will Raise the bar of your Thoughts. They are programmed to take you to the next level.Use these PowerPoint slides for presentations relating to Chart, flow, organization, flowchart, box, vector, chain, information, 3d, network, isolated, program, business, blank, plan, concept, arrow, sign, teamwork, symbol, organisation, diagram, circle, graphic, process, workflow, technology, shape, management, graph, connection, solution, design, colorful, empty, procedure, connect, organize, background, work, structure, block. The prominent colors used in the PowerPoint template are Green, Blue, Yellow. Deserve the best with our Notes 6 Stages Company Business Strategy Theme Ppt Plan PowerPoint Slides. You will come out on top.
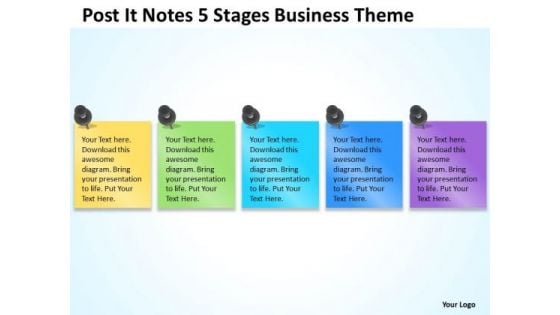
Post It Notes 5 Stages Business Theme Ppt Templates For Plans PowerPoint Slides
We present our post it notes 5 stages business theme ppt templates for plans PowerPoint Slides.Download and present our Advertising PowerPoint Templates because Our PowerPoint Templates and Slides are focused like a searchlight beam. They highlight your ideas for your target audience. Present our Competition PowerPoint Templates because You can Be the puppeteer with our PowerPoint Templates and Slides as your strings. Lead your team through the steps of your script. Present our Boxes PowerPoint Templates because Our PowerPoint Templates and Slides are topically designed to provide an attractive backdrop to any subject. Download our Process and Flows PowerPoint Templates because Our PowerPoint Templates and Slides are Clear and concise. Use them and dispel any doubts your team may have. Present our Business PowerPoint Templates because They will bring a lot to the table. Their alluring flavours will make your audience salivate.Use these PowerPoint slides for presentations relating to Chart, flow, organization, flowchart, box, vector, chain, information, 3d, network, isolated, program, business, blank, plan, concept, arrow, sign, teamwork, symbol, organisation, diagram, circle, graphic, process, workflow, technology, shape, management, graph, connection, solution, design, colorful, empty, procedure, connect, organize, background, work, structure, block. The prominent colors used in the PowerPoint template are Blue, Green, Yellow. Substantiate your exposition with our Post It Notes 5 Stages Business Theme Ppt Templates For Plans PowerPoint Slides. They will strengthen the effect of your effort.
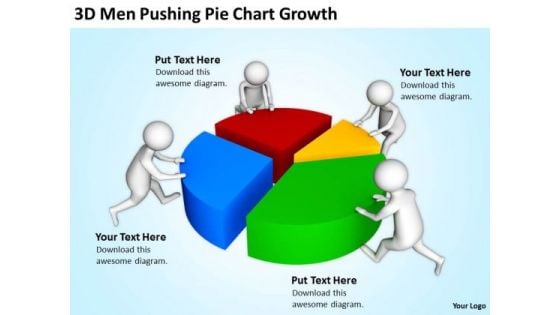
Business People Clipart 3d Men Pushing Pie Chart Growth PowerPoint Templates
We present our business people clipart 3d men pushing pie chart growth PowerPoint templates.Download and present our People PowerPoint Templates because you can Add colour to your speech with our PowerPoint Templates and Slides. Your presentation will leave your audience speechless. Use our Finance PowerPoint Templates because Our PowerPoint Templates and Slides will weave a web of your great ideas. They are gauranteed to attract even the most critical of your colleagues. Use our Business PowerPoint Templates because Our PowerPoint Templates and Slides will provide you the cutting edge. Slice through the doubts in the minds of your listeners. Present our Marketing PowerPoint Templates because you should once Tap the ingenuity of our PowerPoint Templates and Slides. They are programmed to succeed. Present our Leadership PowerPoint Templates because Our PowerPoint Templates and Slides are endowed to endure. Ideas conveyed through them will pass the test of time.Use these PowerPoint slides for presentations relating to 3d, accounting, banking, business, businessmen, cgi, chart, colorful, company, completing, concept, corporate, data, diagram, diversity, economy, financial, graph, illustration, investment, management, market, men, money, part, people, percent, pie, piece, profit, progress, pushing, render, report, results, sales, slice, statistics, strategy, success, symbol, team, teamwork, together, unite, white. The prominent colors used in the PowerPoint template are Green, Blue, Red. PowerPoint presentation experts tell us our business people clipart 3d men pushing pie chart growth PowerPoint templates are visually appealing. People tell us our company PowerPoint templates and PPT Slides will help them to explain complicated concepts. We assure you our business people clipart 3d men pushing pie chart growth PowerPoint templates provide great value for your money. Be assured of finding the best projection to highlight your words. We assure you our cgi PowerPoint templates and PPT Slides will make the presenter successul in his career/life. Presenters tell us our business people clipart 3d men pushing pie chart growth PowerPoint templates effectively help you save your valuable time. Use our chart PowerPoint templates and PPT Slides are designed by professionals Fly in the face of conservative approaches. Our Business People Clipart 3d Men Pushing Pie Chart Growth PowerPoint Templates encourage bold actions.
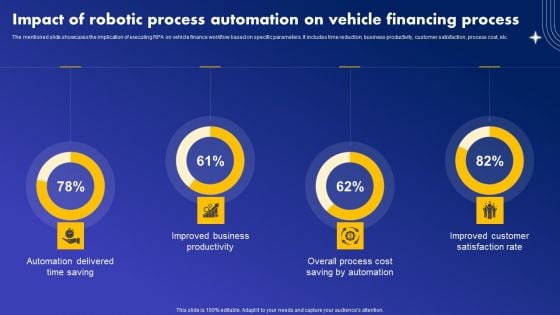
Impact Of Robotic Process Automation On Vehicle Financing Process Rules PDF
The mentioned slide showcases the implication of executing RPA on vehicle finance workflow based on specific parameters. It includes time reduction, business productivity, customer satisfaction, process cost, etc. Welcome to our selection of the Impact Of Robotic Process Automation On Vehicle Financing Process Rules PDF. These are designed to help you showcase your creativity and bring your sphere to life. Planning and Innovation are essential for any business that is just starting out. This collection contains the designs that you need for your everyday presentations. All of our PowerPoints are 100 percent editable, so you can customize them to suit your needs. This multi-purpose template can be used in various situations. Grab these presentation templates today
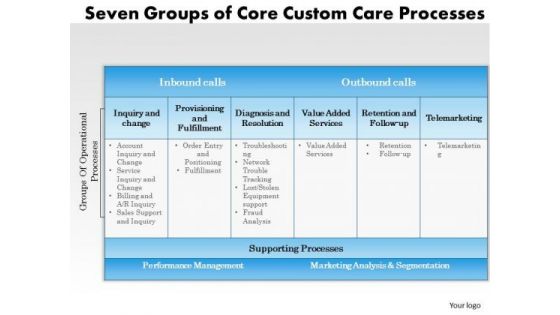
Business Framework Seven Groups Of Curve Customer Care Processes PowerPoint Presentation
This business framework power point template has been crafted with concept of customer care. To show this concept we have used graphic of text box. This diagram contains the various stages inside to show different text related with customer service and management related process.
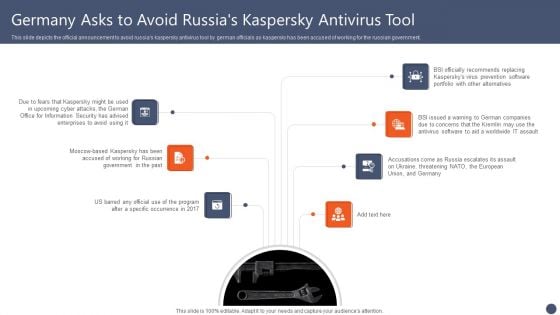
Series Of Cyber Security Attacks Against Ukraine 2022 Germany Asks To Avoid Russias Kaspersky Antivirus Tool Diagrams PDF
This slide depicts the official announcement to avoid russias kaspersky antivirus tool by german officials as kaspersky has been accused of working for the russian government. Do you have an important presentation coming up Are you looking for something that will make your presentation stand out from the rest Look no further than Series Of Cyber Security Attacks Series Of Cyber Security Attacks Against Ukraine 2022 Germany Asks To Avoid Russias Kaspersky Antivirus Tool Diagrams PDF. With our professional designs, you can trust that your presentation will pop and make delivering it a smooth process. And with Slidegeeks, you can trust that your presentation will be unique and memorable. So why wait Grab Series Of Cyber Security Attacks Series Of Cyber Security Attacks Against Ukraine 2022 Germany Asks To Avoid Russias Kaspersky Antivirus Tool Diagrams PDF today and make your presentation stand out from the rest.
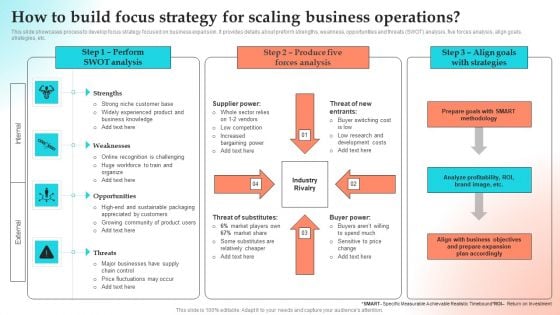
Implementing Strategies To Gain Competitive Advantage How To Build Focus Strategy For Scaling Business Operations Diagrams PDF
This slide showcases process to develop focus strategy focused on business expansion. It provides details about preform strengths, weakness, opportunities and threats SWOT analysis, five forces analysis, align goals, strategies, etc. Do you have to make sure that everyone on your team knows about any specific topic I yes, then you should give Implementing Strategies To Gain Competitive Advantage How To Build Focus Strategy For Scaling Business Operations Diagrams PDF a try. Our experts have put a lot of knowledge and effort into creating this impeccable Implementing Strategies To Gain Competitive Advantage How To Build Focus Strategy For Scaling Business Operations Diagrams PDF. You can use this template for your upcoming presentations, as the slides are perfect to represent even the tiniest detail. You can download these templates from the Slidegeeks website and these are easy to edit. So grab these today.
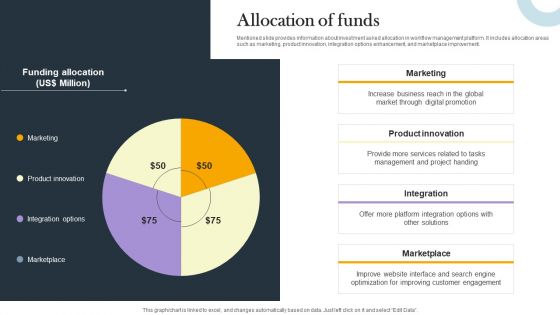
Business Process Optimization Platform Investors Funding Presentation Allocation Of Funds Clipart PDF
Mentioned slide provides information about investment asked allocation in workflow management platform. It includes allocation areas such as marketing, product innovation, integration options enhancement, and marketplace improvement. If you are looking for a format to display your unique thoughts, then the professionally designed Business Process Optimization Platform Investors Funding Presentation Allocation Of Funds Clipart PDF is the one for you. You can use it as a Google Slides template or a PowerPoint template. Incorporate impressive visuals, symbols, images, and other charts. Modify or reorganize the text boxes as you desire. Experiment with shade schemes and font pairings. Alter, share or cooperate with other people on your work. Download Business Process Optimization Platform Investors Funding Presentation Allocation Of Funds Clipart PDF and find out how to give a successful presentation. Present a perfect display to your team and make your presentation unforgettable.
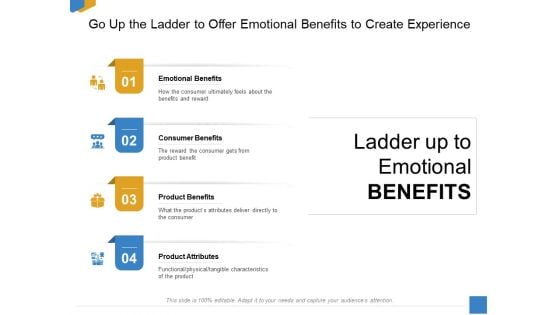
Effective Outcome Launch Roadmap Go Up The Ladder To Offer Emotional Benefits To Create Experience Themes PDF
Presenting this set of slides with name effective outcome launch roadmap go up the ladder to offer emotional benefits to create experience themes pdf. This is a four stage process. The stages in this process are emotional benefits, consumer benefits, product benefits, product attributes. This is a completely editable PowerPoint presentation and is available for immediate download. Download now and impress your audience.
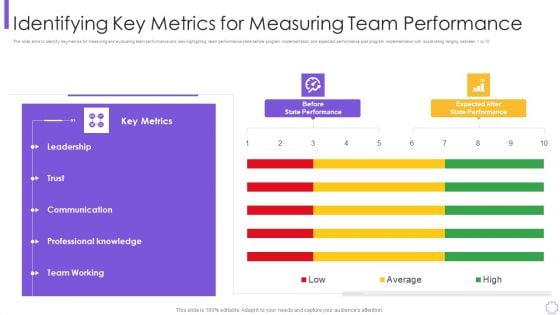
Process Optimization Through Product Life Process Management Techniques Identifying Sample PDF
This slide aims to identify key metrics for measuring and evaluating team performance and also highlighting team performance state before program implementation and expected performance post program implementation with score rating ranging between 1 to 10.Deliver and pitch your topic in the best possible manner with this process optimization through product life process management techniques identifying sample pdf Use them to share invaluable insights on communication, professional knowledge, team working and impress your audience. This template can be altered and modified as per your expectations. So, grab it now.
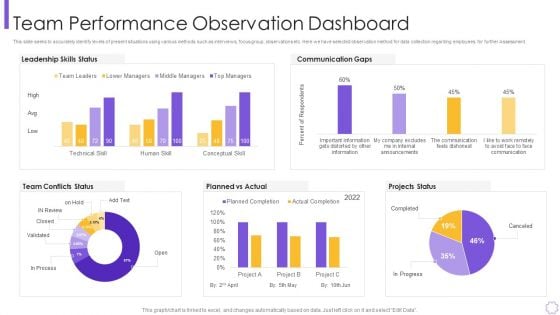
Process Optimization Through Product Life Process Management Techniques Team Performance Clipart PDF
This slide seeks to accurately identify levels of present situations using various methods such as interviews, focus group, observations etc. Here we have selected observation method for data collection regarding employees for further Assessment.Deliver an awe inspiring pitch with this creative process optimization through product life process management techniques team performance clipart pdf bundle. Topics like leadership skills status, communication gaps, team conflicts status can be discussed with this completely editable template. It is available for immediate download depending on the needs and requirements of the user.
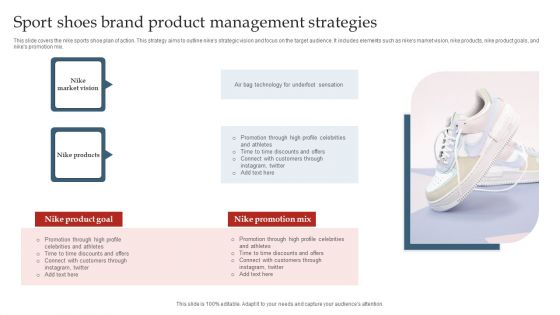
Sport Shoes Brand Product Management Strategies Ppt Slides Themes PDF
This slides covers the nike sports shoe plan of action. This strategy aims to outline nikes strategic vision and focus on the target audience. It includes elements such as nikes market vision, nike products, nike product goals, and nikes promation mis. Showcasing this set of slides titled Sport Shoes Brand Product Management Strategies Ppt Slides Themes PDF. The topics addressed in these templates are Nike Market Vision, Nike Products, Nike Promotion Mix. All the content presented in this PPT design is completely editable. Download it and make adjustments in color, background, font etc. as per your unique business setting.
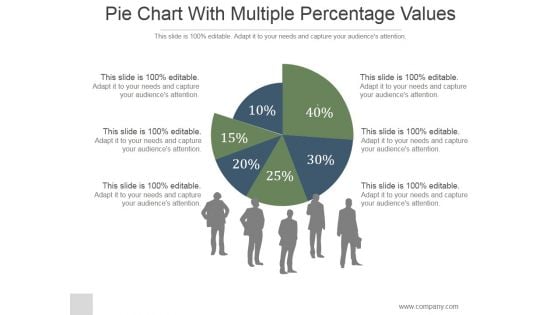
Pie Chart With Multiple Percentage Values Ppt PowerPoint Presentation Show
This is a pie chart with multiple percentage values ppt powerpoint presentation show. This is a six stage process. The stages in this process are pie, finance, people, silhouettes, communication.
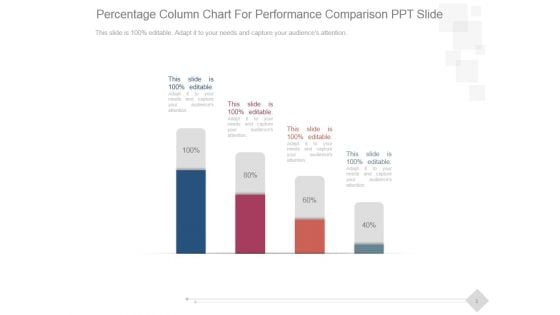
Percentage Column Chart For Performance Comparison Ppt PowerPoint Presentation Good
This is a percentage column chart for performance comparison ppt powerpoint presentation good. This is a four stage process. The stages in this process are business, marketing, technology, presentation, management.
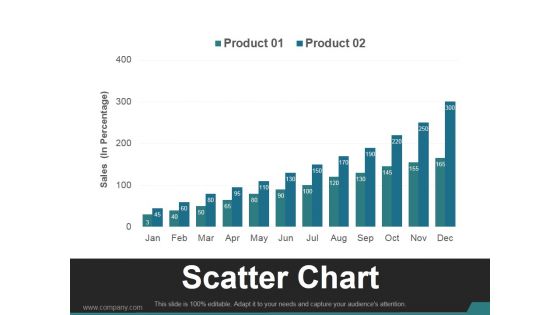
Scatter Chart Template 1 Ppt PowerPoint Presentation Visual Aids
This is a scatter chart template 1 ppt powerpoint presentation visual aids. This is a twelve stage process. The stages in this process are business, marketing, growth, finance, management.
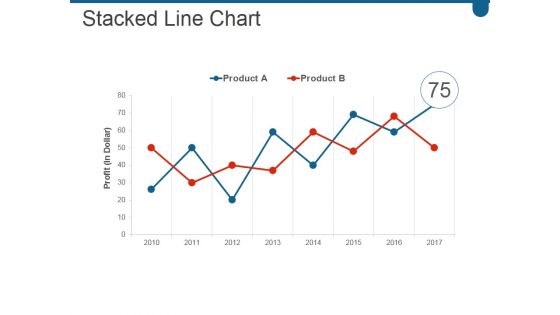
Stacked Line Chart Ppt PowerPoint Presentation Infographic Template Show
This is a stacked line chart ppt powerpoint presentation infographic template show. This is a two stage process. The stages in this process are business, marketing, growth, success, line.
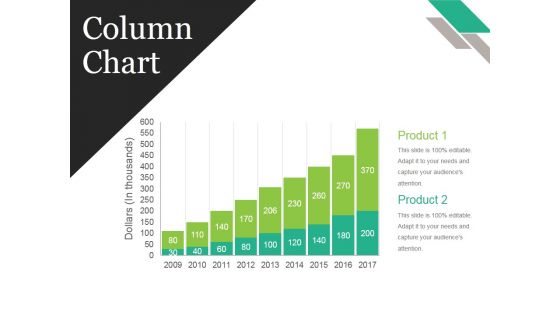
Column Chart Ppt PowerPoint Presentation Show Background Images
This is a column chart ppt powerpoint presentation show background images. This is a nine stage process. The stages in this process are business, strategy, marketing, analysis, growth strategy.
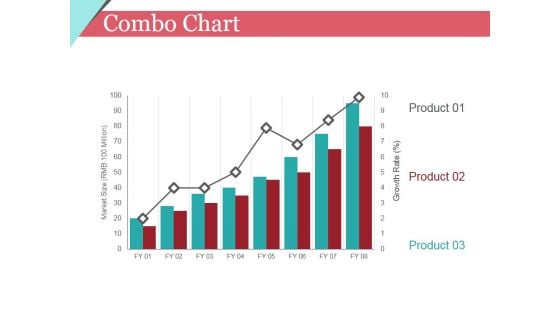
Combo Chart Ppt PowerPoint Presentation Summary Graphics Tutorials
This is a combo chart ppt powerpoint presentation summary graphics tutorials. This is a eight stage process. The stages in this process are product, growth rate, market size, business.
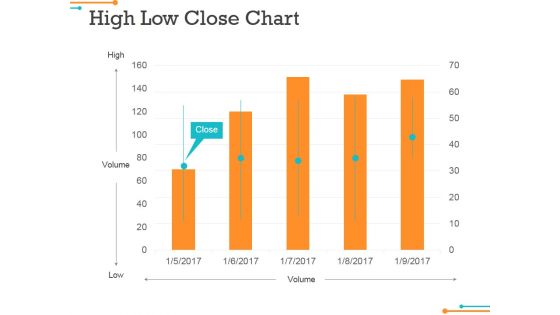
High Low Close Chart Ppt Powerpoint Presentation Gallery Slides
This is a high low close chart ppt powerpoint presentation gallery slides. This is a five stage process. The stages in this process are close, volume, high, low, graph.

 Home
Home