Table Chart
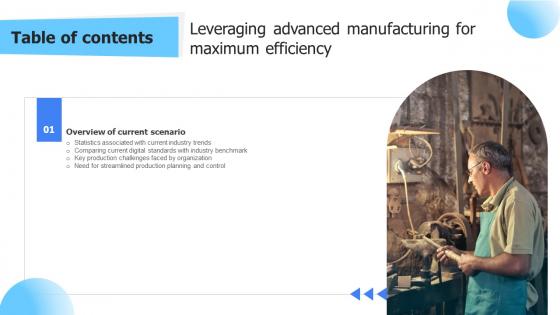
Leveraging Advanced Manufacturing For Maximum Efficiency Tables Of Contents Rules Pdf
Slidegeeks is here to make your presentations a breeze with Leveraging Advanced Manufacturing Developing Routing Sheet For Production Clipart Pdf With our easy-to-use and customizable templates, you can focus on delivering your ideas rather than worrying about formatting. With a variety of designs to choose from, you are sure to find one that suits your needs. And with animations and unique photos, illustrations, and fonts, you can make your presentation pop. So whether you are giving a sales pitch or presenting to the board, make sure to check out Slidegeeks first Our Leveraging Advanced Manufacturing For Maximum Efficiency Tables Of Contents Rules Pdf are topically designed to provide an attractive backdrop to any subject. Use them to look like a presentation pro.
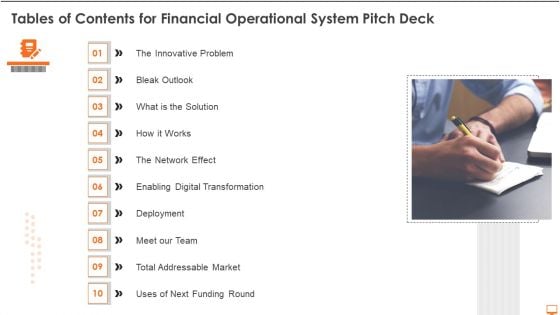
Tables Of Contents For Financial Operational System Pitch Deck Ppt Slides Slideshow PDF
Presenting tables of contents for financial operational system pitch deck ppt slides slideshow pdf to provide visual cues and insights. Share and navigate important information on one stages that need your due attention. This template can be used to pitch topics like innovative problem, bleak outlook, network effect, digital transformation. In addtion, this PPT design contains high resolution images, graphics, etc, that are easily editable and available for immediate download.
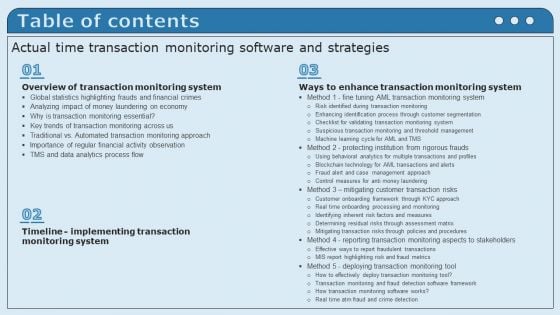
Tables Of Content Actual Time Transaction Monitoring Software And Strategies Inspiration PDF
If your project calls for a presentation, then Slidegeeks is your go to partner because we have professionally designed, easy to edit templates that are perfect for any presentation. After downloading, you can easily edit Tables Of Content Actual Time Transaction Monitoring Software And Strategies Inspiration PDF and make the changes accordingly. You can rearrange slides or fill them with different images. Check out all the handy templates.
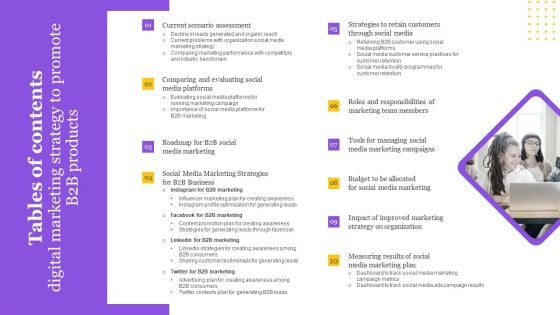
Tables Of Contents Digital Marketing Strategy To Promote B2B Products Rules PDF
Make sure to capture your audiences attention in your business displays with our gratis customizable Tables Of Contents Digital Marketing Strategy To Promote B2B Products Rules PDF. These are great for business strategies, office conferences, capital raising or task suggestions. If you desire to acquire more customers for your tech business and ensure they stay satisfied, create your own sales presentation with these plain slides.
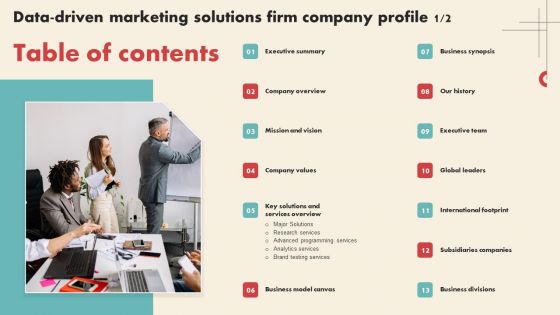
Tables Of Contents Data Driven Marketing Solutions Firm Company Profile Microsoft PDF
Want to ace your presentation in front of a live audience Our Tables Of Contents Data Driven Marketing Solutions Firm Company Profile Microsoft PDF can help you do that by engaging all the users towards you. Slidegeeks experts have put their efforts and expertise into creating these impeccable powerpoint presentations so that you can communicate your ideas clearly. Moreover, all the templates are customizable, and easy to edit and downloadable. Use these for both personal and commercial use.
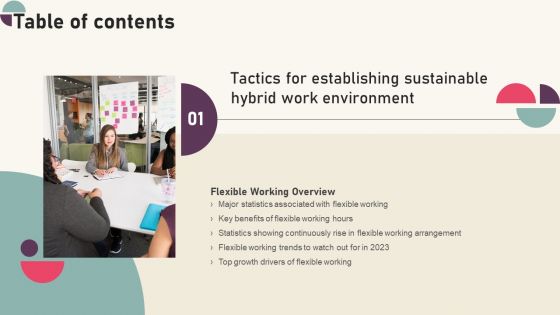
Tactics For Establishing Sustainable Hybrid Work Environment Tables Of Content Graphics PDF
From laying roadmaps to briefing everything in detail, our templates are perfect for you. You can set the stage with your presentation slides. All you have to do is download these easy to edit and customizable templates. Tactics For Establishing Sustainable Hybrid Work Environment Tables Of Content Graphics PDF will help you deliver an outstanding performance that everyone would remember and praise you for. Do download this presentation today.

Tactics For Reducing Staff TURNOVER In The Workplace Tables Of Content Elements PDF
If your project calls for a presentation, then Slidegeeks is your go to partner because we have professionally designed, easy to edit templates that are perfect for any presentation. After downloading, you can easily edit Tactics For Reducing Staff TURNOVER In The Workplace Tables Of Content Elements PDF and make the changes accordingly. You can rearrange slides or fill them with different images. Check out all the handy templates
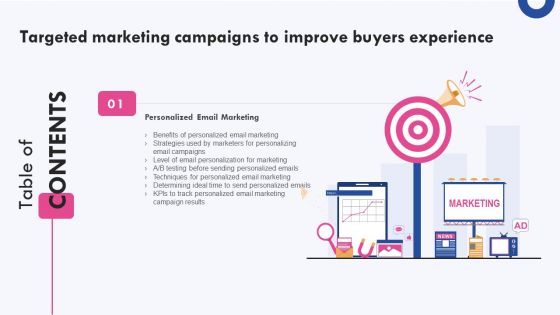
Targeted Marketing Campaigns To Improve Buyers Experience Tables Of Content Summary PDF
If your project calls for a presentation, then Slidegeeks is your go to partner because we have professionally designed, easy to edit templates that are perfect for any presentation. After downloading, you can easily edit Targeted Marketing Campaigns To Improve Buyers Experience Tables Of Content Summary PDF and make the changes accordingly. You can rearrange slides or fill them with different images. Check out all the handy templates
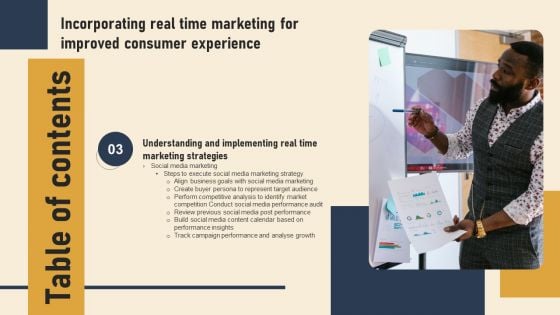
Incorporating Real Time Marketing For Improved Consumer Experience Tables Of Content Demonstration PDF
From laying roadmaps to briefing everything in detail, our templates are perfect for you. You can set the stage with your presentation slides. All you have to do is download these easy to edit and customizable templates. Incorporating Real Time Marketing For Improved Consumer Experience Tables Of Content Demonstration PDF will help you deliver an outstanding performance that everyone would remember and praise you for. Do download this presentation today.
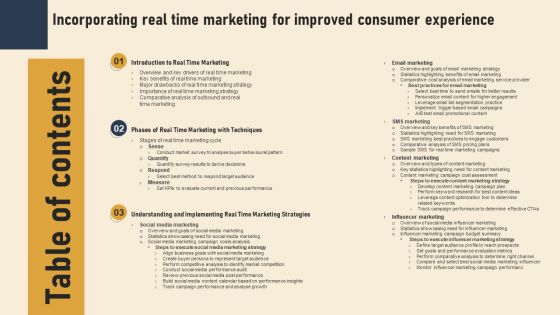
Tables Of Content Incorporating Real Time Marketing For Improved Consumer Experience Microsoft PDF
If your project calls for a presentation, then Slidegeeks is your go to partner because we have professionally designed, easy to edit templates that are perfect for any presentation. After downloading, you can easily edit Tables Of Content Incorporating Real Time Marketing For Improved Consumer Experience Microsoft PDF and make the changes accordingly. You can rearrange slides or fill them with different images. Check out all the handy templates
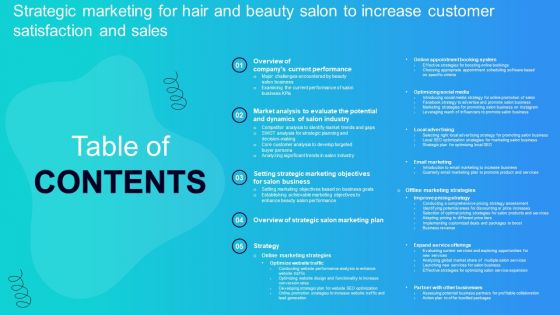
Tables Of Content Strategic Marketing For Hair And Beauty Salon To Increase Customer Satisfaction Mockup PDF
If your project calls for a presentation, then Slidegeeks is your go to partner because we have professionally designed, easy to edit templates that are perfect for any presentation. After downloading, you can easily edit Tables Of Content Strategic Marketing For Hair And Beauty Salon To Increase Customer Satisfaction Mockup PDF and make the changes accordingly. You can rearrange slides or fill them with different images. Check out all the handy templates
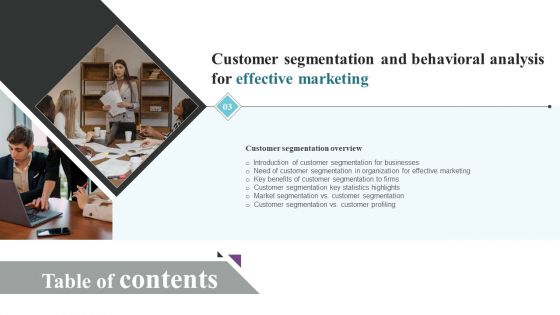
Customer Segmentation And Behavioral Analysis For Effective Marketing Tables Of Content Guidelines PDF
Want to ace your presentation in front of a live audience Our Customer Segmentation And Behavioral Analysis For Effective Marketing Tables Of Content Guidelines PDF can help you do that by engaging all the users towards you. Slidegeeks experts have put their efforts and expertise into creating these impeccable powerpoint presentations so that you can communicate your ideas clearly. Moreover, all the templates are customizable, and easy to edit and downloadable. Use these for both personal and commercial use.
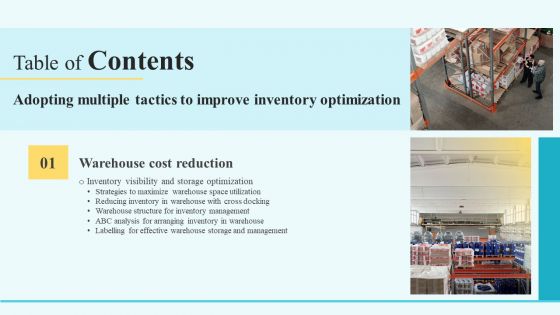
Adopting Multiple Tactics To Improve Inventory Optimization Tables Of Content Portrait PDF
This slide showcases KPIs that can help organization to track the warehouse performance and reduce costs. It includes inventory accuracy, carrying cost of inventory, inventory shrinkage, picking accuracy and cost per order. From laying roadmaps to briefing everything in detail, our templates are perfect for you. You can set the stage with your presentation slides. All you have to do is download these easy to edit and customizable templates. Adopting Multiple Tactics To Improve Inventory Optimization Tables Of Content Portrait PDF will help you deliver an outstanding performance that everyone would remember and praise you for. Do download this presentation today.
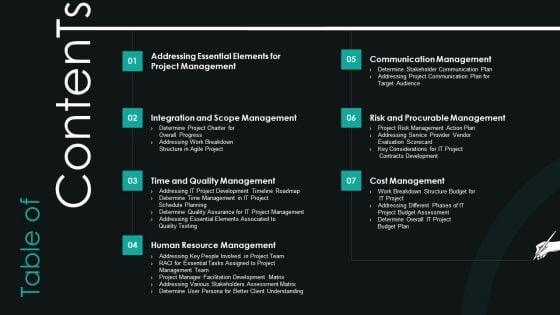
Fundamental PMP Elements Of IT Projects IT Tables Of Contents Pictures PDF
Deliver and pitch your topic in the best possible manner with this fundamental pmp elements of it projects it tables of contents pictures pdf. Use them to share invaluable insights on risk and procurable management, communication management, cost management, time and quality management, human resource management and impress your audience. This template can be altered and modified as per your expectations. So, grab it now.

TABLES OF CONTENT Optimizing Traditional Media To Boost Sales Themes PDF
Slidegeeks has constructed TABLES OF CONTENT Optimizing Traditional Media To Boost Sales Themes PDF after conducting extensive research and examination. These presentation templates are constantly being generated and modified based on user preferences and critiques from editors. Here, you will find the most attractive templates for a range of purposes while taking into account ratings and remarks from users regarding the content. This is an excellent jumping-off point to explore our content and will give new users an insight into our top-notch PowerPoint Templates.

Methods For Implementing Ambush Advertising Campaigns Tables Of Content Inspiration PDF
Present like a pro with Methods For Implementing Ambush Advertising Campaigns Tables Of Content Inspiration PDF Create beautiful presentations together with your team, using our easy to use presentation slides. Share your ideas in real time and make changes on the fly by downloading our templates. So whether you are in the office, on the go, or in a remote location, you can stay in sync with your team and present your ideas with confidence. With Slidegeeks presentation got a whole lot easier. Grab these presentations today.
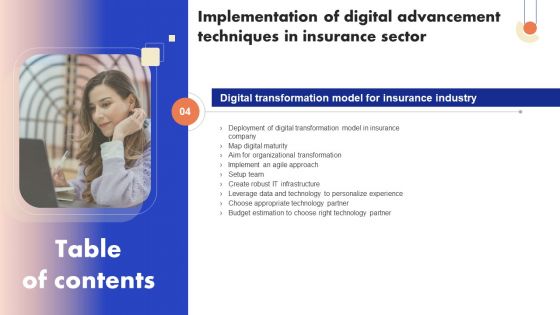
Implementation Of Digital Advancement Techniques In Insurance Sector Tables Of Content Designs PDF
The following slide outlines various application areas of chatbots across insurance industry for customer care and commerce. Key components s consists if claim submission, FAQs, policy status, schedule payment, claim payment, policy registration, policy up gradation, change beneficiary, edit history, premium certificate, benefits and coverage, etc. From laying roadmaps to briefing everything in detail, our templates are perfect for you. You can set the stage with your presentation slides. All you have to do is download these easy to edit and customizable templates. Implementation Of Digital Advancement Techniques In Insurance Sector Tables Of Content Designs PDF will help you deliver an outstanding performance that everyone would remember and praise you for. Do download this presentation today.

Touchstone Tables Goals Values Ppt PowerPoint Presentation Complete Deck With Slides
If designing a presentation takes a lot of your time and resources and you are looking for a better alternative, then this touchstone tables goals values ppt powerpoint presentation complete deck with slides is the right fit for you. This is a prefabricated set that can help you deliver a great presentation on the topic. All the twelve slides included in this sample template can be used to present a birds-eye view of the topic. These slides are also fully editable, giving you enough freedom to add specific details to make this layout more suited to your business setting. Apart from the content, all other elements like color, design, theme are also replaceable and editable. This helps in designing a variety of presentations with a single layout. Not only this, you can use this PPT design in formats like PDF, PNG, and JPG once downloaded. Therefore, without any further ado, download and utilize this sample presentation as per your liking.
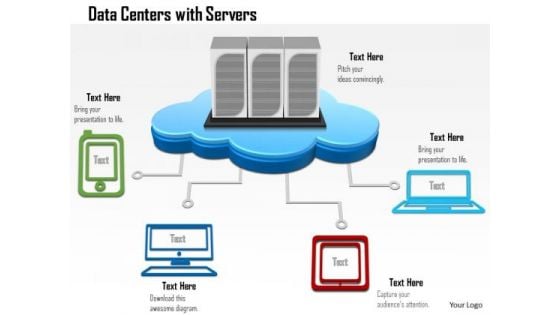
1 Data Center With Servers As A Cloud Connected To Devices Mobile Tables Desktop Ppt Slides
This Powerpoint image slide contains the graphic of cloud server with multiple device connections. This PPT slide explain the concept of data transfer and sharing. This data sharing and transfer is done in between cloud server and devices. We have used mobile, laptops and desktops to show the data sharing and transfer technology.
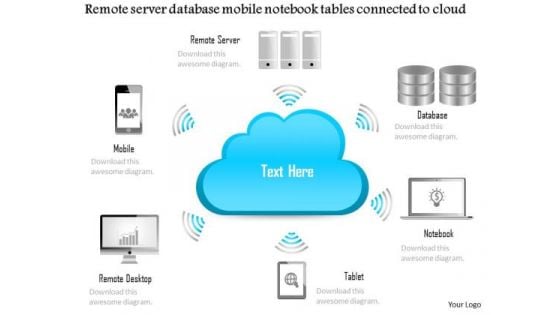
Business Diagram Remote Server Database Mobile Notebook Tables Connected To Cloud Ppt Slide
This technical diagram slide has been designed with graphic of computers and mainframe. These computers are connected with centralized mainframe to displays the network and connectivity. Use this slide for computer technology related presentations.
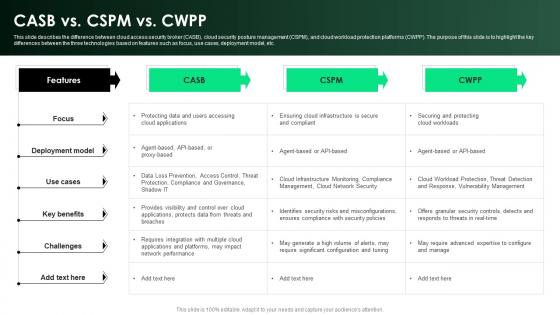
CASB 2 0 IT CASB Vs CSPM Vs CWPP Ppt Diagram Graph Charts
This slide describes the difference between cloud access security broker CASB , cloud security posture management CSPM , and cloud workload protection platforms CWPP . The purpose of this slide is to highlight the key differences between the three technologies based on features such as focus, use cases, deployment model, etc. Are you in need of a template that can accommodate all of your creative concepts This one is crafted professionally and can be altered to fit any style. Use it with Google Slides or PowerPoint. Include striking photographs, symbols, depictions, and other visuals. Fill, move around, or remove text boxes as desired. Test out color palettes and font mixtures. Edit and save your work, or work with colleagues. Download CASB 2 0 IT CASB Vs CSPM Vs CWPP Ppt Diagram Graph Charts and observe how to make your presentation outstanding. Give an impeccable presentation to your group and make your presentation unforgettable. This slide describes the difference between cloud access security broker CASB , cloud security posture management CSPM , and cloud workload protection platforms CWPP . The purpose of this slide is to highlight the key differences between the three technologies based on features such as focus, use cases, deployment model, etc.
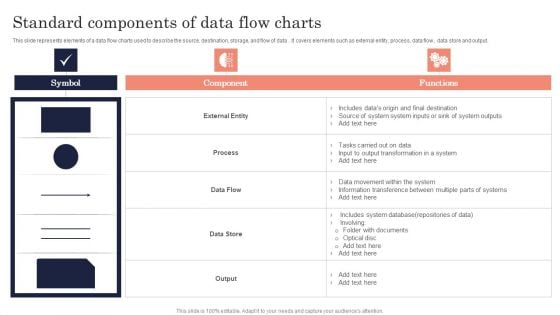
Standard Components Of Data Flow Charts Ppt PowerPoint Presentation File Pictures PDF
this slide represents elements of a data flow charts used to describe the source, destination, storage, and flow of data. it covers elements such as external entity, process, data flow, data store and output. Showcasing this set of slides titled Standard Components Of Data Flow Charts Ppt PowerPoint Presentation File Pictures PDF. The topics addressed in these templates are Symbol, Component, Functions. All the content presented in this PPT design is completely editable. Download it and make adjustments in color, background, font etc. as per your unique business setting.
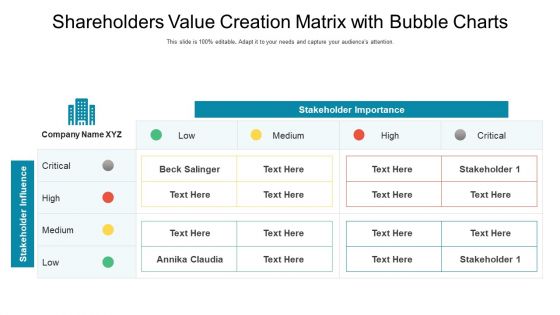
Shareholders Value Creation Matrix With Bubble Charts Ppt Slides Diagrams PDF
Showcasing this set of slides titled shareholders value creation matrix with bubble charts ppt slides diagrams pdf. The topics addressed in these templates are stakeholder importance, stakeholder influence. All the content presented in this PPT design is completely editable. Download it and make adjustments in color, background, font etc. as per your unique business setting.
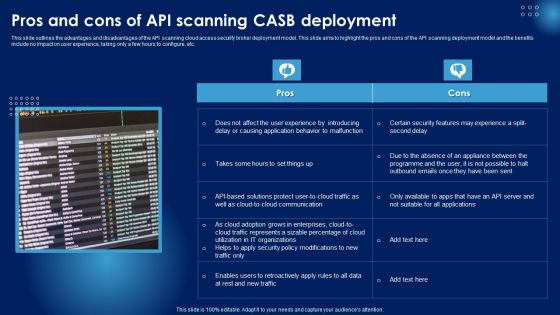
Pros And Cons Of API Scanning CASB Deployment Ppt PowerPoint Presentation Diagram Graph Charts PDF
This slide outlines the advantages and disadvantages of the API scanning cloud access security broker deployment model. This slide aims to highlight the pros and cons of the API scanning deployment model and the benefits include no impact on user experience, taking only a few hours to configure, etc. Whether you have daily or monthly meetings, a brilliant presentation is necessary. Pros And Cons Of API Scanning CASB Deployment Ppt PowerPoint Presentation Diagram Graph Charts PDF can be your best option for delivering a presentation. Represent everything in detail using Pros And Cons Of API Scanning CASB Deployment Ppt PowerPoint Presentation Diagram Graph Charts PDF and make yourself stand out in meetings. The template is versatile and follows a structure that will cater to your requirements. All the templates prepared by Slidegeeks are easy to download and edit. Our research experts have taken care of the corporate themes as well. So, give it a try and see the results.
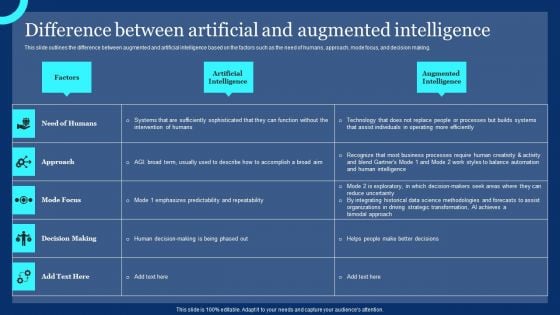
Difference Between Artificial And Augmented Intelligence Ppt PowerPoint Presentation Diagram Graph Charts PDF
This slide outlines the difference between augmented and artificial intelligence based on the factors such as the need of humans, approach, mode focus, and decision making. Here you can discover an assortment of the finest PowerPoint and Google Slides templates. With these templates, you can create presentations for a variety of purposes while simultaneously providing your audience with an eye catching visual experience. Download Difference Between Artificial And Augmented Intelligence Ppt PowerPoint Presentation Diagram Graph Charts PDF to deliver an impeccable presentation. These templates will make your job of preparing presentations much quicker, yet still, maintain a high level of quality. Slidegeeks has experienced researchers who prepare these templates and write high quality content for you. Later on, you can personalize the content by editing the Difference Between Artificial And Augmented Intelligence Ppt PowerPoint Presentation Diagram Graph Charts PDF.
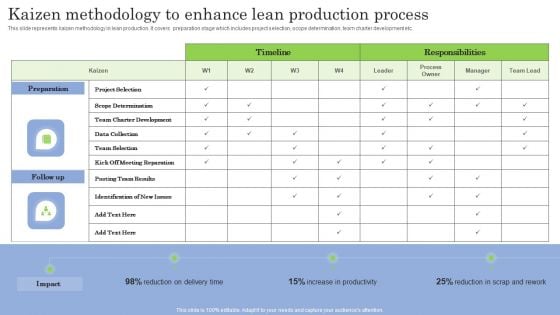
Kaizen Methodology To Enhance Lean Production Process Ppt PowerPoint Presentation Diagram Graph Charts PDF
This slide represents kaizen methodology in lean production. It covers preparation stage which includes project selection, scope determination, team charter development etc. Crafting an eye catching presentation has never been more straightforward. Let your presentation shine with this tasteful yet straightforward Kaizen Methodology To Enhance Lean Production Process Ppt PowerPoint Presentation Diagram Graph Charts PDF template. It offers a minimalistic and classy look that is great for making a statement. The colors have been employed intelligently to add a bit of playfulness while still remaining professional. Construct the ideal Kaizen Methodology To Enhance Lean Production Process Ppt PowerPoint Presentation Diagram Graph Charts PDF that effortlessly grabs the attention of your audience. Begin now and be certain to wow your customers.
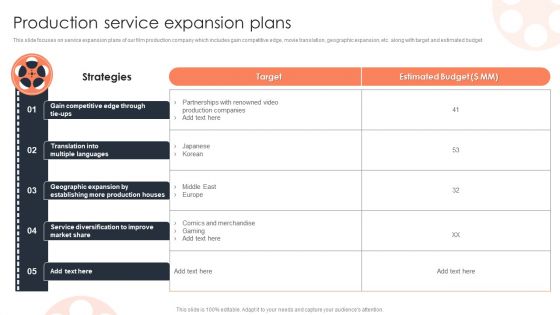
Production Service Expansion Plans Film Media Company Profile Ppt PowerPoint Presentation Diagram Graph Charts PDF
This slide focuses on service expansion plans of our film production company which includes gain competitive edge, movie translation, geographic expansion, etc. along with target and estimated budget.Deliver an awe inspiring pitch with this creative Production Service Expansion Plans Film Media Company Profile Ppt PowerPoint Presentation Diagram Graph Charts PDF bundle. Topics like Geographic Expansion, Establishing Production, Diversification Improve can be discussed with this completely editable template. It is available for immediate download depending on the needs and requirements of the user.
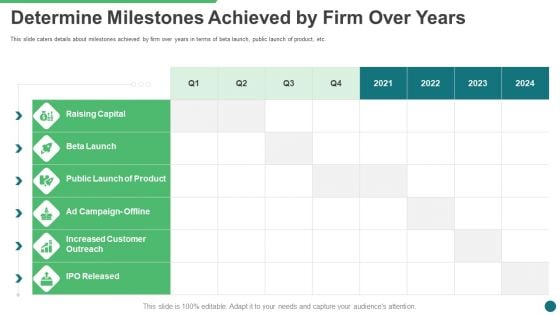
Determine Milestones Achieved By Firm Over Years Ppt Diagram Graph Charts PDF
This slide caters details about milestones achieved by firm over years in terms of beta launch, public launch of product, etc. Deliver an awe inspiring pitch with this creative determine milestones achieved by firm over years ppt diagram graph charts pdf bundle. Topics like determine milestones achieved by firm over years can be discussed with this completely editable template. It is available for immediate download depending on the needs and requirements of the user.
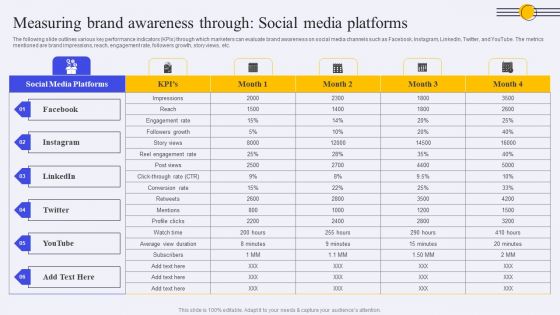
Measuring Brand Awareness Through Social Media Platforms Ppt PowerPoint Presentation Diagram Graph Charts PDF
The following slide outlines various key performance indicators KPIs through which marketers can evaluate brand awareness on social media channels such as Facebook, Instagram, LinkedIn, Twitter, and YouTube. The metrics mentioned are brand impressions, reach, engagement rate, followers growth, story views, etc. The best PPT templates are a great way to save time, energy, and resources. Slidegeeks have 100 percent editable powerpoint slides making them incredibly versatile. With these quality presentation templates, you can create a captivating and memorable presentation by combining visually appealing slides and effectively communicating your message. Download Measuring Brand Awareness Through Social Media Platforms Ppt PowerPoint Presentation Diagram Graph Charts PDF from Slidegeeks and deliver a wonderful presentation.
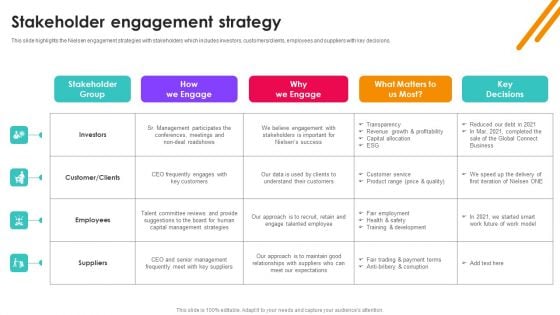
Nielsen Business Profile Stakeholder Engagement Strategy Ppt PowerPoint Presentation Diagram Graph Charts PDF
This slide highlights the Nielsen engagement strategies with stakeholders which includes investors, customers or clients, employees and suppliers with key decisions. The Nielsen Business Profile Stakeholder Engagement Strategy Ppt PowerPoint Presentation Diagram Graph Charts PDF is a compilation of the most recent design trends as a series of slides. It is suitable for any subject or industry presentation, containing attractive visuals and photo spots for businesses to clearly express their messages. This template contains a variety of slides for the user to input data, such as structures to contrast two elements, bullet points, and slides for written information. Slidegeeks is prepared to create an impression.
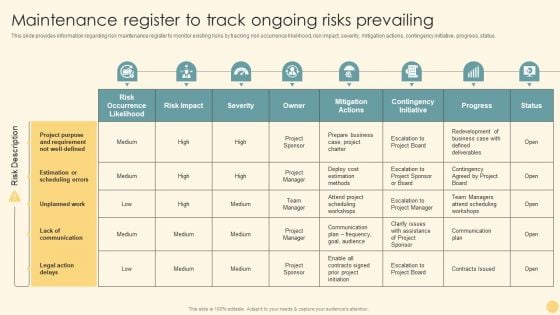
Maintenance Register To Track Ongoing Risks Prevailing Ppt PowerPoint Presentation Diagram Graph Charts PDF
This slide provides information regarding risk maintenance register to monitor existing risks by tracking risk occurrence likelihood, risk impact, severity, mitigation actions, contingency initiative, progress, status. Want to ace your presentation in front of a live audience Our Maintenance Register To Track Ongoing Risks Prevailing Ppt PowerPoint Presentation Diagram Graph Charts PDF can help you do that by engaging all the users towards you. Slidegeeks experts have put their efforts and expertise into creating these impeccable powerpoint presentations so that you can communicate your ideas clearly. Moreover, all the templates are customizable, and easy to edit and downloadable. Use these for both personal and commercial use.
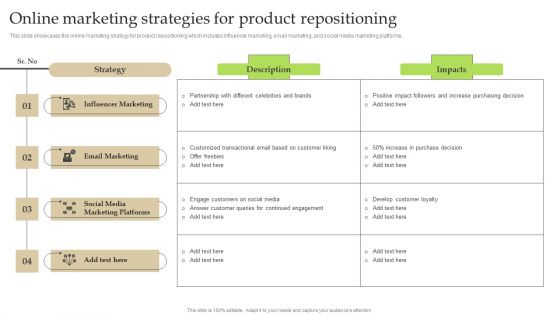
Online Marketing Strategies For Product Repositioning Ppt PowerPoint Presentation Diagram Graph Charts PDF
This slide showcases the online marketing strategy for product repositioning which includes influencer marketing, email marketing, and social media marketing platforms. Present like a pro with Online Marketing Strategies For Product Repositioning Ppt PowerPoint Presentation Diagram Graph Charts PDF Create beautiful presentations together with your team, using our easy-to-use presentation slides. Share your ideas in real-time and make changes on the fly by downloading our templates. So whether you are in the office, on the go, or in a remote location, you can stay in sync with your team and present your ideas with confidence. With Slidegeeks presentation got a whole lot easier. Grab these presentations today.
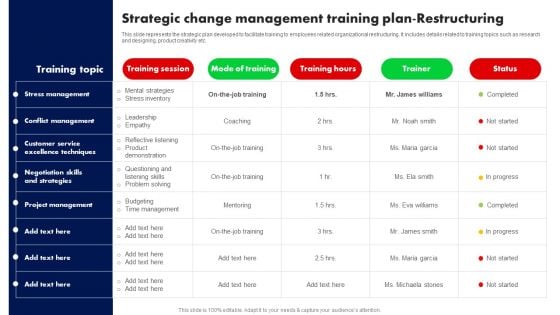
Strategic Change Management Training Plan Restructuring Ppt PowerPoint Presentation Diagram Graph Charts PDF
This slide represents the strategic plan developed to facilitate training to employees related organizational restructuring. It includes details related to training topics such as research and designing, product creativity etc. Take your projects to the next level with our ultimate collection of Strategic Change Management Training Plan Restructuring Ppt PowerPoint Presentation Diagram Graph Charts PDF. Slidegeeks has designed a range of layouts that are perfect for representing task or activity duration, keeping track of all your deadlines at a glance. Tailor these designs to your exact needs and give them a truly corporate look with your own brand colors they will make your projects stand out from the rest.
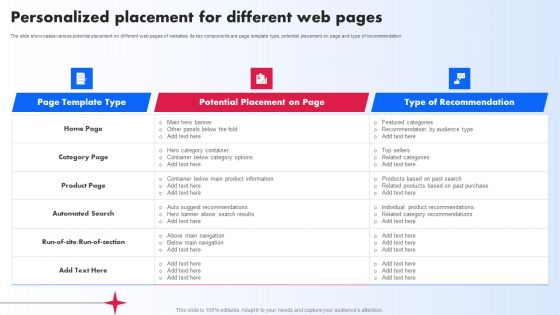
Personalized Placement For Different Web Pages Ppt PowerPoint Presentation Diagram Graph Charts PDF
The slide showcases various potential placement on different web pages of websites. Its key components are page template type, potential placement on page and type of recommendation. Do you know about Slidesgeeks Personalized Placement For Different Web Pages Ppt PowerPoint Presentation Diagram Graph Charts PDF. These are perfect for delivering any kind od presentation. Using it, create PowerPoint presentations that communicate your ideas and engage audiences. Save time and effort by using our pre designed presentation templates that are perfect for a wide range of topic. Our vast selection of designs covers a range of styles, from creative to business, and are all highly customizable and easy to edit. Download as a PowerPoint template or use them as Google Slides themes.

Platforms To Run Paid Search Engine Campaign Ppt PowerPoint Presentation Diagram Graph Charts PDF
This slide showcases various platforms that can be leveraged by marketers for running paid search engine campaigns. Three major platforms for paid search engine ads are - Google, Bing and Yahoo Welcome to our selection of the Platforms To Run Paid Search Engine Campaign Ppt PowerPoint Presentation Diagram Graph Charts PDF. These are designed to help you showcase your creativity and bring your sphere to life. Planning and Innovation are essential for any business that is just starting out. This collection contains the designs that you need for your everyday presentations. All of our PowerPoints are 100 percent editable, so you can customize them to suit your needs. This multi purpose template can be used in various situations. Grab these presentation templates today.
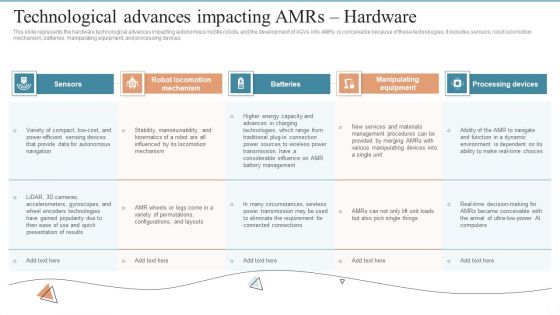
AMR Robot Technological Advances Impacting Amrs Hardware Ppt PowerPoint Presentation Diagram Graph Charts PDF
This slide represents the hardware technological advances impacting autonomous mobile robots, and the development of AGVs into AMRs is conceivable because of these technologies. It includes sensors, robot locomotion mechanism, batteries, manipulating equipment, and processing devices. Present like a pro with AMR Robot Technological Advances Impacting Amrs Hardware Ppt PowerPoint Presentation Diagram Graph Charts PDF Create beautiful presentations together with your team, using our easy to use presentation slides. Share your ideas in real time and make changes on the fly by downloading our templates. So whether you are in the office, on the go, or in a remote location, you can stay in sync with your team and present your ideas with confidence. With Slidegeeks presentation got a whole lot easier. Grab these presentations today.

Potential Segment Analysis For Amazon Customer Base Ppt PowerPoint Presentation Diagram Graph Charts PDF
This slide provides information regarding potential segments assessed across the customer base in terms of market size, recurring purchases, percent of online buyers, conversion rate, and purchasing power. Present like a pro with Potential Segment Analysis For Amazon Customer Base Ppt PowerPoint Presentation Diagram Graph Charts PDF Create beautiful presentations together with your team, using our easy to use presentation slides. Share your ideas in real time and make changes on the fly by downloading our templates. So whether you are in the office, on the go, or in a remote location, you can stay in sync with your team and present your ideas with confidence. With Slidegeeks presentation got a whole lot easier. Grab these presentations today.
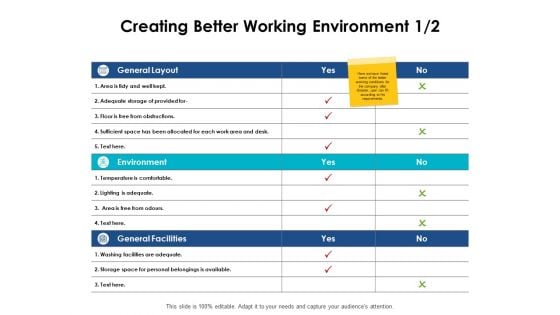
Creating Better Working Environment Storage Ppt PowerPoint Presentation Diagram Graph Charts
Presenting this set of slides with name creating better working environment storage ppt powerpoint presentation diagram graph charts. The topics discussed in these slides are strength, marketing, business, management, planning. This is a completely editable PowerPoint presentation and is available for immediate download. Download now and impress your audience.
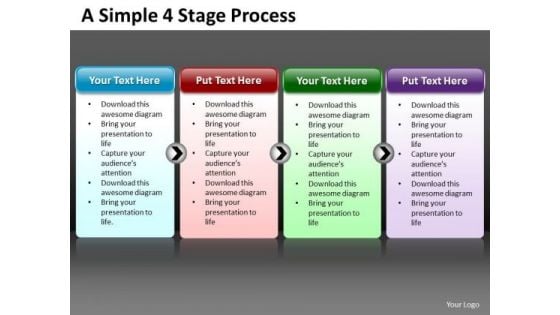
Business Charts PowerPoint Templates Simple 4 Stage Circular Process Editable Sales
Business Charts PowerPoint templates simple 4 stage circular process editable Sales-This PowerPoint Diagram consists of four animated Process tables of Different Colors. It can be used to symbolize four different Approaches or four distinct techniques. It consists of single color slide as well. This diagram will fit for Business Presentations. Open up the windows of your mind. Unlatch them with our Business Charts PowerPoint Templates Simple 4 Stage Circular Process Editable Sales.
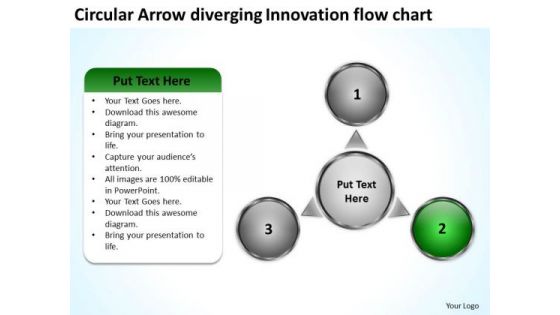
Circular Arrow Diverging Innovation Flow Charts Cycle Spoke Network PowerPoint Slides
We present our circular arrow diverging innovation flow charts Cycle Spoke Network PowerPoint Slides.Use our Flow Charts PowerPoint Templates because you must Evolve the strategy to take you down the required path with appropriate, efficient and effective marketing along the way. Download our Arrows PowerPoint Templates because clarity of thought has been the key to your growth. Present our Business PowerPoint Templates because this is the unerring accuracy in reaching the target. the effortless ability to launch into flight. Download and present our Shapes PowerPoint Templates because you have to coordinate and motivate your team. Download our Process and Flows PowerPoint Templates because you can Grab the attention of your team with this eye catching template signifying .Use these PowerPoint slides for presentations relating to 3d, Arrow, Chart, Circle, Circular, Circulation, Collection, Concept, Connection, Diagram, Direction, Flow, Flowchart, Graph, Graphic, Process, Progress, Ring, Round, Sign, Symbol, Vector, White . The prominent colors used in the PowerPoint template are Gray, Green, White. People tell us our circular arrow diverging innovation flow charts Cycle Spoke Network PowerPoint Slides are designed by professionals Use our Collection PowerPoint templates and PPT Slides are Wonderful. Professionals tell us our circular arrow diverging innovation flow charts Cycle Spoke Network PowerPoint Slides will impress their bosses and teams. Presenters tell us our Circle PowerPoint templates and PPT Slides will generate and maintain the level of interest you desire. They will create the impression you want to imprint on your audience. Professionals tell us our circular arrow diverging innovation flow charts Cycle Spoke Network PowerPoint Slides are Perfect. PowerPoint presentation experts tell us our Circle PowerPoint templates and PPT Slides are Detailed. Experience the striking graphics of our Circular Arrow Diverging Innovation Flow Charts Cycle Spoke Network PowerPoint Slides. They bring good quality to the table.
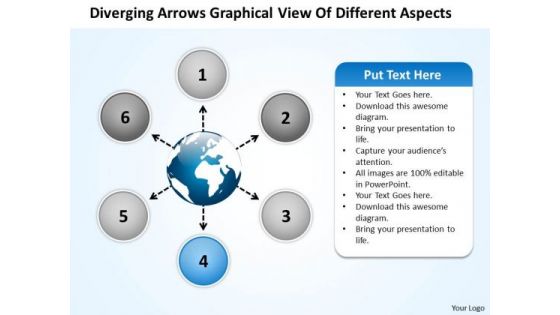
Arrows Graphical View Of Different Aspects Arrow Charts And Diagrams PowerPoint Templates
We present our arrows graphical view of different aspects arrow Charts and Diagrams PowerPoint templates.Download our Business PowerPoint Templates because the great Bald headed Eagle embodies your personality. the eagle eye to seize upon the smallest of opportunities. Download our Arrows PowerPoint Templates because it helps you to get your team in the desired sequence into the bracket. Download our Shapes PowerPoint Templates because the graphic is a symbol of growth and success. Present our Flow Charts PowerPoint Templates because this helps you to comprehend your plan to get the entire act together. Download and present our Process and Flows PowerPoint Templates because it can illustrate your chain of ideas focusing on that aspect or resource in order to enhance the quality of your product.Use these PowerPoint slides for presentations relating to Arrow, Business, Button, Chart, Circle, Company, Cross, Data, Design, Diagram, Direction, Document, Financial, Management, Marketing, Multiple, Plan, Presentation, Process, Results, Sphere, Template, Website, Wheel. The prominent colors used in the PowerPoint template are Blue, White, Gray. Presenters tell us our arrows graphical view of different aspects arrow Charts and Diagrams PowerPoint templates are Exuberant. We assure you our Cross PowerPoint templates and PPT Slides are Amazing. Presenters tell us our arrows graphical view of different aspects arrow Charts and Diagrams PowerPoint templates are the best it can get when it comes to presenting. Use our Circle PowerPoint templates and PPT Slides are Graceful. We assure you our arrows graphical view of different aspects arrow Charts and Diagrams PowerPoint templates are Second to none. You can be sure our Circle PowerPoint templates and PPT Slides are Delightful. Our Arrows Graphical View Of Different Aspects Arrow Charts And Diagrams PowerPoint Templates define the standards. Like you they excel at what they do.
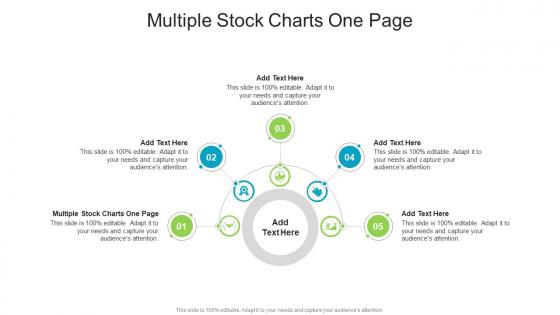
Multiple Stock Charts One Page In Powerpoint And Google Slides Cpb
Introducing our well-designed Multiple Stock Charts One Page In Powerpoint And Google Slides Cpb. This PowerPoint design presents information on topics like Multiple Stock Charts One Page. As it is predesigned it helps boost your confidence level. It also makes you a better presenter because of its high-quality content and graphics. This PPT layout can be downloaded and used in different formats like PDF, PNG, and JPG. Not only this, it is available in both Standard Screen and Widescreen aspect ratios for your convenience. Therefore, click on the download button now to persuade and impress your audience. Our Multiple Stock Charts One Page In Powerpoint And Google Slides Cpb are topically designed to provide an attractive backdrop to any subject. Use them to look like a presentation pro.
Multiple Stock Charts Single Page In Powerpoint And Google Slides Cpb
Introducing our well designed Multiple Stock Charts Single Page In Powerpoint And Google Slides Cpb. This PowerPoint design presents information on topics like Multiple Stock Charts Single Page. As it is predesigned it helps boost your confidence level. It also makes you a better presenter because of its high quality content and graphics. This PPT layout can be downloaded and used in different formats like PDF, PNG, and JPG. Not only this, it is available in both Standard Screen and Widescreen aspect ratios for your convenience. Therefore, click on the download button now to persuade and impress your audience. Our Multiple Stock Charts Single Page In Powerpoint And Google Slides Cpb are topically designed to provide an attractive backdrop to any subject. Use them to look like a presentation pro.

Santa Wishing Merry Christmas With Board Work Flow Charts PowerPoint Slides
We present our santa wishing merry christmas with board work flow charts PowerPoint Slides.Use our Spheres PowerPoint Templates because,You can Take your team along by explaining your plans. Use our Events PowerPoint Templates because,You can Signpost your preferred roadmap to your eager co- travellers and demonstrate clearly how you intend to navigate them towards the desired corporate goal. Use our Festival PowerPoint Templates because, This slide demonstrates how they contribute to the larger melting pot. Use our Holidays PowerPoint Templates because,You are aware of some pitfalls ahead where you need to be cautious not to overrun and avoid a stall. Use our Spheres PowerPoint Templates because, It is in your DNA to analyse possible causes to the minutest detail.Use these PowerPoint slides for presentations relating to Background, Business, Celebration, Christmas, Conceptual, Congratulation, Design, Element, Events, Graphic, Greeting, Holidays, Inscription, Invitation, Merry, Mistletoe, Phrase, Sign, Style, Wishes. The prominent colors used in the PowerPoint template are Red, Yellow, Green. People tell us our santa wishing merry christmas with board work flow charts PowerPoint Slides are Classic. PowerPoint presentation experts tell us our Element PowerPoint templates and PPT Slides are Adorable. PowerPoint presentation experts tell us our santa wishing merry christmas with board work flow charts PowerPoint Slides are Exuberant. Professionals tell us our Design PowerPoint templates and PPT Slides are Nostalgic. Professionals tell us our santa wishing merry christmas with board work flow charts PowerPoint Slides are Dazzling. People tell us our Element PowerPoint templates and PPT Slides are Fantastic. Our Santa Wishing Merry Christmas With Board Work Flow Charts PowerPoint Slides help in analysing contributory factors. Examine what each brings to the table.
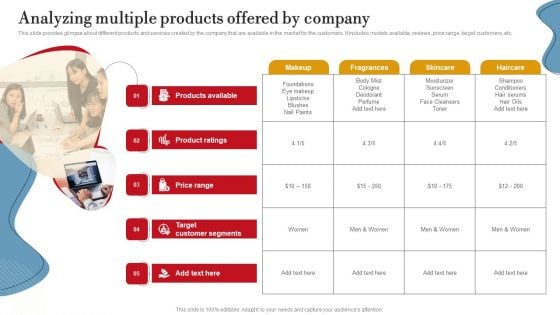
Analyzing Multiple Products Offered By Company Ppt PowerPoint Presentation Diagram Graph Charts PDF
This slide provides glimpse about different products and services created by the company that are available in the market for the customers. It includes models available, reviews, price range, target customers, etc. Find a pre designed and impeccable Analyzing Multiple Products Offered By Company Ppt PowerPoint Presentation Diagram Graph Charts PDF. The templates can ace your presentation without additional effort. You can download these easy to edit presentation templates to make your presentation stand out from others. So, what are you waiting for Download the template from Slidegeeks today and give a unique touch to your presentation.
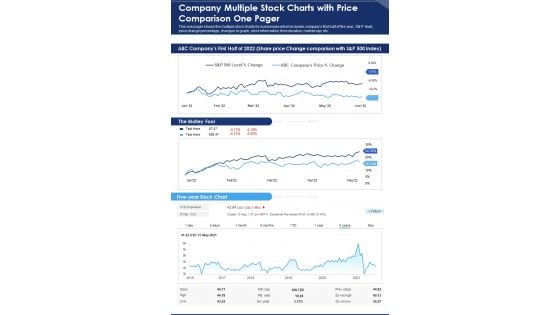
Company Multiple Stock Charts With Price Comparison One Pager PDF Document PPT Template
Here we present the Company Multiple Stock Charts With Price Comparison One Pager PDF Document PPT Template. This One-pager template includes everything you require. You can edit this document and make changes according to your needs it offers complete freedom of customization. Grab this Company Multiple Stock Charts With Price Comparison One Pager PDF Document PPT Template Download now.
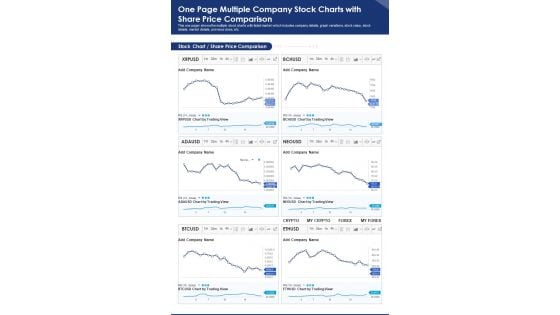
One Page Multiple Company Stock Charts With Share Price Comparison PDF Document PPT Template
Presenting you an exemplary One Page Multiple Company Stock Charts With Share Price Comparison PDF Document PPT Template. Our one-pager template comprises all the must-have essentials of an inclusive document. You can edit it with ease, as its layout is completely editable. With such freedom, you can tweak its design and other elements to your requirements. Download this One Page Multiple Company Stock Charts With Share Price Comparison PDF Document PPT Template Download now.

One Page Multiple Stock Charts With Share Price PDF Document PPT Template
Looking for a predesigned One Page Multiple Stock Charts With Share Price PDF Document PPT Template Heres the perfect piece for you It has everything that a well-structured one-pager template should have. Besides, it is 100 percent editable, which offers you the cushion to make adjustments according to your preferences. Grab this One Page Multiple Stock Charts With Share Price PDF Document PPT Template Download now.
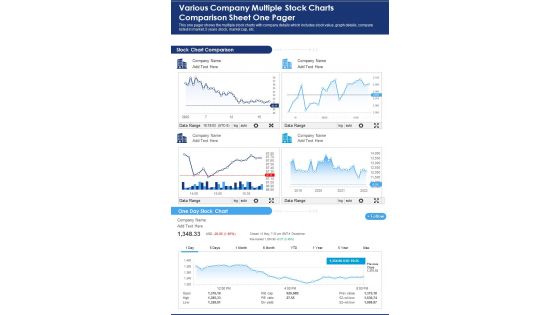
Various Company Multiple Stock Charts Comparison Sheet One Pager PDF Document PPT Template
Presenting you a fantastic Various Company Multiple Stock Charts Comparison Sheet One Pager PDF Document PPT Template. This one-pager document is crafted on hours of research and professional design efforts to ensure you have the best resource. It is completely editable and its design allow you to rehash its elements to suit your needs. Get this Various Company Multiple Stock Charts Comparison Sheet One Pager PDF Document PPT Template Download now.
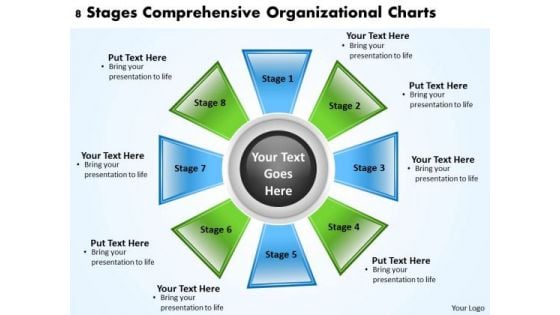
Business Process Management Diagram 8 Stages Comprehensive Organizational Charts PowerPoint Slides
We present our business process management diagram 8 stages comprehensive organizational charts PowerPoint Slides.Download and present our Marketing PowerPoint Templates because Our PowerPoint Templates and Slides will provide weight to your words. They will bring out the depth of your thought process. Download and present our Business PowerPoint Templates because Our PowerPoint Templates and Slides are created with admirable insight. Use them and give your group a sense of your logical mind. Download our Finance PowerPoint Templates because Our PowerPoint Templates and Slides are Clear and concise. Use them and dispel any doubts your team may have. Download our Process and Flows PowerPoint Templates because Our PowerPoint Templates and Slides are created by a hardworking bunch of busybees. Always flitting around with solutions gauranteed to please. Present our Shapes PowerPoint Templates because Our PowerPoint Templates and Slides will bullet point your ideas. See them fall into place one by one.Use these PowerPoint slides for presentations relating to Box, Brochure, Business, Button, Catalog, Chart, Circle, Company, Data, Design, Diagram, Direction, Document, Financial, Goals, Graph, Junction, Management, Market, Marketing, Model, Multicolored, Multiple, Navigation, Network, Options, Orange, Pie, Plan, Presentation, Process, Red, Results, Statistics, Stock, Structure, Template, Vector, Website, Wheel. The prominent colors used in the PowerPoint template are Green, Blue, Black. Enter any arena with our Business Process Management Diagram 8 Stages Comprehensive Organizational Charts PowerPoint Slides. You will certainly emerge the champion.
3d Curved Arrows Linearly Placed What Is Flow Charts PowerPoint Templates
We present our 3d curved arrows linearly placed what is flow charts PowerPoint templates.Use our Arrows PowerPoint Templates because, Profit is fairly earned in what you believe. Use our Shapes PowerPoint Templates because,There are a bunch of ideas brewing in your head which give you the heady taste of success. Use our Signs PowerPoint Templates because,With the help of our Slides you can Illustrate your plans on using the many social media modes available to inform soceity at large of the benefits of your product. Use our Business PowerPoint Templates because, You can Lead your flock steadily to greater heights. Look around at the vast potential of achievement around you Use our Process and Flows PowerPoint Templates because,Your listeners do not have to put on their thinking caps.Use these PowerPoint slides for presentations relating to arrow, automobile, city, curve, destination, direction, freeway, grunge, heading, highway, journey, land, landscape, line, linear, marks, motion, multiple, network, paint, path, perspective, pointing, road, sign, speed, street, strip, symbol, track, traffic, transport, transportation, travel, way. The prominent colors used in the PowerPoint template are Yellow, Green, White. People tell us our 3d curved arrows linearly placed what is flow charts PowerPoint templates are Gorgeous. The feedback we get is that our direction PowerPoint templates and PPT Slides are Great. People tell us our 3d curved arrows linearly placed what is flow charts PowerPoint templates are Radiant. Presenters tell us our freeway PowerPoint templates and PPT Slides are Pretty. The feedback we get is that our 3d curved arrows linearly placed what is flow charts PowerPoint templates will save the presenter time. Professionals tell us our city PowerPoint templates and PPT Slides are Great. Bounce your ideas off our 3d Curved Arrows Linearly Placed What Is Flow Charts PowerPoint Templates. They will echo your thoughts all the way.
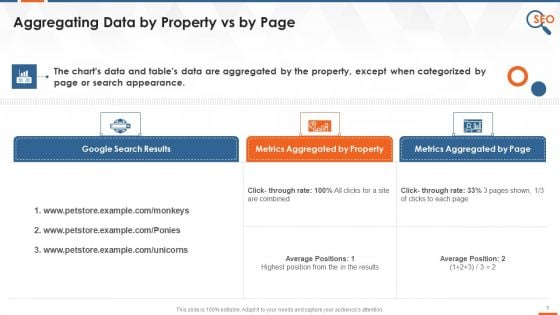
Aggregating Data By Property Vs By Page In Google Search Console Training Ppt
This slide covers details about how The charts and tables data are aggregated by the property, except when categorized by page or search appearance.

Free And Premium Plans Features Comparison Ppt Powerpoint Presentation Slides Template
This is a free and premium plans features comparison ppt powerpoint presentation slides template. This is a two stage process. The stages in this process are comparison chart, comparison table, comparison matrix.
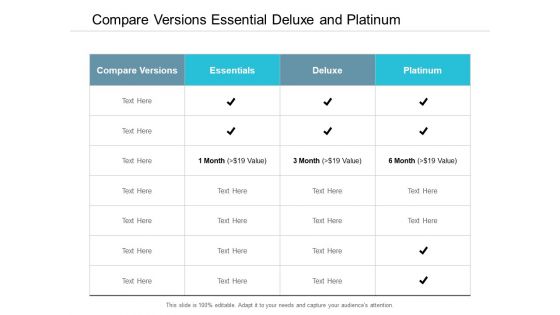
Compare Versions Essential Deluxe And Platinum Ppt Powerpoint Presentation File Graphics Download
This is a compare versions essential deluxe and platinum ppt powerpoint presentation file graphics download. This is a four stage process. The stages in this process are comparison chart, comparison table, comparison matrix.
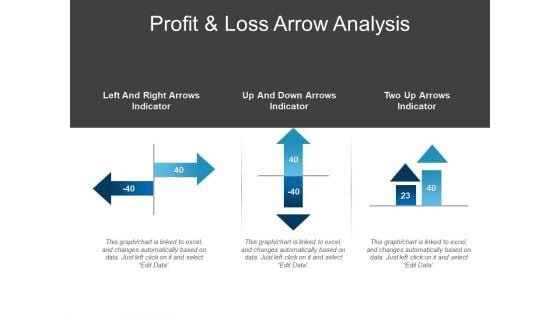
Profit And Loss Arrow Analysis Ppt PowerPoint Presentation Infographic Template Model
This is a profit and loss arrow analysis ppt powerpoint presentation infographic template model. This is a three stage process. The stages in this process are comparison chart, comparison table, comparison matrix.
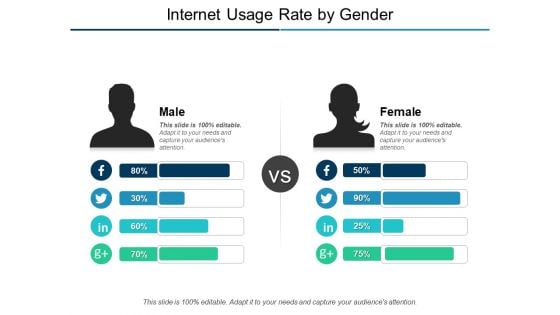
Internet Usage Rate By Gender Ppt PowerPoint Presentation Outline Diagrams
This is a internet usage rate by gender ppt powerpoint presentation outline diagrams. This is a two stage process. The stages in this process are comparison chart, comparison table, comparison matrix.
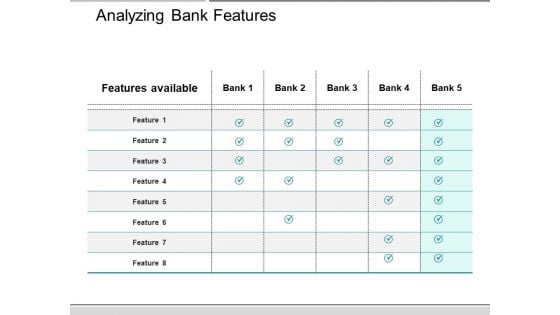
Analyzing Bank Features Ppt PowerPoint Presentation Professional Background
This is a analyzing bank features ppt powerpoint presentation professional background. This is a six stage process. The stages in this process are comparison chart, comparison table, comparison matrix.
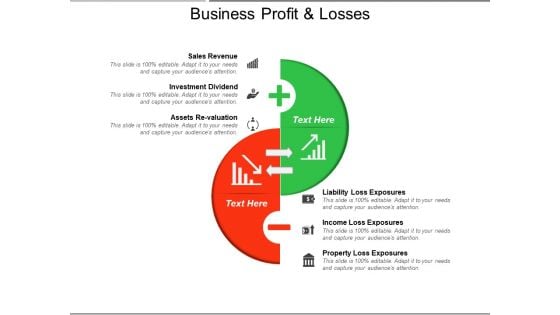
Business Profit And Losses Ppt PowerPoint Presentation Summary Outline
This is a business profit and losses ppt powerpoint presentation summary outline. This is a two stage process. The stages in this process are comparison chart, comparison table, comparison matrix.
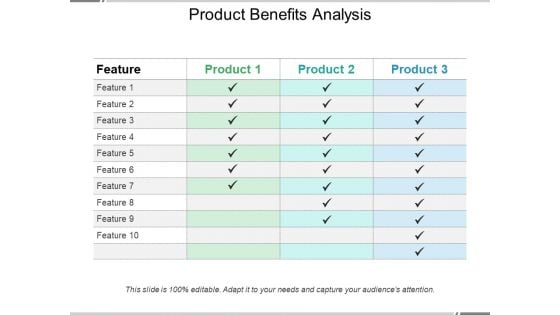
Product Benefits Analysis Ppt PowerPoint Presentation Summary Background
This is a product benefits analysis ppt powerpoint presentation summary background. This is a four stage process. The stages in this process are comparison chart, comparison table, comparison matrix.
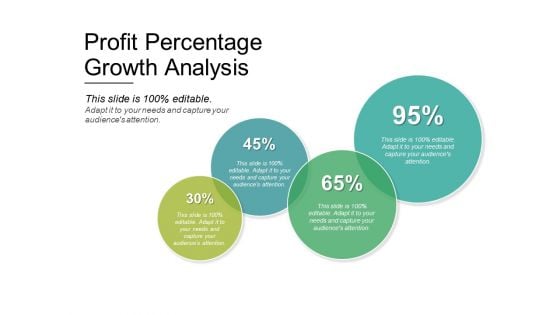
Profit Percentage Growth Analysis Ppt PowerPoint Presentation Layouts Graphics Tutorials
This is a profit percentage growth analysis ppt powerpoint presentation layouts graphics tutorials. This is a four stage process. The stages in this process are comparison chart, comparison table, comparison matrix.


 Continue with Email

 Home
Home


