Table
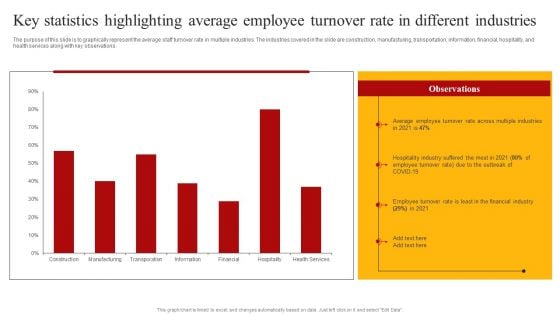
Staff Retention Techniques To Minimize Hiring Expenses Key Statistics Highlighting Average Employee Turnover Clipart PDF
The purpose of this slide is to graphically represent the average staff turnover rate in multiple industries. The industries covered in the slide are construction, manufacturing, transportation, information, financial, hospitality, and health services along with key observations. Want to ace your presentation in front of a live audience Our Staff Retention Techniques To Minimize Hiring Expenses Key Statistics Highlighting Average Employee Turnover Clipart PDF can help you do that by engaging all the users towards you. Slidegeeks experts have put their efforts and expertise into creating these impeccable powerpoint presentations so that you can communicate your ideas clearly. Moreover, all the templates are customizable, and easy to edit and downloadable. Use these for both personal and commercial use.
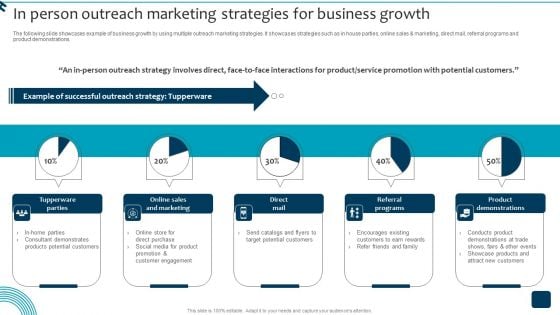
In Person Outreach Marketing Strategies For Business Growth Sample PDF
The following slide showcases example of business growth by using multiple outreach marketing strategies. It showcases strategies such as in house parties, online sales and marketing, direct mail, referral programs and product demonstrations. Here you can discover an assortment of the finest PowerPoint and Google Slides templates. With these templates, you can create presentations for a variety of purposes while simultaneously providing your audience with an eye catching visual experience. Download In Person Outreach Marketing Strategies For Business Growth Sample PDF to deliver an impeccable presentation. These templates will make your job of preparing presentations much quicker, yet still, maintain a high level of quality. Slidegeeks has experienced researchers who prepare these templates and write high quality content for you. Later on, you can personalize the content by editing the In Person Outreach Marketing Strategies For Business Growth Sample PDF.
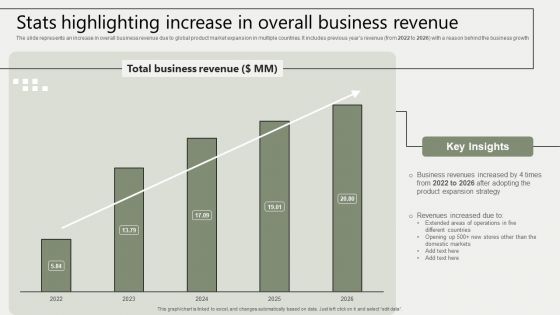
Global Business Market Development Guide Stats Highlighting Increase In Overall Business Revenue Mockup PDF
The slide represents an increase in overall business revenue due to global product market expansion in multiple countries. It includes previous years revenue from 2022 to 2026 with a reason behind the business growth Coming up with a presentation necessitates that the majority of the effort goes into the content and the message you intend to convey. The visuals of a PowerPoint presentation can only be effective if it supplements and supports the story that is being told. Keeping this in mind our experts created Global Business Market Development Guide Stats Highlighting Increase In Overall Business Revenue Mockup PDF to reduce the time that goes into designing the presentation. This way, you can concentrate on the message while our designers take care of providing you with the right template for the situation.
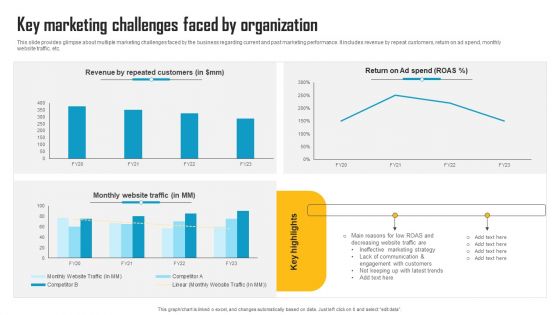
Innovative Marketing Strategy Key Marketing Challenges Faced By Organization Designs PDF
This slide provides glimpse about multiple marketing challenges faced by the business regarding current and past marketing performance. It includes revenue by repeat customers, return on ad spend, monthly website traffic, etc. Do you know about Slidesgeeks Innovative Marketing Strategy Key Marketing Challenges Faced By Organization Designs PDF These are perfect for delivering any kind od presentation. Using it, create PowerPoint presentations that communicate your ideas and engage audiences. Save time and effort by using our pre designed presentation templates that are perfect for a wide range of topic. Our vast selection of designs covers a range of styles, from creative to business, and are all highly customizable and easy to edit. Download as a PowerPoint template or use them as Google Slides themes.
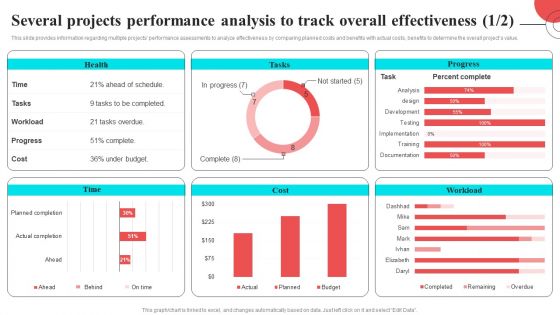
Several Projects Performance Analysis To Track Overall Effectiveness Introduction PDF
This slide provides information regarding multiple projects performance assessments to analyze effectiveness by comparing planned costs and benefits with actual costs, benefits to determine the overall projects value. Are you in need of a template that can accommodate all of your creative concepts This one is crafted professionally and can be altered to fit any style. Use it with Google Slides or PowerPoint. Include striking photographs, symbols, depictions, and other visuals. Fill, move around, or remove text boxes as desired. Test out color palettes and font mixtures. Edit and save your work, or work with colleagues. Download Several Projects Performance Analysis To Track Overall Effectiveness Introduction PDF and observe how to make your presentation outstanding. Give an impeccable presentation to your group and make your presentation unforgettable.

Statistics Indicating Usage Of AI Tools Across Marketing Tasks Ppt Infographics Clipart Images PDF
This slide showcases statistic which indicate usage of multiple artificial intelligence AI tools across marketing ecosystem. It provides details about Jasper.ai, ChatGPT, Copy.ai, Frase.io, high quality content, social media content, etc. Retrieve professionally designed Statistics Indicating Usage Of AI Tools Across Marketing Tasks Ppt Infographics Clipart Images PDF to effectively convey your message and captivate your listeners. Save time by selecting pre-made slideshows that are appropriate for various topics, from business to educational purposes. These themes come in many different styles, from creative to corporate, and all of them are easily adjustable and can be edited quickly. Access them as PowerPoint templates or as Google Slides themes. You do not have to go on a hunt for the perfect presentation because Slidegeeks got you covered from everywhere.
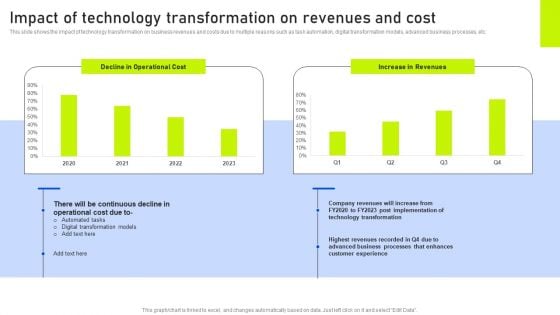
Impact Of Technology Transformation On Revenues And Cost Ppt File Show PDF
This slide shows the impact of technology transformation on business revenues and costs due to multiple reasons such as task automation, digital transformation models, advanced business processes, etc. This Impact Of Technology Transformation On Revenues And Cost Ppt File Show PDF from Slidegeeks makes it easy to present information on your topic with precision. It provides customization options, so you can make changes to the colors, design, graphics, or any other component to create a unique layout. It is also available for immediate download, so you can begin using it right away. Slidegeeks has done good research to ensure that you have everything you need to make your presentation stand out. Make a name out there for a brilliant performance.
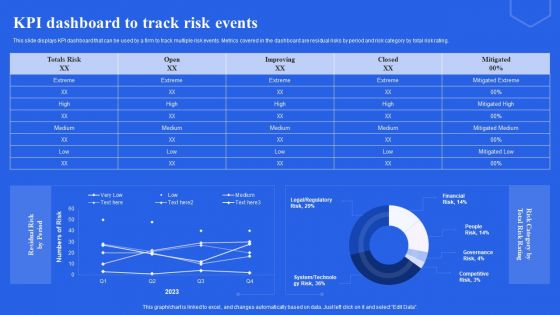
KPI Dashboard To Track Risk Events Ppt Infographic Template Layout Ideas PDF
This slide displays KPI dashboard that can be used by a firm to track multiple risk events. Metrics covered in the dashboard are residual risks by period and risk category by total risk rating. Are you in need of a template that can accommodate all of your creative concepts This one is crafted professionally and can be altered to fit any style. Use it with Google Slides or PowerPoint. Include striking photographs, symbols, depictions, and other visuals. Fill, move around, or remove text boxes as desired. Test out color palettes and font mixtures. Edit and save your work, or work with colleagues. Download KPI Dashboard To Track Risk Events Ppt Infographic Template Layout Ideas PDF and observe how to make your presentation outstanding. Give an impeccable presentation to your group and make your presentation unforgettable.
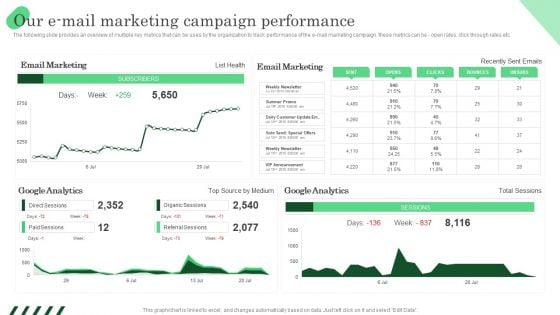
Our E Mail Marketing Campaign Performance Ppt PowerPoint Presentation File Gallery PDF
The following slide provides an overview of multiple key metrics that can be uses by the organization to track performance of the e-mail marketing campaign. these metrics can be - open rates, click through rates etc. The Our E Mail Marketing Campaign Performance Ppt PowerPoint Presentation File Gallery PDF is a compilation of the most recent design trends as a series of slides. It is suitable for any subject or industry presentation, containing attractive visuals and photo spots for businesses to clearly express their messages. This template contains a variety of slides for the user to input data, such as structures to contrast two elements, bullet points, and slides for written information. Slidegeeks is prepared to create an impression.
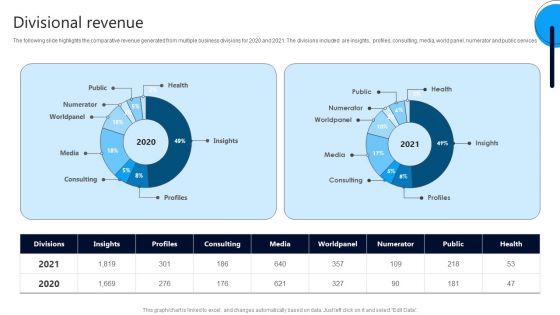
Market Research Evaluation Company Outline Divisional Revenue Themes PDF
The following slide highlights the comparative revenue generated from multiple business divisions for 2020 and 2021. The divisions included are insights, profiles, consulting, media, world panel, numerator and public services Get a simple yet stunning designed Market Research Evaluation Company Outline Divisional Revenue Themes PDF. It is the best one to establish the tone in your meetings. It is an excellent way to make your presentations highly effective. So, download this PPT today from Slidegeeks and see the positive impacts. Our easy to edit Market Research Evaluation Company Outline Divisional Revenue Themes PDF can be your go to option for all upcoming conferences and meetings. So, what are you waiting for Grab this template today.

Examining Customer Experience Path To Enhance Adoption Rate Customer Reviews And Ratings For Product Pictures PDF
This slide provides glimpse about client reviews about the product offered by the brand so the customers can check reviews of products users and realize the products value. It includes multiple KPIs such as quality, effectiveness, fragrance, etc. Boost your pitch with our creative Examining Customer Experience Path To Enhance Adoption Rate Customer Reviews And Ratings For Product Pictures PDF. Deliver an awe-inspiring pitch that will mesmerize everyone. Using these presentation templates you will surely catch everyones attention. You can browse the ppts collection on our website. We have researchers who are experts at creating the right content for the templates. So you do not have to invest time in any additional work. Just grab the template now and use them.
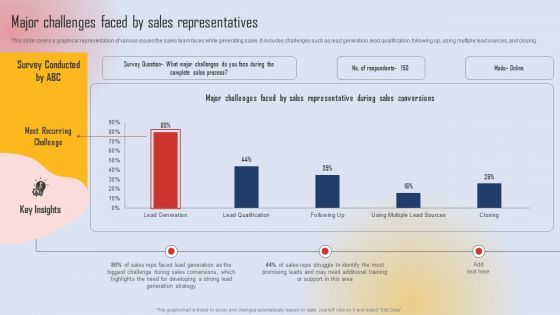
Effective Lead Generation For Higher Conversion Rates Major Challenges Faced By Sales Representatives Slides PDF
This slide covers a graphical representation of various issues the sales team faces while generating sales. It includes challenges such as lead generation, lead qualification, following up, using multiple lead sources, and closing. Crafting an eye catching presentation has never been more straightforward. Let your presentation shine with this tasteful yet straightforward Effective Lead Generation For Higher Conversion Rates Major Challenges Faced By Sales Representatives Slides PDF template. It offers a minimalistic and classy look that is great for making a statement. The colors have been employed intelligently to add a bit of playfulness while still remaining professional. Construct the ideal Effective Lead Generation For Higher Conversion Rates Major Challenges Faced By Sales Representatives Slides PDF that effortlessly grabs the attention of your audience. Begin now and be certain to wow your customers.
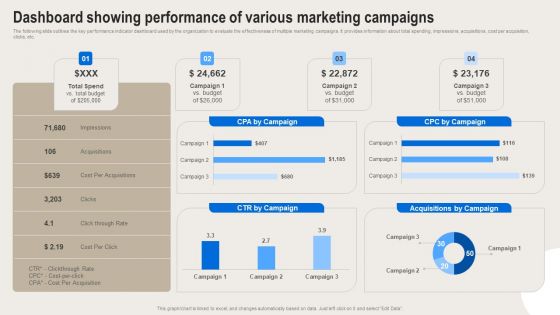
Formulating Branding Strategy To Enhance Revenue And Sales Dashboard Showing Performance Of Various Graphics PDF
The following slide outlines the key performance indicator dashboard used by the organization to evaluate the effectiveness of multiple marketing campaigns. It provides information about total spending, impressions, acquisitions, cost per acquisition, clicks, etc. Create an editable Formulating Branding Strategy To Enhance Revenue And Sales Dashboard Showing Performance Of Various Graphics PDF that communicates your idea and engages your audience. Whether youre presenting a business or an educational presentation, pre designed presentation templates help save time. Formulating Branding Strategy To Enhance Revenue And Sales Dashboard Showing Performance Of Various Graphics PDF is highly customizable and very easy to edit, covering many different styles from creative to business presentations. Slidegeeks has creative team members who have crafted amazing templates. So, go and get them without any delay.
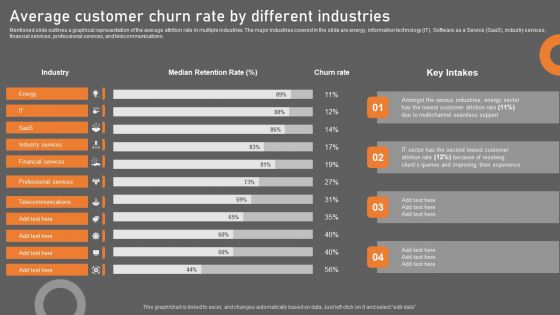
Average Customer Churn Rate By Different Industries Diagrams PDF
Mentioned slide outlines a graphical representation of the average attrition rate in multiple industries. The major industries covered in the slide are energy, information technology IT, Software as a Service SaaS, industry services, financial services, professional services, and telecommunications. Presenting this PowerPoint presentation, titled Average Customer Churn Rate By Different Industries Diagrams PDF, with topics curated by our researchers after extensive research. This editable presentation is available for immediate download and provides attractive features when used. Download now and captivate your audience. Presenting this Average Customer Churn Rate By Different Industries Diagrams PDF. Our researchers have carefully researched and created these slides with all aspects taken into consideration. This is a completely customizable Average Customer Churn Rate By Different Industries Diagrams PDF that is available for immediate downloading. Download now and make an impact on your audience. Highlight the attractive features available with our PPTs.
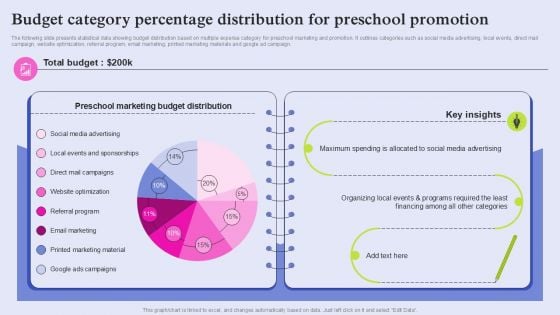
Budget Category Percentage Distribution For Preschool Promotion Graphics PDF
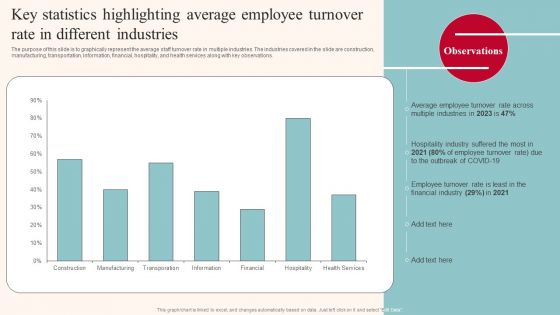
Key Statistics Highlighting Average Employee Turnover Rate In Different Industries Infographics PDF
The purpose of this slide is to graphically represent the average staff turnover rate in multiple industries. The industries covered in the slide are construction, manufacturing, transportation, information, financial, hospitality, and health services along with key observations. Want to ace your presentation in front of a live audience Our Key Statistics Highlighting Average Employee Turnover Rate In Different Industries Infographics PDF can help you do that by engaging all the users towards you. Slidegeeks experts have put their efforts and expertise into creating these impeccable powerpoint presentations so that you can communicate your ideas clearly. Moreover, all the templates are customizable, and easy to edit and downloadable. Use these for both personal and commercial use.
Go Viral Campaign Strategies To Increase Engagement Dashboard For Tracking Viral Posts Across Digital Professional PDF
This slide showcases dashboard which can help marketers track viral posts across multiple platforms. It provides details about viral views, seed views, direct, searh, referrer, network, Facebook, Twitter, etc. Slidegeeks is here to make your presentations a breeze with Go Viral Campaign Strategies To Increase Engagement Dashboard For Tracking Viral Posts Across Digital Professional PDF With our easy to use and customizable templates, you can focus on delivering your ideas rather than worrying about formatting. With a variety of designs to choose from, you are sure to find one that suits your needs. And with animations and unique photos, illustrations, and fonts, you can make your presentation pop. So whether you are giving a sales pitch or presenting to the board, make sure to check out Slidegeeks first.
Viral Marketing Techniques To Increase Annual Business Sales Dashboard For Tracking Viral Posts Across Digital Structure PDF
This slide showcases dashboard which can help marketers track viral posts across multiple platforms. It provides details about viral views, seed views, direct, searh, referrer, network, Facebook, Twitter, etc. Coming up with a presentation necessitates that the majority of the effort goes into the content and the message you intend to convey. The visuals of a PowerPoint presentation can only be effective if it supplements and supports the story that is being told. Keeping this in mind our experts created Viral Marketing Techniques To Increase Annual Business Sales Dashboard For Tracking Viral Posts Across Digital Structure PDF to reduce the time that goes into designing the presentation. This way, you can concentrate on the message while our designers take care of providing you with the right template for the situation.
Buzz Marketing Strategies To Expand Campaign Reach Dashboard For Tracking Viral Posts Across Digital Channels Introduction PDF
This slide showcases dashboard which can help marketers track viral posts across multiple platforms. It provides details about viral views, seed views, direct, searh, referrer, network, Facebook, Twitter, etc. Boost your pitch with our creative Buzz Marketing Strategies To Expand Campaign Reach Dashboard For Tracking Viral Posts Across Digital Channels Introduction PDF. Deliver an awe inspiring pitch that will mesmerize everyone. Using these presentation templates you will surely catch everyones attention. You can browse the ppts collection on our website. We have researchers who are experts at creating the right content for the templates. So you do not have to invest time in any additional work. Just grab the template now and use them.
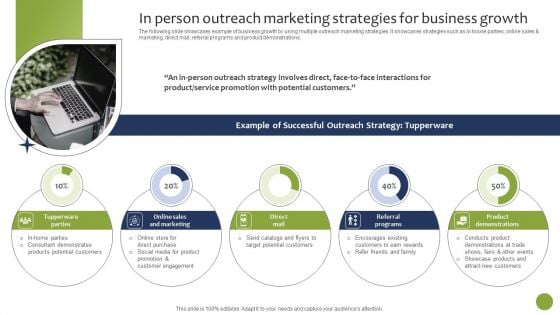
In Person Outreach Marketing Strategies For Business Growth Guidelines PDF
The following slide showcases example of business growth by using multiple outreach marketing strategies. It showcases strategies such as in house parties, online sales and marketing, direct mail, referral programs and product demonstrations. The In Person Outreach Marketing Strategies For Business Growth Guidelines PDF is a compilation of the most recent design trends as a series of slides. It is suitable for any subject or industry presentation, containing attractive visuals and photo spots for businesses to clearly express their messages. This template contains a variety of slides for the user to input data, such as structures to contrast two elements, bullet points, and slides for written information. Slidegeeks is prepared to create an impression.
Cashless Payment Strategies To Enhance Business Performance Impact Of Credit And Debit Payment On Business Icons PDF
Mentioned slide demonstrates impact of multiple card payment adoption on business growth. It includes key metrics such as business sales, customer satisfaction, convenience and expense tracking accuracy. This modern and well-arranged Cashless Payment Strategies To Enhance Business Performance Impact Of Credit And Debit Payment On Business Icons PDF provides lots of creative possibilities. It is very simple to customize and edit with the Powerpoint Software. Just drag and drop your pictures into the shapes. All facets of this template can be edited with Powerpoint, no extra software is necessary. Add your own material, put your images in the places assigned for them, adjust the colors, and then you can show your slides to the world, with an animated slide included.
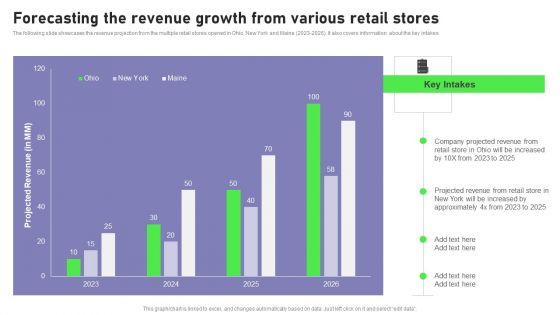
Retail Outlet Opening To Enhance Product Sale Forecasting The Revenue Growth Download PDF
The following slide showcases the revenue projection from the multiple retail stores opened in Ohio, New York and Maine 2023 to 2026. It also covers information about the key intakes. Here you can discover an assortment of the finest PowerPoint and Google Slides templates. With these templates, you can create presentations for a variety of purposes while simultaneously providing your audience with an eye catching visual experience. Download Retail Outlet Opening To Enhance Product Sale Forecasting The Revenue Growth Download PDF to deliver an impeccable presentation. These templates will make your job of preparing presentations much quicker, yet still, maintain a high level of quality. Slidegeeks has experienced researchers who prepare these templates and write high quality content for you. Later on, you can personalize the content by editing the Retail Outlet Opening To Enhance Product Sale Forecasting The Revenue Growth Download PDF.
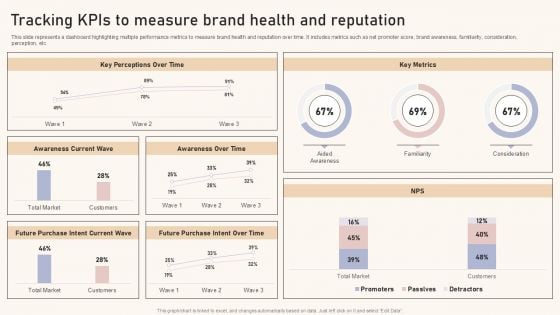
Optimizing Brand Equity Through Strategic Management Tracking Kpis To Measure Brand Health And Reputation Topics PDF
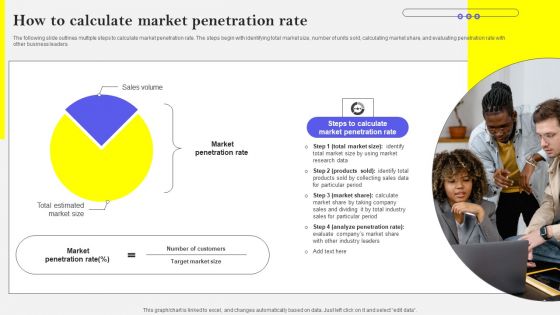
How To Calculate Market Penetration Rate Information PDF
The following slide outlines multiple steps to calculate market penetration rate. The steps begin with identifying total market size, number of units sold, calculating market share, and evaluating penetration rate with other business leaders. Are you in need of a template that can accommodate all of your creative concepts This one is crafted professionally and can be altered to fit any style. Use it with Google Slides or PowerPoint. Include striking photographs, symbols, depictions, and other visuals. Fill, move around, or remove text boxes as desired. Test out color palettes and font mixtures. Edit and save your work, or work with colleagues. Download How To Calculate Market Penetration Rate Information PDF and observe how to make your presentation outstanding. Give an impeccable presentation to your group and make your presentation unforgettable.
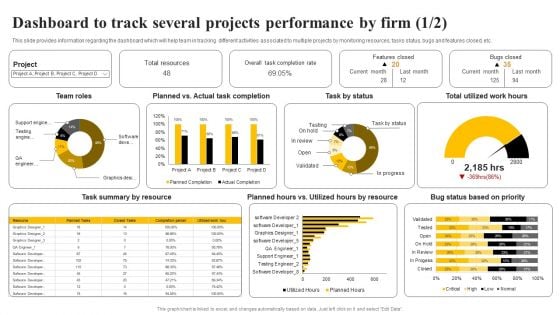
Organizational Plan Overview Dashboard To Track Several Projects Performance By Firm Pictures PDF
This slide provides information regarding the dashboard which will help team in tracking different activities associated to multiple projects by monitoring resources, tasks status, bugs and features closed, etc. This Organizational Plan Overview Dashboard To Track Several Projects Performance By Firm Pictures PDF from Slidegeeks makes it easy to present information on your topic with precision. It provides customization options, so you can make changes to the colors, design, graphics, or any other component to create a unique layout. It is also available for immediate download, so you can begin using it right away. Slidegeeks has done good research to ensure that you have everything you need to make your presentation stand out. Make a name out there for a brilliant performance.

Stages Of Growth Ppt PowerPoint Presentation Complete Deck With Slides
Boost your confidence and team morale with this well-structured Stages Of Growth Ppt PowerPoint Presentation Complete Deck With Slides. This prefabricated set gives a voice to your presentation because of its well-researched content and graphics. Our experts have added all the components very carefully, thus helping you deliver great presentations with a single click. Not only that, it contains a set of seventeen slides that are designed using the right visuals, graphics, etc. Various topics can be discussed, and effective brainstorming sessions can be conducted using the wide variety of slides added in this complete deck. Apart from this, our PPT design contains clear instructions to help you restructure your presentations and create multiple variations. The color, format, design anything can be modified as deemed fit by the user. Not only this, it is available for immediate download. So, grab it now.
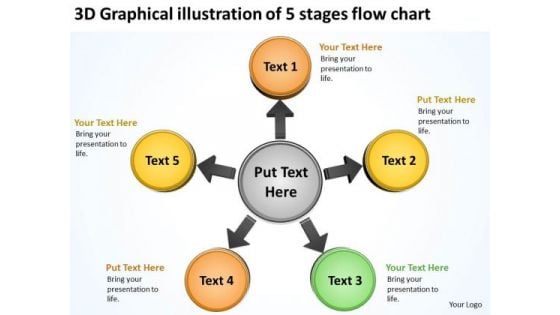
Graphical Illustration Of 5 Stages Flow Chart Circular Process PowerPoint Slides
We present our graphical illustration of 5 stages flow chart Circular Process PowerPoint Slides.Use our Circle Charts PowerPoint Templates because your business and plans for its growth consist of processes that are highly co-related. Use our Arrows PowerPoint Templates because you have analysed the illness and know the need. Use our Business PowerPoint Templates because your thoughts are pointed and sharp as arrows. Use our Shapes PowerPoint Templates because this slide can help to bullet point your views. Download our Flow Charts PowerPoint Templates because this diagram provides multiple options for taking in and making sense of information.Use these PowerPoint slides for presentations relating to agreeable, agreeableness, art, blue, business, chart, circle, clip, clipart, conscientiousness, diagram, extraversion, factor, five, flow, graph, graphic, green, illustration, infographic, model, neuroticism, openness, personality, pointed, process, psychological, psychology, red, segment, segmented, shape, stages, star, trait, transparency. The prominent colors used in the PowerPoint template are Orange, Yellow, Green. Customers tell us our graphical illustration of 5 stages flow chart Circular Process PowerPoint Slides are Precious. PowerPoint presentation experts tell us our art PowerPoint templates and PPT Slides are Upbeat. People tell us our graphical illustration of 5 stages flow chart Circular Process PowerPoint Slides are Precious. People tell us our business PowerPoint templates and PPT Slides are Elegant. Customers tell us our graphical illustration of 5 stages flow chart Circular Process PowerPoint Slides are Clever. People tell us our art PowerPoint templates and PPT Slides are Multicolored. Raise the bar with our Graphical Illustration Of 5 Stages Flow Chart Circular Process PowerPoint Slides. You will come out on top.
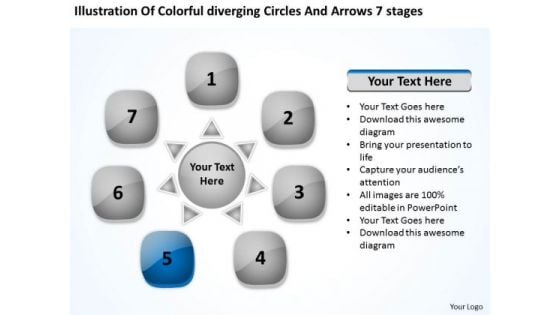
Colorful Diverging Circles And Arrows 7 Stages Cycle Spoke Chart PowerPoint Slides
We present our colorful diverging circles and arrows 7 stages Cycle Spoke Chart PowerPoint Slides.Download and present our Ring charts PowerPoint Templates because You can Double your output with our PowerPoint Templates and Slides. They make beating deadlines a piece of cake. Present our Marketing PowerPoint Templates because The marketplace is the merger of your dreams and your ability. Use our Arrows PowerPoint Templates because there is a vision, a need you can meet. Download our Shapes PowerPoint Templates because you can Transmit your thoughts via our slides and proud your team to action. Use our Business PowerPoint Templates because a brainwave has occurred to you after review. You know just how to push the graph skyward.Use these PowerPoint slides for presentations relating to Business, button, chart, circle, company, data, design, diagram, direction, document, financial, glossy, goals, graph, management, market, marketing, model, multicolored, multiple, navigation, network, options, plan, presentation, process, results, shiny, sphere, statistics. The prominent colors used in the PowerPoint template are Red, Gray, Black. People tell us our colorful diverging circles and arrows 7 stages Cycle Spoke Chart PowerPoint Slides are Classic. We assure you our data PowerPoint templates and PPT Slides will generate and maintain the level of interest you desire. They will create the impression you want to imprint on your audience. PowerPoint presentation experts tell us our colorful diverging circles and arrows 7 stages Cycle Spoke Chart PowerPoint Slides are Second to none. You can be sure our company PowerPoint templates and PPT Slides are Fun. Professionals tell us our colorful diverging circles and arrows 7 stages Cycle Spoke Chart PowerPoint Slides are Fabulous. Use our chart PowerPoint templates and PPT Slides are Bright. Experience a high with our Colorful Diverging Circles And Arrows 7 Stages Cycle Spoke Chart PowerPoint Slides. Let your thoughts soar in the air.
Skill Will Matrix To Improve Effectiveness Ppt PowerPoint Presentation Complete With Slides
Boost your confidence and team morale with this well-structured Skill Will Matrix To Improve Effectiveness Ppt PowerPoint Presentation Complete With Slides. This prefabricated set gives a voice to your presentation because of its well-researched content and graphics. Our experts have added all the components very carefully, thus helping you deliver great presentations with a single click. Not only that, it contains a set of forteen slides that are designed using the right visuals, graphics, etc. Various topics can be discussed, and effective brainstorming sessions can be conducted using the wide variety of slides added in this complete deck. Apart from this, our PPT design contains clear instructions to help you restructure your presentations and create multiple variations. The color, format, design anything can be modified as deemed fit by the user. Not only this, it is available for immediate download. So, grab it now.
Workflow Management Icon Ppt PowerPoint Presentation Complete Deck With Slides
Boost your confidence and team morale with this well-structured Workflow Management Icon Ppt PowerPoint Presentation Complete Deck With Slides. This prefabricated set gives a voice to your presentation because of its well-researched content and graphics. Our experts have added all the components very carefully, thus helping you deliver great presentations with a single click. Not only that, it contains a set of twelve slides that are designed using the right visuals, graphics, etc. Various topics can be discussed, and effective brainstorming sessions can be conducted using the wide variety of slides added in this complete deck. Apart from this, our PPT design contains clear instructions to help you restructure your presentations and create multiple variations. The color, format, design anything can be modified as deemed fit by the user. Not only this, it is available for immediate download. So, grab it now.

Data Governance Operational Framework Ppt PowerPoint Presentation Complete Deck With Slides
Boost your confidence and team morale with this well-structured Data Governance Operational Framework Ppt PowerPoint Presentation Complete Deck With Slides. This prefabricated set gives a voice to your presentation because of its well-researched content and graphics. Our experts have added all the components very carefully, thus helping you deliver great presentations with a single click. Not only that, it contains a set of fifteen slides that are designed using the right visuals, graphics, etc. Various topics can be discussed, and effective brainstorming sessions can be conducted using the wide variety of slides added in this complete deck. Apart from this, our PPT design contains clear instructions to help you restructure your presentations and create multiple variations. The color, format, design anything can be modified as deemed fit by the user. Not only this, it is available for immediate download. So, grab it now.
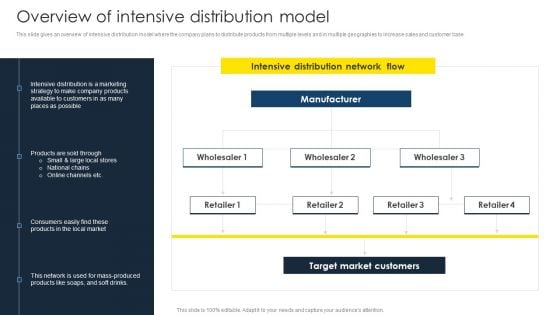
Optimize Business Sales Overview Of Intensive Distribution Model Professional PDF
This slide gives an overview of intensive distribution model where the company plans to distribute products from multiple levels and in multiple geographies to increase sales and customer base. Do you have an important presentation coming up Are you looking for something that will make your presentation stand out from the rest Look no further than Optimize Business Sales Overview Of Intensive Distribution Model Professional PDF. With our professional designs, you can trust that your presentation will pop and make delivering it a smooth process. And with Slidegeeks, you can trust that your presentation will be unique and memorable. So why wait Grab Optimize Business Sales Overview Of Intensive Distribution Model Professional PDF today and make your presentation stand out from the rest.
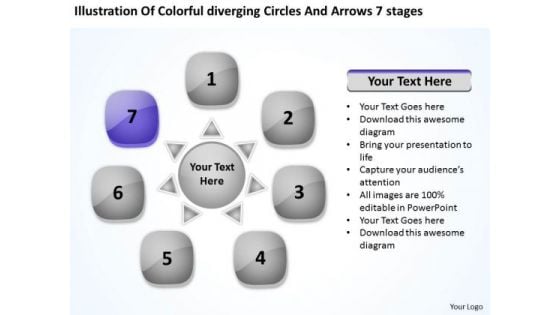
Colorful Diverging Circles And Arrows 7 Stages Circular Layout Chart PowerPoint Templates
We present our colorful diverging circles and arrows 7 stages Circular Layout Chart PowerPoint templates.Download our Process and flows PowerPoint Templates because it unravels each one for your audience while setting key timelines as you go along. Use our Business PowerPoint Templates because you are ready to flap your wings and launch off. All poised are you to touch the sky with glory. Download our Marketing PowerPoint Templates because customer satisfaction is a mantra of the marketplace. Building a loyal client base is an essential element of your business. Use our Flow charts PowerPoint Templates because the structure of our templates allows you to effectively highlight the key issues concerning the growth of your business. Use our Shapes PowerPoint Templates because you should Emphasise the process of your business or corporate growth.Use these PowerPoint slides for presentations relating to Business, button, catalog, chart, circle, company, data, design, diagram, direction, document, financial, glossy, goals, graph, junction, management, market, marketing, model, multicolored, multiple, navigation, network, options, plan, presentation, process, results, shiny, sphere, statistics. The prominent colors used in the PowerPoint template are Yellow, Gray, Black. People tell us our colorful diverging circles and arrows 7 stages Circular Layout Chart PowerPoint templates are Stylish. We assure you our chart PowerPoint templates and PPT Slides are Whimsical. PowerPoint presentation experts tell us our colorful diverging circles and arrows 7 stages Circular Layout Chart PowerPoint templates are Wonderful. You can be sure our chart PowerPoint templates and PPT Slides are Bright. Professionals tell us our colorful diverging circles and arrows 7 stages Circular Layout Chart PowerPoint templates are Majestic. Use our diagram PowerPoint templates and PPT Slides are Liberated. Make it a festival of ideas with our Colorful Diverging Circles And Arrows 7 Stages Circular Layout Chart PowerPoint Templates. Your audience will be up for a celebration.
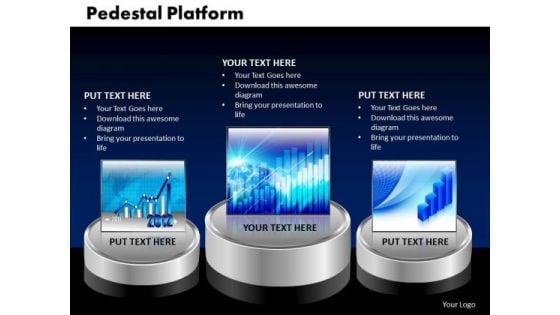
PowerPoint Slide Pedestal Platform Growth Ppt Slides
PowerPoint Slide pedestal platform Growth PPT Slides-The knowledge and understanding about how to respond to different situations is distributed across multiple people. Convey this messgae with this pedestal diagram. -PowerPoint Slide pedestal platform Growth PPT Slides-3d, Award, Best, Ceremony, Challenge, Champion, Chance, Competition, Concept, contest, Dais, Different, Final, Finish, First, Level, Light, Opportunity, Pedestal, Places, Platforms, Podium, Popular, Red, Reward, Sport, Success, Target, Victory, White, Win, Winners Hand your team the perfect strategy with our PowerPoint Slide Pedestal Platform Growth Ppt Slides. Try us out and see what a difference our templates make.

Attributes Graph Budget Cost Ppt PowerPoint Presentation Complete Deck With Slides
Boost your confidence and team morale with this well-structured attributes graph budget cost ppt powerpoint presentation complete deck with slides. This prefabricated set gives a voice to your presentation because of its well-researched content and graphics. Our experts have added all the components very carefully, thus helping you deliver great presentations with a single click. Not only that, it contains a set of ten slides that are designed using the right visuals, graphics, etc. Various topics can be discussed, and effective brainstorming sessions can be conducted using the wide variety of slides added in this complete deck. Apart from this, our PPT design contains clear instructions to help you restructure your presentations and create multiple variations. The color, format, design anything can be modified as deemed fit by the user. Not only this, it is available for immediate download. So, grab it now.

Pie Graph Layer Marketing Expenditure Production Process Ppt PowerPoint Presentation Complete Deck With Slides
Boost your confidence and team morale with this well-structured pie graph layer marketing expenditure production process ppt powerpoint presentation complete deck with slides. This prefabricated set gives a voice to your presentation because of its well-researched content and graphics. Our experts have added all the components very carefully, thus helping you deliver great presentations with a single click. Not only that, it contains a set of twelve slides that are designed using the right visuals, graphics, etc. Various topics can be discussed, and effective brainstorming sessions can be conducted using the wide variety of slides added in this complete deck. Apart from this, our PPT design contains clear instructions to help you restructure your presentations and create multiple variations. The color, format, design anything can be modified as deemed fit by the user. Not only this, it is available for immediate download. So, grab it now.
Artificial Intelligence Machine Learning Deep Learning Why Use Decision Tree Machine Learning Algorithm Ppt PowerPoint Presentation Icon Visuals PDF
Presenting this set of slides with name artificial intelligence machine learning deep learning why use decision tree machine learning algorithm ppt powerpoint presentation icon visuals pdf. This is a five stage process. The stages in this process are decision trees, implementation, response variable, multiple categories, response. This is a completely editable PowerPoint presentation and is available for immediate download. Download now and impress your audience.
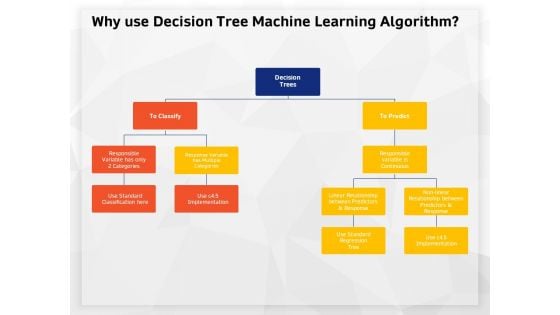
AI High Tech PowerPoint Templates Why Use Decision Tree Machine Learning Algorithm Download PDF
Presenting this set of slides with name ai high tech powerpoint templates why use decision tree machine learning algorithm download pdf. This is a five stage process. The stages in this process are responsible variable is continuous, response variable has multiple categories, linear relationship between predictors and response. This is a completely editable PowerPoint presentation and is available for immediate download. Download now and impress your audience.
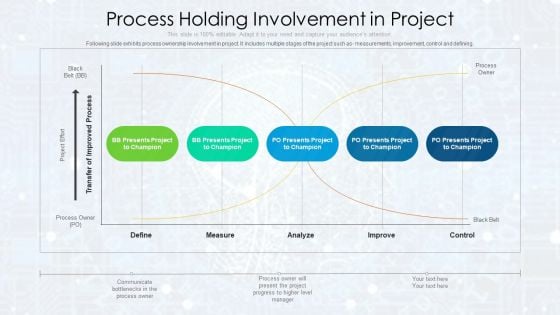
Process Holding Involvement In Project Ppt PowerPoint Presentation File Designs PDF
Following slide exhibits process ownership involvement in project. It includes multiple stages of the project such as measurements, improvement, control and defining. Presenting process holding involvement in project ppt powerpoint presentation file designs pdf to dispense important information. This template comprises five stages. It also presents valuable insights into the topics including measure, analyze, improve, control. This is a completely customizable PowerPoint theme that can be put to use immediately. So, download it and address the topic impactfully.
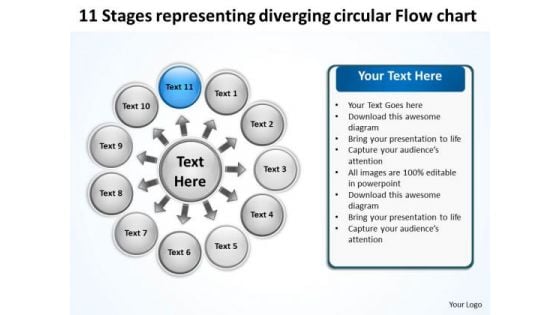
Stages Representing Diverging Circular Flow Chart Ppt 12 Cycle Layout Process PowerPoint Templates
We present our stages representing diverging circular flow chart ppt 12 Cycle Layout Process PowerPoint templates.Download our Circle Charts PowerPoint Templates because very often it is important to reflect on the basics. Present our Spheres PowerPoint Templates because you are the Champion of your team shall anoint. Download our Shapes PowerPoint Templates because this template with an image of helps you chart the course of your presentation. Download and present our Business PowerPoint Templates because maximising sales of your product is the intended destination. Download and present our Process and Flows PowerPoint Templates because this is Aesthetically designed to make a great first impression this template highlights .Use these PowerPoint slides for presentations relating to Arrow, Business, Chart, Circle, Design, Diagram, Direction, Document, Market, Marketing, Multiple, Navigation, Network, Options, Plan, Presentation, Process, Results, Shiny, Sphere, Statistics, Structure, Template, Three, Vector, Website, Wheel. The prominent colors used in the PowerPoint template are Blue, White, Gray. People tell us our stages representing diverging circular flow chart ppt 12 Cycle Layout Process PowerPoint templates are designed to make your presentations professional. People tell us our Chart PowerPoint templates and PPT Slides are Classic. The feedback we get is that our stages representing diverging circular flow chart ppt 12 Cycle Layout Process PowerPoint templates are Radiant. Presenters tell us our Design PowerPoint templates and PPT Slides have awesome images to get your point across. Customers tell us our stages representing diverging circular flow chart ppt 12 Cycle Layout Process PowerPoint templates are Delightful. The feedback we get is that our Direction PowerPoint templates and PPT Slides are Fashionable. Bonds created with our Stages Representing Diverging Circular Flow Chart Ppt 12 Cycle Layout Process PowerPoint Templates will never break. They ensure alliances endure.
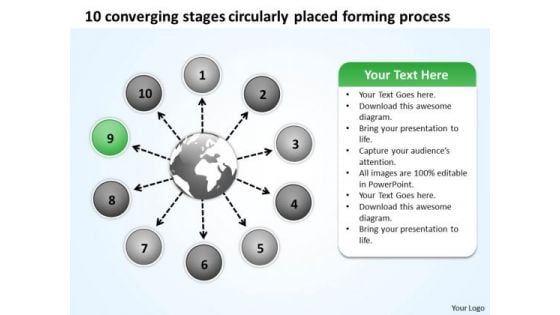
Stages Circularly Placed Forming Process Ppt Flow Arrow Chart PowerPoint Templates
We present our stages circularly placed forming process ppt Flow Arrow Chart PowerPoint templates.Download and present our Arrows PowerPoint Templates because the ideas and plans are on your finger tips. Present our Process and Flows PowerPoint Templates because it depicts Rolling along while gathering profits along the way is the aim. Download our Business PowerPoint Templates because this diagram can set an example to enthuse your team with the passion and fervour of your ideas. Download and present our Shapes PowerPoint Templates because you can Educate your listeners on the means to keep it ticking over. Download and present our Circle Charts PowerPoint Templates because they highlight the depth of your thought process.Use these PowerPoint slides for presentations relating to Arrow, Business, Chart, Circle, Design, Diagram, Direction, Document, Market, Marketing, Multiple, Navigation, Network, Options, Plan, Presentation, Process, Results, Shiny, Sphere, Statistics, Structure, Template, Three, Vector, Website, Wheel. The prominent colors used in the PowerPoint template are Green, White, Gray. People tell us our stages circularly placed forming process ppt Flow Arrow Chart PowerPoint templates are visually appealing. People tell us our Chart PowerPoint templates and PPT Slides will impress their bosses and teams. The feedback we get is that our stages circularly placed forming process ppt Flow Arrow Chart PowerPoint templates are Amazing. Presenters tell us our Document PowerPoint templates and PPT Slides are Liberated. Customers tell us our stages circularly placed forming process ppt Flow Arrow Chart PowerPoint templates are Appealing. The feedback we get is that our Document PowerPoint templates and PPT Slides are Magnificent. Advocate ecofrindly approaches in daily business. Encourage your employees with our Stages Circularly Placed Forming Process Ppt Flow Arrow Chart PowerPoint Templates.
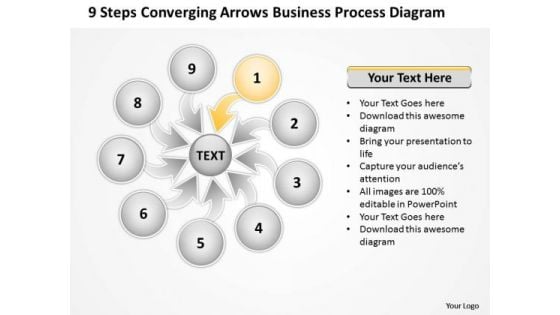
Arrows Business PowerPoint Theme Process Diagram Ppt 2 Cycle Flow Chart Templates
We present our arrows business powerpoint theme process diagram ppt 2 Cycle Flow Chart templates.Present our Business PowerPoint Templates because The foundation of the structure of your business is resilient and dependable. Convey this confidence to your colleagues and assure them of a great and enduring future. Download and present our Spheres PowerPoint Templates because you have made significant headway in this field. Download our Arrows PowerPoint Templates because you have the people in place, selected the team leaders and all are raring to go. Use our Marketing PowerPoint Templates because The marketplace is the merger of your dreams and your ability. Download our Circle Charts PowerPoint Templates because the ideas and plans are on your finger tips.Use these PowerPoint slides for presentations relating to Arrow, Business, Button, Chart, Circle, Company, Cross, Data, Design, Diagram, Direction, Document, Financial, Management, Marketing, Multiple, Plan, Presentation, Process, Results, Sphere, Template, Website, Wheel. The prominent colors used in the PowerPoint template are Yellow, White, Gray. Presenters tell us our arrows business powerpoint theme process diagram ppt 2 Cycle Flow Chart templates are Festive. We assure you our Button PowerPoint templates and PPT Slides are Adorable. Presenters tell us our arrows business powerpoint theme process diagram ppt 2 Cycle Flow Chart templates are Elegant. Use our Design PowerPoint templates and PPT Slides are Sparkling. We assure you our arrows business powerpoint theme process diagram ppt 2 Cycle Flow Chart templates are Royal. You can be sure our Circle PowerPoint templates and PPT Slides are Upbeat. Get rid of the blues with our Arrows Business PowerPoint Theme Process Diagram Ppt 2 Cycle Flow Chart Templates. Let hope and happiness flow into your mind.
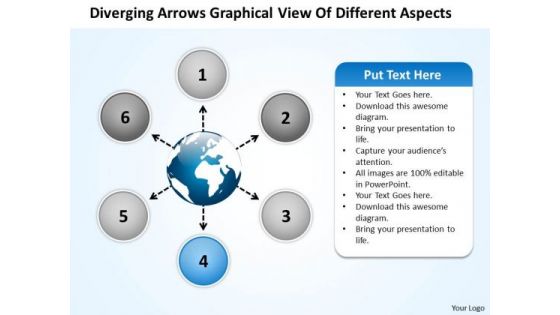
Arrows Graphical View Of Different Aspects Arrow Charts And Diagrams PowerPoint Templates
We present our arrows graphical view of different aspects arrow Charts and Diagrams PowerPoint templates.Download our Business PowerPoint Templates because the great Bald headed Eagle embodies your personality. the eagle eye to seize upon the smallest of opportunities. Download our Arrows PowerPoint Templates because it helps you to get your team in the desired sequence into the bracket. Download our Shapes PowerPoint Templates because the graphic is a symbol of growth and success. Present our Flow Charts PowerPoint Templates because this helps you to comprehend your plan to get the entire act together. Download and present our Process and Flows PowerPoint Templates because it can illustrate your chain of ideas focusing on that aspect or resource in order to enhance the quality of your product.Use these PowerPoint slides for presentations relating to Arrow, Business, Button, Chart, Circle, Company, Cross, Data, Design, Diagram, Direction, Document, Financial, Management, Marketing, Multiple, Plan, Presentation, Process, Results, Sphere, Template, Website, Wheel. The prominent colors used in the PowerPoint template are Blue, White, Gray. Presenters tell us our arrows graphical view of different aspects arrow Charts and Diagrams PowerPoint templates are Exuberant. We assure you our Cross PowerPoint templates and PPT Slides are Amazing. Presenters tell us our arrows graphical view of different aspects arrow Charts and Diagrams PowerPoint templates are the best it can get when it comes to presenting. Use our Circle PowerPoint templates and PPT Slides are Graceful. We assure you our arrows graphical view of different aspects arrow Charts and Diagrams PowerPoint templates are Second to none. You can be sure our Circle PowerPoint templates and PPT Slides are Delightful. Our Arrows Graphical View Of Different Aspects Arrow Charts And Diagrams PowerPoint Templates define the standards. Like you they excel at what they do.
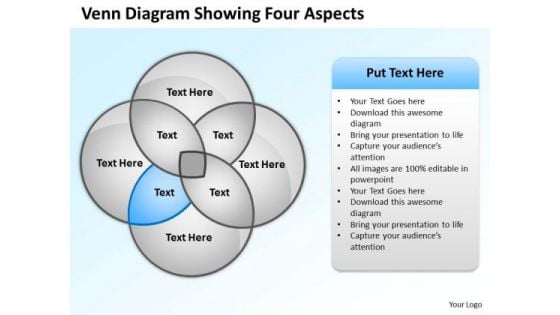
Business Organizational Chart Template Venn Diagram Showing Four Aspects PowerPoint Slides
We present our business organizational chart template venn diagram showing four aspects PowerPoint Slides.Use our Ring Charts PowerPoint Templates because Your audience will believe you are the cats whiskers. Download our Circle Charts PowerPoint Templates because You are well armed with penetrative ideas. Our PowerPoint Templates and Slides will provide the gunpowder you need. Download and present our Process and Flows PowerPoint Templates because They will Put your wonderful verbal artistry on display. Our PowerPoint Templates and Slides will provide you the necessary glam and glitter. Download and present our Flow Charts PowerPoint Templates because Our PowerPoint Templates and Slides help you meet the demand of the Market. Just browse and pick the slides that appeal to your intuitive senses. Download our Business PowerPoint Templates because Our PowerPoint Templates and Slides will let you Illuminate the road ahead to Pinpoint the important landmarks along the way.Use these PowerPoint slides for presentations relating to Business, button, catalog, chart, circle, company, cross, data, design, diagram, direction, document, financial, four, glossy, goals, graph, junction, management, market, marketing, model, multicolored, multiple, navigation, network, options, plan, presentation, process, purple, results, shiny, sphere, statistics. The prominent colors used in the PowerPoint template are Blue light, White, Gray. People tell us our business organizational chart template venn diagram showing four aspects PowerPoint Slides are effectively colour coded to prioritise your plans They automatically highlight the sequence of events you desire. PowerPoint presentation experts tell us our data PowerPoint templates and PPT Slides will impress their bosses and teams. Presenters tell us our business organizational chart template venn diagram showing four aspects PowerPoint Slides will generate and maintain the level of interest you desire. They will create the impression you want to imprint on your audience. Use our data PowerPoint templates and PPT Slides are effectively colour coded to prioritise your plans They automatically highlight the sequence of events you desire. Customers tell us our business organizational chart template venn diagram showing four aspects PowerPoint Slides are specially created by a professional team with vast experience. They diligently strive to come up with the right vehicle for your brilliant Ideas. People tell us our chart PowerPoint templates and PPT Slides are incredible easy to use. Make instructive presentations with our Business Organizational Chart Template Venn Diagram Showing Four Aspects PowerPoint Slides. Dont waste time struggling with PowerPoint. Let us do it for you.
Continuous Enhancement Icon Process Graphs Ppt PowerPoint Presentation Complete Deck With Slides
This continuous enhancement icon process graphs ppt powerpoint presentation complete deck with slides acts as backup support for your ideas, vision, thoughts, etc. Use it to present a thorough understanding of the topic. This PPT slideshow can be utilized for both in-house and outside presentations depending upon your needs and business demands. Entailing thirteen slides with a consistent design and theme, this template will make a solid use case. As it is intuitively designed, it suits every business vertical and industry. All you have to do is make a few tweaks in the content or any other component to design unique presentations. The biggest advantage of this complete deck is that it can be personalized multiple times once downloaded. The color, design, shapes, and other elements are free to modify to add personal touches. You can also insert your logo design in this PPT layout. Therefore a well-thought and crafted presentation can be delivered with ease and precision by downloading this continuous enhancement icon process graphs ppt powerpoint presentation complete deck with slides PPT slideshow.
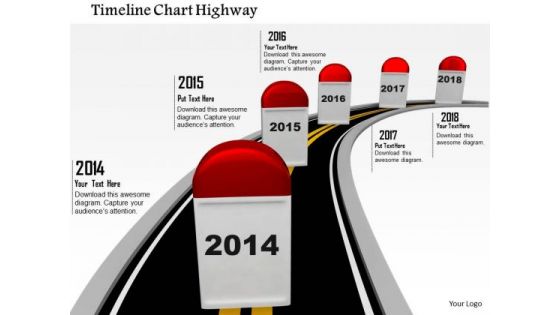
Stock Photo Timeline Chart Highway PowerPoint Slide
This image displays road with multiple milestones. This image contains continuous road with milestones in order to display timeline and yearly performance. This image may be used to present vision of a desired destination and the best road to take to reach that goal.
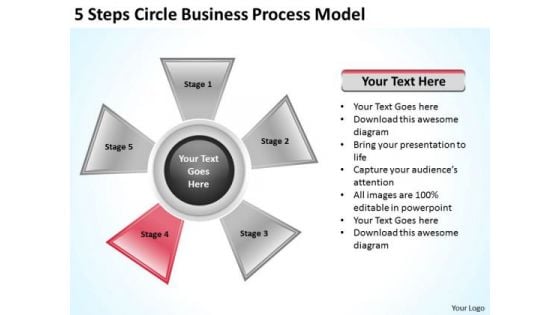
Company Business Strategy 5 Steps Circle Process Model Ppt
We present our company business strategy 5 steps circle process model ppt.Download and present our Process and Flows PowerPoint Templates because You canTake a leap off the starting blocks with our PowerPoint Templates and Slides. They will put you ahead of the competition in quick time. Use our Circle Charts PowerPoint Templates because Our PowerPoint Templates and Slides help you meet the demand of the Market. Just browse and pick the slides that appeal to your intuitive senses. Use our Flow Charts PowerPoint Templates because You aspire to touch the sky with glory. Let our PowerPoint Templates and Slides provide the fuel for your ascent. Download our Ring Charts PowerPoint Templates because Our PowerPoint Templates and Slides will let you Clearly mark the path for others to follow. Download and present our Business PowerPoint Templates because You canTake a leap off the starting blocks with our PowerPoint Templates and Slides. They will put you ahead of the competition in quick time.Use these PowerPoint slides for presentations relating to Graph, process, chart, market, network, cross, statistics, model, document, junction, business, plan, vector, presentation, glossy, diagram, circle, brochure, data, stock, marketing, management, wheel, multicolored, four, box, sphere, options, catalog, shiny, direction, design, text,company, navigation, financial, structure, multiple, button, goals, results. The prominent colors used in the PowerPoint template are Red, Gray, Black. Environmental awareness is the call to answer. Our Company Business Strategy 5 Steps Circle Process Model Ppt will fit the bill.
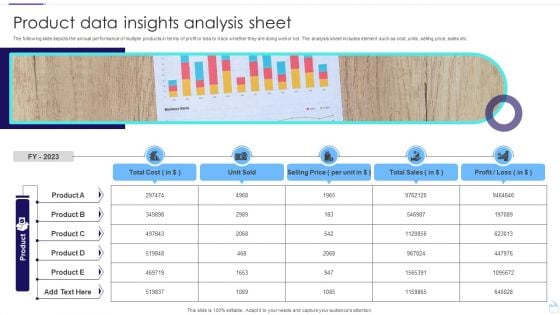
Product Data Insights Analysis Sheet Infographics PDF
The following slide depicts the annual performance of multiple products in terms of profit or loss to track whether they are doing well or not. The analysis sheet includes element such as cost, units, selling price, sales etc. Pitch your topic with ease and precision using this Product Data Insights Analysis Sheet Infographics PDF. This layout presents information on Unit Sold, Selling Price, Total Sales. It is also available for immediate download and adjustment. So, changes can be made in the color, design, graphics or any other component to create a unique layout.
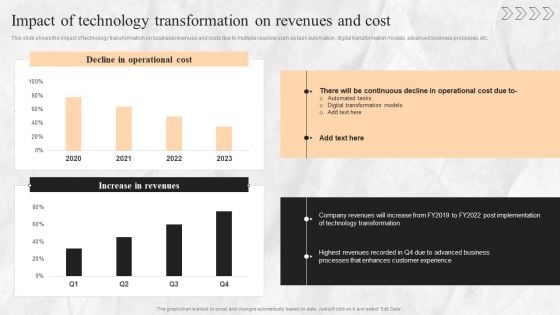
Digital Transition Plan For Managing Business Impact Of Technology Transformation On Revenues And Cost Slides PDF
This slide shows the impact of technology transformation on business revenues and costs due to multiple reasons such as task automation, digital transformation models, advanced business processes, etc. Make sure to capture your audiences attention in your business displays with our gratis customizable Digital Transition Plan For Managing Business Impact Of Technology Transformation On Revenues And Cost Slides PDF. These are great for business strategies, office conferences, capital raising or task suggestions. If you desire to acquire more customers for your tech business and ensure they stay satisfied, create your own sales presentation with these plain slides.
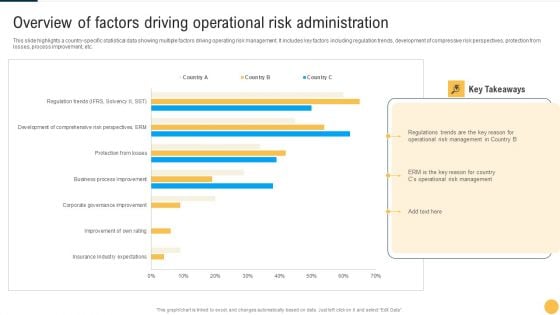
Overview Of Factors Driving Operational Risk Administration Summary PDF
This slide highlights a country specific statistical data showing multiple factors driving operating risk management. It includes key factors including regulation trends, development of compressive risk perspectives, protection from losses, process improvement, etc. Pitch your topic with ease and precision using this Overview Of Factors Driving Operational Risk Administration Summary PDF This layout presents information on Key Takeaways, Risk Management, Administration. It is also available for immediate download and adjustment. So, changes can be made in the color, design, graphics or any other component to create a unique layout.
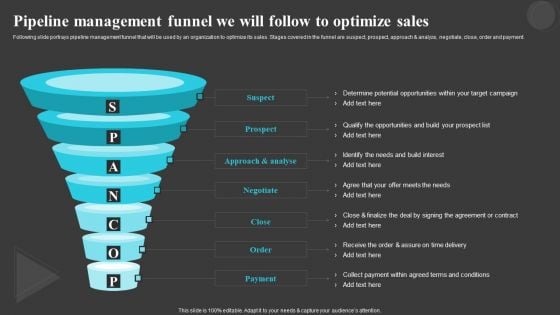
Pipeline Management Funnel We Will Follow Creating And Offering Multiple Product Ranges In New Business Professional PDF
If you are looking for a format to display your unique thoughts, then the professionally designed Pipeline Management Funnel We Will Follow Creating And Offering Multiple Product Ranges In New Business Professional PDF is the one for you. You can use it as a Google Slides template or a PowerPoint template. Incorporate impressive visuals, symbols, images, and other charts. Modify or reorganize the text boxes as you desire. Experiment with shade schemes and font pairings. Alter, share or cooperate with other people on your work. Download Pipeline Management Funnel We Will Follow Creating And Offering Multiple Product Ranges In New Business Professional PDF and find out how to give a successful presentation. Present a perfect display to your team and make your presentation unforgettable.
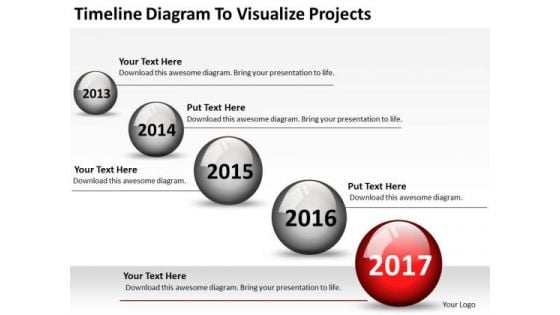
Business Model Diagrams Timeline To Visualize Projects Ppt PowerPoint Templates
We present our business model diagrams timeline to visualize projects ppt PowerPoint templates.Use our Business PowerPoint Templates because You are an avid believer in ethical practices. Highlight the benefits that accrue with our PowerPoint Templates and Slides. Use our Circle Charts PowerPoint Templates because Our PowerPoint Templates and Slides will definately Enhance the stature of your presentation. Adorn the beauty of your thoughts with their colourful backgrounds. Download our Process and Flows PowerPoint Templates because Our PowerPoint Templates and Slides will Embellish your thoughts. They will help you illustrate the brilliance of your ideas. Download our Ring Charts PowerPoint Templates because Our PowerPoint Templates and Slides are Clear and concise. Use them and dispel any doubts your team may have. Download and present our Flow Charts PowerPoint Templates because Our PowerPoint Templates and Slides are endowed to endure. Ideas conveyed through them will pass the test of time.Use these PowerPoint slides for presentations relating to 3d, ability, activity, arrows, circle, colorful, dots, figure, find, graphic, illustration, series, solution, spot, trainer, vector, visual, white background, chart, circle, circular, circulation, concept, conceptual, pointing, procedure, template. The prominent colors used in the PowerPoint template are Red, Gray, White. Exercise options with our Business Model Diagrams Timeline To Visualize Projects Ppt PowerPoint Templates. Find answers to multiple challenges.

IT Organization Structure Ppt PowerPoint Presentation Complete Deck With Slides
This IT Organization Structure Ppt PowerPoint Presentation Complete Deck With Slides acts as backup support for your ideas, vision, thoughts, etc. Use it to present a thorough understanding of the topic. This PPT slideshow can be utilized for both in-house and outside presentations depending upon your needs and business demands. Entailing eleven slides with a consistent design and theme, this template will make a solid use case. As it is intuitively designed, it suits every business vertical and industry. All you have to do is make a few tweaks in the content or any other component to design unique presentations. The biggest advantage of this complete deck is that it can be personalized multiple times once downloaded. The color, design, shapes, and other elements are free to modify to add personal touches. You can also insert your logo design in this PPT layout. Therefore a well-thought and crafted presentation can be delivered with ease and precision by downloading this IT Organization Structure Ppt PowerPoint Presentation Complete Deck With Slides PPT slideshow.
Process Landscape Diagram Ppt PowerPoint Presentation Complete Deck
This Process Landscape Diagram Ppt PowerPoint Presentation Complete Deck acts as backup support for your ideas, vision, thoughts, etc. Use it to present a thorough understanding of the topic. This PPT slideshow can be utilized for both in-house and outside presentations depending upon your needs and business demands. Entailing tweleve slides with a consistent design and theme, this template will make a solid use case. As it is intuitively designed, it suits every business vertical and industry. All you have to do is make a few tweaks in the content or any other component to design unique presentations. The biggest advantage of this complete deck is that it can be personalized multiple times once downloaded. The color, design, shapes, and other elements are free to modify to add personal touches. You can also insert your logo design in this PPT layout. Therefore a well-thought and crafted presentation can be delivered with ease and precision by downloading this Process Landscape Diagram Ppt PowerPoint Presentation Complete Deck PPT slideshow.
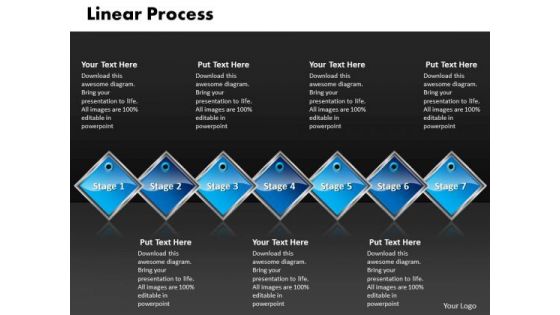
Ppt Blue Diamond Linear Communication Process PowerPoint Presentation 7 Stages Templates
PPT blue diamond linear communication process powerpoint presentation 7 stages Templates-This PowerPoint Diagram allows quick visual View of multiple Steps. This is the most efficient method of transferring knowledge from the presenter to the audience-PPT blue diamond linear communication process powerpoint presentation 7 stages Templates-3d, Arrow, Bevel, Blue, Boy, Bright, Circular, Concept, Design, Fancy, Funky, Graphic, Icon, Illustration, Isolated, Logo, Male, Man, Reflection, Shinning, Sign, Symbol, Vivid Set a good example with our Ppt Blue Diamond Linear Communication Process PowerPoint Presentation 7 Stages Templates. Be the benchmark for others to follow.
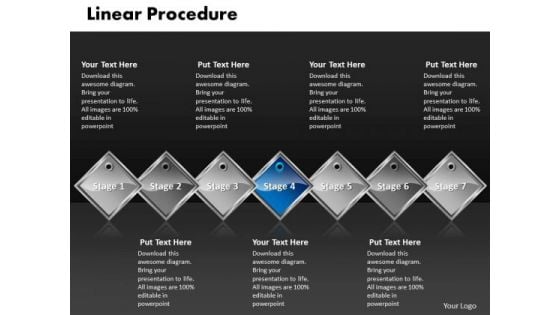
Ppt Blue Diamond Linear Procedure 7 State PowerPoint Template Diagram Templates
PPT blue diamond linear procedure 7 state powerpoint template diagram Templates-This PowerPoint Diagram allows quick visual View of multiple Steps. This is the most efficient method of transferring knowledge from the presenter to the audience-PPT blue diamond linear procedure 7 state powerpoint template diagram Templates-3d, Arrow, Bevel, Blue, Boy, Bright, Circular, Concept, Design, Fancy, Funky, Graphic, Icon, Illustration, Isolated, Logo, Male, Man, Reflection, Shinning, Sign, Symbol, Vivid Affiliate our Ppt Blue Diamond Linear Procedure 7 State PowerPoint Template Diagram Templates to your thoughts. They will develop an affinity for them.
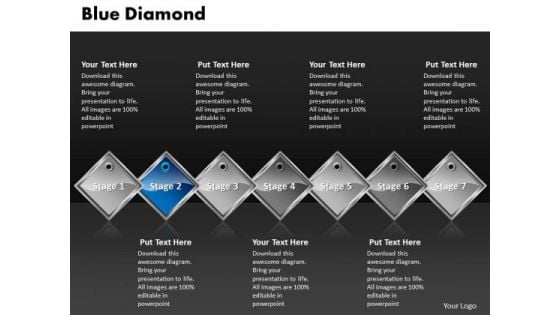
Ppt Blue Diamond Linear Series 7 Power Point Stage PowerPoint Templates
PPT blue diamond linear series 7 power point stage PowerPoint Templates-This PowerPoint Diagram allows quick visual View of multiple Steps. This is the most efficient method of transferring knowledge from the presenter to the audience-PPT blue diamond linear series 7 power point stage PowerPoint Templates-3d, Arrow, Bevel, Blue, Boy, Bright, Circular, Concept, Design, Fancy, Funky, Graphic, Icon, Illustration, Isolated, Logo, Male, Man, Reflection, Shinning, Sign, Symbol, Vivid Bask in the attention our Ppt Blue Diamond Linear Series 7 Power Point Stage PowerPoint Templates attract. Their excellence will rub off on you.
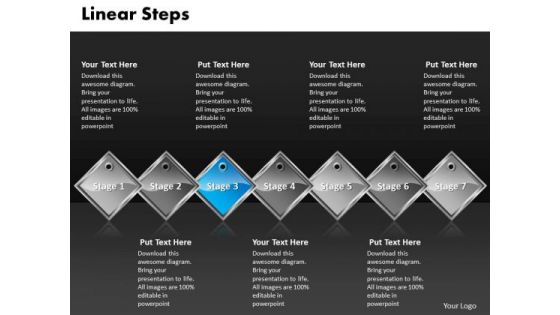
Ppt Blue Diamond Linear Steps Working With Slide Numbers 7 Phase Diagram PowerPoint Templates
PPT blue diamond linear steps working with slide numbers 7 phase diagram PowerPoint Templates-This PowerPoint Diagram allows quick visual View of multiple Steps. This is the most efficient method of transferring knowledge from the presenter to the audience-PPT blue diamond linear steps working with slide numbers 7 phase diagram PowerPoint Templates-3d, Arrow, Bevel, Blue, Boy, Bright, Circular, Concept, Design, Fancy, Funky, Graphic, Icon, Illustration, Isolated, Logo, Male, Man, Reflection, Shinning, Sign, Symbol, Vivid Announce plans with our Ppt Blue Diamond Linear Steps Working With Slide Numbers 7 Phase Diagram PowerPoint Templates. You will come out on top.
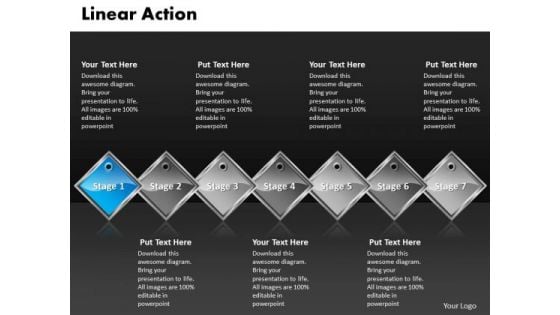
Ppt Royal Blue PowerPoint Background Diamond Linear Action 7 Stages Templates
PPT royal blue powerpoint background diamond linear action 7 stages Templates-This PowerPoint Diagram allows quick visual View of multiple Steps. This is the most efficient method of transferring knowledge from the presenter to the audience-PPT royal blue powerpoint background diamond linear action 7 stages Templates-3d, Arrow, Bevel, Blue, Boy, Bright, Circular, Concept, Design, Fancy, Funky, Graphic, Icon, Illustration, Isolated, Logo, Male, Man, Reflection, Shinning, Sign, Symbol, Vivid Very little falls beyond the purview of our Ppt Royal Blue PowerPoint Background Diamond Linear Action 7 Stages Templates.They have the answer for most everything.
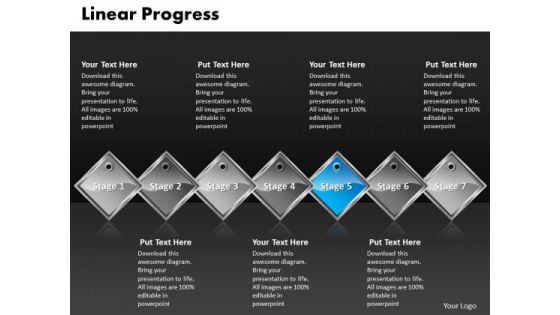
Ppt Royal Blue PowerPoint Background Diamond Linear Progress 7 Stages Templates
PPT royal blue powerpoint background diamond linear progress 7 stages Templates-This PowerPoint Diagram allows quick visual View of multiple Steps. This is the most efficient method of transferring knowledge from the presenter to the audience-PPT royal blue powerpoint background diamond linear progress 7 stages Templates-3d, Arrow, Bevel, Blue, Boy, Bright, Circular, Concept, Design, Fancy, Funky, Graphic, Icon, Illustration, Isolated, Logo, Male, Man, Reflection, Shinning, Sign, Symbol, Vivid Our Ppt Royal Blue PowerPoint Background Diamond Linear Progress 7 Stages Templates define the standards. Like you they excel at what they do.


 Continue with Email

 Home
Home


