Target Icon
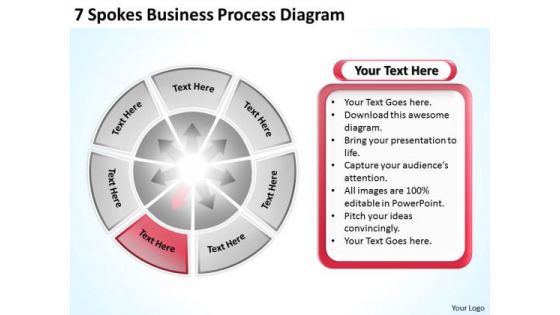
PowerPoint Templates Process Diagram Business Plan Slides
We present our powerpoint templates process diagram business plan Slides.Use our Circle Charts PowerPoint Templates because Our PowerPoint Templates and Slides will weave a web of your great ideas. They are gauranteed to attract even the most critical of your colleagues. Download and present our Business PowerPoint Templates because Our PowerPoint Templates and Slides will provide weight to your words. They will bring out the depth of your thought process. Present our Shapes PowerPoint Templates because Our PowerPoint Templates and Slides will let you Hit the target. Go the full distance with ease and elan. Download our Flow Charts PowerPoint Templates because You should Kick up a storm with our PowerPoint Templates and Slides. The heads of your listeners will swirl with your ideas. Present our Process and Charts PowerPoint Templates because Our PowerPoint Templates and Slides will let you Leave a lasting impression to your audiences. They possess an inherent longstanding recall factor.Use these PowerPoint slides for presentations relating to Chart, flow, life, flowchart, network, isolated, business concept, refresh, future, arrow, recycling, symbol, diagram, circle, wealth, ring, recycle, sick, graph, cycle, illustration, icon, connection, money, circle, arrow, diagram, motion, illness, goal graph, work, plan for success, job, gradient. The prominent colors used in the PowerPoint template are Red, Gray, White. Solidify your views with our PowerPoint Templates Process Diagram Business Plan Slides. Download without worries with our money back guaranteee.
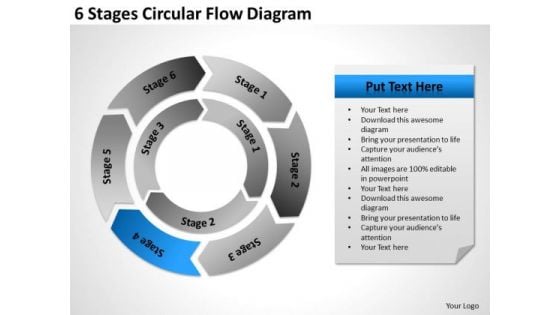
6 Stages Circular Flow Diagram Business Plan For PowerPoint Slides
We present our 6 stages circular flow diagram business plan for PowerPoint Slides.Use our Arrows PowerPoint Templates because Our PowerPoint Templates and Slides will steer your racing mind. Hit the right buttons and spur on your audience. Download our Circle Charts PowerPoint Templates because Our PowerPoint Templates and Slides will let your words and thoughts hit bullseye everytime. Download our Signs PowerPoint Templates because Our PowerPoint Templates and Slides will let you Hit the target. Go the full distance with ease and elan. Download and present our Shapes PowerPoint Templates because It will let you Set new benchmarks with our PowerPoint Templates and Slides. They will keep your prospects well above par. Present our Process and Flows PowerPoint Templates because Our PowerPoint Templates and Slides will let you meet your Deadlines.Use these PowerPoint slides for presentations relating to chart, flow, diagram, circular, process, arrow, chevron, set, isometric, segmented, circle, recycle, graphic, pieces, illustration, icon, blue, 3d. The prominent colors used in the PowerPoint template are Blue, Gray, Black. Start driving performance improvement with our 6 Stages Circular Flow Diagram Business Plan For PowerPoint Slides. They will make you look good.
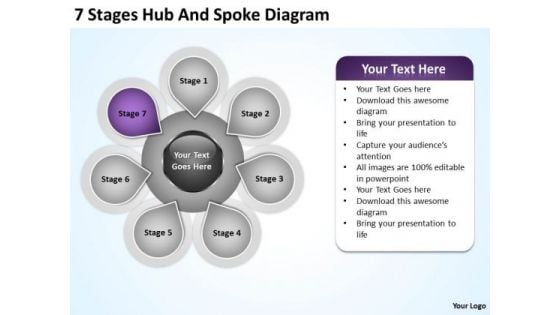
Business Analyst Diagrams 7 Stages Hub And Spoke Ppt PowerPoint Templates
We present our business analyst diagrams 7 stages hub and spoke ppt PowerPoint templates.Download and present our Arrow PowerPoint Templates because Our PowerPoint Templates and Slides will let you Hit the target. Go the full distance with ease and elan. Download and present our Business PowerPoint Templates because You can Channelise the thoughts of your team with our PowerPoint Templates and Slides. Urge them to focus on the goals you have set. Use our Circle Charts PowerPoint Templates because Our PowerPoint Templates and Slides will help you be quick off the draw. Just enter your specific text and see your points hit home. Use our Flow Charts PowerPoint Templates because Our PowerPoint Templates and Slides are aesthetically designed to attract attention. We gaurantee that they will grab all the eyeballs you need. Use our Shapes PowerPoint Templates because you should Experience excellence with our PowerPoint Templates and Slides. They will take your breath away.Use these PowerPoint slides for presentations relating to Abstract, arrows, blank, business, central, centralized, chart, circle, circular, circulation, concept, conceptual, diagram, executive, icon, idea, illustration, management, organization, pointing, procedure, process, six, circles, strategy, template. The prominent colors used in the PowerPoint template are Purple, Gray, Black. Give due attention to key features. Filter out the unnecessary with our Business Analyst Diagrams 7 Stages Hub And Spoke Ppt PowerPoint Templates.
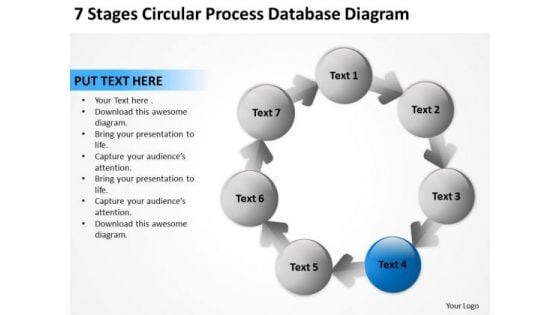
7 Stages Circular Process Database Diagram Home Care Business Plan PowerPoint Templates
We present our 7 stages circular process database diagram home care business plan PowerPoint templates.Use our Circle Charts PowerPoint Templates because They will bring a lot to the table. Their alluring flavours will make your audience salivate. Download our Arrows PowerPoint Templates because Our PowerPoint Templates and Slides help you meet the demand of the Market. Just browse and pick the slides that appeal to your intuitive senses. Download our Flows Charts PowerPoint Templates because Our PowerPoint Templates and Slides has conjured up a web of all you need with the help of our great team. Use them to string together your glistening ideas. Present our Business PowerPoint Templates because You can Channelise the thoughts of your team with our PowerPoint Templates and Slides. Urge them to focus on the goals you have set. Download and present our Process and Flows PowerPoint Templates because Our PowerPoint Templates and Slides will let you Hit the target. Go the full distance with ease and elan.Use these PowerPoint slides for presentations relating to Abstract, arrow, art, background, ball, blue, business, button, chart, circle, circular, clip, company, concept, cycle, diagram, edit, editable, element, green, guide,icon, leader, management, marketing, model, numbers, organization, plans, point, presentation, purple, red, report, representation, seven, sphere, stakeholder,team, text, tool, vector, white. The prominent colors used in the PowerPoint template are Blue, Gray, White. Examine all possibilities with our 7 Stages Circular Process Database Diagram Home Care Business Plan PowerPoint Templates. Give every option a real close look.
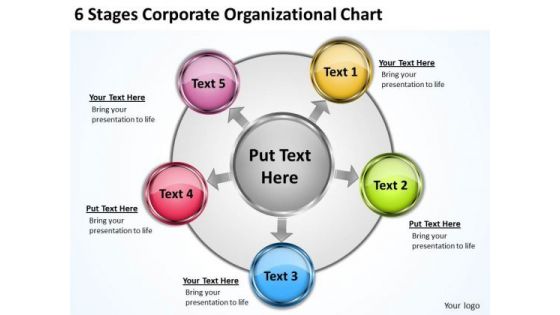
Business Development Process Diagram Chart PowerPoint Templates Ppt Backgrounds For Slides
We present our business development process diagram chart PowerPoint templates PPT backgrounds for slides.Download and present our Circle Charts PowerPoint Templates because Our PowerPoint Templates and Slides will let you Hit the target. Go the full distance with ease and elan. Present our Business PowerPoint Templates because Our PowerPoint Templates and Slides will weave a web of your great ideas. They are gauranteed to attract even the most critical of your colleagues. Download and present our Shapes PowerPoint Templates because Our PowerPoint Templates and Slides will steer your racing mind. Hit the right buttons and spur on your audience. Download our Technology PowerPoint Templates because Our PowerPoint Templates and Slides will help you be quick off the draw. Just enter your specific text and see your points hit home. Present our Arrows PowerPoint Templates because Our PowerPoint Templates and Slides will let you Hit the right notes. Watch your audience start singing to your tune.Use these PowerPoint slides for presentations relating to Arrow, Blue, Business, Chart, Circle, Complex, Concept, Data, Diagram, Financial, Graph, Graphic, Green, Icon, Illustration, Isolated, Model, Pink, Process, Purple, Red, Round, Set, Shape, Vector, Wheel, White, Yellow. The prominent colors used in the PowerPoint template are Green, Yellow, Red. Check the air with our Business Development Process Diagram Chart PowerPoint Templates Ppt Backgrounds For Slides. Your feelers will recieve appropriate responses.
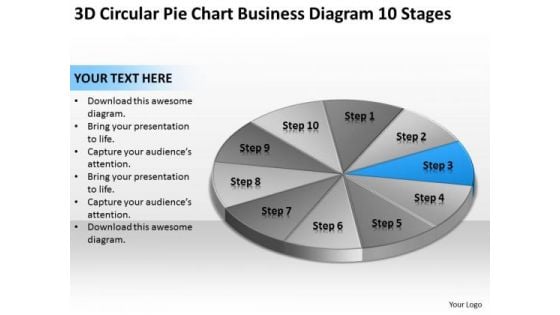
Chart Business Diagram 10 Stages Ppt Non Profit Plan Template PowerPoint Slides
We present our chart business diagram 10 stages ppt non profit plan template PowerPoint Slides.Use our Process and Flows PowerPoint Templates because You should Ascend the ladder of success with ease. Our PowerPoint Templates and Slides will provide strong and sturdy steps. Use our Circle Charts PowerPoint Templates because you should Whip up a frenzy with our PowerPoint Templates and Slides. They will fuel the excitement of your team. Use our Business PowerPoint Templates because Timeline crunches are a fact of life. Meet all deadlines using our PowerPoint Templates and Slides. Download and present our Marketing PowerPoint Templates because Our PowerPoint Templates and Slides are topically designed to provide an attractive backdrop to any subject. Download and present our Shapes PowerPoint Templates because you can Add colour to your speech with our PowerPoint Templates and Slides. Your presentation will leave your audience speechless.Use these PowerPoint slides for presentations relating to Chart, pie, graph, market, economics, economy, target, business, concept, success, diagram, circle, percentage, graphic, finance, revenue, element, analysis, report, marketing, modern, illustration, icon, earnings,, growth, ratio, progress, credit, commerce, statistic. The prominent colors used in the PowerPoint template are Blue , Gray, Black. Everyday there is a new way. Stay contemporary with our Chart Business Diagram 10 Stages Ppt Non Profit Plan Template PowerPoint Slides.
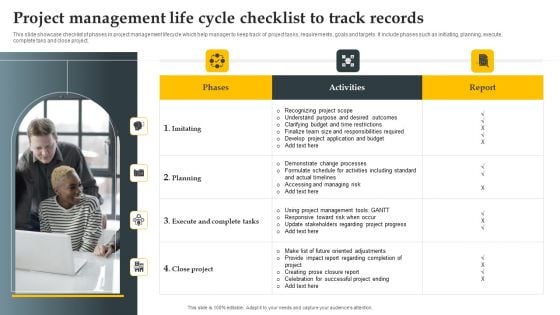
Project Management Life Cycle Checklist To Track Records Inspiration PDF
This slide showcase checklist of phases in project management lifecycle which help manager to keep track of project tasks, requirements, goals and targets. It include phases such as initiating, planning, execute, complete taks and close project. Persuade your audience using this Project Management Life Cycle Checklist To Track Records Inspiration PDF. This PPT design covers three stages, thus making it a great tool to use. It also caters to a variety of topics including Planning, Execute And Complete Tasks, Imitating. Download this PPT design now to present a convincing pitch that not only emphasizes the topic but also showcases your presentation skills.
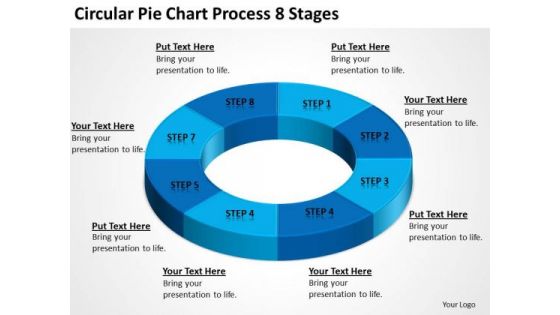
Circular Pie Chart Process 8 Stages Online Business Plan PowerPoint Templates
We present our circular pie chart process 8 stages online business plan PowerPoint templates.Use our Circle Charts PowerPoint Templates because Our PowerPoint Templates and Slides will let you meet your Deadlines. Download our Ring Charts PowerPoint Templates because Our PowerPoint Templates and Slides come in all colours, shades and hues. They help highlight every nuance of your views. Present our Shapes PowerPoint Templates because Our PowerPoint Templates and Slides are aesthetically designed to attract attention. We gaurantee that they will grab all the eyeballs you need. Download and present our Process and Flows PowerPoint Templates because Our PowerPoint Templates and Slides will let you meet your Deadlines. Use our Business PowerPoint Templates because It will mark the footprints of your journey. Illustrate how they will lead you to your desired destination.Use these PowerPoint slides for presentations relating to direction, market, percent, forward, target, achievement, flow, business, process diagram, concept, arrow, sign, success, symbol, percentage sign, arrow circle, diagram, value, percentage, finance, process, element, goal, marketing, green energy, development, price, abstract, team, management, graph, cycle, icon, chart, project, up, growth, motion, moving, company, competition, progress, profit, increase, investment, aim, financial, upwards, communication. The prominent colors used in the PowerPoint template are Blue, Blue navy, Black. Our Circular Pie Chart Process 8 Stages Online Business Plan PowerPoint Templates will be a charming discovery. They are both colorful and cute.
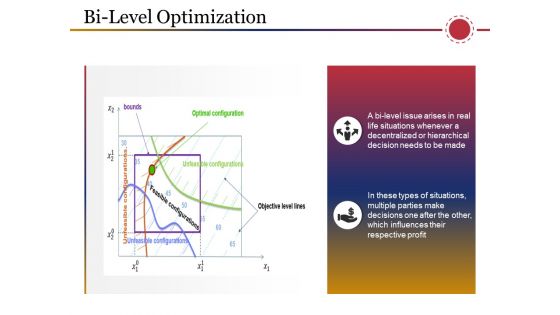
Bi Level Optimization Ppt PowerPoint Presentation Model Summary
This is a bi level optimization ppt powerpoint presentation model summary. This is a two stage process. The stages in this process are bounds, optimal configuration, objective level lines, icons, business.
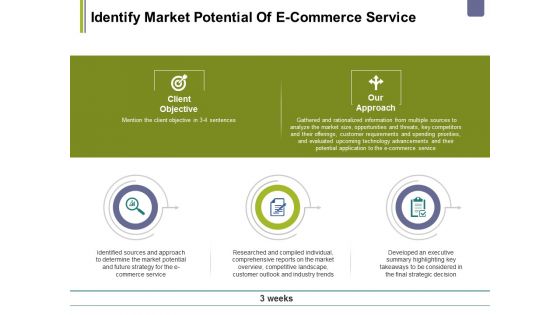
Identify Market Potential Of E Commerce Service Ppt PowerPoint Presentation Layouts Infographics
This is a identify market potential of e commerce service ppt powerpoint presentation layouts infographics. This is a three stage process. The stages in this process are client objective, our approach, weeks, business, icons.
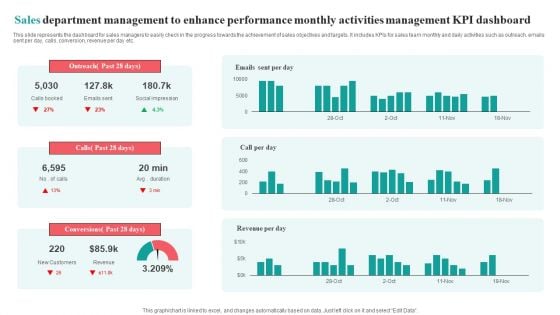
Sales Department Management To Enhance Performance Monthly Activities Management KPI Dashboard Brochure PDF
This slide represents the dashboard for sales managers to easily check in the progress towards the achievement of sales objectives and targets. It includes KPIs for sales team monthly and daily activities such as outreach, emails sent per day, calls, conversion, revenue per day etc.Pitch your topic with ease and precision using this Sales Department Management To Enhance Performance Monthly Activities Management KPI Dashboard Brochure PDF. This layout presents information on Social Impression, Conversions Past, Outreach Past. It is also available for immediate download and adjustment. So, changes can be made in the color, design, graphics or any other component to create a unique layout.
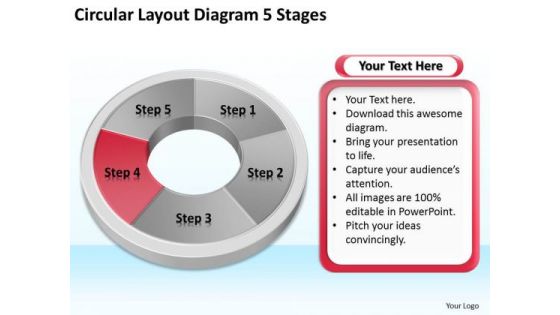
Circular Layout Diagram 5 Stages Business Plan PowerPoint Slides
We present our circular layout diagram 5 stages business plan PowerPoint Slides.Present our Flow Charts PowerPoint Templates because Our PowerPoint Templates and Slides will let you Hit the target. Go the full distance with ease and elan. Download our Circle Charts PowerPoint Templates because You can Stir your ideas in the cauldron of our PowerPoint Templates and Slides. Cast a magic spell on your audience. Use our Shapes PowerPoint Templates because Our PowerPoint Templates and Slides will give you great value for your money. Be assured of finding the best projection to highlight your words. Use our Business PowerPoint Templates because Our PowerPoint Templates and Slides are like the strings of a tennis racquet. Well strung to help you serve aces. Download and present our Process and Flows PowerPoint Templates because Our PowerPoint Templates and Slides will let you Illuminate the road ahead to Pinpoint the important landmarks along the way.Use these PowerPoint slides for presentations relating to Chart, flow, diagram, graph, circular, round, red, ring, scheme, process, isolated, loop, white, turn, five,step, rotation,recycling, presentation, teamwork, symbol, circle, recycle, ringcharts, report, result, cycle, circulation, illustration, icon, connection, section, clipart,direction, motion, progress, sticker, cyclic, continuity, repetition,. The prominent colors used in the PowerPoint template are Red, White, Gray. Our Circular Layout Diagram 5 Stages Business Plan PowerPoint Slides are a great equaliser. They take everybody to the same level.

3 Stages Pie Chart Innovation Process Business Plan Outline Template PowerPoint Templates
We present our 3 stages pie chart innovation process business plan outline template PowerPoint templates.Present our Technology PowerPoint Templates because Our PowerPoint Templates and Slides will let you Hit the target. Go the full distance with ease and elan. Download our Finance PowerPoint Templates because Our PowerPoint Templates and Slides will let you Hit the right notes. Watch your audience start singing to your tune. Present our Light Bulbs PowerPoint Templates because You can Channelise the thoughts of your team with our PowerPoint Templates and Slides. Urge them to focus on the goals you have set. Present our Circle Charts PowerPoint Templates because You can Raise a toast with our PowerPoint Templates and Slides. Spread good cheer amongst your audience. Present our Business PowerPoint Templates because Our PowerPoint Templates and Slides help you meet the demand of the Market. Just browse and pick the slides that appeal to your intuitive senses.Use these PowerPoint slides for presentations relating to Pie, chart, graphic, bulb, vector, symbol, lightbulb, diagram, light, process, element, traditional, idea, graph, illustration, icon, energy, circular, round, clipart, planning, design, clip, set, infographic, transparency, art, conceptual. The prominent colors used in the PowerPoint template are Pink, Yellow, Gray. Advocate your ideas with our 3 Stages Pie Chart Innovation Process Business Plan Outline Template PowerPoint Templates. The audience will admire your fervour.
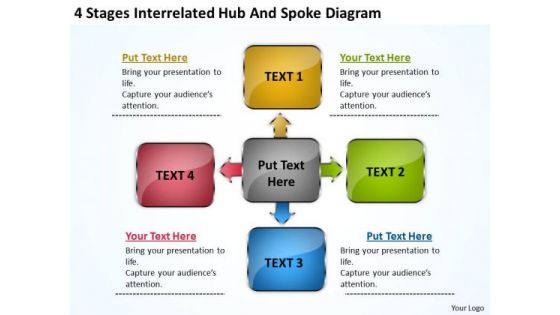
Sample Business PowerPoint Presentation Interrelated Hub And Spoke Diagram Slides
We present our sample business powerpoint presentation interrelated hub and spoke diagram Slides.Present our Business PowerPoint Templates because Our PowerPoint Templates and Slides are topically designed to provide an attractive backdrop to any subject. Download our Arrows PowerPoint Templates because Our PowerPoint Templates and Slides will give good value for money. They also have respect for the value of your time. Download our Flow Charts PowerPoint Templates because Our PowerPoint Templates and Slides will let you Leave a lasting impression to your audiences. They possess an inherent longstanding recall factor. Use our Boxes PowerPoint Templates because Our PowerPoint Templates and Slides will let you Hit the target. Go the full distance with ease and elan. Use our Shapes PowerPoint Templates because You can Connect the dots. Fan expectations as the whole picture emerges.Use these PowerPoint slides for presentations relating to Abstract, arrows, blank, business, centralized, chart, circle, circular, circulation, concept, conceptual, converging, design, diagram, executive, icon, idea, illustration, management, model, pointing, procedure, process, radial, radiating, relationship, resource, sequence, four, square, strategy, template. The prominent colors used in the PowerPoint template are Orange, Green, Gray. Get the approval of your audience with our Sample Business PowerPoint Presentation Interrelated Hub And Spoke Diagram Slides. Dont pass up this opportunity to shine.
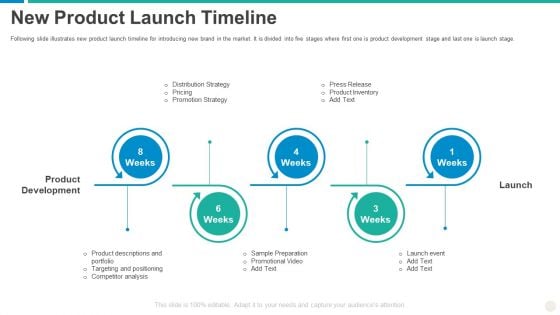
Establishing Successful Brand Strategy To Captivate Consumers New Product Launch Timeline Diagrams PDF
Following slide illustrates new product launch timeline for introducing new brand in the market. It is divided into five stages where first one is product development stage and last one is launch stage. Presenting establishing successful brand strategy to captivate consumers new product launch timeline diagrams pdf to provide visual cues and insights. Share and navigate important information on five stages that need your due attention. This template can be used to pitch topics like strategy, portfolio, targeting, inventory, pricing. In addtion, this PPT design contains high resolution images, graphics, etc, that are easily editable and available for immediate download.
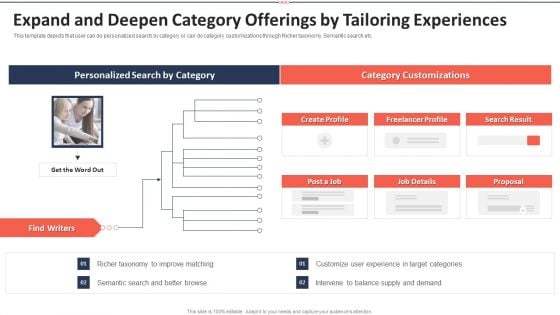
Upwork Investor Financing Expand And Deepen Category Offerings By Tailoring Experiences Diagrams PDF
This template depicts that user can do personalized search by category or can do category customizations through Richer taxonomy, Semantic search etc. Presenting upwork investor financing expand and deepen category offerings by tailoring experiences diagrams pdf to provide visual cues and insights. Share and navigate important information on one stages that need your due attention. This template can be used to pitch topics like target, category customizations, taxonomy, freelancer profile. In addtion, this PPT design contains high resolution images, graphics, etc, that are easily editable and available for immediate download.
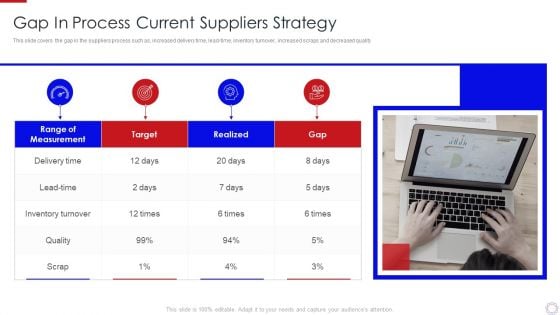
Major Strategies To Nurture Effective Vendor Association Gap In Process Diagrams PDF
This slide covers the gap in the suppliers process such as, increased delivery time, lead-time, inventory turnover, increased scraps and decreased quality. Presenting Major Strategies To Nurture Effective Vendor Association Gap In Process Diagrams PDF to provide visual cues and insights. Share and navigate important information on four stages that need your due attention. This template can be used to pitch topics like range of measurement, target, gap. In addition, this PPT design contains high resolution images, graphics, etc, that are easily editable and available for immediate download.
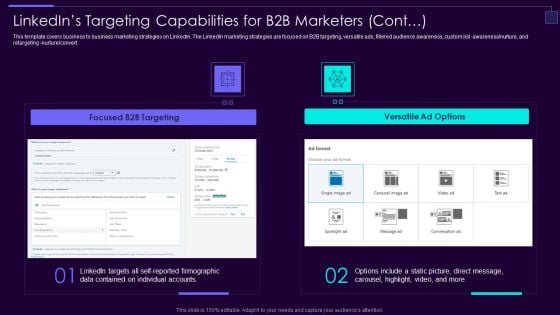
Social Media Brand Promotion Instructions Playbook Linkedins For B2B Marketers Cont Diagrams PDF
This template covers business to business marketing strategies on LinkedIn. The LinkedIn marketing strategies are focused B2B targeting, versatile ads, filtered audience awareness, custom list awareness or nurture, and retargeting nurture or convert.Deliver and pitch your topic in the best possible manner with this Social Media Brand Promotion Instructions Playbook Linkedins For B2B Marketers Cont Diagrams PDF Use them to share invaluable insights on Filtered Audience, Awareness Or Nurture, Retargeting Nurture and impress your audience. This template can be altered and modified as per your expectations. So, grab it now.
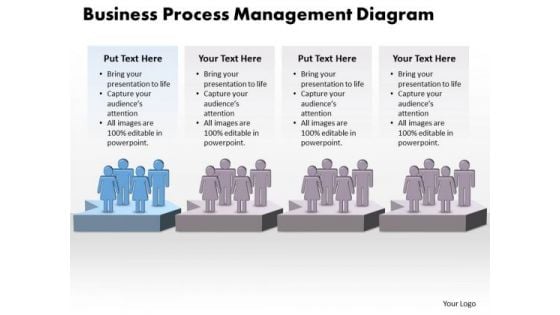
Success PowerPoint Template Business Process Management Diagram Business Design
We present our success PowerPoint template business process management diagram business design. Use our People PowerPoint Templates because, creating a winner is your passion and dream. Use our Arrows PowerPoint Templates because, Illuminate the spiritual brilliance of Jesus and shower the love for mankind he showed even while being crucified. Use our Shapes PowerPoint Templates because, which of late have been proving to be a hassle. Use our Communication PowerPoint Templates because, your quicksilver ideas are the arrows in your quiver. Use our Business PowerPoint Templates because; Lay down the fundamentals to build upon. Use these PowerPoint slides for presentations relating to abstract, achievement, aim, arrow, business, chart, communication, company, competition, concept, cycle, development, diagram, financial, flow, graph, growth, icon, marketing, sign, price, process, profit, progress, project, shape, sign, success, symbol, target, team. The prominent colors used in the PowerPoint template are Blue, Gray, and Black Our environment needs our care. Convey your concern with our Success PowerPoint Template Business Process Management Diagram Business Design.
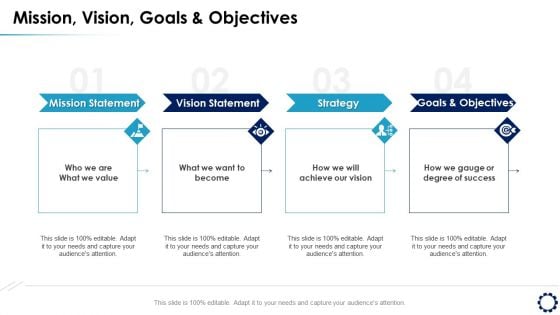
Business Expansion Framework Mission Vision Goals And Objectives Ppt Outline Themes PDF
Presenting this set of slides with name business expansion framework mission vision goals and objectives ppt outline themes pdf. This is a four stage process. The stages in this process are mission statement, vision statement, strategy, goals and objectives. This is a completely editable PowerPoint presentation and is available for immediate download. Download now and impress your audience.

Stages Of Pie Chart Data Interpretation Business Plan Template PowerPoint Templates
We present our stages of pie chart data interpretation business plan template PowerPoint templates.Download and present our Circle Charts PowerPoint Templates because You can Stir your ideas in the cauldron of our PowerPoint Templates and Slides. Cast a magic spell on your audience. Download our Marketing PowerPoint Templates because Our PowerPoint Templates and Slides will let you Hit the target. Go the full distance with ease and elan. Use our Business PowerPoint Templates because Our PowerPoint Templates and Slides are truly out of this world. Even the MIB duo has been keeping tabs on our team. Download our Shapes PowerPoint Templates because Watching this your Audience will Grab their eyeballs, they wont even blink. Download our Process and Flows PowerPoint Templates because It will Give impetus to the hopes of your colleagues. Our PowerPoint Templates and Slides will aid you in winning their trust.Use these PowerPoint slides for presentations relating to achievement, analysis, background, bank, banking, business, calculation, chart, circle, commerce, commercial, commission, concept, credit, crisis, debt, deposit, design, detail, diagram, earnings, economics, economy, element, finance, goal, gold, golden, graph, graphic, growth, icon, idea, illustration, income, increase, invest, isolated, level, loss, market, marketing, metal, modern, money, new, object, part, percent, percentage, pie, plot, politics, profit, progress, ratio, reflection, reflective. The prominent colors used in the PowerPoint template are Blue, Gray, Black. Feed their curiosity with our Stages Of Pie Chart Data Interpretation Business Plan Template PowerPoint Templates. Arouse expectations with your thoughts.
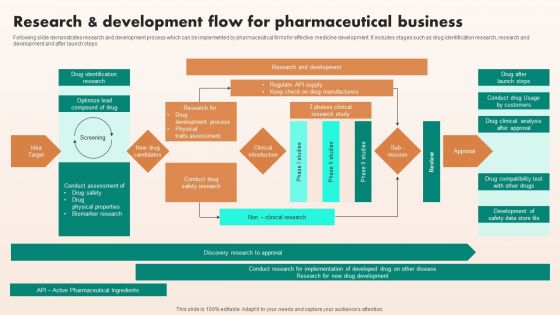
Research And Development Flow For Pharmaceutical Business Infographics PDF
Following slide demonstrates research and development process which can be implemented by pharmaceutical firms for effective medicine development. It includes stages such as drug identification research, research and development and after launch steps. Presenting Research And Development Flow For Pharmaceutical Business Infographics PDF to dispense important information. This template comprises one stages. It also presents valuable insights into the topics including Idea Target, Clinical Introduction, New Drug Candidates, Sub Mission, Approval. This is a completely customizable PowerPoint theme that can be put to use immediately. So, download it and address the topic impactfully.
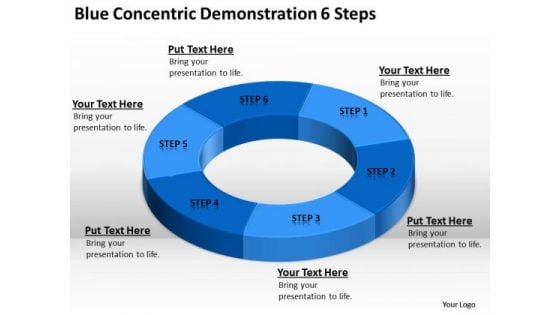
Blue Concentric Demonstration 6 Steps Writing Simple Business Plan PowerPoint Slides
We present our blue concentric demonstration 6 steps writing simple business plan PowerPoint Slides.Use our Circle Charts PowerPoint Templates because You aspire to touch the sky with glory. Let our PowerPoint Templates and Slides provide the fuel for your ascent. Download and present our Ring Charts PowerPoint Templates because Our PowerPoint Templates and Slides are created with admirable insight. Use them and give your group a sense of your logical mind. Download and present our Shapes PowerPoint Templates because They will bring a lot to the table. Their alluring flavours will make your audience salivate. Download and present our Process and Flows PowerPoint Templates because Our PowerPoint Templates and Slides offer you the needful to organise your thoughts. Use them to list out your views in a logical sequence. Download and present our Business PowerPoint Templates because Our PowerPoint Templates and Slides will embellish your thoughts. See them provide the desired motivation to your team.Use these PowerPoint slides for presentations relating to direction, market, percent, forward, target, achievement, flow, business, process diagram, concept, arrow, sign, success, symbol, percentage sign, arrow circle, diagram, value, percentage, finance, process, element, goal, marketing, green energy, development, price, abstract, team, management, graph, cycle, icon, chart, project, up, growth, motion, moving, company, competition, progress, profit, increase, investment, aim, financial, upwards, communication. The prominent colors used in the PowerPoint template are Blue, Blue navy, Black. Our Blue Concentric Demonstration 6 Steps Writing Simple Business Plan PowerPoint Slides are really considerate. They give everyone equal attention.
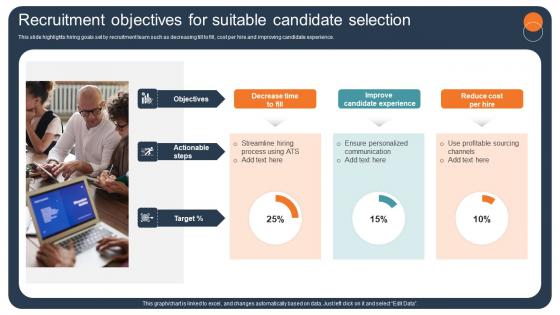
Transforming Recruitment Process Recruitment Objectives For Suitable Candidate CRP DK SS
This slide highlights hiring goals set by recruitment team such as decreasing till to fill, cost per hire and improving candidate experience. Do you know about Slidesgeeks Transforming Recruitment Process Recruitment Objectives For Suitable Candidate CRP DK SS These are perfect for delivering any kind od presentation. Using it, create PowerPoint presentations that communicate your ideas and engage audiences. Save time and effort by using our pre-designed presentation templates that are perfect for a wide range of topic. Our vast selection of designs covers a range of styles, from creative to business, and are all highly customizable and easy to edit. Download as a PowerPoint template or use them as Google Slides themes. This slide highlights hiring goals set by recruitment team such as decreasing till to fill, cost per hire and improving candidate experience.
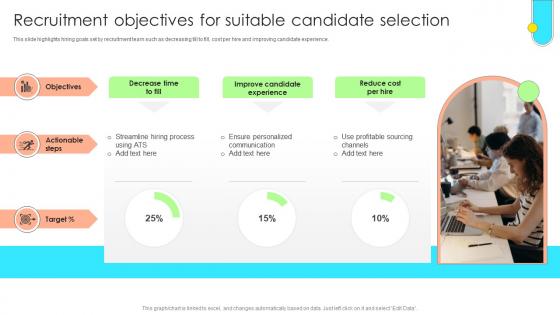
Data Driven Approach To Optimise Recruitment Objectives For Suitable Candidate CRP SS V
This slide highlights hiring goals set by recruitment team such as decreasing till to fill, cost per hire and improving candidate experience. Do you know about Slidesgeeks Data Driven Approach To Optimise Recruitment Objectives For Suitable Candidate CRP SS V These are perfect for delivering any kind od presentation. Using it, create PowerPoint presentations that communicate your ideas and engage audiences. Save time and effort by using our pre-designed presentation templates that are perfect for a wide range of topic. Our vast selection of designs covers a range of styles, from creative to business, and are all highly customizable and easy to edit. Download as a PowerPoint template or use them as Google Slides themes. This slide highlights hiring goals set by recruitment team such as decreasing till to fill, cost per hire and improving candidate experience.
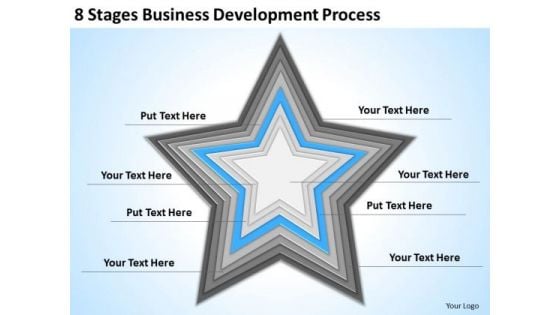
8 Stages Business Development Process Ppt Examples Of Plan PowerPoint Slides
We present our 8 stages business development process ppt examples of plan PowerPoint Slides.Present our Advertising PowerPoint Templates because Our PowerPoint Templates and Slides are created with admirable insight. Use them and give your group a sense of your logical mind. Present our Leadership PowerPoint Templates because Our PowerPoint Templates and Slides will let you Hit the target. Go the full distance with ease and elan. Use our Business PowerPoint Templates because You can Inspire your team with our PowerPoint Templates and Slides. Let the force of your ideas flow into their minds. Download and present our Stars PowerPoint Templates because Our PowerPoint Templates and Slides will let you Hit the right notes. Watch your audience start singing to your tune. Present our Process and Flows PowerPoint Templates because Our PowerPoint Templates and Slides will help you be quick off the draw. Just enter your specific text and see your points hit home.Use these PowerPoint slides for presentations relating to Arrow, flow, process, life, diagram, system, business, work, eco, green, vector, flowchart, 3d, white, model, life-cycle, schema, natural, step, organic, flow-chart, concept, bio, success, environmental, circle, recycle, ecology, graphic, work flow, idea, development, management, cycle, chart, strategy, research, iterative, evaluate, design, spiral, method, quality, infographic, control, act, fresh, nature. The prominent colors used in the PowerPoint template are Blue, Gray, Black. The audience will be hard put to find fault. Our 8 Stages Business Development Process Ppt Examples Of Plan PowerPoint Slides ensure accuracy of thought.
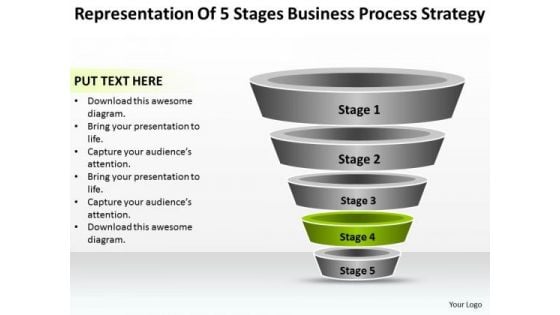
Free Business Charts Of 5 Stages Process Strategy PowerPoint Templates
We present our free business charts of 5 stages process strategy PowerPoint templates.Download our Marketing PowerPoint Templates because Our PowerPoint Templates and Slides will let you Hit the right notes. Watch your audience start singing to your tune. Download our Business PowerPoint Templates because You will get more than you ever bargained for. Present our Layers PowerPoint Templates because They will bring a lot to the table. Their alluring flavours will make your audience salivate. Use our Funnels PowerPoint Templates because You canTake a leap off the starting blocks with our PowerPoint Templates and Slides. They will put you ahead of the competition in quick time. Present our cones PowerPoint Templates because You are working at that stage with an air of royalty. Let our PowerPoint Templates and Slides be the jewels in your crown.Use these PowerPoint slides for presentations relating to 2, 3, 3d, 4, 5, Analyses, Analytics, Analyze, Analyzing, Blank, Blue, Business, Buying, Channel, Chart, Cone, Conversion, Diagram, Drawing, Five, Flow, Four, Funnel, Graphics, Icon, Illustration, Internet, Lead, Level, Marketing, Part, Pipe, Purchase, Sale, Seven, Six, Slice, Sliced, Stage, Strategy, Target, Three, Traffic, Two, Vector, Web, Web marketing,. The prominent colors used in the PowerPoint template are Green, Gray, White. Bring the advantages to the fore with our Free Business Charts Of 5 Stages Process Strategy PowerPoint Templates. Your audience will get off the fence.

Product Profitability Comparison Matrix Table PowerPoint Templates
Product Profitability Comparison Matrix Table PowerPoint Templates-These high quality powerpoint pre-designed slides and powerpoint templates have been carefully created by our professional team to help you impress your audience. All slides have been created and are 100% editable in powerpoint. Each and every property of any graphic - color, size, orientation, shading, outline etc. can be modified to help you build an effective powerpoint presentation. Any text can be entered at any point in the powerpoint template or slide. Simply DOWNLOAD, TYPE and PRESENT!-These PowerPoint presentation slides can be used to represent concepts relating to--abstract, achievement, aim, arrow, background, business, chart, communication, company, competition, concept, design, development, diagram, direction, finance, financial, forecast, forward, goal, graph, graphic, growth, icon, illustration, increase, investment, leader, leadership, marketing, motion, moving, orange, path, price, process, profit, progress, shape, sign, success, symbol, target, team, teamwork, up, upwards-Product Profitability Comparison Matrix Table PowerPoint Templates Expose the farce with our Product Profitability Comparison Matrix Table PowerPoint Templates. Bring the facts to the brim.
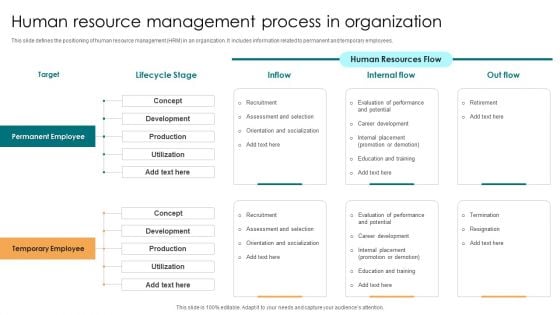
Human Resource Management Process In Organization Brochure PDF
This slide defines the positioning of human resource management HRM in an organization. It includes information related to permanent and temporary employees. Persuade your audience using this Human Resource Management Process In Organization Brochure PDF. This PPT design covers two stages, thus making it a great tool to use. It also caters to a variety of topics including Target, Lifecycle Stage, Inflow, Internal Flow. Download this PPT design now to present a convincing pitch that not only emphasizes the topic but also showcases your presentation skills.
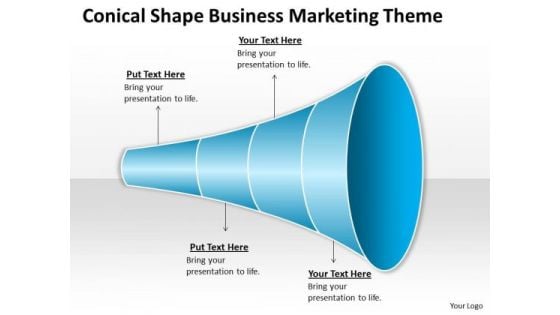
Conical Shape Business Marketing Theme Ppt Plan Companies PowerPoint Slides
We present our conical shape business marketing theme ppt plan companies PowerPoint Slides.Download our Marketing PowerPoint Templates because They will Put the wind in your sails. Skim smoothly over the choppy waters of the market. Download and present our Finance PowerPoint Templates because you should Whip up a frenzy with our PowerPoint Templates and Slides. They will fuel the excitement of your team. Download and present our Layers PowerPoint Templates because It will Give impetus to the hopes of your colleagues. Our PowerPoint Templates and Slides will aid you in winning their trust. Present our Funnels PowerPoint Templates because Your audience will believe you are the cats whiskers. Use our Business PowerPoint Templates because Our PowerPoint Templates and Slides will fulfill your every need. Use them and effectively satisfy the desires of your audience.Use these PowerPoint slides for presentations relating to Funnel, vector, chart, icon, layered, layer, pipe, flow, diagram, two, slice, outline, conical, target, inverted, business, blank, buying, traffic, glossy, internet, template, cone, analysis, webmarketing, drawing, marketing, level, shape, conversion, vectorial, illustration, stage, six, sale, strategy, channel, web, purchase, part, analytics, customizable, 3d. The prominent colors used in the PowerPoint template are Blue, Gray, Black. Develop their faith with our Conical Shape Business Marketing Theme Ppt Plan Companies PowerPoint Slides. Your thoughts will make believers of them.
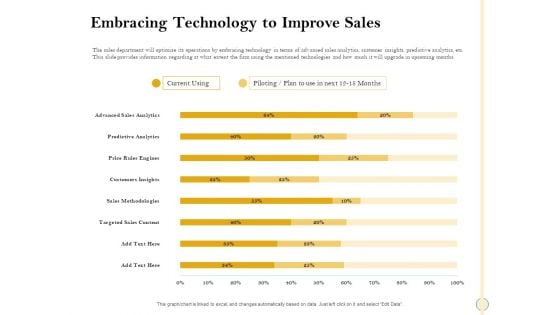
Sales Optimization Best Practices To Close More Deals Embracing Technology To Improve Sales Guidelines PDF
The sales department will optimize its operations by embracing technology in terms of advanced sales analytics, customer insights, predictive analytics, etc. This slide provides information regarding at what extent the firm using the mentioned technologies and how much it will upgrade in upcoming months. Deliver an awe inspiring pitch with this creative sales optimization best practices to close more deals embracing technology to improve sales guidelines pdf bundle. Topics like plan, analytics, sales, targeted, price can be discussed with this completely editable template. It is available for immediate download depending on the needs and requirements of the user.
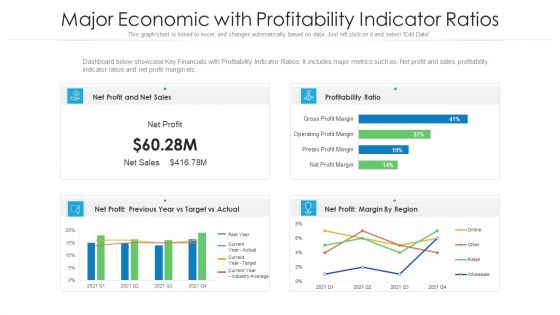
Major Economic With Profitability Indicator Ratios Ppt PowerPoint Presentation Gallery Layouts PDF
Dashboard below showcase Key Financials with Profitability Indicator Ratios. It includes major metrics such as- Net profit and sales, profitability indicator ratios and net profit margin etc. Pitch your topic with ease and precision using this major economic with profitability indicator ratios ppt powerpoint presentation gallery layouts pdf. This layout presents information on sales, profitability ratio, target. It is also available for immediate download and adjustment. So, changes can be made in the color, design, graphics or any other component to create a unique layout.
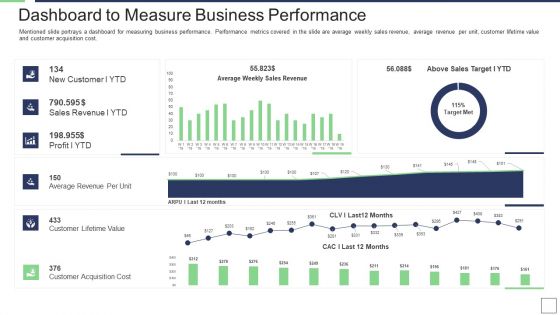
IT Service Incorporation And Administration Dashboard To Measure Business Performance Portrait PDF
Mentioned slide portrays a dashboard for measuring business performance. Performance metrics covered in the slide are average weekly sales revenue, average revenue per unit, customer lifetime value and customer acquisition cost. Deliver and pitch your topic in the best possible manner with this it service incorporation and administration dashboard to measure business performance portrait pdf. Use them to share invaluable insights on sales, revenue, target, acquisition cost and impress your audience. This template can be altered and modified as per your expectations. So, grab it now.
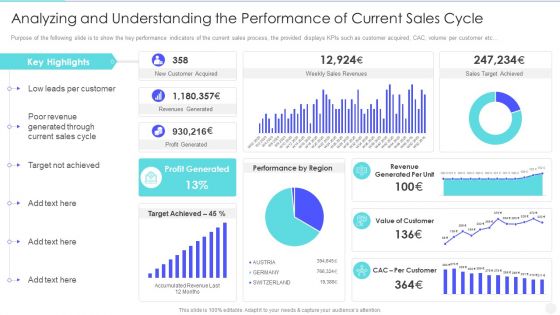
Increase Returns By Examining And Executing New Sales Qualification Procedure Analyzing And Understanding Clipart PDF
Purpose of the following slide is to show the key performance indicators of the current sales process, the provided displays KPIs such as customer acquired, CAC, volume per customer etc. Deliver an awe inspiring pitch with this creative increase returns by examining and executing new sales qualification procedure analyzing and understanding clipart pdf bundle. Topics like sales, target, revenue, profit generated, value can be discussed with this completely editable template. It is available for immediate download depending on the needs and requirements of the user.
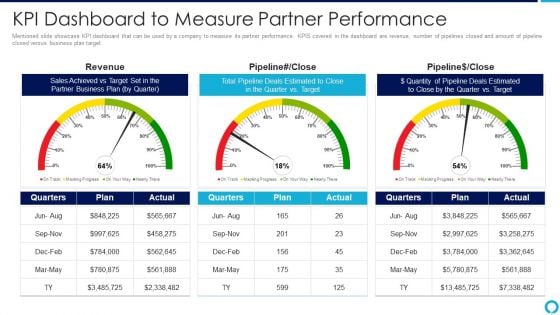
Partnership Management Strategies Kpi Dashboard To Measure Partner Performance Elements PDF
Mentioned slide showcase KPI dashboard that can be used by a company to measure its partner performance. KPIS covered in the dashboard are revenue, number of pipelines closed and amount of pipeline closed versus business plan target.Deliver an awe inspiring pitch with this creative partnership management strategies kpi dashboard to measure partner performance elements pdf bundle. Topics like sales achieved, partner business plan, total pipeline deals estimated can be discussed with this completely editable template. It is available for immediate download depending on the needs and requirements of the user.
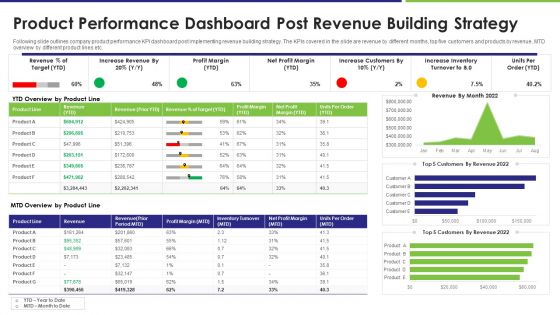
Product Performance Dashboard Post Revenue Building Strategy Brochure PDF
Following slide outlines company product performance KPI dashboard post implementing revenue building strategy. The KPIs covered in the slide are revenue by different months, top five customers and products by revenue, MTD overview by different product lines etc. Showcasing this set of slides titled product performance dashboard post revenue building strategy brochure pdf. The topics addressed in these templates are revenue, target, profit margin. All the content presented in this PPT design is completely editable. Download it and make adjustments in color, background, font etc. as per your unique business setting.
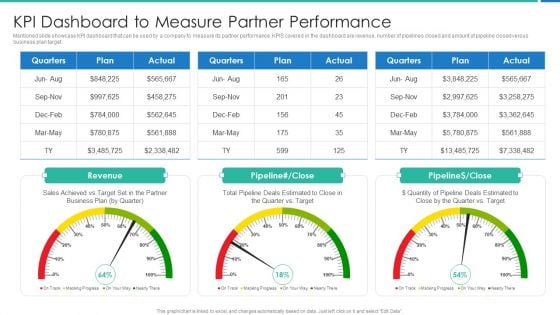
Strong Business Partnership To Ensure Company Success KPI Dashboard To Measure Partner Performance Sample PDF
Mentioned slide showcase KPI dashboard that can be used by a company to measure its partner performance. KPIS covered in the dashboard are revenue, number of pipelines closed and amount of pipeline closed versus business plan target.Deliver an awe inspiring pitch with this creative strong business partnership to ensure company success kpi dashboard to measure partner performance sample pdf bundle. Topics like kpi dashboard to measure partner performance can be discussed with this completely editable template. It is available for immediate download depending on the needs and requirements of the user.
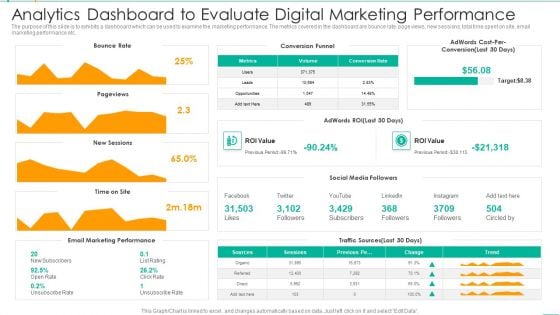
Analytics Dashboard To Evaluate Digital Marketing Performance Mockup PDF
The purpose of this slide is to exhibits a dashboard which can be used to examine the marketing performance. The metrics covered in the dashboard are bounce rate, page views, new sessions, total time spent on site, email marketing performance etc. Showcasing this set of slides titled Analytics Dashboard To Evaluate Digital Marketing Performance Mockup PDF. The topics addressed in these templates are Conversion Funnel, Target, Marketing Performance. All the content presented in this PPT design is completely editable. Download it and make adjustments in color, background, font etc. as per your unique business setting.
Real Estate Sales Tracking Dashboard With Inquiry Referrals Ppt PowerPoint Presentation File Samples PDF
This slide showcases dashboard to track property sales KPIs for smooth flow of operations. It includes information such as rent, social media, digital ads, agent wise sales, etc. Showcasing this set of slides titled Real Estate Sales Tracking Dashboard With Inquiry Referrals Ppt PowerPoint Presentation File Samples PDF. The topics addressed in these templates are Property Inquiry Referrals, Properties Sold And Rent By Agent, Sales By Religion, Sales Target. All the content presented in this PPT design is completely editable. Download it and make adjustments in color, background, font etc. as per your unique business setting.
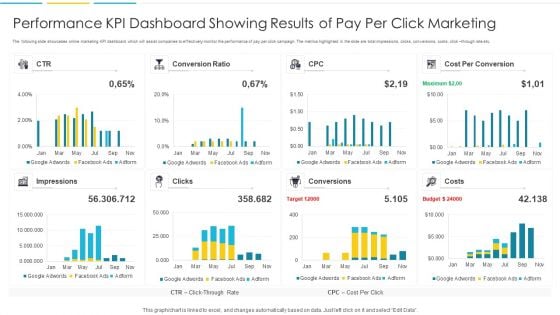
Performance KPI Dashboard Showing Results Of Pay Per Click Marketing Portrait PDF
The following slide showcases online marketing KPI dashboard which will assist companies to effectively monitor the performance of pay per click campaign. The metrics highlighted in the slide are total impressions, clicks, conversions, costs, click through rate etc. Pitch your topic with ease and precision using this Performance KPI Dashboard Showing Results Of Pay Per Click Marketing Portrait PDF. This layout presents information on Impressions, Target, Budget. It is also available for immediate download and adjustment. So, changes can be made in the color, design, graphics or any other component to create a unique layout.
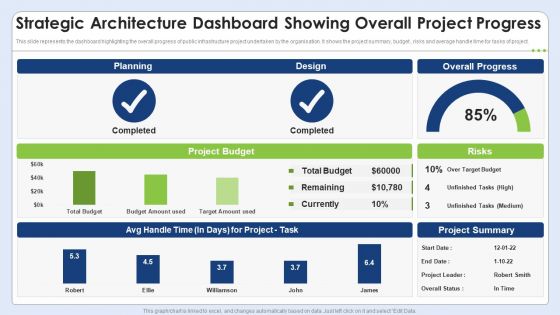
Strategic Architecture Dashboard Showing Overall Project Progress Introduction PDF
This slide represents the dashboard highlighting the overall progress of public infrastructure project undertaken by the organisation. It shows the project summary, budget , risks and average handle time for tasks of project. Showcasing this set of slides titled Strategic Architecture Dashboard Showing Overall Project Progress Introduction PDF. The topics addressed in these templates are Budget, Risks, Target. All the content presented in this PPT design is completely editable. Download it and make adjustments in color, background, font etc. as per your unique business setting.
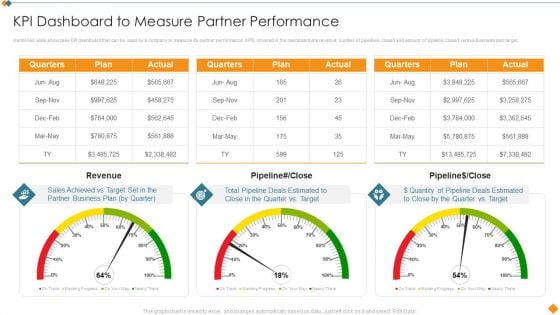
Maintaining Partner Relationships KPI Dashboard To Measure Partner Performance Structure PDF
Mentioned slide showcase KPI dashboard that can be used by a company to measure its partner performance. KPIS covered in the dashboard are revenue, number of pipelines closed and amount of pipeline closed versus business plan target. Deliver an awe inspiring pitch with this creative Maintaining Partner Relationships KPI Dashboard To Measure Partner Performance Structure PDF bundle. Topics like Quarters, Plan, Actual, Revenue, Pipeline can be discussed with this completely editable template. It is available for immediate download depending on the needs and requirements of the user.
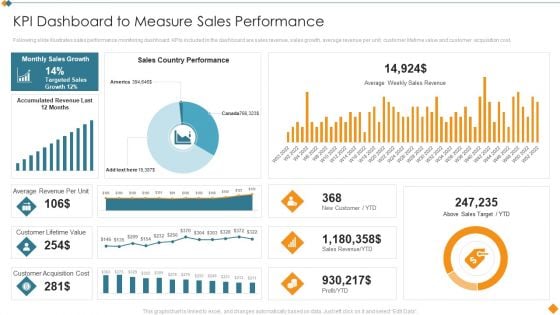
Maintaining Partner Relationships KPI Dashboard To Measure Sales Performance Rules PDF
Following slide illustrates sales performance monitoring dashboard. KPIs included in the dashboard are sales revenue, sales growth, average revenue per unit, customer lifetime value and customer acquisition cost. Deliver and pitch your topic in the best possible manner with this Maintaining Partner Relationships KPI Dashboard To Measure Sales Performance Rules PDF. Use them to share invaluable insights on Sales Country Performance, Above Sales Target, YTD, Customer Lifetime Value, Customer Acquisition Cost and impress your audience. This template can be altered and modified as per your expectations. So, grab it now.
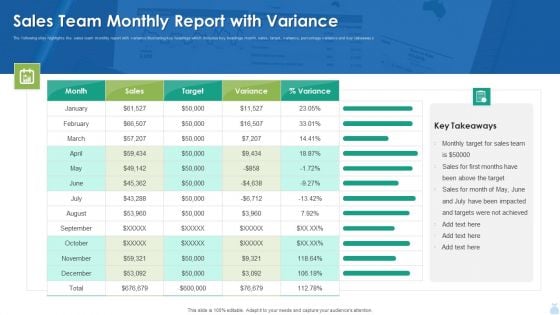
Sales Team Monthly Report With Variance Background PDF
The following slide highlights the sales team monthly report with variance illustrating key headings which includes key headings month, sales, target, variance, percentage variance and key takeaways. Pitch your topic with ease and precision using this Sales Team Monthly Report With Variance Background PDF. This layout presents information on Sales Team Monthly Report With Variance Background PDF. It is also available for immediate download and adjustment. So, changes can be made in the color, design, graphics or any other component to create a unique layout.
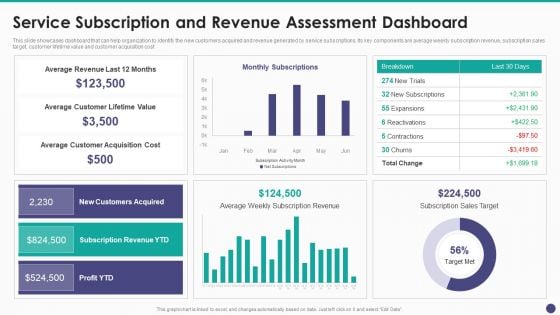
New Service Launch And Development Strategy To Gain Market Share Service Subscription And Revenue Demonstration PDF
This slide showcases dashboard that can help organization to identify the new customers acquired and revenue generated by service subscriptions. Its key components are average weekly subscription revenue, subscription sales target, customer lifetime value and customer acquisition cost.Deliver an awe inspiring pitch with this creative New Service Launch And Development Strategy To Gain Market Share Service Subscription And Revenue Demonstration PDF bundle. Topics like Average Revenue, Average Customer, Customer Acquisition can be discussed with this completely editable template. It is available for immediate download depending on the needs and requirements of the user.
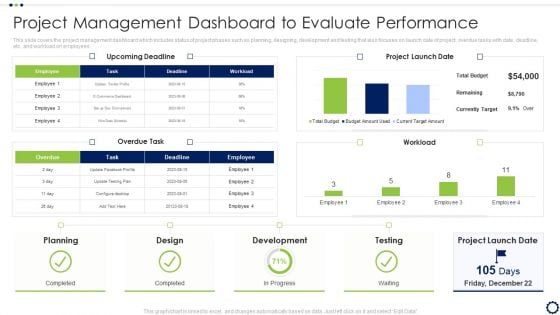
Coordinating Distinct Activities For Effective Project Time Management Project Management Dashboard Clipart PDF
This slide focuses on project communication plan to maintain transparency across project activities which covers communication method, goal, owner, frequency and audience that will help project team to remain updated regarding project progress.Deliver an awe inspiring pitch with this creative Coordinating Distinct Activities For Effective Project Time Management Project Management Dashboard Clipart PDF bundle. Topics like Upcoming Deadline, Currently Target, Development can be discussed with this completely editable template. It is available for immediate download depending on the needs and requirements of the user.
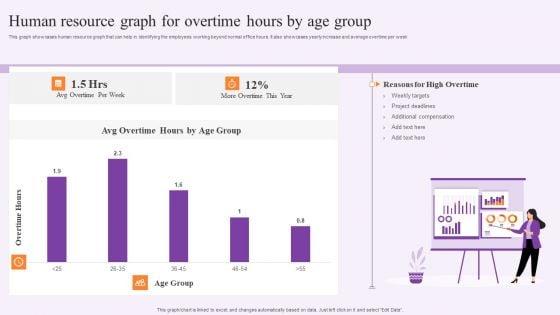
Human Resource Graph For Overtime Hours By Age Group Rules PDF
This graph showcases human resource graph that can help in identifying the employees working beyond normal office hours. It also showcases yearly increase and average overtime per week. Pitch your topic with ease and precision using this Human Resource Graph For Overtime Hours By Age Group Rules PDF. This layout presents information on Weekly Targets, Project Deadlines. It is also available for immediate download and adjustment. So, changes can be made in the color, design, graphics or any other component to create a unique layout.
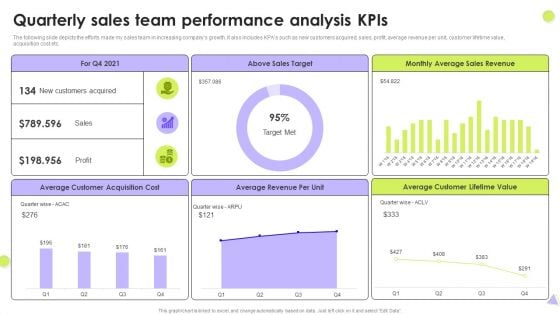
Quarterly Sales Team Performance Analysis Kpis Slides PDF
The following slide depicts the efforts made my sales team in increasing companys growth. It also includes KPAs such as new customers acquired, sales, profit, average revenue per unit, customer lifetime value, acquisition cost etc. Showcasing this set of slides titled Quarterly Sales Team Performance Analysis Kpis Slides PDF. The topics addressed in these templates are Above Sales Target, Average Sales Revenue, Average Customer. All the content presented in this PPT design is completely editable. Download it and make adjustments in color, background, font etc. as per your unique business setting.
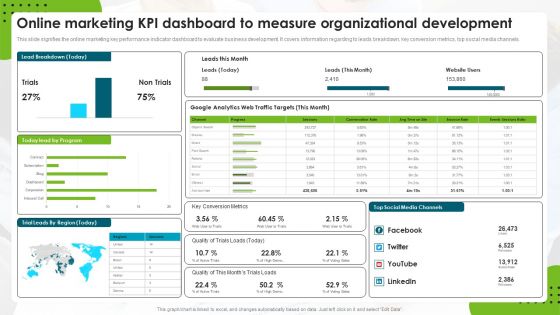
Online Marketing Kpi Dashboard To Measure Organizational Development Rules PDF
This slide signifies the online marketing key performance indicator dashboard to evaluate business development. It covers information regarding to leads breakdown, key conversion metrics, top social media channels. Pitch your topic with ease and precision using this Online Marketing Kpi Dashboard To Measure Organizational Development Rules PDF. This layout presents information on Web Traffic Targets, Google Analytics, Social Media Channels. It is also available for immediate download and adjustment. So, changes can be made in the color, design, graphics or any other component to create a unique layout.
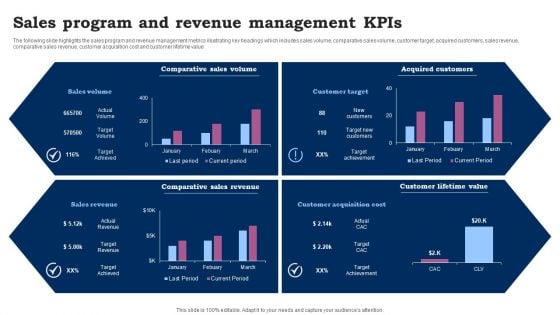
Sales Program And Revenue Management Kpis Ppt Outline Slide Download PDF
The following slide highlights the sales program and revenue management metrics illustrating key headings which includes sales volume, comparative sales volume, customer target, acquired customers, sales revenue, comparative sales revenue, customer acquisition cost and customer lifetime value. Showcasing this set of slides titled Sales Program And Revenue Management Kpis Ppt Outline Slide Download PDF. The topics addressed in these templates are Comparative Sales Volume, Acquired Customers, Comparative Sales Revenue. All the content presented in this PPT design is completely editable. Download it and make adjustments in color, background, font etc. as per your unique business setting.
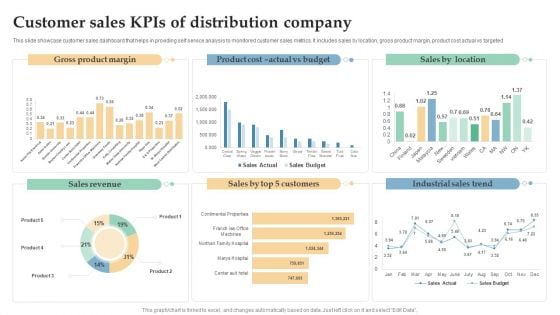
Customer Sales Kpis Of Distribution Company Ppt Infographic Template Templates PDF
This slide showcase customer sales dashboard that helps in providing self service analysis to monitored customer sales metrics. It includes sales by location, gross product margin, product cost actual vs targeted. Showcasing this set of slides titled Customer Sales Kpis Of Distribution Company Ppt Infographic Template Templates PDF. The topics addressed in these templates are Gross Product Margin, Sales Revenue, Industrial Sales Trend. All the content presented in this PPT design is completely editable. Download it and make adjustments in color, background, font etc. as per your unique business setting.
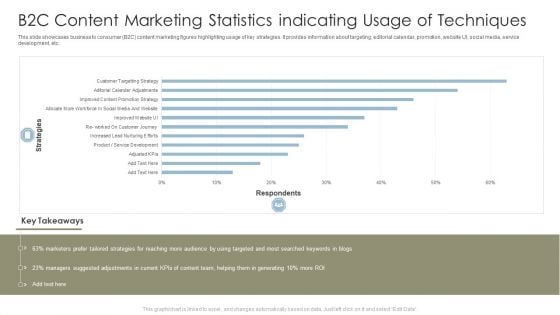
B2C Content Marketing Statistics Indicating Usage Of Techniques Sample PDF
This slide showcases business to consumer B2C content marketing figures highlighting usage of key strategies. It provides information about targeting, editorial calendar, promotion, website UI, social media, service development, etc. Pitch your topic with ease and precision using this B2C Content Marketing Statistics Indicating Usage Of Techniques Sample PDF. This layout presents information on Strategies, Marketers, Content Team. It is also available for immediate download and adjustment. So, changes can be made in the color, design, graphics or any other component to create a unique layout.
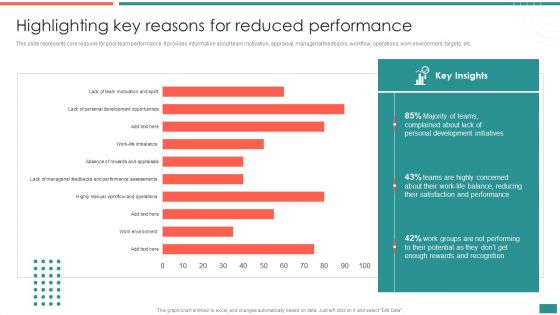
Highlighting Key Reasons For Reduced Performance Building Efficient Workplace Performance Structure PDF
This slide represents core reasons for poor team performance. It provides information about team motivation, appraisal, managerial feedbacks, workflow, operations, work environment, targets, etc.Slidegeeks is one of the best resources for PowerPoint templates. You can download easily and regulate Highlighting Key Reasons For Reduced Performance Building Efficient Workplace Performance Structure PDF for your personal presentations from our wonderful collection. A few clicks is all it takes to discover and get the most relevant and appropriate templates. Use our Templates to add a unique zing and appeal to your presentation and meetings. All the slides are easy to edit and you can use them even for advertisement purposes.
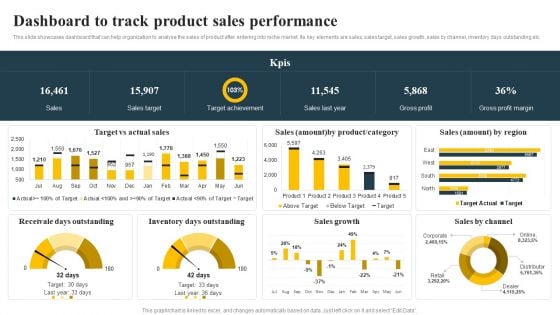
Dashboard To Track Product Sales Performance Implementing Focus Strategy To Improve Designs PDF
This slide showcases dashboard that can help organization to analyse the sales of product after entering into niche market. Its key elements are sales, sales target, sales growth, sales by channel, inventory days outstanding etc.Take your projects to the next level with our ultimate collection of Dashboard To Track Product Sales Performance Implementing Focus Strategy To Improve Designs PDF. Slidegeeks has designed a range of layouts that are perfect for representing task or activity duration, keeping track of all your deadlines at a glance. Tailor these designs to your exact needs and give them a truly corporate look with your own brand colors they all make your projects stand out from the rest.
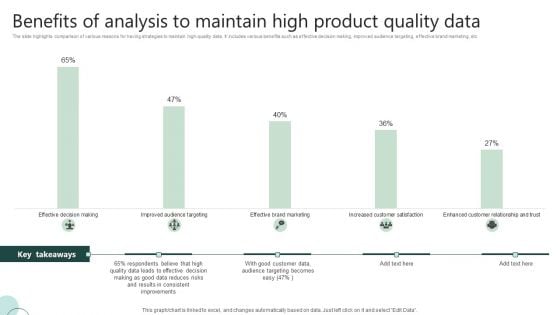
Benefits Of Analysis To Maintain High Product Quality Data Ppt Portfolio Gallery PDF
The slide highlights comparison of various reasons for having strategies to maintain high-quality data. It includes various benefits such as effective decision making, improved audience targeting, effective brand marketing, etc. Showcasing this set of slides titled Benefits Of Analysis To Maintain High Product Quality Data Ppt Portfolio Gallery PDF. The topics addressed in these templates are Effective Decision, Quality Data Leads, Good Customer Data. All the content presented in this PPT design is completely editable. Download it and make adjustments in color, background, font etc. as per your unique business setting.
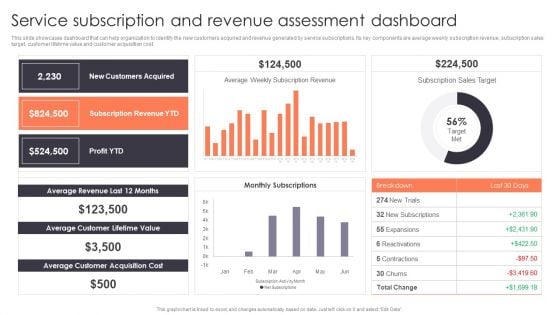
Promotion Strategies For New Service Launch Service Subscription And Revenue Assessment Dashboard Mockup PDF
This slide showcases dashboard that can help organization to identify the new customers acquired and revenue generated by service subscriptions. Its key components are average weekly subscription revenue, subscription sales target, customer lifetime value and customer acquisition cost. There are so many reasons you need a Promotion Strategies For New Service Launch Service Subscription And Revenue Assessment Dashboard Mockup PDF. The first reason is you can not spend time making everything from scratch, Thus, Slidegeeks has made presentation templates for you too. You can easily download these templates from our website easily.
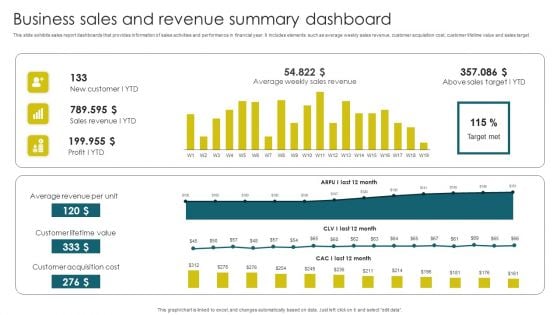
Business Sales And Revenue Summary Dashboard Brochure PDF
This slide exhibits sales report dashboards that provides information of sales activities and performance in financial year. It includes elements such as average weekly sales revenue, customer acquisition cost, customer lifetime value and sales target. Pitch your topic with ease and precision using this Business Sales And Revenue Summary Dashboard Brochure PDF. This layout presents information on Average Revenue, Customer Lifetime, Customer Acquisition. It is also available for immediate download and adjustment. So, changes can be made in the color, design, graphics or any other component to create a unique layout.
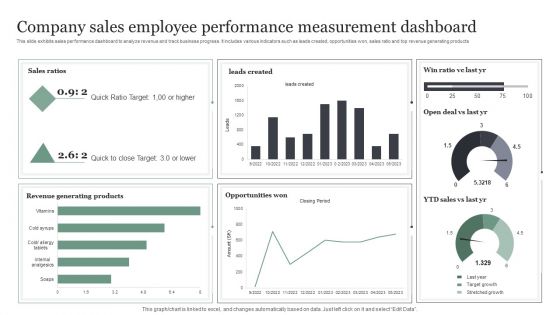
Company Sales Employee Performance Measurement Dashboard Information PDF
This slide exhibits sales performance dashboard to analyze revenue and track business progress. It includes various indicators such as leads created, opportunities won, sales ratio and top revenue generating products. Showcasing this set of slides titled Company Sales Employee Performance Measurement Dashboard Information PDF. The topics addressed in these templates are Quick Ratio Target, Opportunities Won, Revenue Generating Products. All the content presented in this PPT design is completely editable. Download it and make adjustments in color, background, font etc. as per your unique business setting.
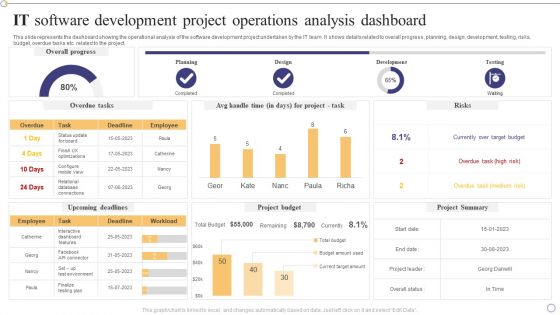
IT Software Development Project Operations Analysis Dashboard Pictures PDF
This slide represents the dashboard showing the operational analysis of the software development project undertaken by the IT team. It shows details related to overall progress, planning, design, development, testing, risks, budget, overdue tasks etc. related to the project.Pitch your topic with ease and precision using this IT Software Development Project Operations Analysis Dashboard Pictures PDF. This layout presents information on Interactive Dashboard, Currently Over Target, Overdue Task. It is also available for immediate download and adjustment. So, changes can be made in the color, design, graphics or any other component to create a unique layout.
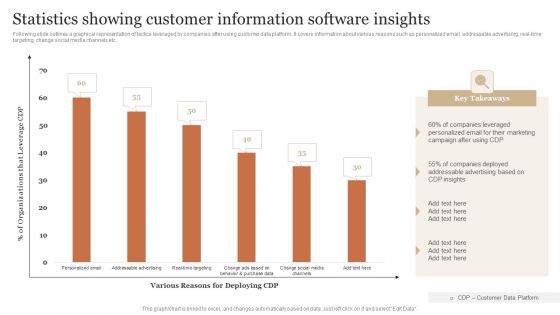
Statistics Showing Customer Information Software Insights Portrait PDF
Following slide outlines a graphical representation of tactics leveraged by companies after using customer data platform. It covers information about various reasons such as personalized email, addressable advertising, real-time targeting, change social media channels etc. Showcasing this set of slides titled Statistics Showing Customer Information Software Insights Portrait PDF. The topics addressed in these templates are Companies Leveraged, Personalized Marketing, Addressable Advertising. All the content presented in this PPT design is completely editable. Download it and make adjustments in color, background, font etc. as per your unique business setting.

 Home
Home