Teacher Icon
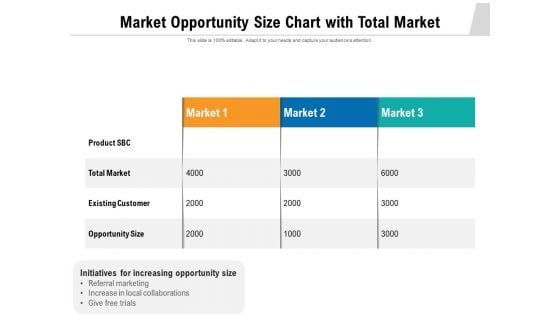
Market Opportunity Size Chart With Total Market Ppt PowerPoint Presentation Infographics Maker PDF
Pitch your topic with ease and precision using this market opportunity size chart with total market ppt powerpoint presentation infographics maker pdf. This layout presents information on product SBC, total market, existing customer, opportunity size. It is also available for immediate download and adjustment. So, changes can be made in the color, design, graphics or any other component to create a unique layout.
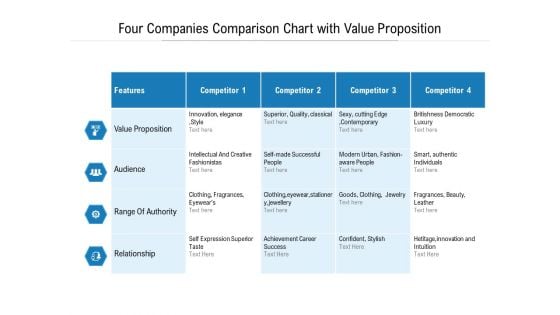
Four Companies Comparison Chart With Value Proposition Ppt PowerPoint Presentation Infographics Smartart PDF
Showcasing this set of slides titled four companies comparison chart with value proposition ppt powerpoint presentation infographics smartart pdf. The topics addressed in these templates are value proposition, audience, range authority, relationship. All the content presented in this PPT design is completely editable. Download it and make adjustments in color, background, font etc. as per your unique business setting.
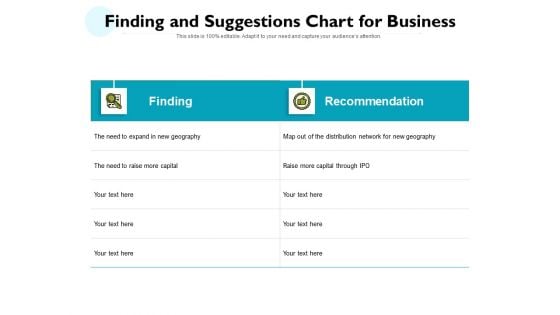
Finding And Suggestions Chart For Business Ppt PowerPoint Presentation Infographic Template Slides PDF
Pitch your topic with ease and precision using this finding and suggestions chart for business ppt powerpoint presentation infographic template slides pdf. This layout presents information on recommendation, geography, network. It is also available for immediate download and adjustment. So, changes can be made in the color, design, graphics or any other component to create a unique layout.
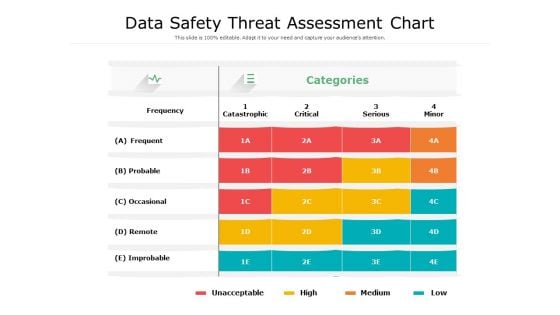
Data Safety Threat Assessment Chart Ppt PowerPoint Presentation File Summary PDF
Pitch your topic with ease and precision using this data safety threat assessment chart ppt powerpoint presentation file summary pdf. This layout presents information on improbable, probable, occasional, serious, catastrophic. It is also available for immediate download and adjustment. So, changes can be made in the color, design, graphics or any other component to create a unique layout.
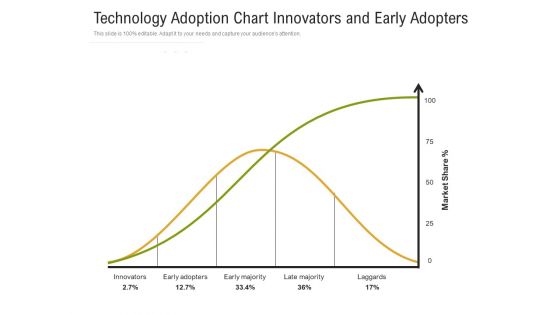
Technology Adoption Chart Innovators And Early Adopters Ppt PowerPoint Presentation Model Graphics Download PDF
Showcasing this set of slides titled technology adoption chart innovators and early adopters ppt powerpoint presentation model graphics download pdf. The topics addressed in these templates are innovators, early adopters, early majority, late majority. All the content presented in this PPT design is completely editable. Download it and make adjustments in color, background, font etc. as per your unique business setting.
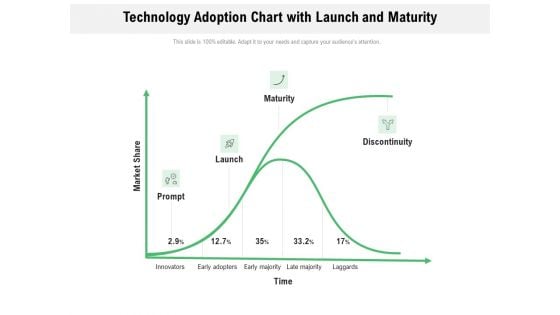
Technology Adoption Chart With Launch And Maturity Ppt PowerPoint Presentation Inspiration Skills PDF
Showcasing this set of slides titled technology adoption chart with launch and maturity ppt powerpoint presentation inspiration skills pdf. The topics addressed in these templates are prompt, launch, maturity, discontinuity, market share. All the content presented in this PPT design is completely editable. Download it and make adjustments in color, background, font etc. as per your unique business setting.
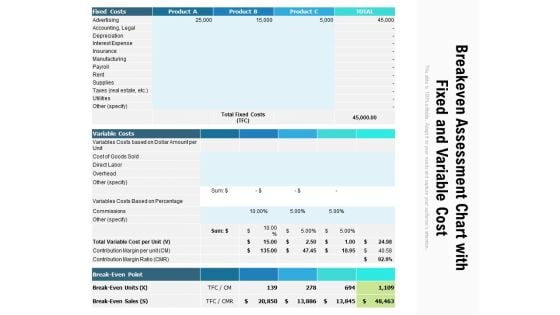
Breakeven Assessment Chart With Fixed And Variable Cost Ppt PowerPoint Presentation File Shapes PDF
Showcasing this set of slides titled breakeven assessment chart with fixed and variable cost ppt powerpoint presentation file shapes pdf. The topics addressed in these templates are advertising, accounting, legal, depreciation, interest expense, insurance. All the content presented in this PPT design is completely editable. Download it and make adjustments in color, background, font etc. as per your unique business setting.
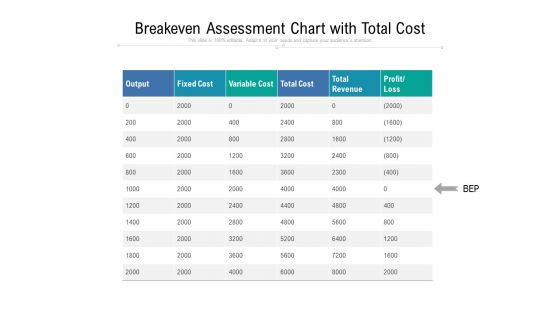
Breakeven Assessment Chart With Total Cost Ppt PowerPoint Presentation File Picture PDF
Showcasing this set of slides titled breakeven assessment chart with total cost ppt powerpoint presentation file picture pdf. The topics addressed in these templates are fixed cost, variable cost, total revenue, total cost, profit loss. All the content presented in this PPT design is completely editable. Download it and make adjustments in color, background, font etc. as per your unique business setting.
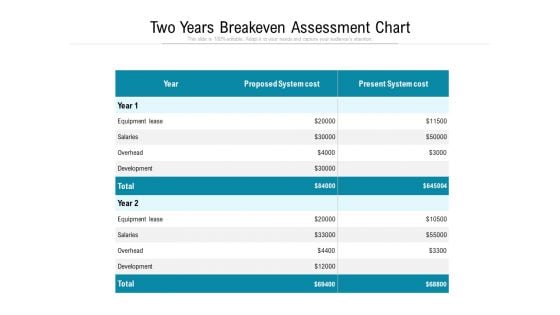
Two Years Breakeven Assessment Chart Ppt PowerPoint Presentation Outline Vector PDF
Showcasing this set of slides titled two years breakeven assessment chart ppt powerpoint presentation outline vector pdf. The topics addressed in these templates are proposed system cost, present system cost, equipment lease, development. All the content presented in this PPT design is completely editable. Download it and make adjustments in color, background, font etc. as per your unique business setting.
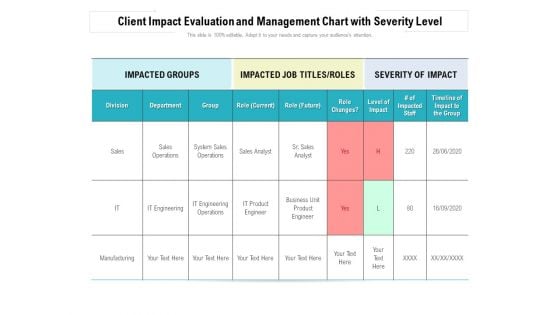
Client Impact Evaluation And Management Chart With Severity Level Ppt Layouts Deck PDF
Showcasing this set of slides titled client impact evaluation and management chart with severity level ppt layouts deck pdf. The topics addressed in these templates are sales operations, system sales operations, sales analyst, department, it engineering. All the content presented in this PPT design is completely editable. Download it and make adjustments in colour, background, font etc. as per your unique business setting.
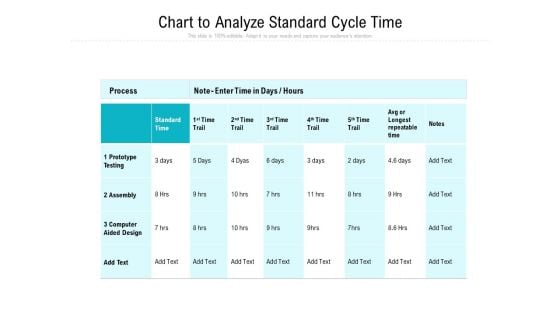
Chart To Analyze Standard Cycle Time Ppt PowerPoint Presentation Pictures Portrait PDF
Showcasing this set of slides titled chart to analyze standard cycle time ppt powerpoint presentation pictures portrait pdf. The topics addressed in these templates are prototype testing, assembly, computer aided design, process, time. All the content presented in this PPT design is completely editable. Download it and make adjustments in color, background, font etc. as per your unique business setting.
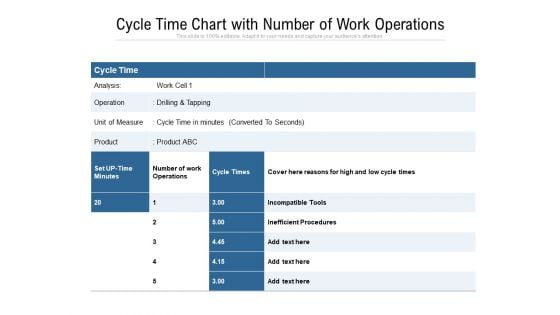
Cycle Time Chart With Number Of Work Operations Ppt PowerPoint Presentation Pictures Information PDF
Pitch your topic with ease and precision using this cycle time chart with number of work operations ppt powerpoint presentation pictures information pdf. This layout presents information on analysis, operation, product, inefficient procedures, drilling and tapping. It is also available for immediate download and adjustment. So, changes can be made in the color, design, graphics or any other component to create a unique layout.
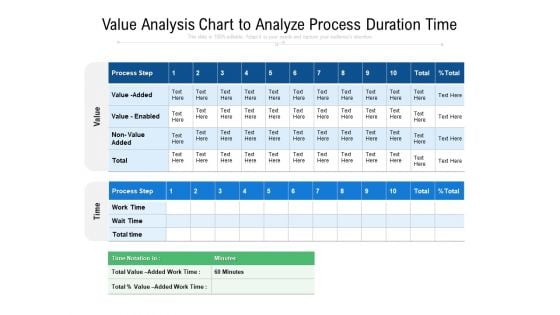
Value Analysis Chart To Analyze Process Duration Time Ppt PowerPoint Presentation Portfolio Professional PDF
Pitch your topic with ease and precision using this value analysis chart to analyze process duration time ppt powerpoint presentation portfolio professional pdf. This layout presents information on value enabled, work time, process step. It is also available for immediate download and adjustment. So, changes can be made in the color, design, graphics or any other component to create a unique layout.
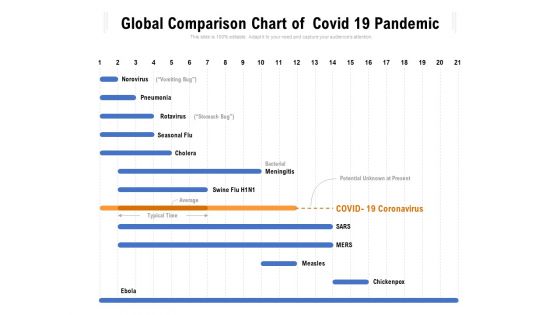
Global Comparison Chart Of Covid 19 Pandemic Ppt PowerPoint Presentation Ideas Graphics Pictures PDF
Showcasing this set of slides titled global comparison chart of covid 19 pandemic ppt powerpoint presentation ideas graphics pictures pdf. The topics addressed in these templates are norovirus, pneumonia, rotavirus, seasonal flu, meningitis. All the content presented in this PPT design is completely editable. Download it and make adjustments in color, background, font etc. as per your unique business setting.
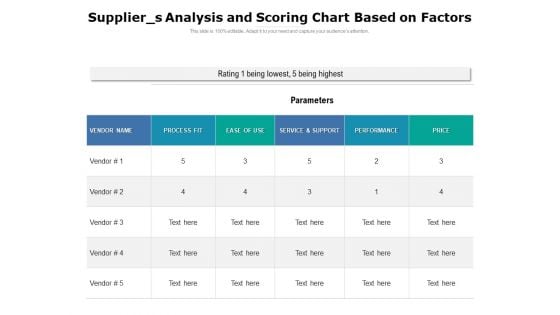
Supplier S Analysis And Scoring Chart Based On Factors Ppt PowerPoint Presentation Gallery Format Ideas PDF
Showcasing this set of slides titled supplier s analysis and scoring chart based on factors ppt powerpoint presentation gallery format ideas pdf. The topics addressed in these templates are service, performance, price. All the content presented in this PPT design is completely editable. Download it and make adjustments in color, background, font etc. as per your unique business setting.

Technology Transformation Analysis Chart With Comments Ppt PowerPoint Presentation Professional Show PDF
Pitch your topic with ease and precision using this technology transformation analysis chart with comments ppt powerpoint presentation professional show pdf. This layout presents information on desired digital change, priority, complexity, comments, value ranking. It is also available for immediate download and adjustment. So, changes can be made in the color, design, graphics or any other component to create a unique layout.

Logistics And SCM Comparison Chart Ppt PowerPoint Presentation Professional Design Templates PDF
Pitch your topic with ease and precision using this logistics and scm comparison chart ppt powerpoint presentation professional design templates pdf. This layout presents information on primary focus, objective, organization involved, interrelation. It is also available for immediate download and adjustment. So, changes can be made in the color, design, graphics or any other component to create a unique layout.
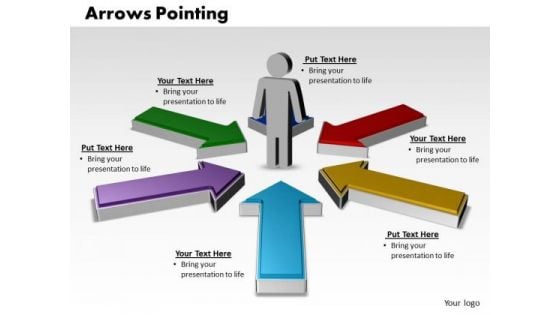
Business Charts PowerPoint Templates Arrows Pointing Inwards With Circular Direction Editable Sales
Business Charts PowerPoint templates arrows pointing inwards with circular direction editable Sales-This PowerPoint Diagram shows the five different colored Arrows pointing towards the man .It imitates the conceptualization of Success, Business, Marketing, Finance, Insurance etc. With our Business Charts PowerPoint Templates Arrows Pointing Inwards With Circular Direction Editable Sales your plans will never fall apart. They assist in maintaining close control.
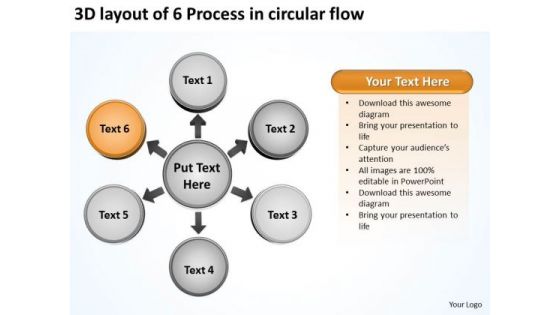
3d Layout Of 6 Process In Circular Flow Cycle Spoke PowerPoint Slides
We present our 3d layout of 6 process in circular flow Cycle Spoke PowerPoint Slides.Download and present our Circle Charts PowerPoint Templates because you understand the ailment and how to fight it. Present our Process and Flows PowerPoint Templates because it shows them how to persistently hit bullseye. Present our Success PowerPoint Templates because you have come up with a brilliant breakthrough idea. you can also visualise the interest it will generate. Use our Business PowerPoint Templates because the NASA Space programme took mankind to the moon and so much more. Like them you too can look far beyond normal boundaries. Show them that in your mind the sky is certainly not the limit. Use our Marketing PowerPoint Templates because networking is an imperative in todays world. You need to access the views of others. Similarly you need to give access to them of your abilities.Use these PowerPoint slides for presentations relating to Arrow, art, background, banner,blue, bright, business, circle, color,colorful, concept, conceptual, connection,creative, cycle, design, different, element,empty, flower, form, frame, graphic,green, group, idea, illustration, match,message, order, part, petal, piece, place,red, ring, shape, solution, special,speech, strategy, symbol. The prominent colors used in the PowerPoint template are Orange, White, Gray. The feedback we get is that our 3d layout of 6 process in circular flow Cycle Spoke PowerPoint Slides are Magical. The feedback we get is that our color PowerPoint templates and PPT Slides are Ritzy. Presenters tell us our 3d layout of 6 process in circular flow Cycle Spoke PowerPoint Slides are Elevated. The feedback we get is that our color PowerPoint templates and PPT Slides are Wonderful. PowerPoint presentation experts tell us our 3d layout of 6 process in circular flow Cycle Spoke PowerPoint Slides are One-of-a-kind. Customers tell us our background PowerPoint templates and PPT Slides have awesome images to get your point across. Find expression in our 3d Layout Of 6 Process In Circular Flow Cycle Spoke PowerPoint Slides. They will demonstrate the depth of your passion.
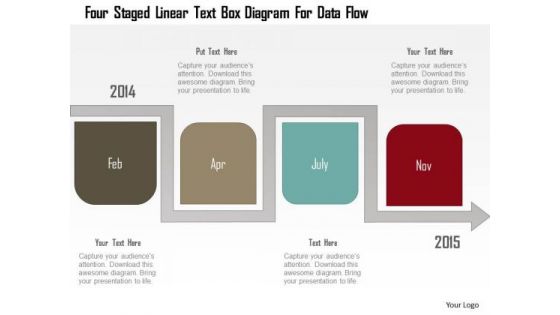
Business Diagram Four Staged Linear Text Box Diagram For Data Flow PowerPoint Template
Four staged linear text box diagram has been used to craft this power point template. This PPT diagram contains the concept of data flow representation. Use this PPT for education and technology related topics.

Hourglass Time Concept PowerPoint Diagrams
Hourglass Time Concept PowerPoint Diagrams-These high quality powerpoint pre-designed slides and powerpoint templates have been carefully created by our professional team to help you impress your audience. All slides have been created and are 100% editable in powerpoint. Each and every property of any graphic - color, size, orientation, shading, outline etc. can be modified to help you build an effective powerpoint presentation. Any text can be entered at any point in the powerpoint template or slide. Simply DOWNLOAD, TYPE and PRESENT! These PowerPoint presentation slides can be used to represent themes relating to -Age, antique, bulb, clock, countdown, equipment, falling, flow, flowing, glass, hand, history, hour, hour glass, hour-glass, hourglass, ideas, instrument, instrument of time, isolated, measurement, minute, object, old, old-fashioned, passing, past, pour, process, reflection, retro, retro-styled, revival, sand, sand glass, sand timer, sand-glass, sandglass, stopwatch, time, timer, vector, vertical, vintage, watch, watch glass, watch-glass, wooden-Hourglass Time Concept PowerPoint Diagrams Banish the blues with our Hourglass Time Concept PowerPoint Diagrams. Your thoughts will bring in the cheer.
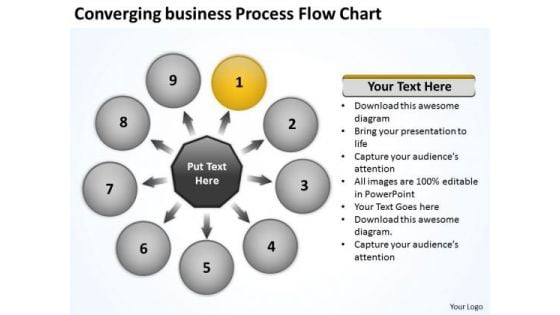
Free Business PowerPoint Templates Process Flow Chart Target
We present our free business powerpoint templates process flow chart Target.Download our Business PowerPoint Templates because a brainwave has occurred to you after review. You know just how to push the graph skyward. Use our Flow Charts PowerPoint Templates because this diagram helps to reaffirm to your team your faith in maintaining the highest ethical standards. Present our Process and Flows PowerPoint Templates because if making a mark is your obsession, then let others get Obsessed with you. Download and present our Shapes PowerPoint Templates because you have it all down to a nicety, slice by slice, layer by layer. Present our Success PowerPoint Templates because you have come up with a brilliant breakthrough idea. you can also visualise the interest it will generate.Use these PowerPoint slides for presentations relating to Arrows, Business, Central, Centralized, Chart, Circle, Circular, Circulation, Concept, Conceptual, Illustration, Organization, Pointing, Process, Radial, Resource, Strategy, Template, Graphic, Group, Illustration, Process, Progress. The prominent colors used in the PowerPoint template are Yellow, Gray, White. People tell us our free business powerpoint templates process flow chart Target are specially created by a professional team with vast experience. They diligently strive to come up with the right vehicle for your brilliant Ideas. Professionals tell us our Circle PowerPoint templates and PPT Slides are Cheerful. Customers tell us our free business powerpoint templates process flow chart Target are Wonderful. Use our Chart PowerPoint templates and PPT Slides are aesthetically designed to attract attention. We guarantee that they will grab all the eyeballs you need. We assure you our free business powerpoint templates process flow chart Target are Perfect. Professionals tell us our Circular PowerPoint templates and PPT Slides will help them to explain complicated concepts. Air your ideas on our Free Business PowerPoint Templates Process Flow Chart Target. They will reach the furthest corners.

Before Vs After Two Years Comparison Charts PPT Sample SS
Retrieve professionally designed Before Vs After Two Years Comparison Charts PPT Sample SS to effectively convey your message and captivate your listeners. Save time by selecting pre-made slideshows that are appropriate for various topics, from business to educational purposes. These themes come in many different styles, from creative to corporate, and all of them are easily adjustable and can be edited quickly. Access them as PowerPoint templates or as Google Slides themes. You do not have to go on a hunt for the perfect presentation because Slidegeeks got you covered from everywhere. Our Before Vs After Two Years Comparison Charts PPT Sample SS are topically designed to provide an attractive backdrop to any subject. Use them to look like a presentation pro.
Sales Risk Assessment For Profit Maximization Determining New Sales Team Organizational Structure Structure PDF
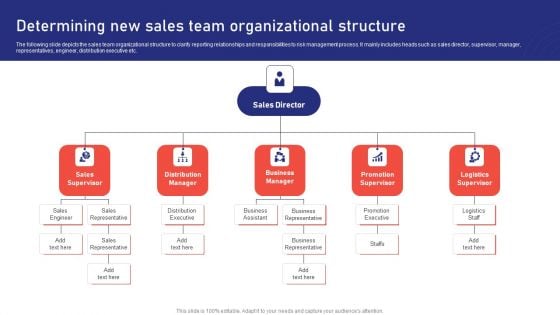
The following slide depicts the sales team organizational structure to clarify reporting relationships and responsibilities to risk management process. It mainly includes heads such as sales director, supervisor, manager, representatives, engineer, distribution executive etc. Do you have to make sure that everyone on your team knows about any specific topic I yes, then you should give Sales Risk Assessment For Profit Maximization Determining New Sales Team Organizational Structure Structure PDF a try. Our experts have put a lot of knowledge and effort into creating this impeccable Sales Risk Assessment For Profit Maximization Determining New Sales Team Organizational Structure Structure PDF. You can use this template for your upcoming presentations, as the slides are perfect to represent even the tiniest detail. You can download these templates from the Slidegeeks website and these are easy to edit. So grab these today.
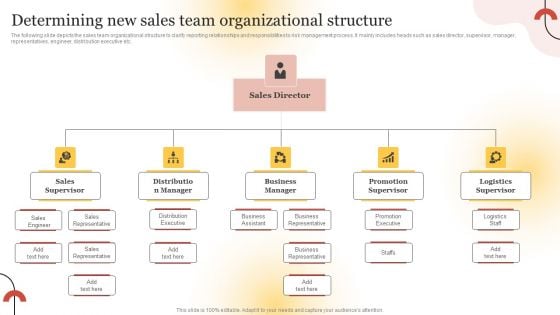
Executing Sales Risk Reduction Plan Determining New Sales Team Organizational Structure Clipart PDF
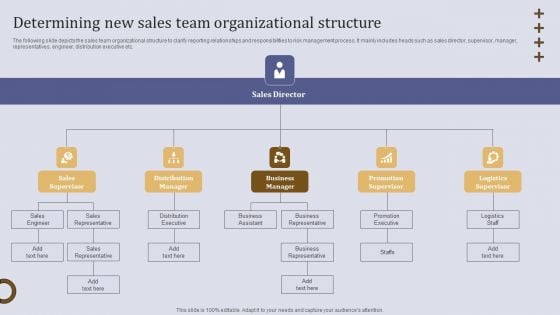
The following slide depicts the sales team organizational structure to clarify reporting relationships and responsibilities to risk management process. It mainly includes heads such as sales director, supervisor, manager, representatives, engineer, distribution executive etc. Do you have to make sure that everyone on your team knows about any specific topic I yes, then you should give Executing Sales Risk Reduction Plan Determining New Sales Team Organizational Structure Clipart PDF a try. Our experts have put a lot of knowledge and effort into creating this impeccable Executing Sales Risk Reduction Plan Determining New Sales Team Organizational Structure Clipart PDF. You can use this template for your upcoming presentations, as the slides are perfect to represent even the tiniest detail. You can download these templates from the Slidegeeks website and these are easy to edit. So grab these today.
Determining New Sales Team Organizational Structure Ppt Outline Show PDF
The following slide depicts the sales team organizational structure to clarify reporting relationships and responsibilities to risk management process. It mainly includes heads such as sales director, supervisor, manager, representatives, engineer, distribution executive etc. Explore a selection of the finest Determining New Sales Team Organizational Structure Ppt Outline Show PDF here. With a plethora of professionally designed and pre made slide templates, you can quickly and easily find the right one for your upcoming presentation. You can use our Determining New Sales Team Organizational Structure Ppt Outline Show PDF to effectively convey your message to a wider audience. Slidegeeks has done a lot of research before preparing these presentation templates. The content can be personalized and the slides are highly editable. Grab templates today from Slidegeeks.
3d Uniform Flow Arrows 8 Steps PowerPoint Chart Slides
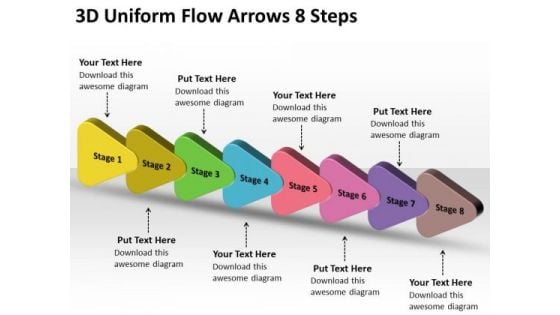
We present our 3d uniform flow arrows 8 steps PowerPoint chart Slides. Use our Arrows PowerPoint Templates because, you have some hits, you had some misses. Use our Marketing PowerPoint Templates because, However it requires care and diligence to function well. Use our Success PowerPoint Templates because, Spread the light of knowledge around you, clear the doubts and enlighten the questioning minds with your brilliance and ability. Use our Process and Flows PowerPoint Templates because, However it requires care and diligence to function well. Use our Business PowerPoint Templates because, hence this diagram has the unique ability to drive home your ideas and show how they mesh to guarantee success. Use these PowerPoint slides for presentations relating to Abstract, Arrow, Arrows Business, Chart, Design, Development, Diagram, Direction, Element, Flow, Flowchart, Graph, Linear, Management, Model, Motion, Organization, Plan, Process, Program, Section, Segment, Set, Sign, Solution, Strategy, Symbol, Technology. The prominent colors used in the PowerPoint template are Green, Blue, and Red With our 3d Uniform Flow Arrows 8 Steps PowerPoint Chart Slides there is no end. They will take you even further.
Freelancer RFP Gantt Chart Ppt PowerPoint Presentation Gallery Graphic Tips PDF
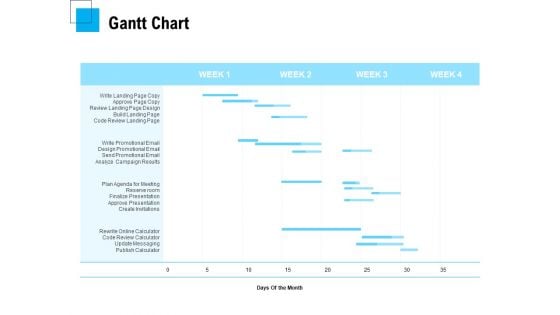
Our Gantt Chart PowerPoint Template is a modern and professional layout designed to create some of the vital components that help you to create timelines, roadmaps, project plans, etc. Communicate your project activity durations, milestones, tasks, subtasks, dependencies and other attributes with this content-ready PowerPoint template. Further, showcase precedence against time by employing this fully editable PowerPoint chart into your business tasks. With a single glance at this resourceful PPT layout, the audiences can get a complete overview of the tasks, duration, resources employed, and overlapping of the activities in a particular project, making it an ideal choice for project managers and leaders. Not only this, but the color scheme of this template is also such that it is sure to impress your audience, no matter which niche they
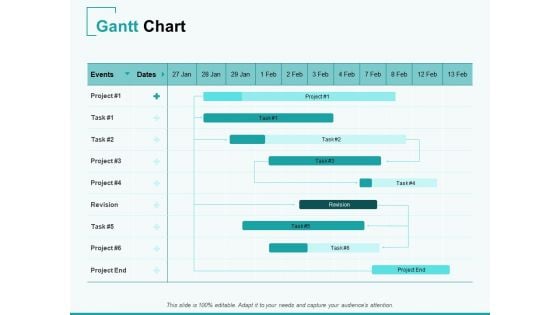
Home Remodeling Proposal Gantt Chart Ppt PowerPoint Presentation Slides Example Topics PDF
Our Gantt Chart PowerPoint Template is a modern and professional layout designed to create some of the vital components that help you to create timelines, roadmaps, project plans, etc. Communicate your project activity durations, milestones, tasks, subtasks, dependencies and other attributes with this content-ready PowerPoint template. Further, showcase precedence against time by employing this fully editable PowerPoint chart into your business tasks. With a single glance at this resourceful PPT layout, the audiences can get a complete overview of the tasks, duration, resources employed, and overlapping of the activities in a particular project, making it an ideal choice for project managers and leaders. Not only this, but the color scheme of this template is also such that it is sure to impress your audience, no matter which niche they
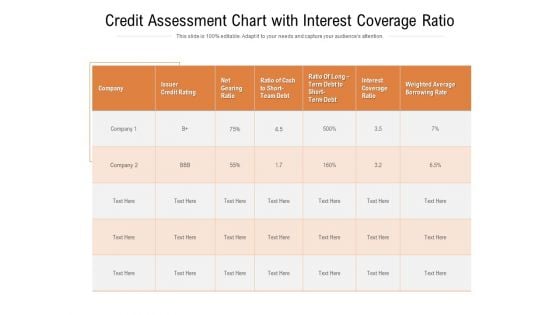
Credit Assessment Chart With Interest Coverage Ratio Ppt PowerPoint Presentation Layouts Structure PDF
Presenting this set of slides with name credit assessment chart with interest coverage ratio ppt powerpoint presentation layouts structure pdf. The topics discussed in these slides are issuer credit rating, net gearing ratio, weighted average borrowing rate, interest coverage ratio, ratio of cash to short team debt, ratio of long term debt to short term debt. This is a completely editable PowerPoint presentation and is available for immediate download. Download now and impress your audience.
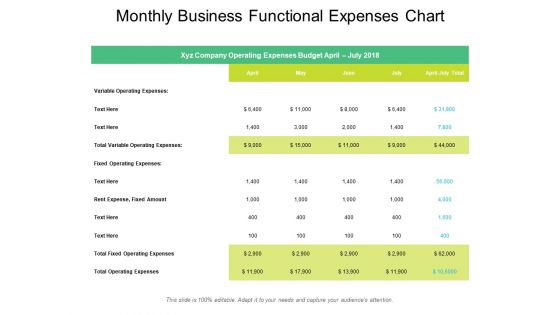
Monthly Business Functional Expenses Chart Ppt PowerPoint Presentation Outline Elements PDF
Presenting this set of slides with name monthly business functional expenses chart ppt powerpoint presentation outline elements pdf. The topics discussed in these slides are variable operating expenses, total variable operating expenses, fixed operating expenses, rent expense, fixed amount, total fixed operating expenses, total operating expenses. This is a completely editable PowerPoint presentation and is available for immediate download. Download now and impress your audience.
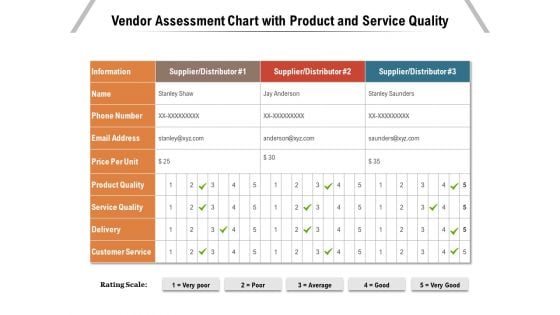
Vendor Assessment Chart With Product And Service Quality Ppt PowerPoint Presentation Infographics Good PDF
Pitch your topic with ease and precision using this vendor assessment chart with product and service quality ppt powerpoint presentation infographics good pdf. This layout presents information on information, price per unit, product quality, service quality, customer service, delivery. It is also available for immediate download and adjustment. So, changes can be made in the color, design, graphics or any other component to create a unique layout.
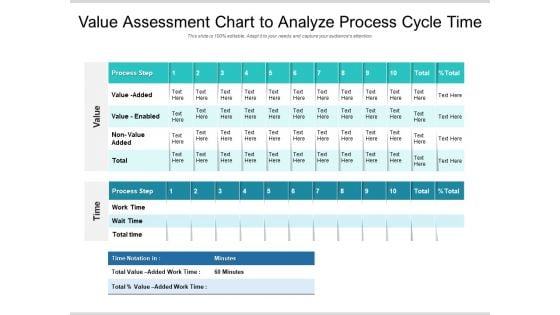
Value Assessment Chart To Analyze Process Cycle Time Ppt PowerPoint Presentation Gallery Examples PDF
Pitch your topic with ease and precision using this value assessment chart to analyze process cycle time ppt powerpoint presentation gallery examples pdf. This layout presents information on process step, value added, value enabled, work time, wait time. It is also available for immediate download and adjustment. So, changes can be made in the color, design, graphics or any other component to create a unique layout.

Sales Team Duties Chart With Resolving Client Issues Ppt PowerPoint Presentation Styles PDF
Showcasing this set of slides titled sales team duties chart with resolving client issues ppt powerpoint presentation styles pdf. The topics addressed in these templates are responsibilities, sales department roles, resolving client issues, coordination, participation, sales team leaders. All the content presented in this PPT design is completely editable. Download it and make adjustments in color, background, font etc. as per your unique business setting.
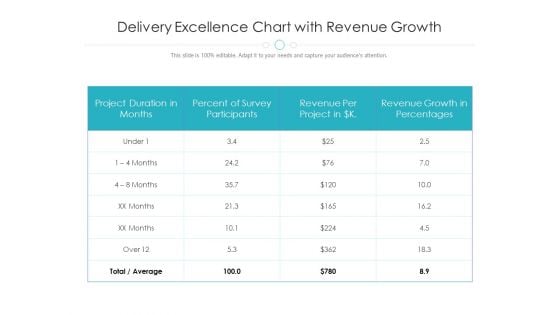
Delivery Excellence Chart With Revenue Growth Ppt PowerPoint Presentation Model Layouts PDF
Pitch your topic with ease and precision using this delivery excellence chart with revenue growth ppt powerpoint presentation model layouts pdf. This layout presents information on percent of survey participants, project duration in months, revenue growth in percentages. It is also available for immediate download and adjustment. So, changes can be made in the color, design, graphics or any other component to create a unique layout.
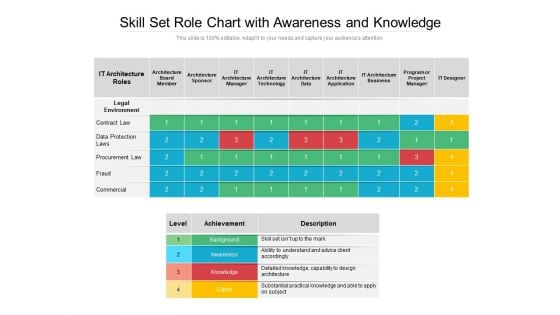
Skill Set Role Chart With Awareness And Knowledge Ppt PowerPoint Presentation Styles Summary PDF
Showcasing this set of slides titled skill set role chart with awareness and knowledge ppt powerpoint presentation styles summary pdf. The topics addressed in these templates are achievement, awareness, knowledge, background, it architecture technology, it architecture data, it architecture application, it architecture business. All the content presented in this PPT design is completely editable. Download it and make adjustments in color, background, font etc. as per your unique business setting.
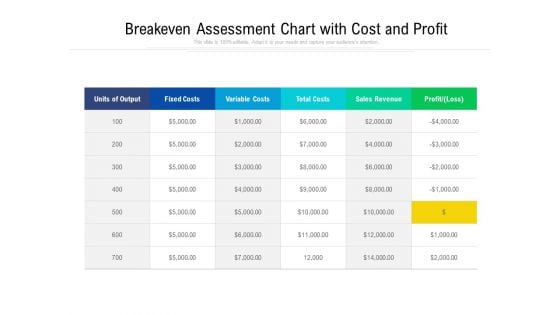
Breakeven Assessment Chart With Cost And Profit Ppt PowerPoint Presentation Styles Elements PDF
Pitch your topic with ease and precision using this breakeven assessment chart with cost and profit ppt powerpoint presentation styles elements pdf. This layout presents information on fixed costs, variable costs, total costs, sales revenue, profit loss It is also available for immediate download and adjustment. So, changes can be made in the color, design, graphics or any other component to create a unique layout.
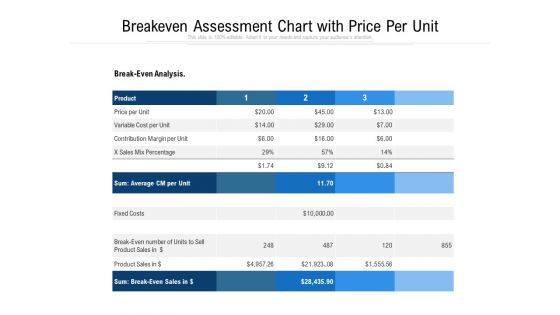
Breakeven Assessment Chart With Price Per Unit Ppt PowerPoint Presentation Infographics Graphic Images PDF
Pitch your topic with ease and precision using this breakeven assessment chart with price per unit ppt powerpoint presentation infographics graphic images pdf. This layout presents information on break even analysis, average cm per unit, break even sales in, fixed costs, product sales. It is also available for immediate download and adjustment. So, changes can be made in the color, design, graphics or any other component to create a unique layout.
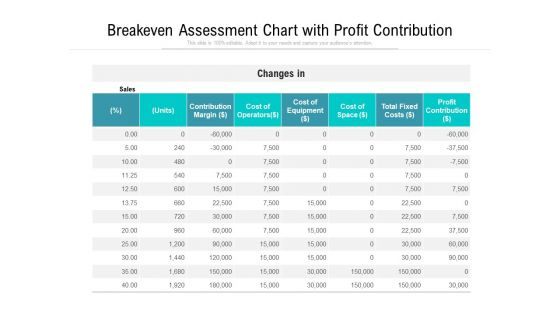
Breakeven Assessment Chart With Profit Contribution Ppt PowerPoint Presentation Inspiration Backgrounds PDF
Showcasing this set of slides titled breakeven assessment chart with profit contribution ppt powerpoint presentation inspiration backgrounds pdf. The topics addressed in these templates are contribution margin, cost of operators, cost of equipment, cost of space, profit contribution. All the content presented in this PPT design is completely editable. Download it and make adjustments in color, background, font etc. as per your unique business setting.
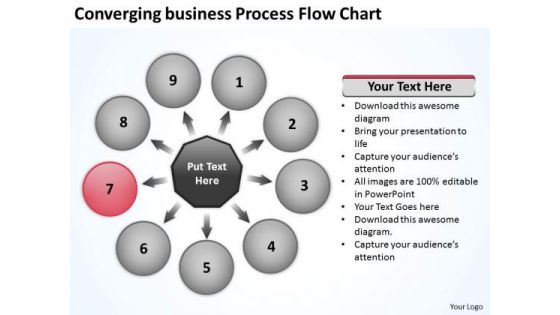
PowerPoint Presentation Process Flow Chart Ppt Circular Templates
We present our powerpoint presentation process flow chart ppt Circular templates.Present our Business PowerPoint Templates because you have had your share of being a goldfish in a small bowl.you are ready to launch out and spread your wings. Download and present our Flow Charts PowerPoint Templates because honesty is the best policy has an ardent follower in you. Use our Process and Flows PowerPoint Templates because your business and plans for its growth consist of processes that are highly co-related. Download our Shapes PowerPoint Templates because this diagram helps to reaffirm to your team your faith in maintaining the highest ethical standards. Present our Success PowerPoint Templates because they will Amplify your plans to have dedicated sub groups working on related but distinct tasks.Use these PowerPoint slides for presentations relating to Arrows, Business, Central, Centralized, Chart, Circle, Circular, Circulation, Concept, Conceptual, Illustration, Organization, Pointing, Process, Radial, Resource, Strategy, Template, Graphic, Group, Illustration, Process, Progress. The prominent colors used in the PowerPoint template are Red, Gray, White. People tell us our powerpoint presentation process flow chart ppt Circular templates are Striking. Professionals tell us our Centralized PowerPoint templates and PPT Slides are Precious. Customers tell us our powerpoint presentation process flow chart ppt Circular templates are Bright. Use our Circulation PowerPoint templates and PPT Slides are Glamorous. We assure you our powerpoint presentation process flow chart ppt Circular templates are Efficacious. Professionals tell us our Central PowerPoint templates and PPT Slides are Fabulous. Instruct your team with our PowerPoint Presentation Process Flow Chart Ppt Circular Templates. Make sure your presentation gets the attention it deserves.

Pricing Package Tags Chart Ppt Slides
This is a pricing package tags chart ppt slides. This is a four stage process. The stages in this process are business, symbol, marketing, finance, success.

Pareto Chart Ppt PowerPoint Presentation Ideas
This is a pareto chart ppt powerpoint presentation ideas. This is a four stage process. The stages in this process are bar graph, finance, marketing, strategy, analysis, business.
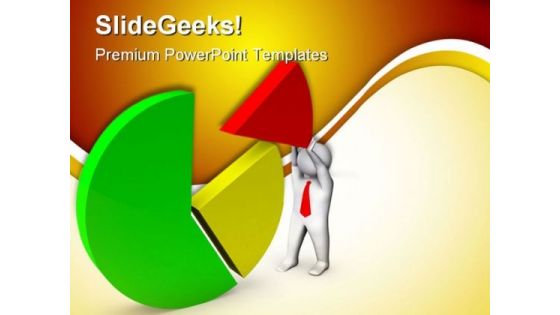
Pie Chart06 Business PowerPoint Templates And PowerPoint Backgrounds 0411
Microsoft PowerPoint Template and Background with man with pie chart shows business chart Your exceptional thoughts need our Pie Chart06 Business PowerPoint Templates And PowerPoint Backgrounds 0411. With their support you will always excel.
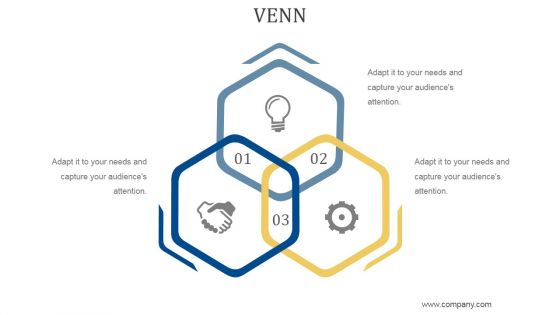
Venn Ppt PowerPoint Presentation Design Ideas
This is a venn ppt powerpoint presentation design ideas. This is a three stage process. The stages in this process are business, strategy, marketing, analysis, venn diagram.
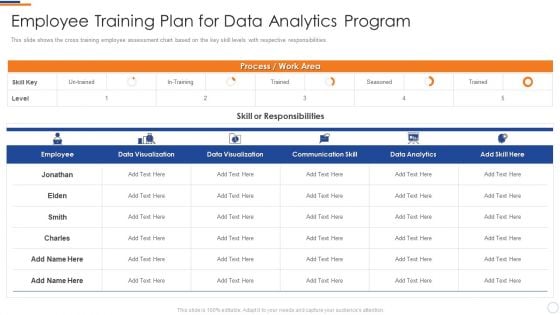
Business Intelligence And Big Employee Training Plan For Data Analytics Program Themes PDF
This slide shows the cross training employee assessment chart based on the key skill levels with respective responsibilities. Deliver an awe inspiring pitch with this creative business intelligence and big employee training plan for data analytics program themes pdf bundle. Topics like skill, responsibilities, process, employee, data visualization can be discussed with this completely editable template. It is available for immediate download depending on the needs and requirements of the user.
Financial Pie Chart Business PowerPoint Templates And PowerPoint Backgrounds 0411
Microsoft PowerPoint Template and Background with pie chart Attain success with our Financial Pie Chart Business PowerPoint Templates And PowerPoint Backgrounds 0411. You will come out on top.
Pie Chart07 Business PowerPoint Templates And PowerPoint Backgrounds 0411
Microsoft PowerPoint Template and Background with pie chart Many experts trust our Pie Chart07 Business PowerPoint Templates And PowerPoint Backgrounds 0411. They display the right characteristics.
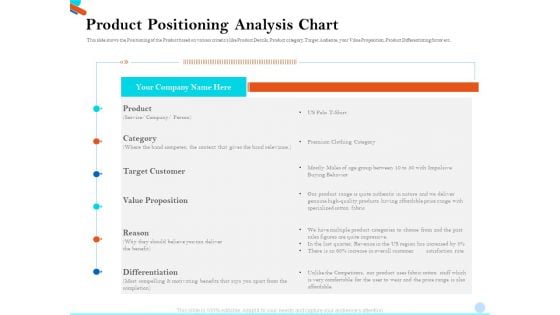
Pitch Presentation Raising Series C Funds Investment Company Product Positioning Analysis Chart Topics PDF
This slide shows the Positioning of the Product based on various criterias like Product Details, Product category, Target Audience, your Value Proposition, Product Differentiating factor etc. Deliver and pitch your topic in the best possible manner with this pitch presentation raising series c funds investment company product positioning analysis chart topics pdf. Use them to share invaluable insights on target customer, value proposition, product, service and impress your audience. This template can be altered and modified as per your expectations. So, grab it now.

Oil Barrel With Up Arrow Graph Marketing PowerPoint Templates And PowerPoint Themes 0912
Oil Barrel With Up Arrow Graph Marketing PowerPoint Templates And PowerPoint Themes Presentations-Microsoft Powerpoint Templates and Background with oil barrels and chart graph with arrow-Oil Barrel With Up Arrow Graph Marketing PowerPoint Templates And PowerPoint Themes PresentationsThis PPT can be used for presentations relating to-Oil barrels and chart graph with arrow, business, marketing, finance, success, arrows Dazzle the audience with your thoughts. Our Oil Barrel With Up Arrow Graph Marketing PowerPoint Templates And PowerPoint Themes 0912 will leave them wide-eyed.
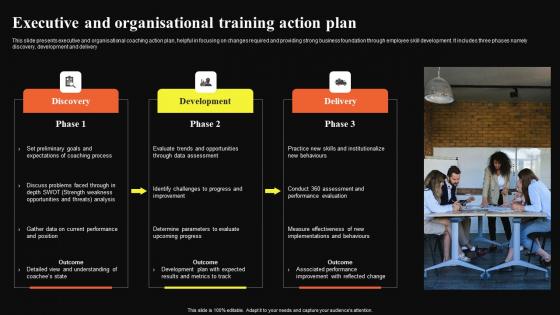
Executive And Organisational Training Action Plan Guidelines Pdf
This slide presents executive and organisational coaching action plan, helpful in focusing on changes required and providing strong business foundation through employee skill development. It includes three phases namely discovery, development and delivery. Pitch your topic with ease and precision using this Executive And Organisational Training Action Plan Guidelines Pdf. This layout presents information on Discovery, Development, Delivery. It is also available for immediate download and adjustment. So, changes can be made in the color, design, graphics or any other component to create a unique layout. This slide presents executive and organisational coaching action plan, helpful in focusing on changes required and providing strong business foundation through employee skill development. It includes three phases namely discovery, development and delivery.
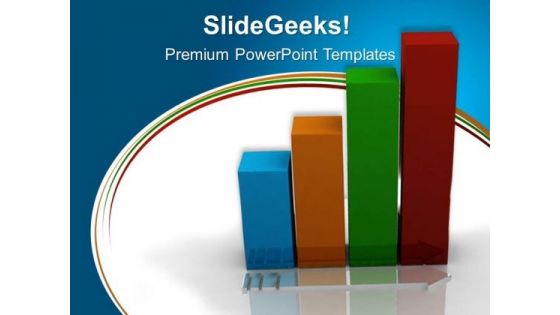
Bar Graph With Arrow Success PowerPoint Templates And PowerPoint Themes 0312
Microsoft Powerpoint Templates and Background with bar chart growth Feuds can happen at the workplace. Settle them amicably with our Bar Graph With Arrow Success PowerPoint Templates And PowerPoint Themes 0312.
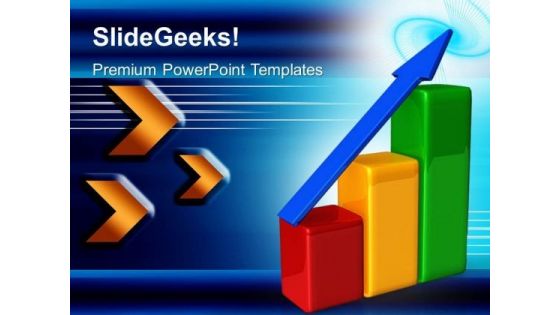
Bar Graph With Arrow01 Success PowerPoint Templates And PowerPoint Themes 0412
Microsoft Powerpoint Templates and Background with bar chart growth Your audience will feast upon our Bar Graph With Arrow01 Success PowerPoint Templates And PowerPoint Themes 0412. They provide ample eye candy.
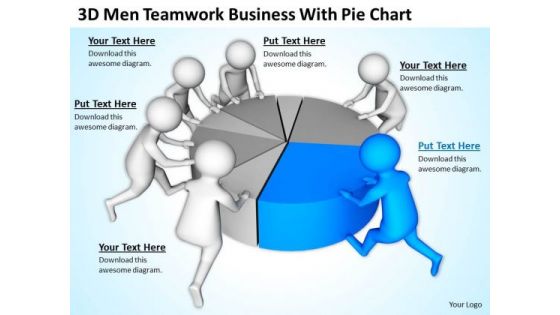
Pictures Of Business Men PowerPoint Presentation With Pie Chart Slides
We present our pictures of business men powerpoint presentation with pie chart Slides.Use our Business PowerPoint Templates because Our PowerPoint Templates and Slides will let Your superior ideas hit the target always and everytime. Present our Teamwork PowerPoint Templates because Our PowerPoint Templates and Slides ensures Effective communication. They help you put across your views with precision and clarity. Use our Pie Charts PowerPoint Templates because you can Break through with our PowerPoint Templates and Slides. Bring down the mental barriers of your audience. Download our Marketing PowerPoint Templates because It will let you Set new benchmarks with our PowerPoint Templates and Slides. They will keep your prospects well above par. Use our Success PowerPoint Templates because Our PowerPoint Templates and Slides are Clear and concise. Use them and dispel any doubts your team may have.Use these PowerPoint slides for presentations relating to 3d, accounting, banking, business, businessmen, chart, completing, concept, diagram, economy, financial, graph, illustration, investment, management, market, men, money, part, people, percent, pie, piece, profit, progress, pushing, report, results, sales, slice, statistics, strategy, success, symbol, team, teamwork, together, unite, white. The prominent colors used in the PowerPoint template are Blue, Gray, White. Equalize the odds with our Pictures Of Business Men PowerPoint Presentation With Pie Chart Slides. Better the chances of your ideas working.
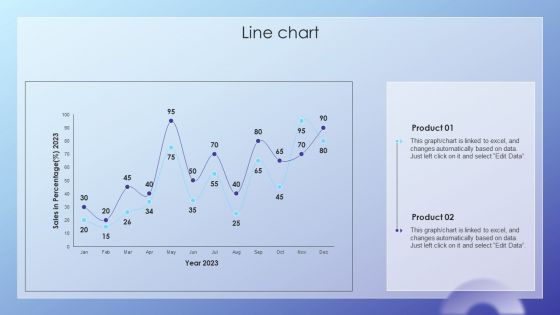
Client Acquisition Journey Plan Line Chart Ppt File Deck PDF
Create an editable Client Acquisition Journey Plan Line Chart Ppt File Deck PDF that communicates your idea and engages your audience. Whether youre presenting a business or an educational presentation, pre-designed presentation templates help save time. Client Acquisition Journey Plan Line Chart Ppt File Deck PDF is highly customizable and very easy to edit, covering many different styles from creative to business presentations. Slidegeeks has creative team members who have crafted amazing templates. So, go and get them without any delay.
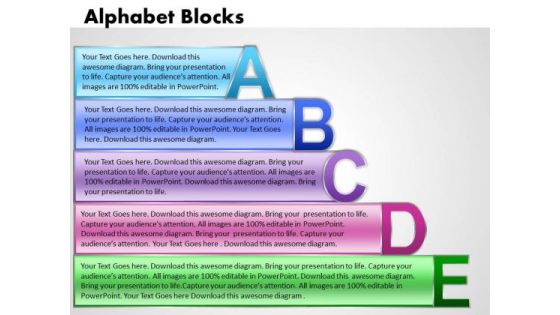
Business Charts PowerPoint Templates Alphabet Blocks Abcde With Textboxes
Business Charts PowerPoint templates alphabet blocks abcde with textboxes-Use this Animated PowerPoint Alphabet Chart to represent characters, elements, fundamentals, graphic representation, hieroglyphs, ideograph, morphemes, phonemes, pictograph, rune, signs, and symbols.-Business Charts PowerPoint templates alphabet blocks abcde with textboxes Level the playing field with our Business Charts PowerPoint Templates Alphabet Blocks Abcde With Textboxes. Make sure your presentation gets the attention it deserves.
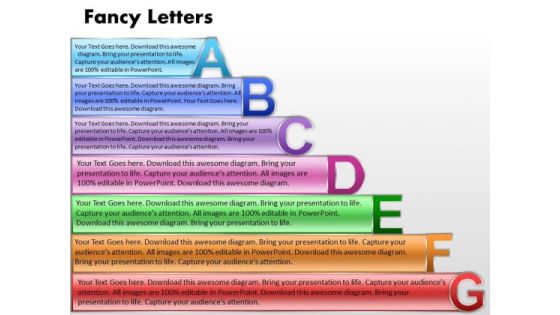
Business Charts PowerPoint Templates Fancy Letters Abcdefg With Textboxes
Business Charts PowerPoint templates fancy letters abcdefg with textboxes-Use this Animated PowerPoint Alphabet Chart with letters A,B,C,D,E,F,G to represent characters, elements, fundamentals, graphic representation, hieroglyphs, ideograph, morphemes, phonemes, pictograph, rune, signs, symbols.-Business Charts PowerPoint templates fancy letters abcdefg with textboxes Interpret plans with our Business Charts PowerPoint Templates Fancy Letters Abcdefg With Textboxes. Download without worries with our money back guaranteee.
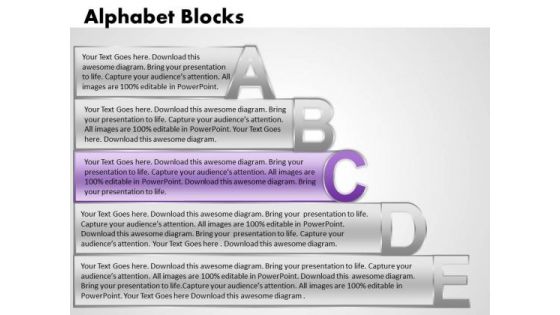
Ppt Alphabet Blocks Abcde With Textboxes Chart PowerPoint Templates
PPT alphabet blocks abcde with textboxes Chart PowerPoint Templates-Use this Animated PowerPoint Alphabet Chart to represent characters, elements, fundamentals, graphic representation, hieroglyphs, ideograph, morphemes, phonemes, pictograph, rune, signs, and symbols.-PPT alphabet blocks abcde with textboxes Chart PowerPoint Templates Draw attention to your expertise. Our Ppt Alphabet Blocks Abcde With Textboxes Chart PowerPoint Templates are the best bet to do so.
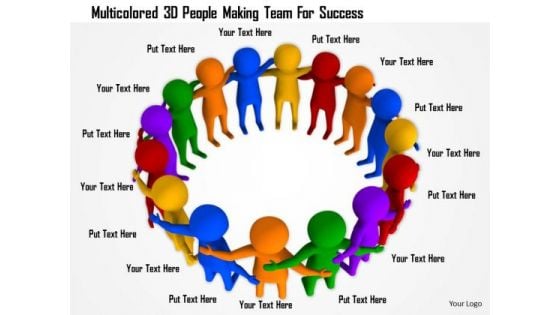
Multicolored 3d People Making Team For Success
This slide displays colorful 3d people standing together in circle. This diagram slide contains the concept of diversity and team unity. Use this image slide to build presentation on business success and teamwork related topics.
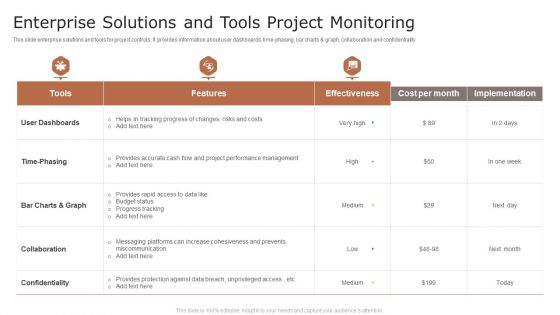
Enterprise Solutions And Tools Project Monitoring Ppt File Visuals PDF
This slide enterprise solutions and tools for project controls. It provides information about user dashboards, time-phasing, bar charts and graph, collaboration and confidentiality. Pitch your topic with ease and precision using this Enterprise Solutions And Tools Project Monitoring Ppt File Visuals PDF. This layout presents information on User Dashboards, Time Phasing, Collaboration. It is also available for immediate download and adjustment. So, changes can be made in the color, design, graphics or any other component to create a unique layout.
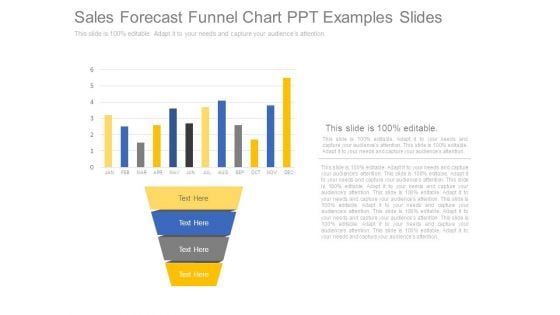
Sales Forecast Funnel Chart Ppt Examples Slides
This is a sales forecast funnel chart ppt examples slides. This is a four stage process. The stages in this process are jan, feb, mar, apr, may, jun, jul, aug, sep, oct, nov, dec.


 Continue with Email

 Home
Home


