Teacher Icon

Healthy Food PowerPoint Templates And PowerPoint Themes 0912
Healthy Food PowerPoint Templates And PowerPoint Themes Presentations-Microsoft Powerpoint Templates and Background with health and fitness-Healthy Food PowerPoint Templates And PowerPoint Themes Presentations-This PowerPoint template can be used for presentations relating to-Health and fitness, medical, food, nature, shapes, sports Make education entertaining with our Healthy Food PowerPoint Templates And PowerPoint Themes 0912. Add color to even the dullest activity.
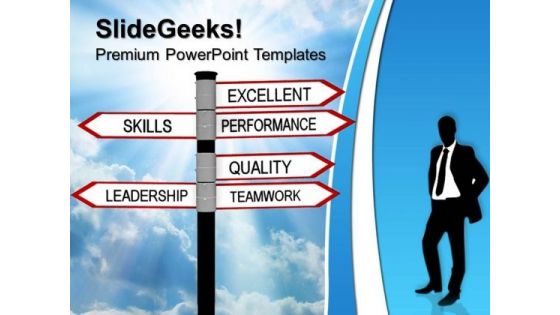
Skills Quality Business PowerPoint Templates And PowerPoint Themes 1012
Skills Quality Business PowerPoint Templates And PowerPoint Themes 1012-Microsoft Powerpoint Templates and Background with business directions-Skills Quality Business PowerPoint Templates And PowerPoint Themes 1012-This PowerPoint template can be used for presentations relating to-Business directions, signs, arrows, people, business, shapes Educate teams with our Skills Quality Business PowerPoint Templates And PowerPoint Themes 1012. Download without worries with our money back guaranteee.

Business Diagram Four Staged Road Sign Diagram For Text Representation Presentation Template
Four staged road sign diagram has been used to design this power point template. This PPT contains the concept of text and data representation. Use this PPT and build quality presentation for your viewers.
Business Strategy Innovation 3d Presentations Of Bar Chart Character Modeling
Your Thoughts Will Be The Main Course. Provide The Dressing With Our business strategy innovation 3d presentations of bar chart character modeling Powerpoint Templates. Dress Up Your Views With Our Marketing Powerpoint Templates. Deliver Your Ideas With Aplomb.
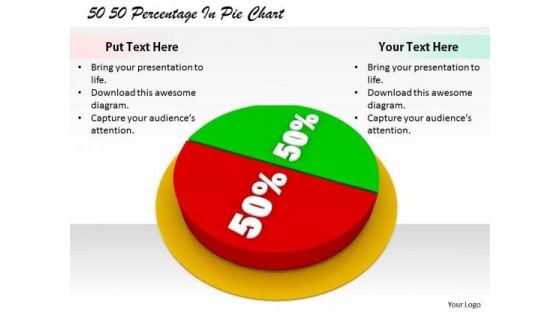
Stock Photo Corporate Business Strategy 50 Percentage Pie Chart Images
Extract admiration from the audience. Create a forceful impact with our stock photo corporate business strategy 50 percentage pie chart images. Force doors open with our finance. The audience will decide to let your thoughts enter.
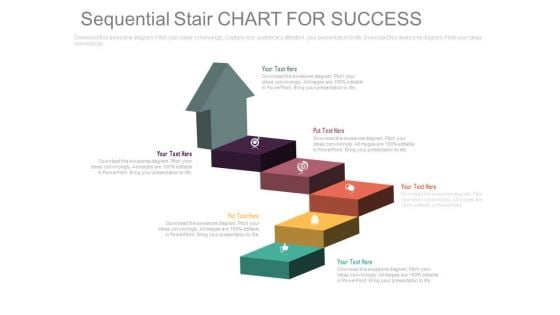
Arrow Steps Chart For Business Success Powerpoint Template
This PowerPoint template has been designed with graphics of arrow steps chart. Download this slide for planning of financial targets. Grab the attention of your listeners with this PPT slide.
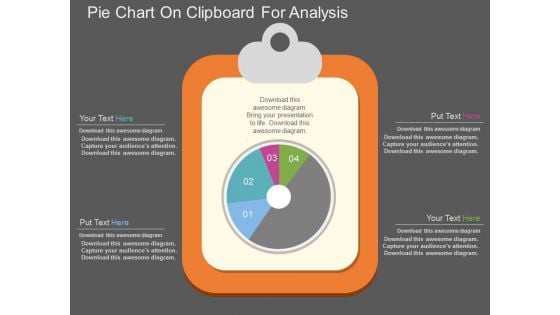
Pie Chart On Clipboard For Analysis Powerpoint Template
This PowerPoint template has been designed with graphics of pie chart on clipboard. Download this PPT slide for business and financial analysis. You may also use this professional template to depict statistical analysis.
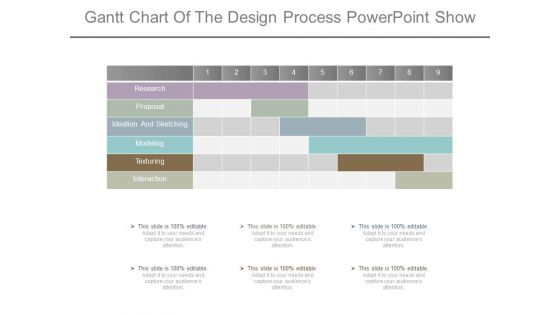
Gantt Chart Of The Design Process Powerpoint Show
This is a gantt chart of the design process powerpoint show. This is a one stage process. The stages in this process are research, proposal, ideation and sketching, modeling, texturing, interaction.
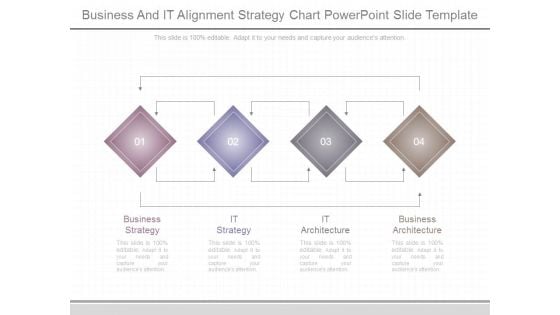
Business And It Alignment Strategy Chart Powerpoint Slide Template
This is a business and it alignment strategy chart powerpoint slide template. This is a four stage process. The stages in this process are business strategy, it strategy, it architecture, business architecture.
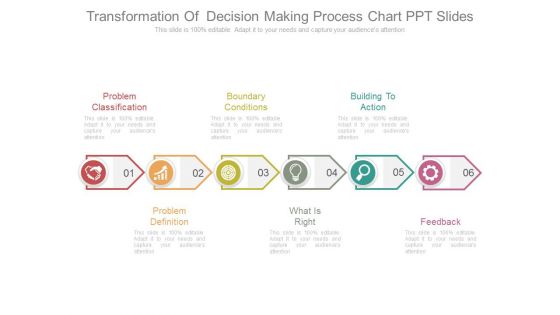
Transformation Of Decision Making Process Chart Ppt Slides
This is a transformation of decision making process chart ppt slides. This is a six stage process. The stages in this process are problem classification, boundary conditions, building to action, problem definition, what is right, feedback.
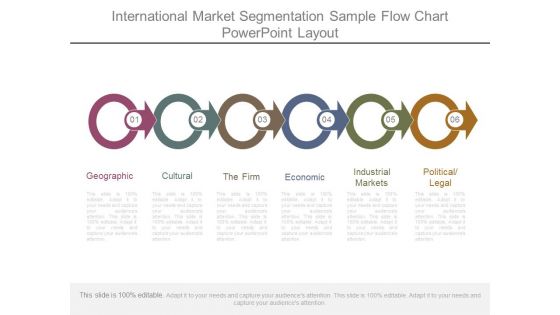
International Market Segmentation Sample Flow Chart Powerpoint Layout
This is a international market segmentation sample flow chart powerpoint layout. This is a six stage process. The stages in this process are geographic, cultural, the firm, economic, industrial markets, political legal.
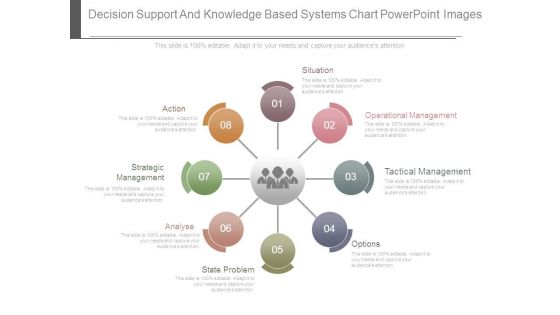
Decision Support And Knowledge Based Systems Chart Powerpoint Images
This is a decision support and knowledge based systems chart powerpoint images. This is a eight stage process. The stages in this process are situation, operational management, tactical management, options, state problem, analyse, strategic management, action.
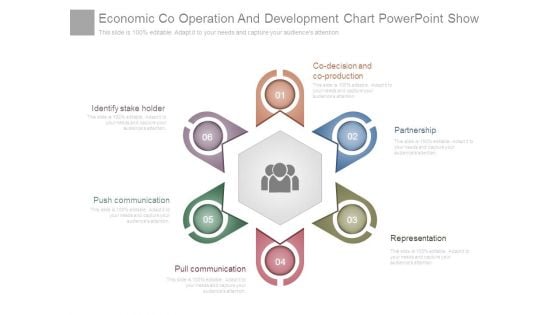
Economic Co Operation And Development Chart Powerpoint Show
This is a economic co operation and development chart powerpoint show. This is a six stage process. The stages in this process are co decision and co production, partnership, representation, pull communication, push communication, identify stake holder.
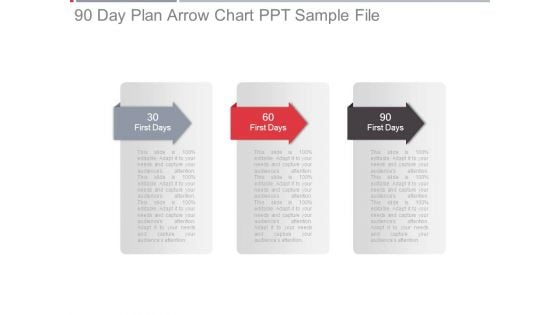
90 Day Plan Arrow Chart Ppt Sample File
This is a 90 day plan arrow chart ppt sample file. This is a three stage process. The stages in this process are 30 first days, 60 first days, 90 first days.
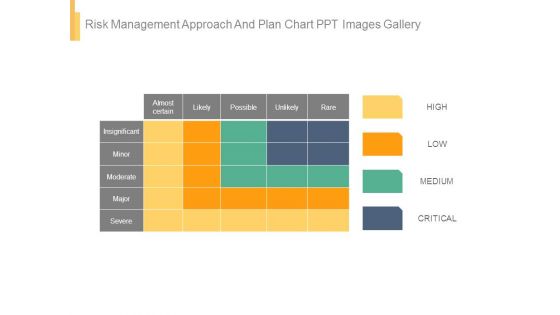
Risk Management Approach And Plan Chart Ppt Images Gallery
This is a risk management approach and plan chart ppt images gallery. This is a four stage process. The stages in this process are almost certain, likely, possible, unlikely, rare, insignificant, minor, moderate, major, severe, high, low, medium, critical.
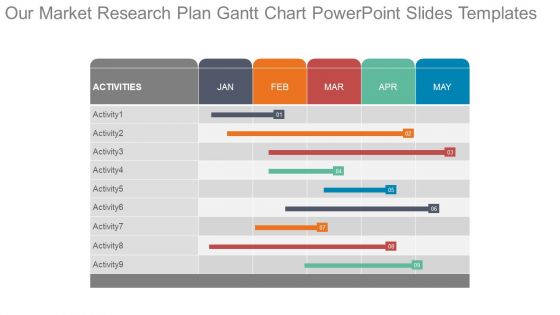
Our Market Research Plan Gantt Chart Powerpoint Slides Templates
This is a our market research plan gantt chart powerpoint slides templates. This is a nine stage process. The stages in this process are activities, jan, feb, mar, apr, may.
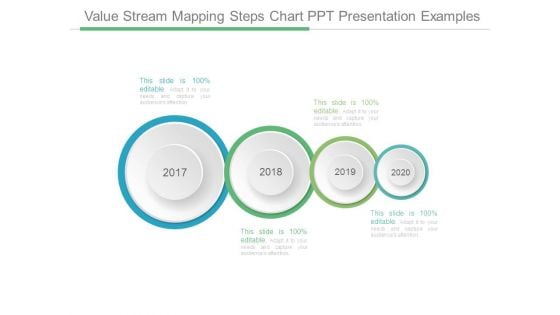
Value Stream Mapping Steps Chart Ppt Presentation Examples
This is a value stream mapping steps chart ppt presentation examples. This is a four stage process. The stages in this process are years, time planning, business, marketing, future.

And R Chart For Six Sigma Powerpoint Slide Background Designs
This is a and r chart for six sigma powerpoint slide background designs. This is a two stage process. The stages in this process are subtitle, option, lcl, ucl.
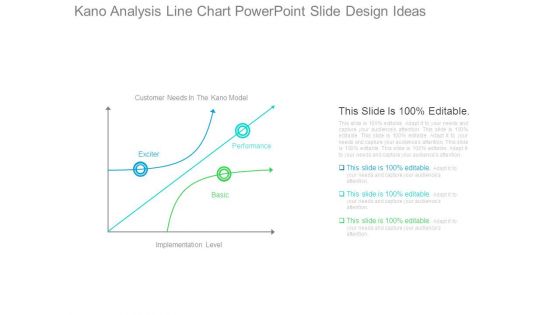
Kano Analysis Line Chart Powerpoint Slide Design Ideas
This is a kano analysis line chart powerpoint slide design ideas. This is a three stage process. The stages in this process are customer needs in the kano model, exciter, performance, basic, implementation level.
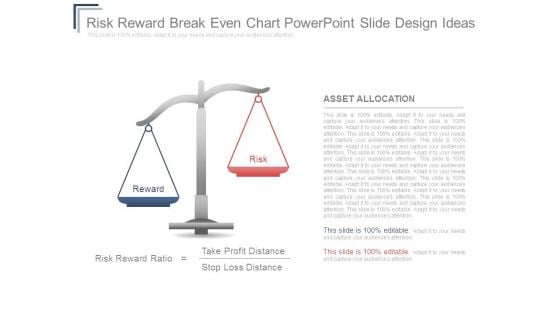
Risk Reward Breakeven Chart Powerpoint Slide Design Ideas
This is a risk reward breakeven chart powerpoint slide design ideas. This is a two stage process. The stages in this process are reward, risk, asset allocation, risk reward ratio, take profit distance, stop loss distance.

Expected Return And Variance Chart Powerpoint Slide Deck Template
This is a expected return and variance chart powerpoint slide deck template. This is a one stage process. The stages in this process are investment reward, reward matrix, high, med, low.
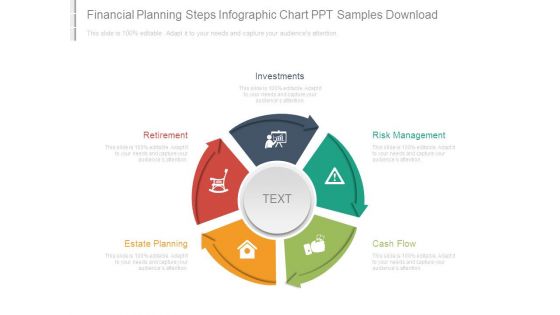
Financial Planning Steps Infographic Chart Ppt Samples Download
This is a financial planning steps infographic chart ppt samples download. This is a five stage process. The stages in this process are investments, retirement, estate planning, risk management, cash flow.
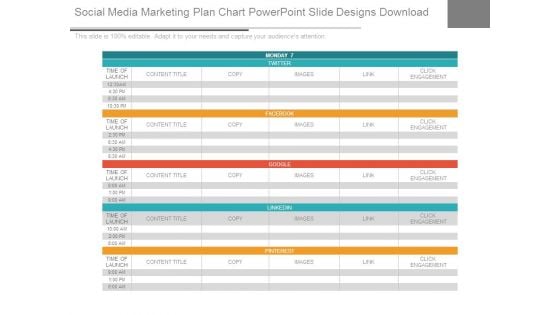
Social Media Marketing Plan Chart Powerpoint Slide Designs Download
This is a social media marketing plan chart powerpoint slide designs download. This is a five stage process. The stages in this process are content title, copy, images, link, click engagement.
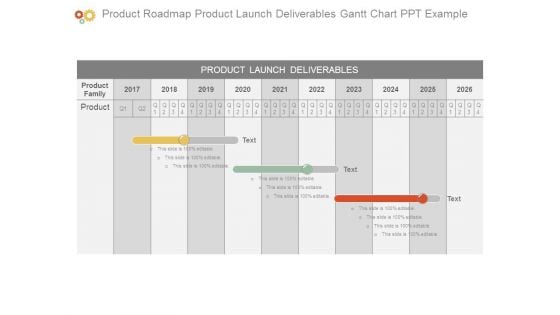
Product Roadmap Product Launch Deliverables Gantt Chart Ppt Example
This is a product roadmap product launch deliverables gantt chart ppt example. This is a three stage process. The stages in this process are product launch deliverables, product family, product.
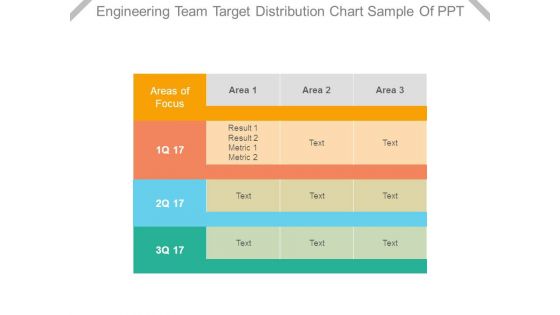
Engineering Team Target Distribution Chart Sample Of Ppt
This is a engineering team target distribution chart sample of ppt. This is a three stage process. The stages in this process are areas of focus, area, result, metric.
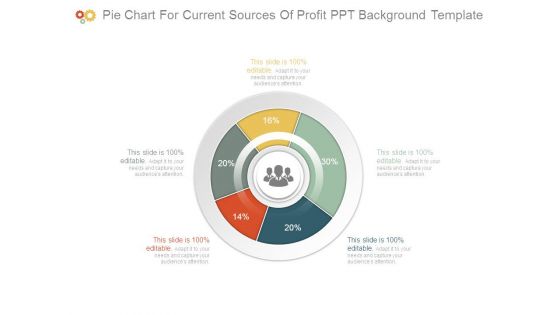
Pie Chart For Current Sources Of Profit Ppt Background Template
This is a pie chart for current sources of profit ppt background template. This is a five stage process. The stages in this process are finance, success, business, marketing, percentage, donut.
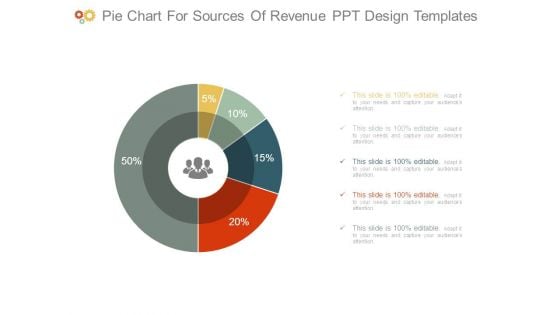
Pie Chart For Sources Of Revenue Ppt Design Templates
This is a pie chart for sources of revenue ppt design templates. This is a five stage process. The stages in this process are finance, success, business, marketing, percentage, donut.
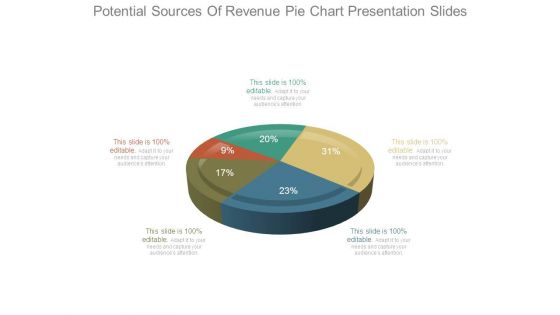
Potential Sources Of Revenue Pie Chart Presentation Slides
This is a potential sources of revenue pie chart presentation slides. This is a five stage process. The stages in this process are finance, success, business, marketing, percentage, pie.
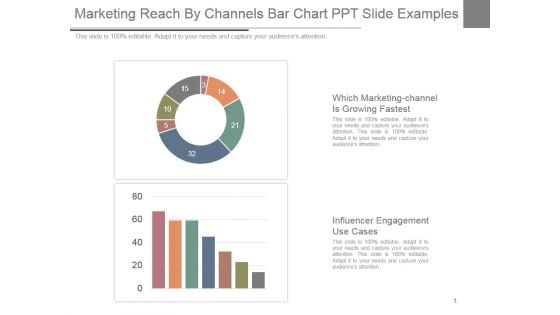
Marketing Reach By Channels Bar Chart Ppt Slide Examples
This is a marketing reach by channels bar chart ppt slide examples. This is a two stage process. The stages in this process are which marketing-channel is growing fastest, influencer engagement use cases.
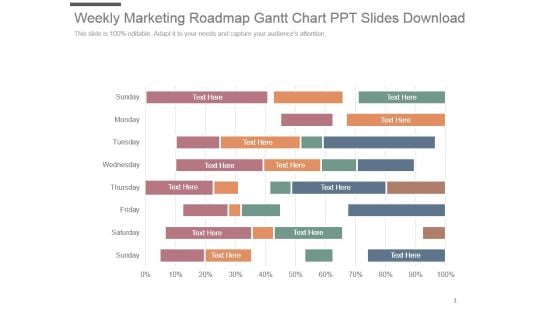
Weekly Marketing Roadmap Gantt Chart Ppt Slides Download
This is a weekly marketing roadmap gantt chart ppt slides download. This is a eight stage process. The stages in this process are sunday, monday, tuesday, wednesday, thursday, friday, saturday, Sunday.
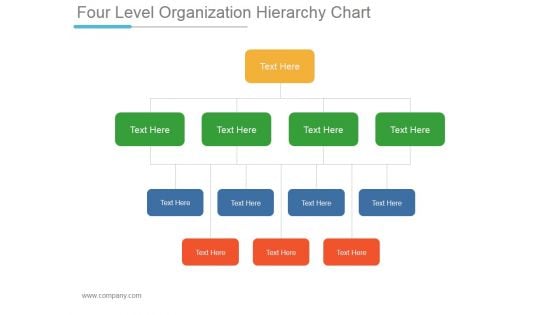
Four Level Organization Hierarchy Chart Ppt PowerPoint Presentation Clipart
This is a four level organization hierarchy chart ppt powerpoint presentation clipart. This is a four stage process. The stages in this process are business, strategy, marketing, management, text.
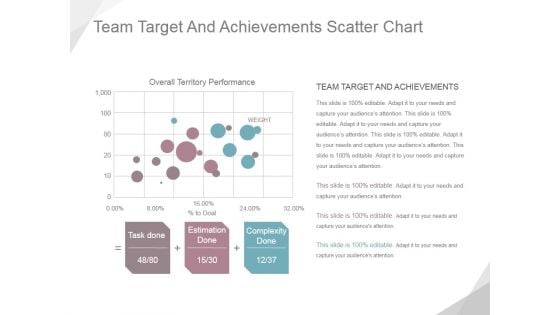
Team Target And Achievements Scatter Chart Ppt PowerPoint Presentation Example
This is a team target and achievements scatter chart ppt powerpoint presentation example. This is a three stage process. The stages in this process are overall territory performance, task done, estimation done, complexity done.
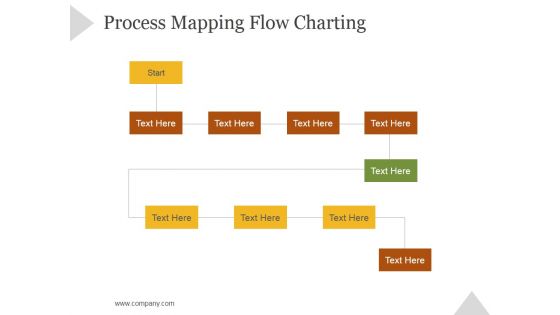
Process Mapping Flow Charting Ppt PowerPoint Presentation Slide Download
This is a process mapping flow charting ppt powerpoint presentation slide download. This is a ten stage process. The stages in this process are business, strategy, marketing, success, growth strategy, flowchart.

Xbar And R Chart Ppt PowerPoint Presentation Example 2015
This is a xbar and r chart ppt powerpoint presentation example 2015. This is a two stage process. The stages in this process are business, strategy, marketing, success, growth strategy.
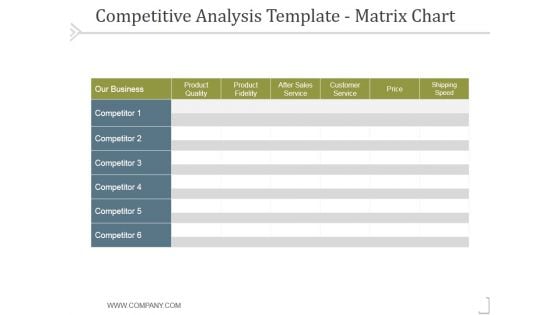
Competitive Analysis Matrix Chart Template 1 Ppt PowerPoint Presentation Deck
This is a competitive analysis matrix chart template 1 ppt powerpoint presentation deck. This is a six stage process. The stages in this process are product quality, product fidelity, after sales service, customer service, shipping speed.
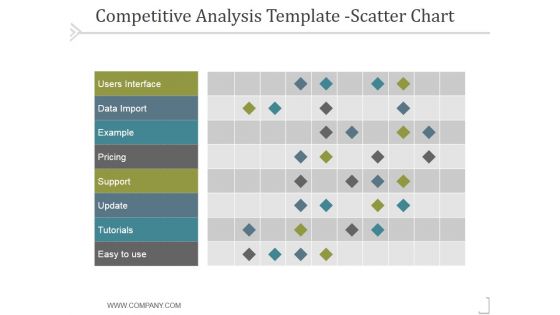
Competitive Analysis Scatter Chart Template 2 Ppt PowerPoint Presentation Files
This is a competitive analysis scatter chart template 2 ppt powerpoint presentation files. This is a nine stage process. The stages in this process are users interface, data import, example, pricing, support, update.
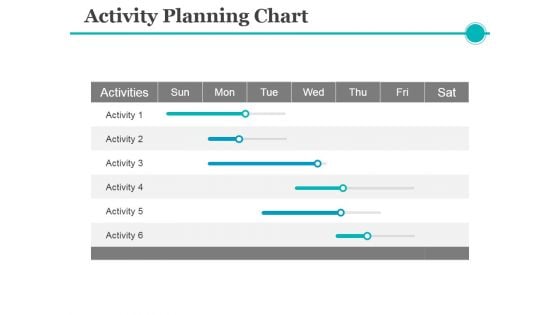
Activity Planning Chart Ppt PowerPoint Presentation Visual Aids Model
This is a activity planning chart ppt powerpoint presentation visual aids model. This is a six stage process. The stages in this process are activities, business, management, table, planning.
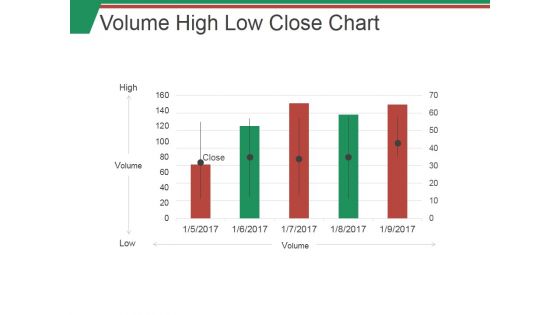
Volume High Low Close Chart Ppt PowerPoint Presentation Outline Examples
This is a volume high low close chart ppt powerpoint presentation outline examples. This is a five stage process. The stages in this process are high, low, volume, graph, business.
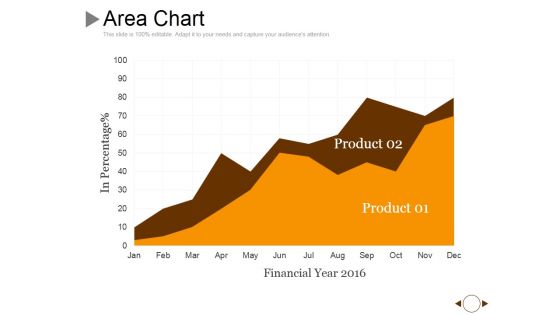
Area Chart Ppt PowerPoint Presentation Show Layout Ideas
This is a area chart ppt powerpoint presentation show layout ideas. This is a two stage process. The stages in this process are product, in percentage, financial year, growth.
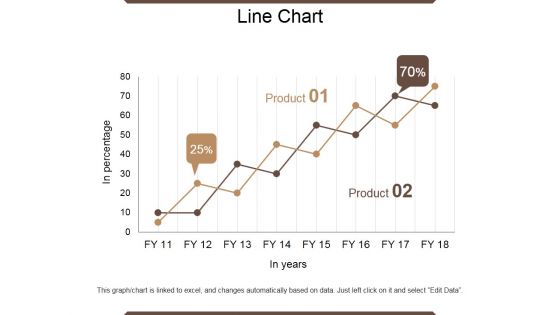
Line Chart Ppt PowerPoint Presentation Outline Infographic Template
This is a line chart ppt powerpoint presentation outline infographic template. This is a two stage process. The stages in this process are in percentage, product, in year, growth, success.
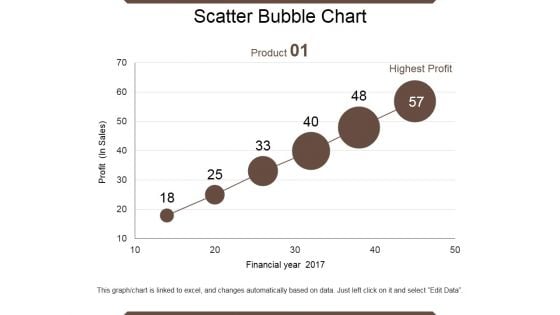
Scatter Bubble Chart Ppt PowerPoint Presentation Summary Files
This is a scatter bubble chart ppt powerpoint presentation summary files. This is a six stage process. The stages in this process are product, financial year, profit, highest profit.
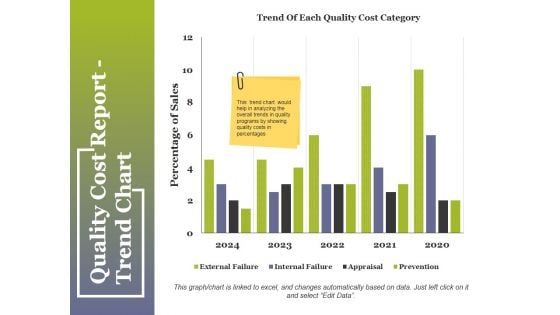
Quality Cost Report Trend Chart Ppt PowerPoint Presentation Summary Pictures
This is a quality cost report trend chart ppt powerpoint presentation summary pictures. This is a two stage process. The stages in this process are compare, business, table, marketing, strategy.
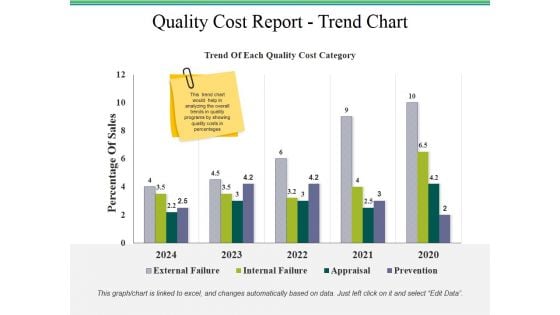
Quality Cost Report Trend Chart Ppt PowerPoint Presentation Styles Templates
This is a quality cost report trend chart ppt powerpoint presentation styles templates. This is a two stage process. The stages in this process are quality cost report, business, finance, marketing, strategy.

Quality Cost Report Trend Chart Ppt PowerPoint Presentation Portfolio Maker
This is a quality cost report trend chart ppt powerpoint presentation portfolio maker. This is a two stage process. The stages in this process are compare, marketing, business, strategy, planning.
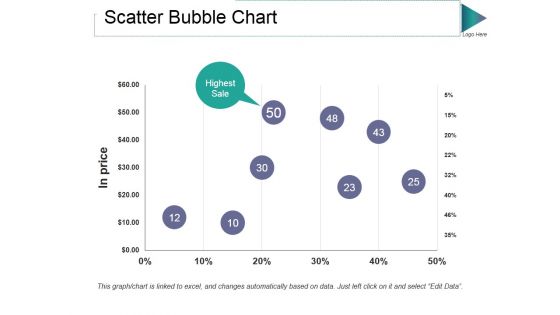
Scatter Bubble Chart Ppt PowerPoint Presentation Gallery Guidelines
This is a scatter bubble chart ppt powerpoint presentation gallery guidelines. This is a one stage process. The stages in this process are in price, highest sale, percentage, finance, business.
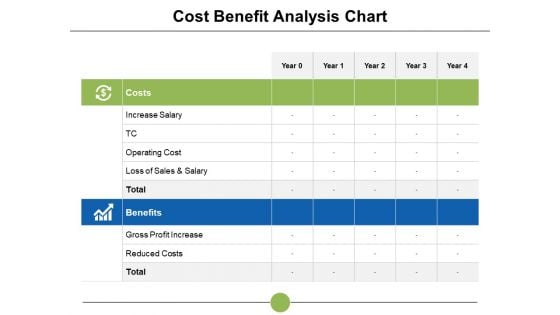
Cost Benefit Analysis Chart Ppt PowerPoint Presentation Slides Example File
This is a cost benefit analysis chart ppt powerpoint presentation slides example file. This is a two stage process. The stages in this process are increase salary, cost benefit, reduced costs, analysis, operating cost.
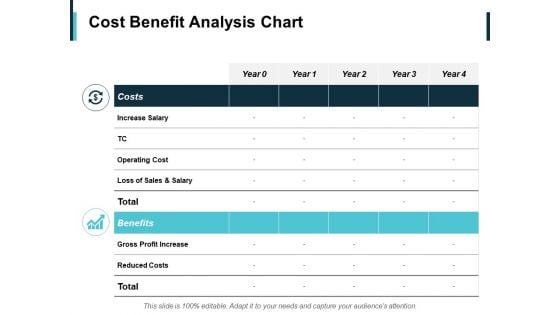
Cost Benefit Analysis Chart Ppt PowerPoint Presentation Ideas Shapes
This is a cost benefit analysis chart ppt powerpoint presentation ideas shapes. This is a two stage process. The stages in this process are reduced costs, operating cost, benefits, costs, increase salary.
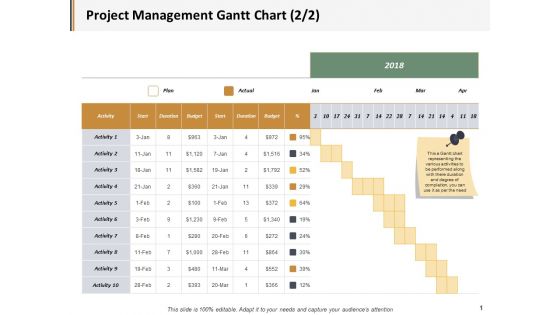
Project Management Gantt Chart Marketing Ppt PowerPoint Presentation Show Guide
This is a project management gantt chart marketing ppt powerpoint presentation show guide. This is a three stage process. The stages in this process are business, management, marketing, compare.
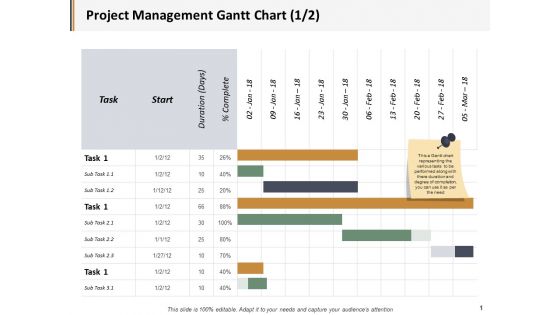
Project Management Gantt Chart Ppt PowerPoint Presentation File Graphic Images
This is a project management gantt chart ppt powerpoint presentation file graphic images. This is a three stage process. The stages in this process are business, management, marketing, compare.
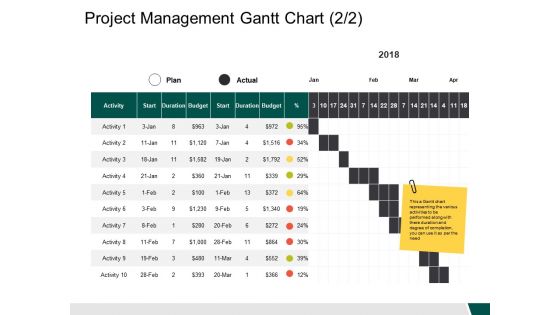
Project Management Gantt Chart Activity Ppt PowerPoint Presentation Inspiration Samples
This is a project management gantt chart activity ppt powerpoint presentation inspiration samples. This is a ten stage process. The stages in this process are business, management, strategy, analysis, marketing.
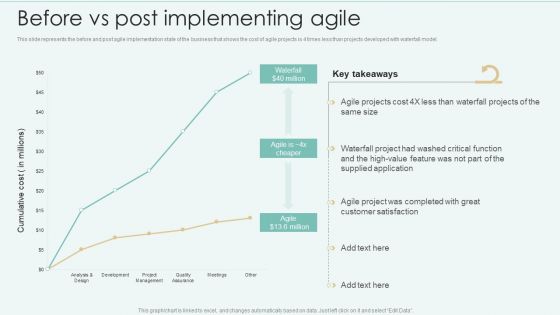
Strategies Of Agile Development To Enhance Processes Before Vs Post Implementing Agile Diagrams PDF
This slide represents the before and post agile implementation state of the business that shows the cost of agile projects is 4 times less than projects developed with waterfall model. Create an editable Strategies Of Agile Development To Enhance Processes Before Vs Post Implementing Agile Diagrams PDF that communicates your idea and engages your audience. Whether you are presenting a business or an educational presentation, pre designed presentation templates help save time. Strategies Of Agile Development To Enhance Processes Before Vs Post Implementing Agile Diagrams PDF is highly customizable and very easy to edit, covering many different styles from creative to business presentations. Slidegeeks has creative team members who have crafted amazing templates. So, go and get them without any delay.
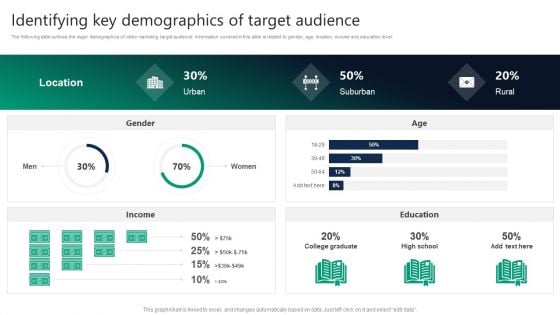
Formulating Video Marketing Strategies To Enhance Sales Identifying Key Demographics Of Target Audience Diagrams PDF
The following slide outlines the major demographics of video marketing target audience. Information covered in this slide is related to gender, age, location, income and education level. Formulating a presentation can take up a lot of effort and time, so the content and message should always be the primary focus. The visuals of the PowerPoint can enhance the presenters message, so our Formulating Video Marketing Strategies To Enhance Sales Identifying Key Demographics Of Target Audience Diagrams PDF was created to help save time. Instead of worrying about the design, the presenter can concentrate on the message while our designers work on creating the ideal templates for whatever situation is needed. Slidegeeks has experts for everything from amazing designs to valuable content, we have put everything into Formulating Video Marketing Strategies To Enhance Sales Identifying Key Demographics Of Target Audience Diagrams PDF.
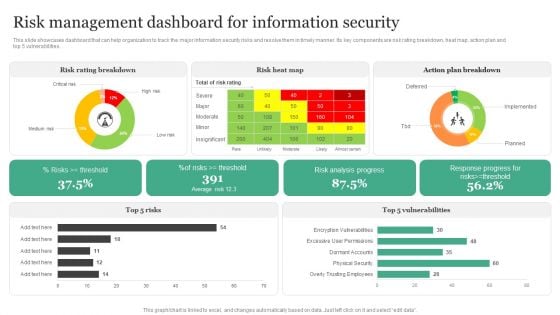
Risk Management Dashboard For Information Security Information Security Risk Administration Diagrams PDF
This slide showcases dashboard that can help organization to track the major information security risks and resolve them in timely manner. Its key components are risk rating breakdown, heat map, action plan and top 5 vulnerabilities.Create an editable Risk Management Dashboard For Information Security Information Security Risk Administration Diagrams PDF that communicates your idea and engages your audience. Whether you are presenting a business or an educational presentation, pre-designed presentation templates help save time. Risk Management Dashboard For Information Security Information Security Risk Administration Diagrams PDF is highly customizable and very easy to edit, covering many different styles from creative to business presentations. Slidegeeks has creative team members who have crafted amazing templates. So, go and get them without any delay.
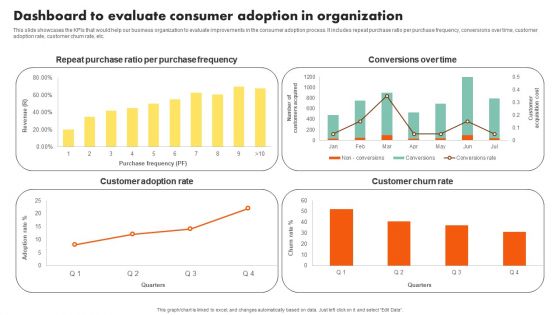
Examining Customer Experience Path To Enhance Adoption Rate Dashboard To Evaluate Consumer Adoption Diagrams PDF
This slide showcases the KPIs that would help our business organization to evaluate improvements in the consumer adoption process. It includes repeat purchase ratio per purchase frequency, conversions over time, customer adoption rate, customer churn rate, etc. Create an editable Examining Customer Experience Path To Enhance Adoption Rate Dashboard To Evaluate Consumer Adoption Diagrams PDF that communicates your idea and engages your audience. Whether youre presenting a business or an educational presentation, pre designed presentation templates help save time. Examining Customer Experience Path To Enhance Adoption Rate Dashboard To Evaluate Consumer Adoption Diagrams PDF is highly customizable and very easy to edit, covering many different styles from creative to business presentations. Slidegeeks has creative team members who have crafted amazing templates. So, go and get them without any delay.
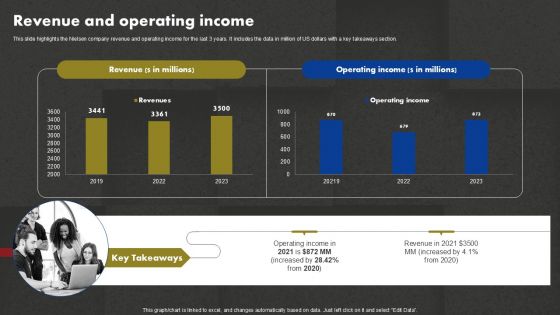
Data And Customer Analysis Company Outline Revenue And Operating Income Diagrams PDF
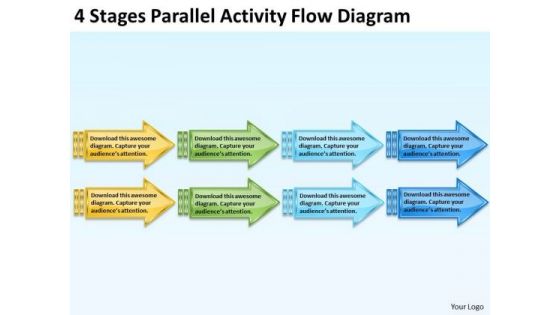
4 Stages Parallel Activity Flow Diagram Steps To Making Business Plan PowerPoint Slides
We present our 4 stages parallel activity flow diagram steps to making business plan PowerPoint Slides.Download our Finance PowerPoint Templates because Our PowerPoint Templates and Slides will fulfill your every need. Use them and effectively satisfy the desires of your audience. Use our Arrows PowerPoint Templates because Our PowerPoint Templates and Slides will let you Clearly mark the path for others to follow. Download our Business PowerPoint Templates because Our PowerPoint Templates and Slides are specially created by a professional team with vast experience. They diligently strive to come up with the right vehicle for your brilliant Ideas. Use our Process and Flows PowerPoint Templates because It will mark the footprints of your journey. Illustrate how they will lead you to your desired destination. Download and present our Success PowerPoint Templates because You can Be the star of the show with our PowerPoint Templates and Slides. Rock the stage with your ideas.Use these PowerPoint slides for presentations relating to 3d, Arrow, Banner, Business, Business Concept, Chart, Description, Development, Diagram, Direction, Element, Empty, Financial, Flow, Flowchart, Future, Gradient, Graph, Graphic, Illustration, Isolated, Mirrored, Object, Placeholder, Presentation, Process, Section, Segment, Set, Shape, Sign, Steps, Symbol, Template, Topic, Vector. The prominent colors used in the PowerPoint template are Green, Yellow, Blue. Presenters tell us our 4 stages parallel activity flow diagram steps to making business plan PowerPoint Slides will make you look like a winner. We assure you our Chart PowerPoint templates and PPT Slides are effectively colour coded to prioritise your plans They automatically highlight the sequence of events you desire. Professionals tell us our 4 stages parallel activity flow diagram steps to making business plan PowerPoint Slides are incredible easy to use. We assure you our Business PowerPoint templates and PPT Slides are effectively colour coded to prioritise your plans They automatically highlight the sequence of events you desire. People tell us our 4 stages parallel activity flow diagram steps to making business plan PowerPoint Slides will help you be quick off the draw. Just enter your specific text and see your points hit home. The feedback we get is that our Concept PowerPoint templates and PPT Slides are designed by a team of presentation professionals. Get rid of banality with our 4 Stages Parallel Activity Flow Diagram Steps To Making Business Plan PowerPoint Slides. Take any boredom out of the equation.

Effort Saving Grid Chart For Business Ppt PowerPoint Presentation Ideas Example File PDF
Presenting effort saving grid chart for business ppt powerpoint presentation ideas example file pdf to dispense important information. This template comprises two stages. It also presents valuable insights into the topics including effort saving grid chart for business. This is a completely customizable PowerPoint theme that can be put to use immediately. So, download it and address the topic impactfully.
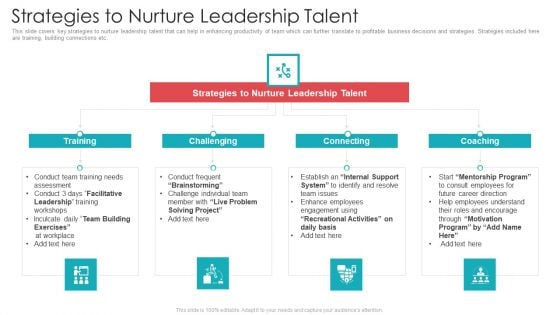
Official Team Collaboration Plan Strategies To Nurture Leadership Talent Background PDF
This slide covers key strategies to nurture leadership talent that can help in enhancing productivity of team which can further translate to profitable business decisions and strategies. Strategies included here are training, building connections etc. This is a official team collaboration plan strategies to nurture leadership talent background pdf template with various stages. Focus and dispense information on four stages using this creative set, that comes with editable features. It contains large content boxes to add your information on topics like training, challenging, connecting, coaching. You can also showcase facts, figures, and other relevant content using this PPT layout. Grab it now.
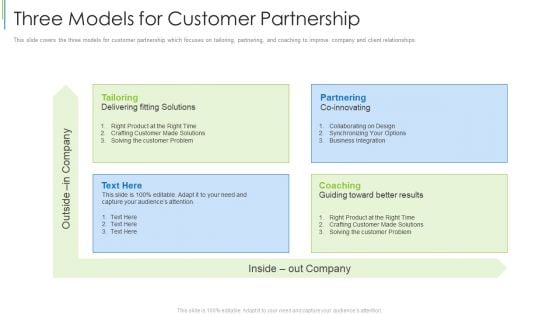
Three Models For Customer Partnership Ppt Professional Infographics PDF
This slide covers the three models for customer partnership which focuses on tailoring, partnering, and coaching to improve company and client relationships. This is a three models for customer partnership ppt professional infographics pdf template with various stages. Focus and dispense information on four stages using this creative set, that comes with editable features. It contains large content boxes to add your information on topics like three models for customer partnership. You can also showcase facts, figures, and other relevant content using this PPT layout. Grab it now.
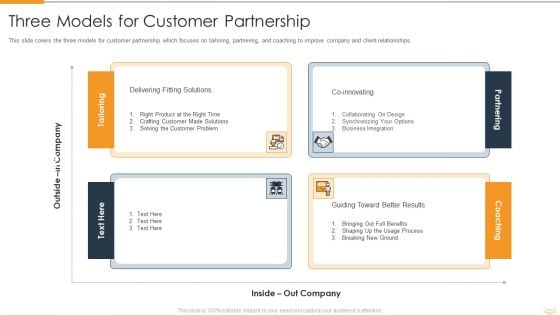
Strategic Partnership Management Plan Three Models For Customer Partnership Mockup PDF
This slide covers the three models for customer partnership which focuses on tailoring, partnering, and coaching to improve company and client relationships. This is a strategic partnership management plan three models for customer partnership mockup pdf template with various stages. Focus and dispense information on four stages using this creative set, that comes with editable features. It contains large content boxes to add your information on topics like guiding toward better results, co innovating, delivering fitting solutions. You can also showcase facts, figures, and other relevant content using this PPT layout. Grab it now.

 Home
Home