Technology Education
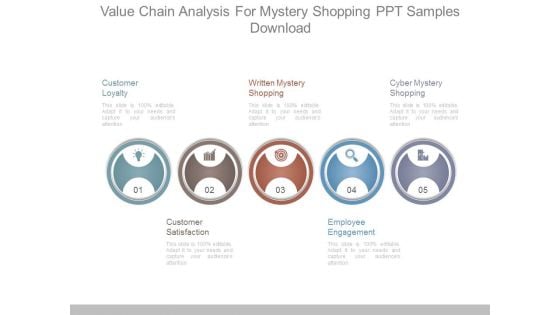
Value Chain Analysis For Mystery Shopping Ppt Samples Download
This is a value chain analysis for mystery shopping ppt samples download. This is a five stage process. The stages in this process are customer loyalty, written mystery shopping, cyber mystery shopping, customer satisfaction, employee engagement.
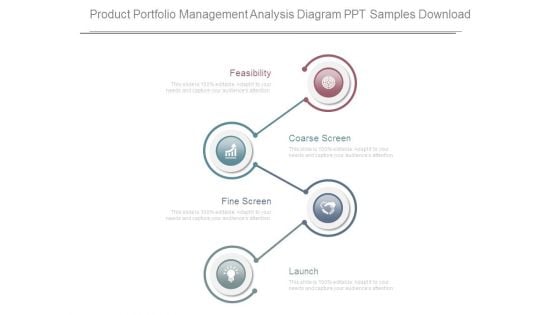
Product Portfolio Management Analysis Diagram Ppt Samples Download
This is a product portfolio management analysis diagram ppt samples download. This is a four stage process. The stages in this process are feasibility, coarse screen, fine screen, launch.
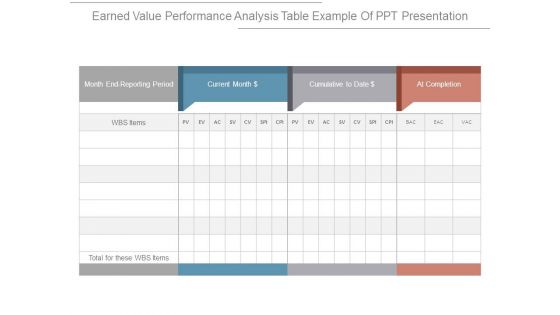
Earned Value Performance Analysis Table Example Of Ppt Presentation
This is a earned value performance analysis table example of ppt presentation. This is a three stage process. The stages in this process are month end reporting period, current month, cumulative to date, at completion.
Our Product Vs Competition Analysis Chart Powerpoint Slide Background Designs
This is a our product vs competition analysis chart powerpoint slide background designs. This is a four stage process. The stages in this process are business, marketing, success, strategy, compare.
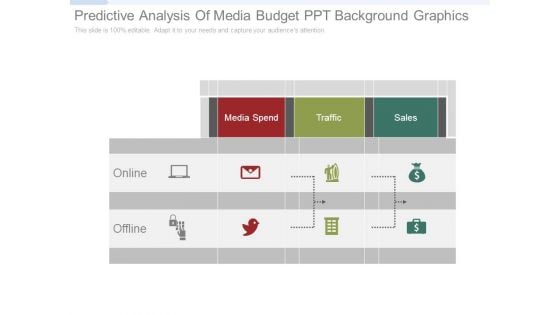
Predictive Analysis Of Media Budget Ppt Background Graphics
This is a predictive analysis of media budget ppt background graphics. This is a three stage process. The stages in this process are online, offline, media spend, traffic, sales.
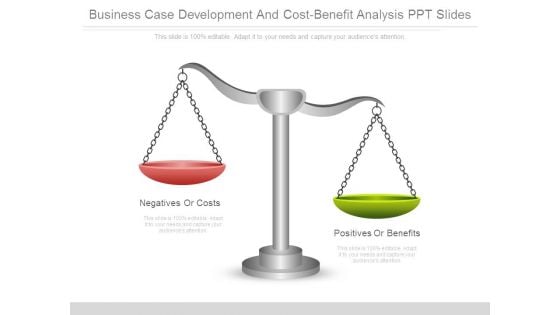
Business Case Development And Cost Benefit Analysis Ppt Slides
This is a business case development and cost benefit analysis ppt slides. This is a two stage process. The stages in this process are negatives or costs, positives or benefits.
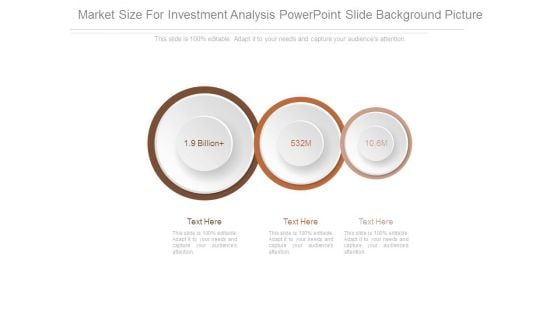
Market Size For Investment Analysis Powerpoint Slide Background Picture
This is a market size for investment analysis powerpoint slide background picture. This is a three stage process. The stages in this process are business, marketing, success, strategy, management.
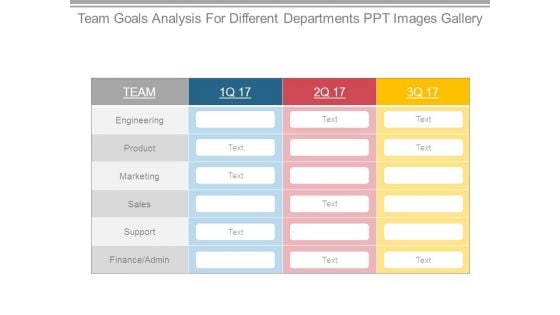
Team Goals Analysis For Different Departments Ppt Images Gallery
This is a team goals analysis for different departments ppt images gallery. This is a three stage process. The stages in this process are engineering, product, marketing, sales, support, finance admin.

Stakeholders Fund And Market Analysis Bar Graph Powerpoint Slide Information
This is a stakeholders fund and market analysis bar graph powerpoint slide information. This is a five stage process. The stages in this process are shareholders funds, market capitalization, market capitalization as a percentage of cse market capitalization.
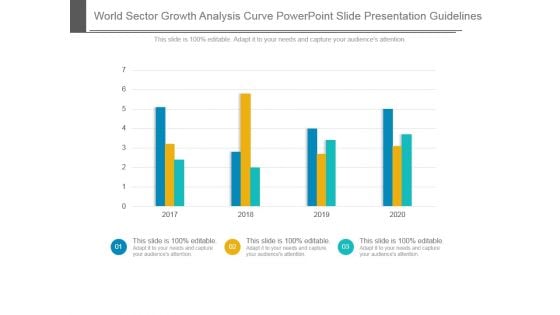
World Sector Growth Analysis Curve Powerpoint Slide Presentation Guidelines
This is a world sector growth analysis curve powerpoint slide presentation guidelines. This is a four stage process. The stages in this process are chart, business, presentation, strategy, presentation.

Marketing And Launch Cost Analysis Ppt PowerPoint Presentation File Outfit
This is a marketing and launch cost analysis ppt powerpoint presentation file outfit. This is a two stage process. The stages in this process are event, guerrilla marketing, social media, pay with a tweet.
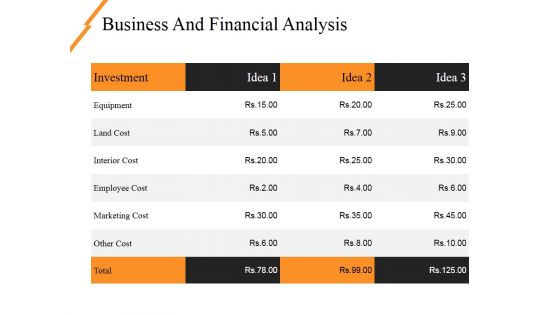
Business And Financial Analysis Ppt PowerPoint Presentation Inspiration Structure
This is a business and financial analysis ppt powerpoint presentation inspiration structure. This is a three stage process. The stages in this process are equipment, land cost, interior cost, employee cost, marketing cost.
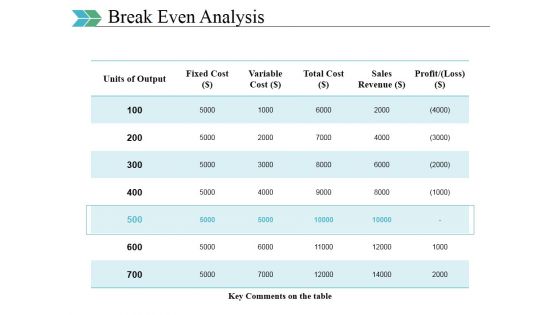
Break Even Analysis Ppt PowerPoint Presentation Styles Influencers
This is a break even analysis ppt powerpoint presentation styles influencers. This is a five stage process. The stages in this process are units of output, fixed cost, variable cost, total cost, sales revenue.
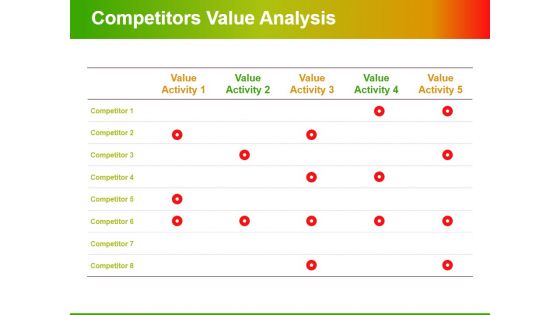
Competitors Value Analysis Ppt PowerPoint Presentation Inspiration Template
This is a competitors value analysis ppt powerpoint presentation inspiration template. This is a five stage process. The stages in this process are value activity, competitor, table, business, marketing.
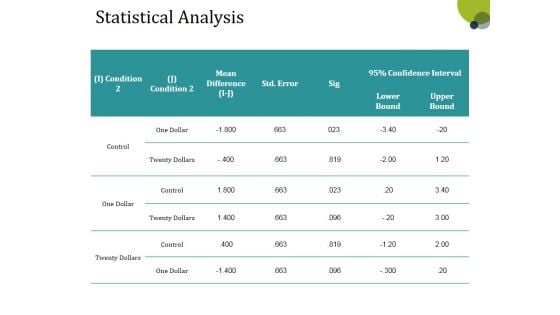
Statistical Analysis Template 1 Ppt PowerPoint Presentation Infographics Show
This is a statistical analysis template 1 ppt powerpoint presentation infographics show. This is a three stage process. The stages in this process are one dollar, control, condition, lower bound, upper bound.
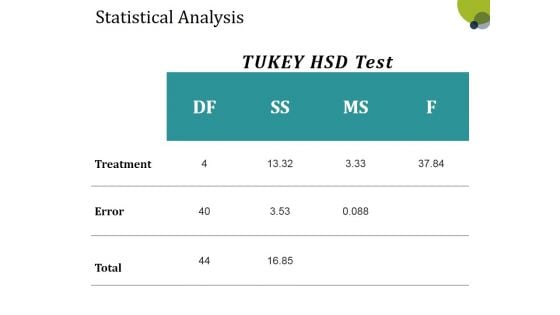
Statistical Analysis Template 2 Ppt PowerPoint Presentation Summary Visuals
This is a statistical analysis template 2 ppt powerpoint presentation summary visuals. This is a three stage process. The stages in this process are treatment, error, total, business, table.
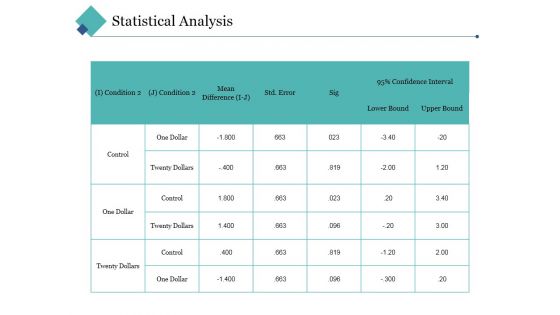
Statistical Analysis Template 1 Ppt PowerPoint Presentation Styles Inspiration
This is a statistical analysis template 1 ppt powerpoint presentation styles inspiration. This is a three stage process. The stages in this process are control, condition, mean difference, lower bound, upper bound.
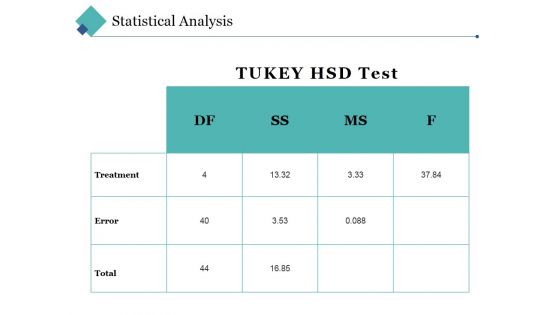
Statistical Analysis Template 2 Ppt PowerPoint Presentation Layouts Background Image
This is a statistical analysis template 2 ppt powerpoint presentation layouts background image. This is a three stage process. The stages in this process are treatment, error, total, table, business.
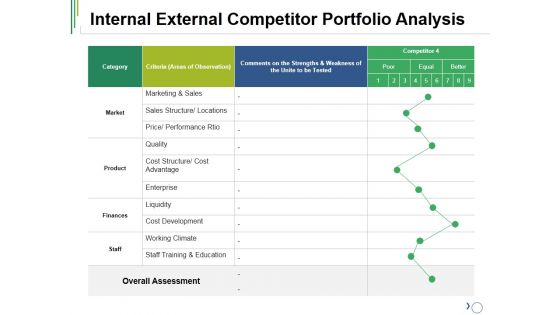
Internal External Competitor Portfolio Analysis Ppt PowerPoint Presentation Model Show
This is a internal external competitor portfolio analysis ppt powerpoint presentation model show. This is a four stage process. The stages in this process are market, product, finance, staff, category.

Overhead Cost Budget Analysis Ppt PowerPoint Presentation Professional
This is a overhead cost budget analysis ppt powerpoint presentation professional. This is a five stage process. The stages in this process are manufacturing overhead costs, variance, forecast, indirect labour, plant and infrastructure.
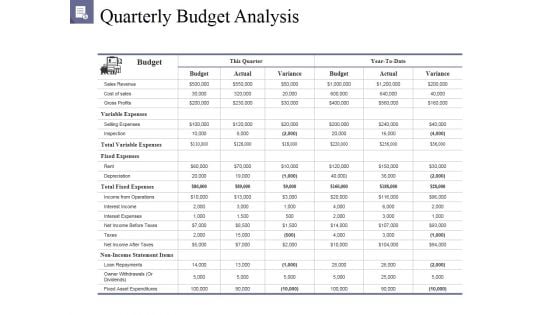
Quarterly Budget Analysis Ppt PowerPoint Presentation Outline Background Image
This is a quarterly budget analysis ppt powerpoint presentation outline background image. This is a two stage process. The stages in this process are budget, this quarter, sales revenue, cost of sales, gross profits.
Internal External Competitor Portfolio Analysis Ppt PowerPoint Presentation Icon Background
This is a internal external competitor portfolio analysis ppt powerpoint presentation icon background. This is a three stage process. The stages in this process are category, market, product, finances, staff.
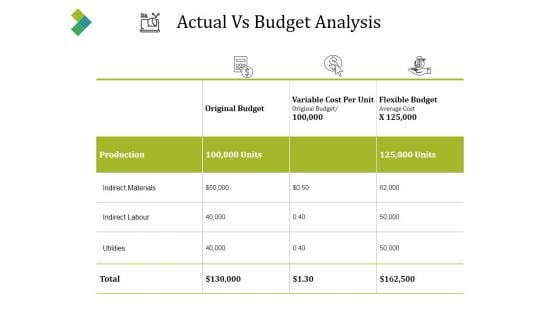
Actual Vs Budget Analysis Ppt PowerPoint Presentation Gallery Master Slide
This is a actual vs budget analysis ppt powerpoint presentation gallery master slide. This is a three stage process. The stages in this process are original budget, flexible cost, indirect labour, utilities, production.
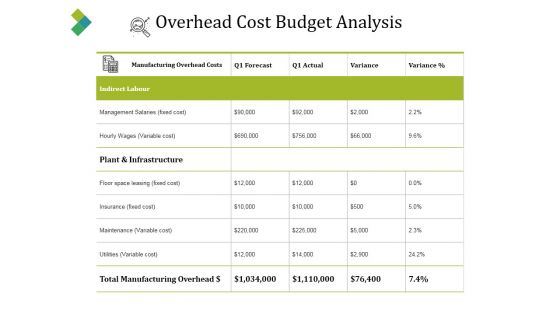
Overhead Cost Budget Analysis Ppt PowerPoint Presentation Pictures Example
This is a overhead cost budget analysis ppt powerpoint presentation pictures example. This is a four stage process. The stages in this process are forecast, actual, variance, indirect labour, utilities.
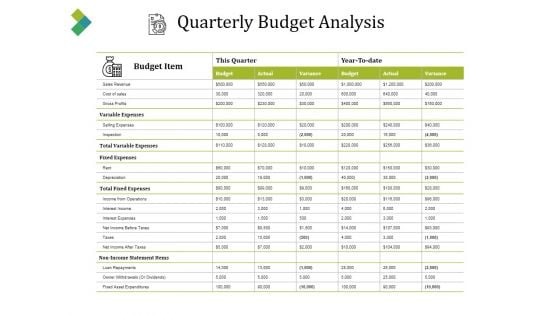
Quarterly Budget Analysis Ppt PowerPoint Presentation Ideas Infographics
This is a quarterly budget analysis ppt powerpoint presentation ideas infographics. This is a two stage process. The stages in this process are budget item, this quarter, budget, actual, variance.
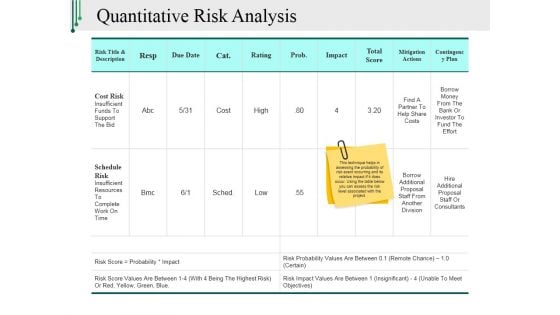
Quantitative Risk Analysis Ppt PowerPoint Presentation Ideas Guide
This is a quantitative risk analysis ppt powerpoint presentation ideas guide. This is a two stage process. The stages in this process are resp, rating, impact, total score, contingency plan.
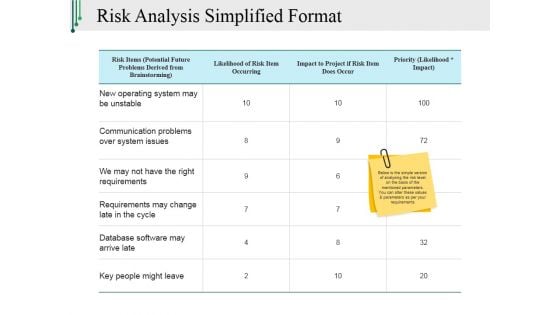
Risk Analysis Simplified Format Ppt PowerPoint Presentation Show Demonstration
This is a risk analysis simplified format ppt powerpoint presentation show demonstration. This is a three stage process. The stages in this process are priority, likelihood of risk item occurring, impact to project if risk item does occur.
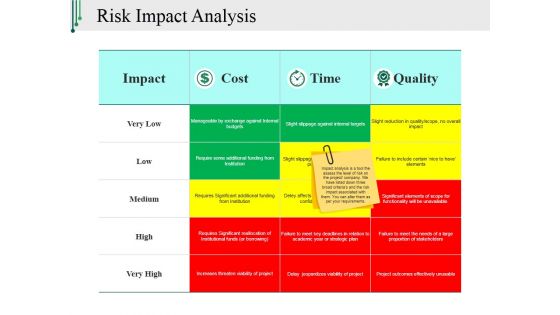
Risk Impact Analysis Ppt PowerPoint Presentation Styles Master Slide
This is a risk impact analysis ppt powerpoint presentation styles master slide. This is a three stage process. The stages in this process are impact, high, low, medium, quality.
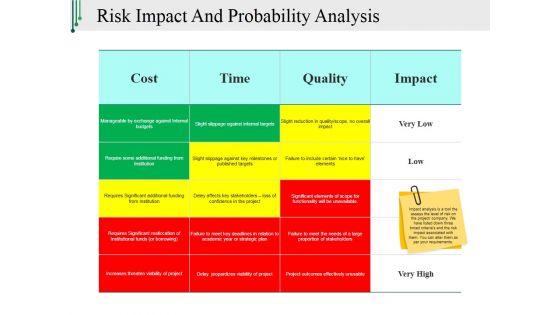
Risk Impact And Probability Analysis Ppt PowerPoint Presentation Slides Topics
This is a risk impact and probability analysis ppt powerpoint presentation slides topics. This is a three stage process. The stages in this process are cost, time, quality, impact, low.
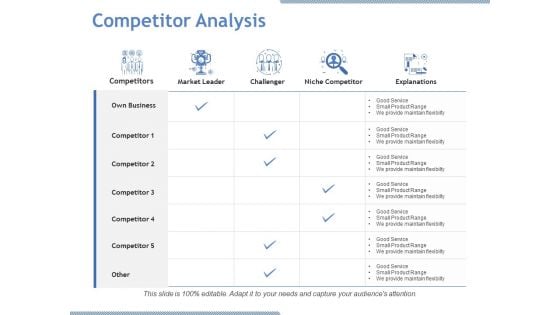
Competitor Analysis Ppt PowerPoint Presentation Model Layout Ideas
This is a competitor analysis ppt powerpoint presentation model layout ideas. This is a five stage process. The stages in this process are competitors, market leader, challenger, explanations, niche competitor.
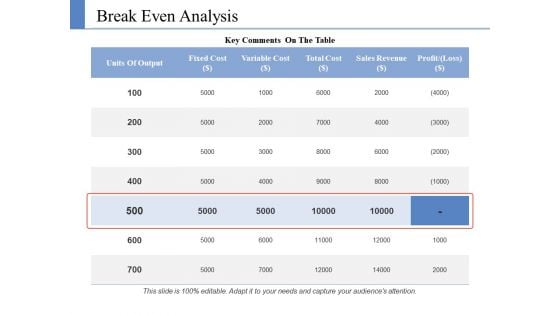
Break Even Analysis Ppt PowerPoint Presentation Portfolio Graphics Design
This is a break even analysis ppt powerpoint presentation portfolio graphics design. This is a five stage process. The stages in this process are units of output, fixed cost, variable cost, total cost, sales revenue.

Market Analysis And Key Competitors Ppt PowerPoint Presentation File Show
This is a market analysis and key competitors ppt powerpoint presentation file show. This is a three stage process. The stages in this process are market share, competitive landscape, top debtors and creditors.
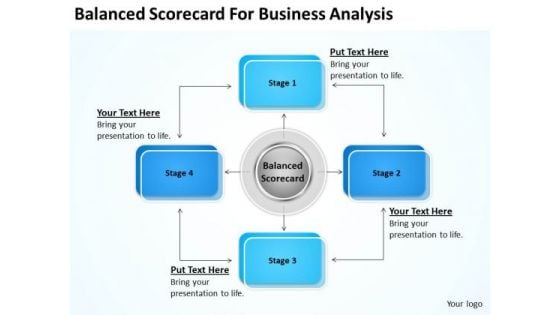
Strategy PowerPoint Template Balanced Scorecard For Business Analysis Ppt Slides
Our strategy powerpoint template balanced scorecard for business analysis ppt Slides will will follow the drill. They accomplish the task assigned to them. Do the drill with our Arrows PowerPoint Templates. Your ideas will march ahead. Place the orders with your thoughts. Our Success PowerPoint Templates know the drill. Lay the bait with our Strategy PowerPoint Template Balanced Scorecard For Business Analysis Ppt Slides. Get them hooked onto your ideas.

Market Fluctuation Analysis PowerPoint Templates Ppt Backgrounds For Slides 0613
Our Market Fluctuation Analysis PowerPoint Templates PPT Backgrounds For Slides are created cost effective. They understand the need for economy. Your grasp of economics is well known. Help your audience comprehend issues with our arrows PowerPoint Templates. Strike a bargain with our money PowerPoint Templates. Your thoughts will get a winning deal. Father them through testing times. Bear the burden with our Market Fluctuation Analysis PowerPoint Templates Ppt Backgrounds For Slides 0613.
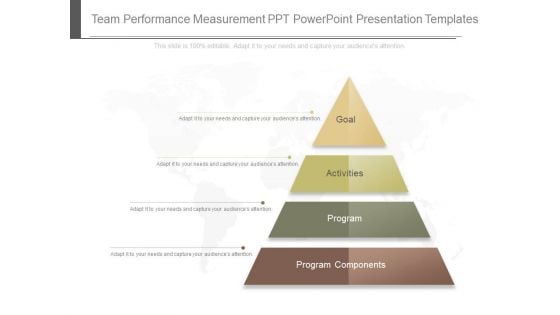
Team Performance Measurement Ppt Powerpoint Presentation Templates
This is a team performance measurement ppt powerpoint presentation templates. This is a four stage process. The stages in this process are goal, activities, program, program components.
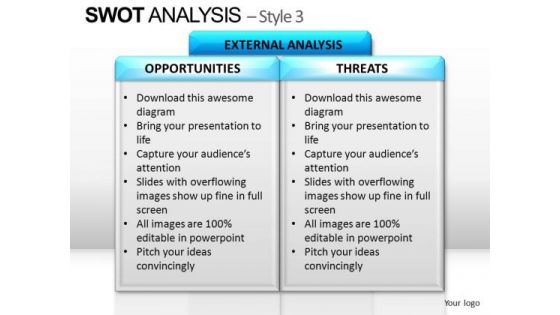
PowerPoint Design Slides Strategy Swot Analysis Ppt Design
PowerPoint Design Slides Strategy SWOT Analysis PPT Design.pptx-These high quality powerpoint pre-designed slides and powerpoint templates have been carefully created by our professional team to help you impress your audience. All slides have been created and are 100% editable in powerpoint. Each and every property of any graphic - color, size, orientation, shading, outline etc. can be modified to help you build an effective powerpoint presentation. Any text can be entered at any point in the powerpoint template or slide. Simply DOWNLOAD, TYPE and PRESENT! With our PowerPoint Design Slides Strategy Swot Analysis Ppt Design there is no dearth of ideas. They crop up everywhere.
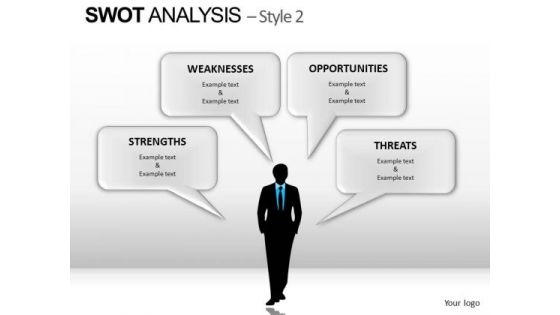
PowerPoint Presentation Designs Editable Swot Analysis Ppt Slidelayout
PowerPoint Presentation Designs Editable SWOT Analysis PPT Slidelayout.pptx-These high quality powerpoint pre-designed slides and powerpoint templates have been carefully created by our professional team to help you impress your audience. All slides have been created and are 100% editable in powerpoint. Each and every property of any graphic - color, size, orientation, shading, outline etc. can be modified to help you build an effective powerpoint presentation. Any text can be entered at any point in the powerpoint template or slide. Simply DOWNLOAD, TYPE and PRESENT! Our PowerPoint Presentation Designs Editable Swot Analysis Ppt Slidelayout will crown your ideas. They will get an exalted status.
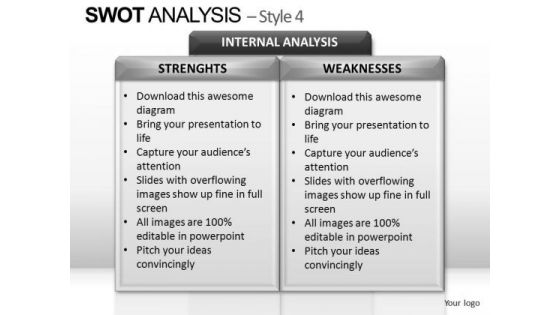
PowerPoint Presentation Designs Teamwork Swot Analysis Ppt Design
PowerPoint Presentation Designs Teamwork SWOT Analysis PPT Design.pptx-These high quality powerpoint pre-designed slides and powerpoint templates have been carefully created by our professional team to help you impress your audience. All slides have been created and are 100% editable in powerpoint. Each and every property of any graphic - color, size, orientation, shading, outline etc. can be modified to help you build an effective powerpoint presentation. Any text can be entered at any point in the powerpoint template or slide. Simply DOWNLOAD, TYPE and PRESENT! Assist the audience to comprehend with our PowerPoint Presentation Designs Teamwork Swot Analysis Ppt Design. They will always be in your debt.
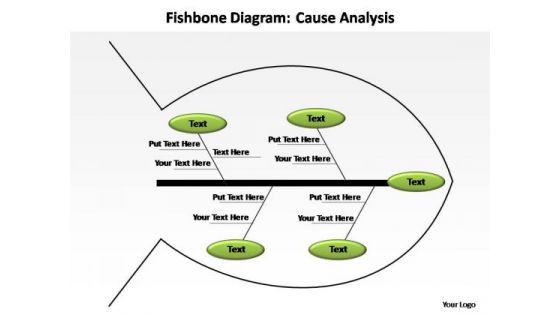
PowerPoint Slide Designs Image Cause Analysis Ppt Backgrounds
PowerPoint Slide Designs Image Cause Analysis PPT Backgrounds--These amazing PowerPoint pre-deSignsed slides and PowerPoint templates have been carefully created by our team of experts to help you impress your audience. Our stunning collection of Powerpoint slides are 100% editable and can easily fit in any PowerPoint presentations. By using these animations and graphics in PowerPoint and you can easily make professional presentations. Any text can be entered at any point in the PowerPoint template or slide. Just DOWNLOAD our awesome PowerPoint templates and you are ready to go. Exercise options with our PowerPoint Slide Designs Image Cause Analysis Ppt Backgrounds. Find answers to multiple challenges.
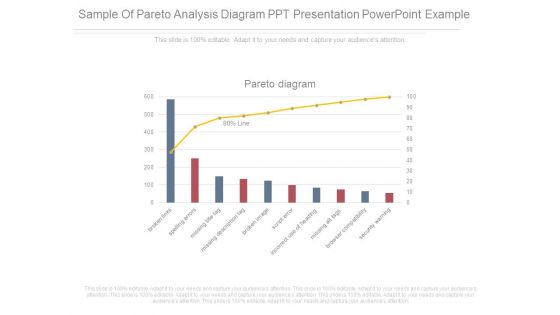
Sample Of Pareto Analysis Diagram Ppt Presentation Powerpoint Example
This is a sample of pareto analysis diagram ppt presentation powerpoint example. This is a ten stage process. The stages in this process are pareto diagram, broken links, spelling errors, missing title tag, missing description tag, broken image, script error, incorrect use of heading, missing alt tags, browser capability, security warning.
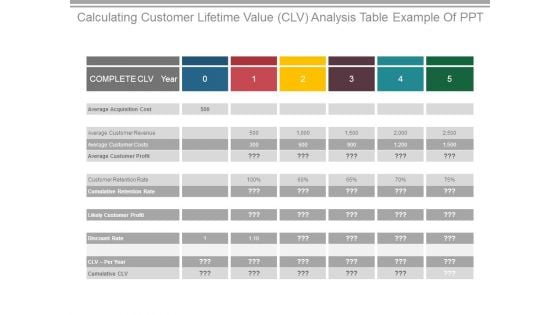
Calculating Customer Lifetime Value Clv Analysis Table Example Of Ppt
This is a calculating customer lifetime value clv analysis table example of ppt. This is a five stage process. The stages in this process are complete clv year, average acquisition cost, average customer revenue, average customer costs, average customer profit, customer retention rate, likely customer profit, discount rate.
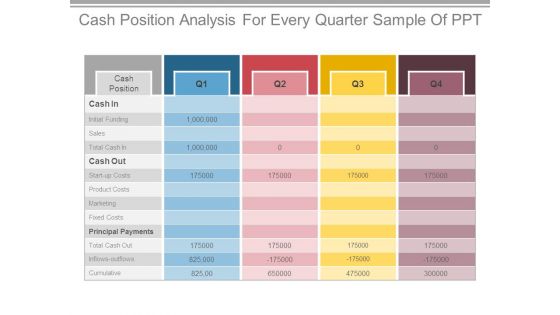
Cash Position Analysis For Every Quarter Sample Of Ppt
This is a cash position analysis for every quarter sample of ppt. This is a four stage process. The stages in this process are cash position, initial funding, sales, start up costs, product costs, marketing, fixed costs, principal payments, total cash out.
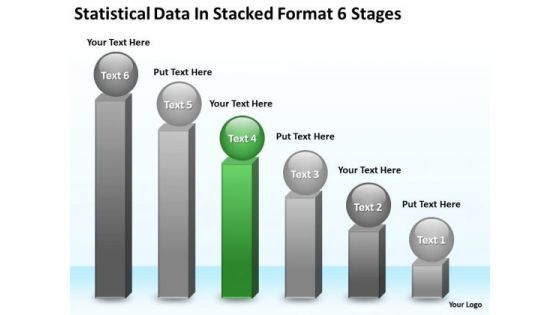
Statisctical Data In Stacked Format 6 Stages Ppt Template Business Plan PowerPoint Slides
We present our statisctical data in stacked format 6 stages ppt template business plan PowerPoint Slides.Download our Business PowerPoint Templates because It can Leverage your style with our PowerPoint Templates and Slides. Charm your audience with your ability. Use our Spheres PowerPoint Templates because you should Whip up a frenzy with our PowerPoint Templates and Slides. They will fuel the excitement of your team. Use our Competition PowerPoint Templates because Our PowerPoint Templates and Slides will embellish your thoughts. See them provide the desired motivation to your team. Download our Shapes PowerPoint Templates because It can Bubble and burst with your ideas. Download our Success PowerPoint Templates because It can Conjure up grand ideas with our magical PowerPoint Templates and Slides. Leave everyone awestruck by the end of your presentation.Use these PowerPoint slides for presentations relating to bar, graph, statistics, economy, render, success, representation, diagram, graphic, achievment, obstruction, chevron, accounting, finances, energy eco, steps, figure, tall, barrier, strategy, ladder, up, planning, high, climb, stripes, growth, maintenance, profit, successful, repair, return, gradient, sustainability, financial, construction, upwards, increasing. The prominent colors used in the PowerPoint template are Green, Gray, White. Our Statisctical Data In Stacked Format 6 Stages Ppt Template Business Plan PowerPoint Slides make the audience ache for more. They will ask for your views again and again.

Colorful Pie Chart Statistical Data PowerPoint Templates Ppt Backgrounds For Slides 0313
We present our Colorful Pie Chart Statistical Data PowerPoint Templates PPT Backgrounds For Slides 0313.Present our Pie Charts PowerPoint Templates because Our PowerPoint Templates and Slides offer you the needful to organise your thoughts. Use them to list out your views in a logical sequence. Present our Business PowerPoint Templates because It can Bubble and burst with your ideas. Use our Shapes PowerPoint Templates because Your audience will believe you are the cats whiskers. Present our Marketing PowerPoint Templates because It can be used to Set your controls for the heart of the sun. Our PowerPoint Templates and Slides will be the propellant to get you there. Download our Future PowerPoint Templates because Our PowerPoint Templates and Slides provide you with a vast range of viable options. Select the appropriate ones and just fill in your text. Use these PowerPoint slides for presentations relating to Development illustration of pie chart, pie charts, business, marketing, future, shapes. The prominent colors used in the PowerPoint template are Green, Red, Blue. Our Colorful Pie Chart Statistical Data PowerPoint Templates Ppt Backgrounds For Slides 0313 will extend a hand. They provide all the assistance you desire.
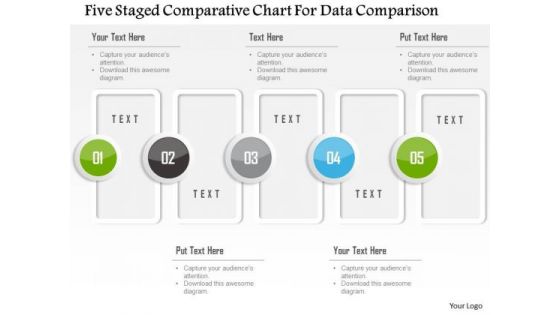
Business Diagram Five Staged Comparative Chart For Data Comparison Presentation Template
Five staged comparative chart has been used to design this power point template. This PPT contains the concept of data comparison. Use this PPT for your business and finance based data comparison in any financial presentation.
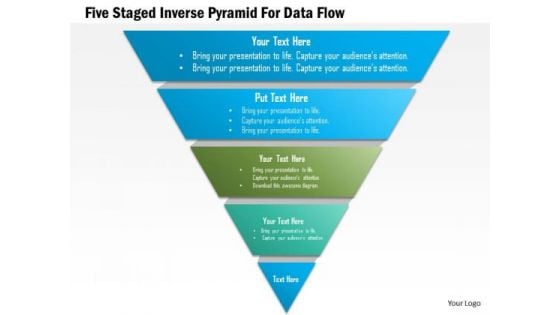
Business Diagram Five Staged Inverse Pyramid For Data Flow Presentation Template
Five staged inverse pyramid has been used to craft this power point template. This PPT contains the concept of data flow. Use this PPT for your data communication related presentations and create an impact on your viewers.
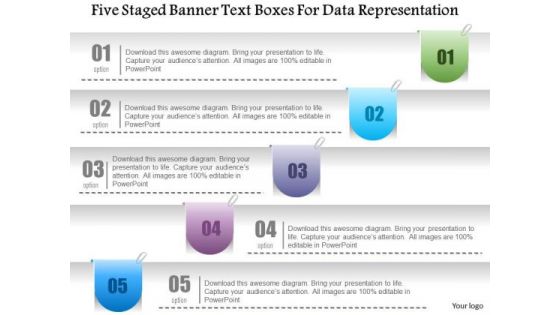
Business Diagram Five Staged Banner Text Boxes For Data Representation PowerPoint Template
Five staged banner style text boxes are used to design this power point template. This PPT contains the concept of data representation. Use this PPT slide for your data and business related presentations.
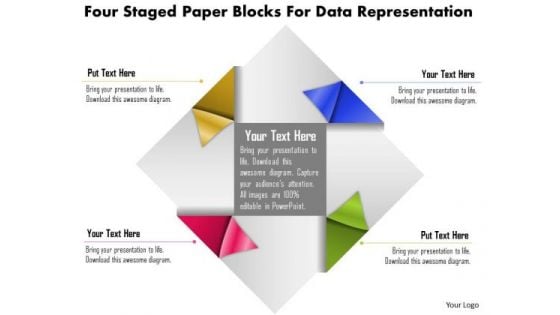
Business Diagram Four Staged Paper Blocks For Data Representation PowerPoint Template
Four staged paper blocks graphic has been used to craft this power point template slide. This PPT slide contains the concept of data flow and representation. Use this PPT to build an innovative presentation on data related topics..
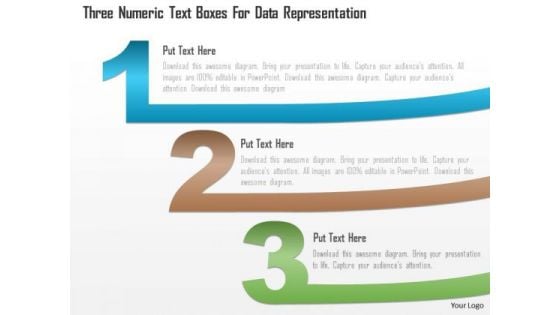
Business Diagram Three Numeric Text Boxes For Data Representation PowerPoint Template
Three numeric text boxes are used to develop this power point template. This PPT slide contains the concept of data representation. Display any kind of data in your presentation by using this exclusive template.
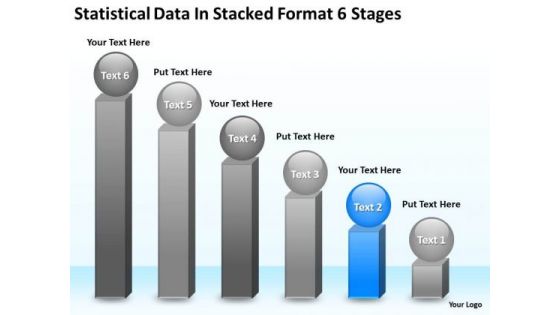
Statisctical Data In Stacked Format 6 Stages Create Business Plan PowerPoint Slides
We present our statisctical data in stacked format 6 stages create business plan PowerPoint Slides.Present our Business PowerPoint Templates because You can Zap them with our PowerPoint Templates and Slides. See them reel under the impact. Use our Spheres PowerPoint Templates because Our PowerPoint Templates and Slides will let you Hit the target. Go the full distance with ease and elan. Download and present our Competition PowerPoint Templates because Our PowerPoint Templates and Slides will effectively help you save your valuable time. They are readymade to fit into any presentation structure. Use our Shapes PowerPoint Templates because You have a driving passion to excel in your field. Our PowerPoint Templates and Slides will prove ideal vehicles for your ideas. Use our Success PowerPoint Templates because Our PowerPoint Templates and Slides are truly out of this world. Even the MIB duo has been keeping tabs on our team.Use these PowerPoint slides for presentations relating to bar, graph, statistics, economy, render, success, representation, diagram, graphic, achievment, obstruction, chevron, accounting, finances, energy eco, steps, figure, tall, barrier, strategy, ladder, up, planning, high, climb, stripes, growth, maintenance, profit, successful, repair, return, gradient, sustainability, financial, construction, upwards, increasing. The prominent colors used in the PowerPoint template are Blue light, Gray, White. Make it crystal clear with our Statisctical Data In Stacked Format 6 Stages Create Business Plan PowerPoint Slides. Confusion will never enter the door.
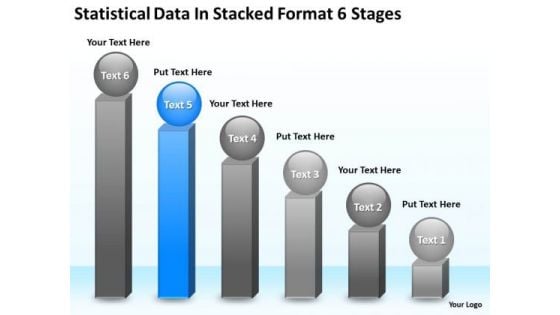
Statisctical Data In Stacked Format 6 Stages Ppt Business Plan Non Profit PowerPoint Slides
We present our statisctical data in stacked format 6 stages ppt business plan non profit PowerPoint Slides.Download and present our Business PowerPoint Templates because You are well armed with penetrative ideas. Our PowerPoint Templates and Slides will provide the gunpowder you need. Use our Spheres PowerPoint Templates because Our PowerPoint Templates and Slides are specially created by a professional team with vast experience. They diligently strive to come up with the right vehicle for your brilliant Ideas. Use our Competition PowerPoint Templates because Our PowerPoint Templates and Slides will let you meet your Deadlines. Download and present our Shapes PowerPoint Templates because It will Strengthen your hand with your thoughts. They have all the aces you need to win the day. Download our Success PowerPoint Templates because Our PowerPoint Templates and Slides will effectively help you save your valuable time. They are readymade to fit into any presentation structure. Use these PowerPoint slides for presentations relating to bar, graph, statistics, economy, render, success, representation, diagram, graphic, achievment, obstruction, chevron, accounting, finances, energy eco, steps, figure, tall, barrier, strategy, ladder, up, planning, high, climb, stripes, growth, maintenance, profit, successful, repair, return, gradient, sustainability, financial, construction, upwards, increasing. The prominent colors used in the PowerPoint template are Blue light, Gray, White. Arouse the excitement with our Statisctical Data In Stacked Format 6 Stages Ppt Business Plan Non Profit PowerPoint Slides. Stir up the audience with your views.
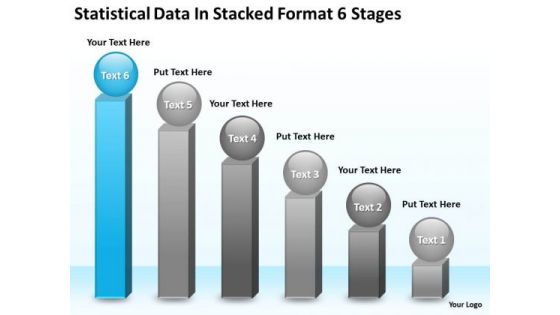
Data In Stacked Format 6 Stages Ppt Examples Of Small Business Plans PowerPoint Templates
We present our data in stacked format 6 stages ppt examples of small business plans PowerPoint templates.Download and present our Business PowerPoint Templates because our PowerPoint Templates and Slides are the string of your bow. Fire of your ideas and conquer the podium. Present our Spheres PowerPoint Templates because Our PowerPoint Templates and Slides help you pinpoint your timelines. Highlight the reasons for your deadlines with their use. Download and present our Competition PowerPoint Templates because You have a driving passion to excel in your field. Our PowerPoint Templates and Slides will prove ideal vehicles for your ideas. Download and present our Shapes PowerPoint Templates because Our PowerPoint Templates and Slides has conjured up a web of all you need with the help of our great team. Use them to string together your glistening ideas. Download our Success PowerPoint Templates because Our PowerPoint Templates and Slides will steer your racing mind. Hit the right buttons and spur on your audience.Use these PowerPoint slides for presentations relating to bar, graph, statistics, economy, render, success, representation, diagram, graphic, achievment, obstruction, chevron, accounting, finances, energy eco, steps, figure, tall, barrier, strategy, ladder, up, planning, high, climb, stripes, growth, maintenance, profit, successful, repair, return, gradient, sustainability, financial, construction, upwards, increasing. The prominent colors used in the PowerPoint template are Blue light, Gray, White. Make instructive presentations with our Data In Stacked Format 6 Stages Ppt Examples Of Small Business Plans PowerPoint Templates. Dont waste time struggling with PowerPoint. Let us do it for you.
Strategic Marketing Management Diagram Ppt Icon
This is a strategic marketing management diagram ppt icon. This is a five stage process. The stages in this process are inferred content data, system wide data, user interaction data, inferred student data, identity data, big data.

Business Diagram Five Staged Circular Ribbon Design For Data Representation Presentation Template
This business diagram displays five staged circular ribbon. This Power Point slide can be used for data representation. Use this PPT slide to show flow of activities in circular manner. Get professional with this exclusive business slide.
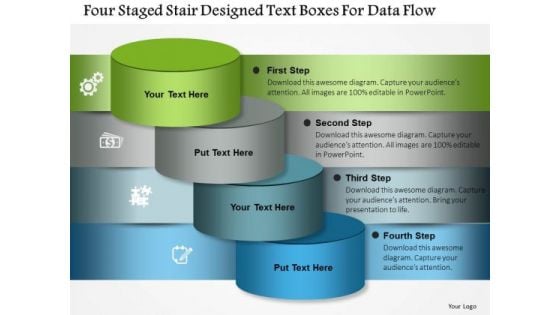
Business Diagram Four Staged Stair Designed Text Boxes For Data Flow Presentation Template
Four staged stair designed text boxes are used to design this power point template. This PPT contains the concept of data flow. Use this PPT for your business and finance related presentations.
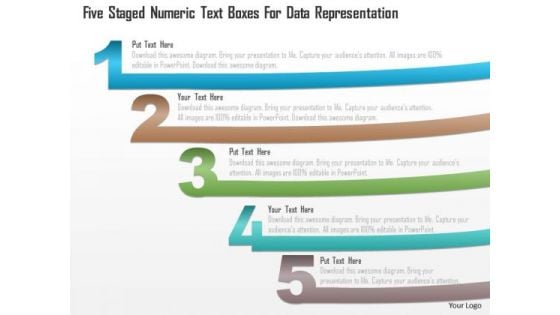
Business Diagram Five Staged Numeric Text Boxes For Data Representation PowerPoint Template
Five staged numeric text boxes diagram has been used to design this power point template. This diagram template contains the concept of data representation. Use this PPT for your business and marketing related presentations.
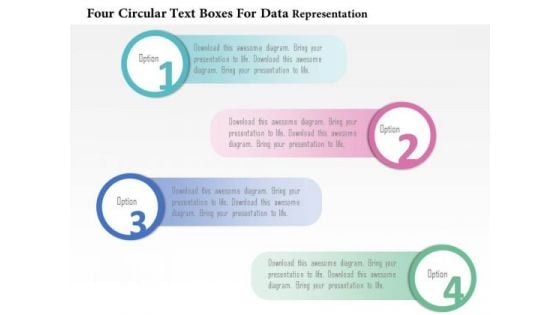
Business Diagram Four Circular Text Boxes For Data Representation PowerPoint Template
Graphic of four circular text boxes are used to craft this power point template. This PPT contains the concept of data representation. This PPT is suitable for business and marketing related presentations.
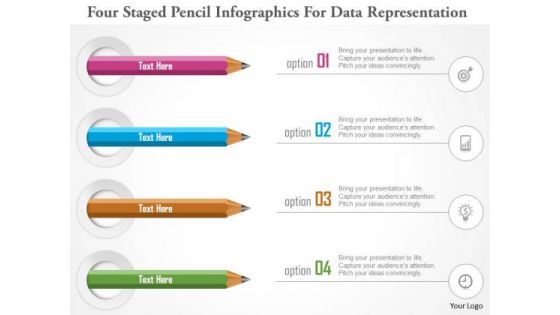
Business Diagram Four Staged Pencil Infographics For Data Representation PowerPoint Template
Four staged pencil info graphics has been used to design this power point template. This diagram template contains the concept of data representations. Use this PPT for your business and marketing presentations.
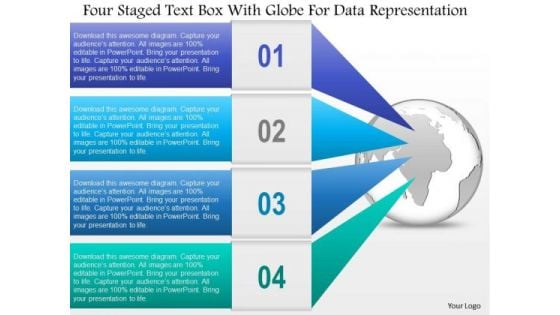
Business Diagram Four Staged Text Box With Globe For Data Representation Ppt Template
Four staged text boxes with globe has been used to craft this power point template. This PPT diagram contains the concept of global business agenda and data representation. Use this PPT for business and marketing related presentations.
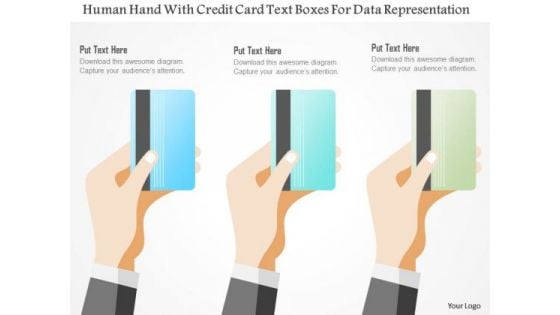
Business Diagram Human Hand With Credit Card Text Boxes For Data Representation Ppt Template
This power point template has been crafted with graphic of human hand and credit card style text boxes. his PPT diagram contains the concept of data representation. This PPT is suitable for your business and marketing presentations.


 Continue with Email

 Home
Home


