Technology Education
Business Diagram Navigation Icon Around Circle Presentation Template
Five staged business info graphics been used to design this power point template. This diagram contains the concept of data representation. Use this diagram for business and finance related presentations
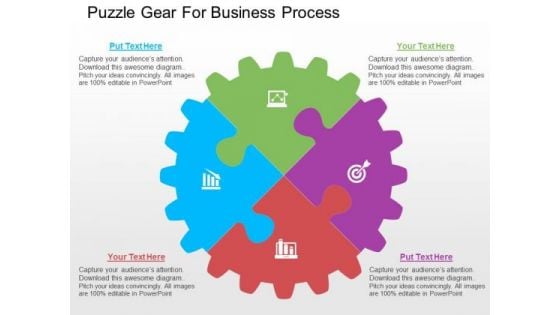
Puzzle Gear For Business Process PowerPoint Templates
Our above PPT slide contains circular gear puzzle diagram. This puzzle gear circular diagram helps to exhibit process planning and solutions. Use this diagram to impart more clarity to data and to create more sound impact on viewers.
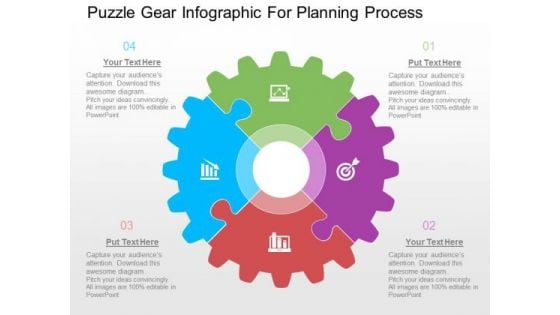
Puzzle Gear Infographic For Planning Process PowerPoint Templates
Our above PPT slide contains circular gear puzzle diagram. This puzzle gear circular diagram helps to exhibit process planning and solutions. Use this diagram to impart more clarity to data and to create more sound impact on viewers.
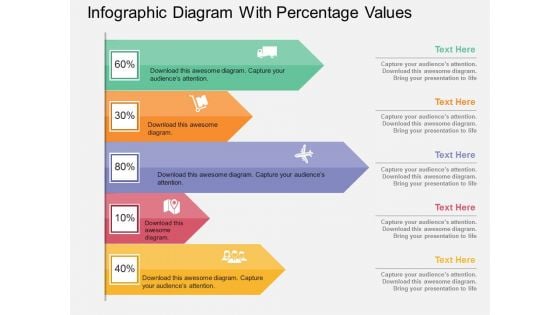
Infographic Diagram With Percentage Values Powerpoint Template
Visually support your presentation with our above template containing infographic diagram with percentage values. This diagram is excellent visual tools for explaining huge amounts of information where complex data needs to be explained immediately and clearly.
Colorful Circle Arrow Design Powerpoint Template
Our above PPT slide contains circular arrow design. This business diagram helps to exhibit process flow. Use this diagram to impart more clarity to data and to create more sound impact on viewers.
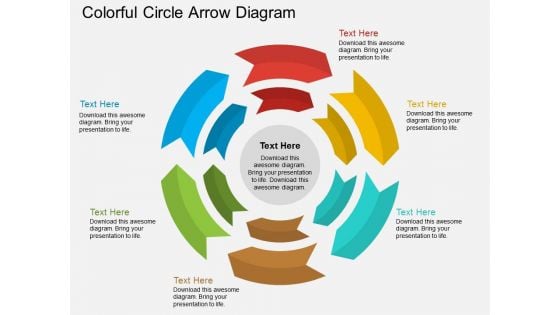
Colorful Circle Arrow Diagram Powerpoint Template
Our above PPT slide contains circular arrow design. This business diagram helps to exhibit process flow. Use this diagram to impart more clarity to data and to create more sound impact on viewers.
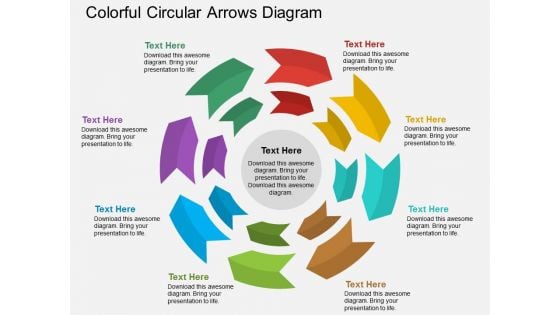
Colorful Circular Arrows Diagram Powerpoint Template
Our above PPT slide contains circular arrow design. This business diagram helps to exhibit process flow. Use this diagram to impart more clarity to data and to create more sound impact on viewers.
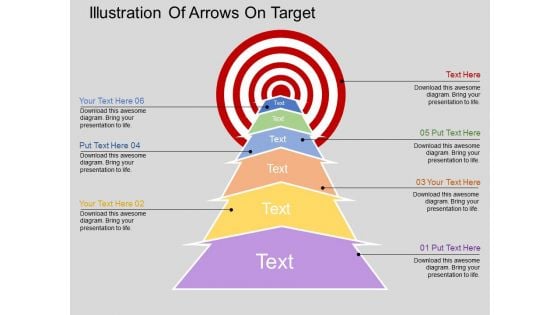
Illustration Of Arrows On Target Powerpoint Templates
Our above slide illustrates arrow steps towards target. This PowerPoint template may be used to exhibit target planning. Use this diagram to impart more clarity to data and to create more sound impact on viewers.
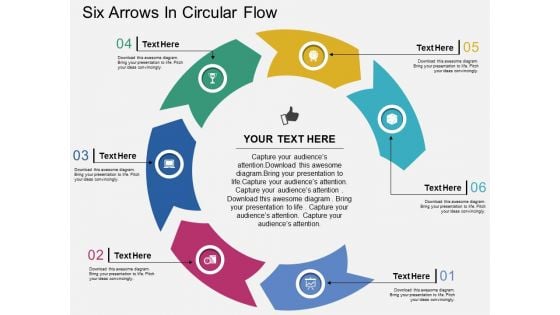
Six Arrows In Circular Flow Powerpoint Templates
Our above PPT slide contains graphics of circular diagram. This business diagram helps to display outline of business plan. Use this template to impart more clarity to data and to create more sound impact on viewers.
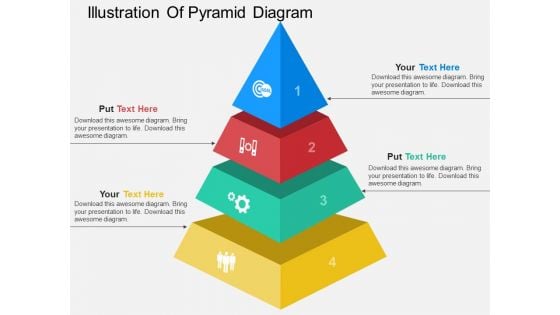
Illustration Of Pyramid Diagram Powerpoint Template
This PowerPoint slide contains illustration of pyramid diagram. This professional slide may be used for visual explanation of data. Adjust the above diagram in your business presentations to give professional impact.
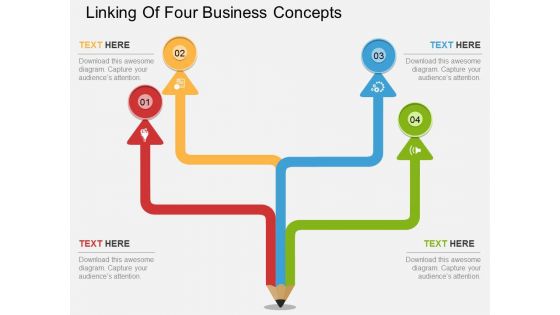
Linking Of Four Business Concepts Powerpoint Template
This PowerPoint template has been designed with four steps pencil diagram. This diagram is excellent visual tools to present link of steps. Download this PPT slide to explain complex data immediately and clearly.
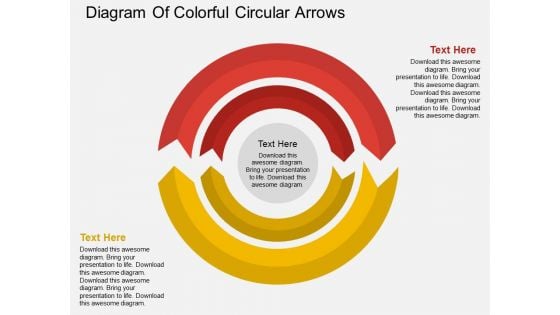
Diagram Of Colorful Circular Arrows Powerpoint Template
Our above PPT slide contains circular arrow design. This business diagram helps to exhibit process flow. Use this diagram to impart more clarity to data and to create more sound impact on viewers.
Four Arrows Design With Icons Powerpoint Template
The above PowerPoint slide displays four arrows design with icons. This PowerPoint diagram helps to summarize complex business data. Adjust the above diagram in your business presentations to visually support your content.
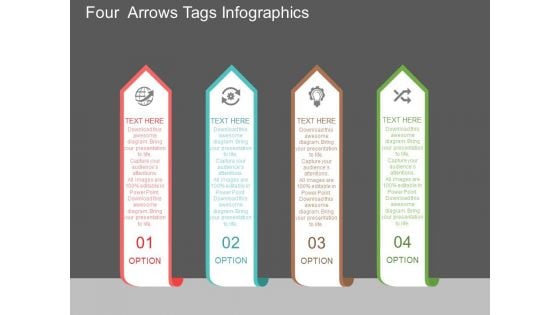
Four Arrows Tags Infographics Powerpoint Template
The above PowerPoint slide displays four arrows design with icons. This PowerPoint diagram helps to summarize complex business data. Adjust the above diagram in your business presentations to visually support your content.
Four Banners With Business Icons Powerpoint Template
The above PowerPoint slide displays four banners with icons. This PowerPoint diagram helps to summarize complex business data. Adjust the above diagram in your business presentations to visually support your content.
Four Banners With Finance Growth Icons Powerpoint Template
The above PowerPoint slide displays four banners with finance growth icons. This PowerPoint diagram helps to summarize complex business data. Adjust the above diagram in your business presentations to visually support your content.
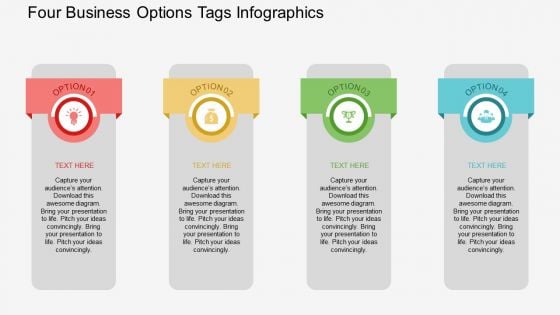
Four Business Options Tags Infographics Powerpoint Template
The above PowerPoint slide displays four options tags infographic. This PowerPoint diagram helps to summarize complex business data. Adjust the above diagram in your business presentations to visually support your content.
Four Colored Arrow Tags With Icons Powerpoint Template
The above PowerPoint slide displays four colored arrow tags with icons. This PowerPoint diagram helps to summarize complex business data. Adjust the above diagram in your business presentations to visually support your content.
Four Colorful Circle Tags With Icons Powerpoint Template
The above PowerPoint slide displays four colorful circle tags with icons. This PowerPoint diagram helps to summarize complex business data. Adjust the above diagram in your business presentations to visually support your content.
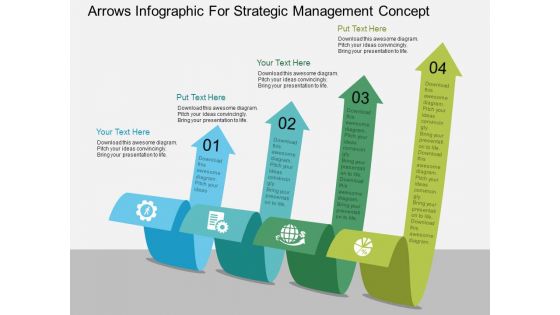
Arrows Infographic For Strategic Management Concept Powerpoint Template
Our above PPT slide contains four curved arrows infographic design. This business diagram helps to depict business information for strategic management. Use this diagram to impart more clarity to data and to create more sound impact on viewers.
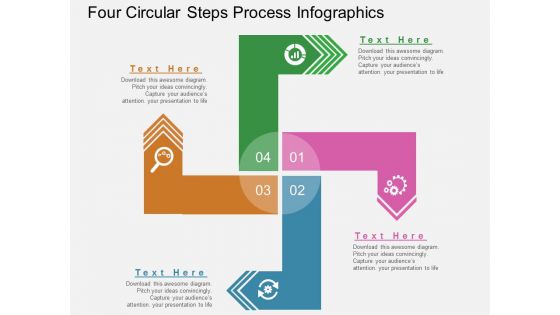
Four Circular Steps Process Infographics Powerpoint Template
This PowerPoint slide contains circular steps process infographic. This professional slide may be used for visual explanation of data. Adjust the above diagram in your business presentations to give professional impact.
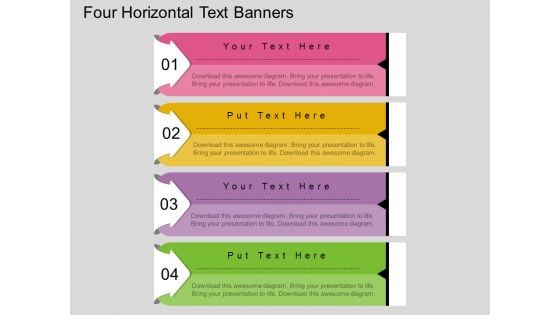
Four Horizontal Text Banners Powerpoint Template
This PowerPoint template has been designed with four horizontal text banners. This diagram is excellent visual tools for business presentations. Download this PPT slide to explain complex data immediately and clearly.
Four Sequential Boxes And Icons Diagram Powerpoint Template
This PowerPoint template has been designed with four sequential boxes and icons. This diagram is excellent visual tools for business presentations. Download this PPT slide to explain complex data immediately and clearly.
Four Sequential Text Banners With Icons Powerpoint Template
This PowerPoint template has been designed with four sequential text banners and icons. This diagram is excellent visual tools for business presentations. Download this PPT slide to explain complex data immediately and clearly.
Linear Circles Of Timeline With Icons Powerpoint Template
Our above slide contains linear timeline diagram. This PowerPoint template helps to display circle steps in linear flow. Use this diagram to impart more clarity to data and to create more sound impact on viewers.
Linear Arrow Process Diagram With Icons Powerpoint Template
This business slide has been designed with infographic of linear arrow. This arrow infographic can be used for data representation. Use this diagram for your business presentations. Build a quality presentation for your viewers with this unique diagram.
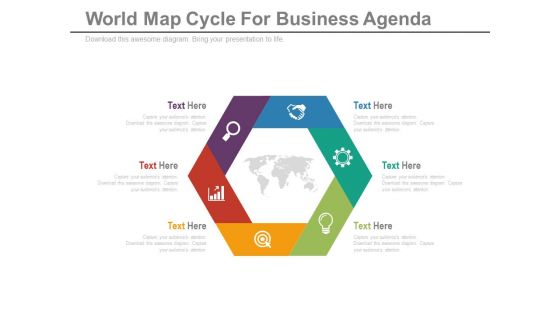
Diagram For Global Business Strategy Powerpoint Template
Our above slide contains hexagonal infographic diagram. This PowerPoint template helps to display global business strategy. Use this diagram to impart more clarity to data and to create more sound impact on viewers.
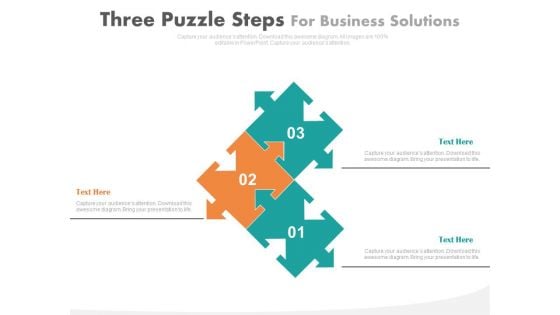
Three Puzzle Steps For Business Solutions Powerpoint Slides
Our above slide contains graphics of three puzzle steps. This slide is suitable to present business management and strategy. Use this diagram to impart more clarity to data and to create more sound impact on viewers.
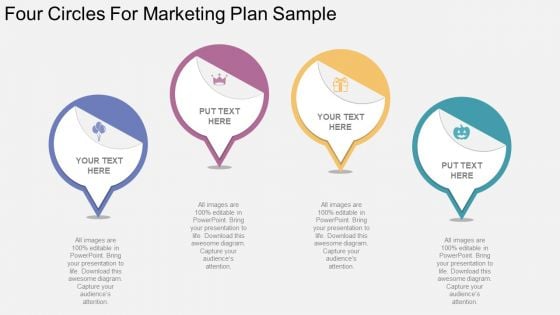
Four Circles For Marketing Plan Sample Powerpoint Template
Our above slide contains infographic diagram of four circles. This PPT slide helps to exhibit sample of marketing plan. Use this PowerPoint template to impart more clarity to data and to create more sound impact on viewers.
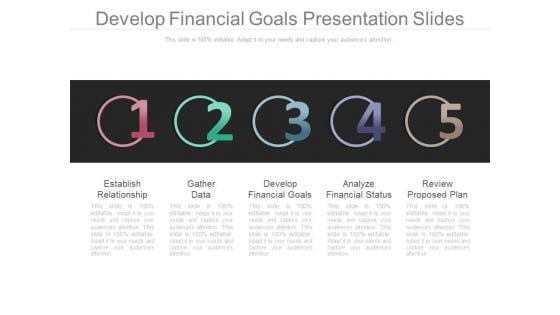
Develop Financial Goals Presentation Slides
This is a develop financial goals presentation slides. This is a five stage process. The stages in this process are establish relationship, gather data, develop financial goals, analyze financial status, review proposed plan.\n\n
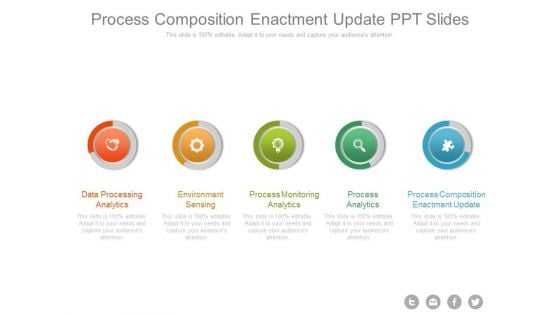
Process Composition Enactment Update Ppt Slides
This is a process composition enactment update ppt slides. This is a five stage process. The stages in this process are data processing analytics, environment sensing, process monitoring analytics, process analytics, process composition enactment update.
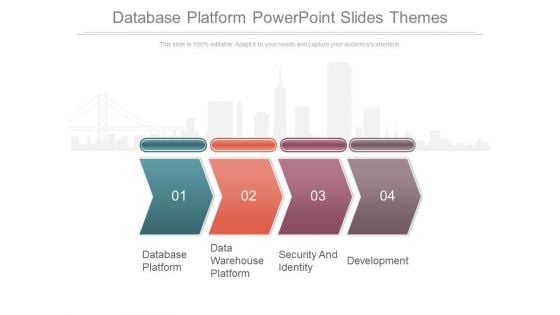
Database Platform Powerpoint Slides Themes
This is a database platform powerpoint slides themes. This is a four stage process. The stages in this process are database platform, data warehouse platform, security and identity, development.
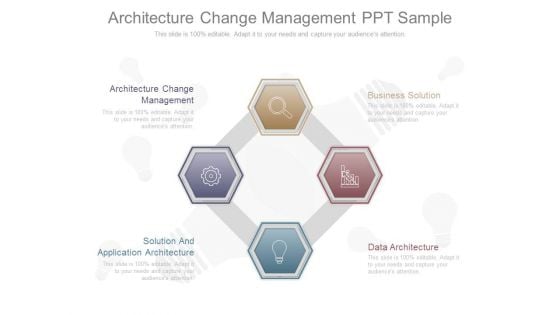
Architecture Change Management Ppt Sample
This is a architecture change management ppt sample. This is a four stage process. The stages in this process are architecture change management, business solution, solution and application architecture, data architecture.
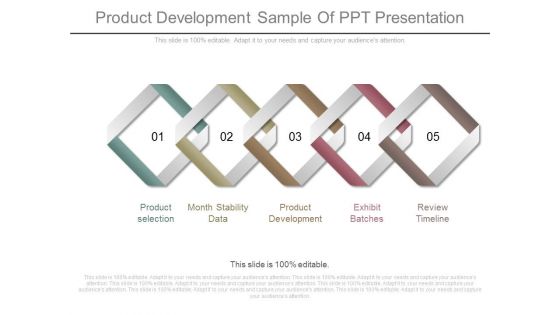
Product Development Sample Of Ppt Presentation
This is a product development sample of ppt presentation. This is a five stage process. The stages in this process are product selection, month stability data, product development, exhibit batches, review timeline.
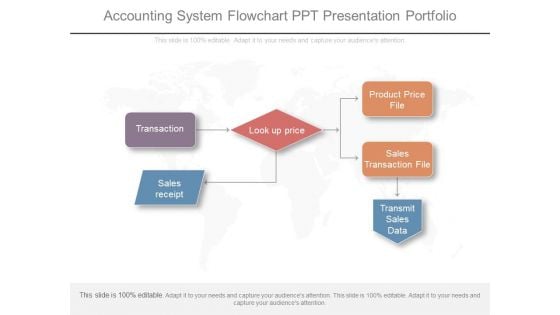
Accounting System Flowchart Ppt Presentation Portfolio
This is an accounting system flowchart ppt presentation portfolio. This is a one stage process. The stages in this process are sales receipt, look up price, product price file, sales transaction file, transmit sales data.
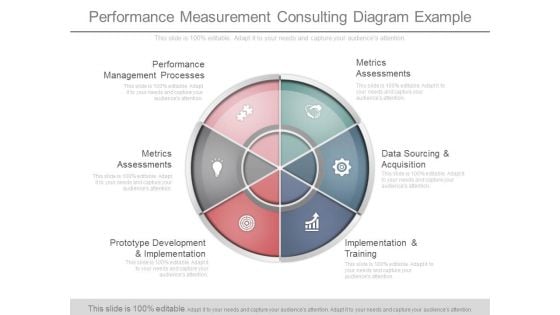
Performance Measurement Consulting Diagram Example
This is a performance measurement consulting diagram example. This is a six stage process. The stages in this process are performance management processes, metrics assessments, prototype development and implementation, metrics assessments, data sourcing and acquisition, implementation and training.
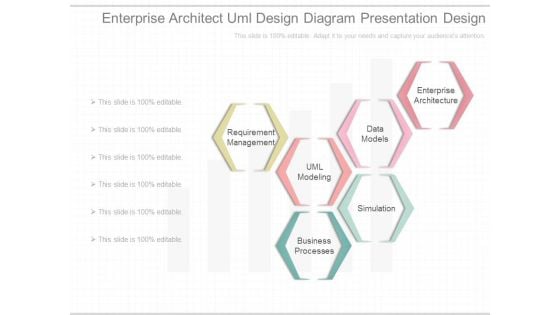
Enterprise Architect Uml Design Diagram Presentation Design
This is a enterprise architect uml design diagram presentation design. This is a six stage process. The stages in this process are requirement management, uml modeling, data models, business processes, simulation, enterprise architecture.
Voice Of The Customer Six Sigma Diagram Ppt Images
This is a voice of the customer six sigma diagram ppt images. This is a five stage process. The stages in this process are groups, warranty, metrics, data returns, survey, voice of customer.
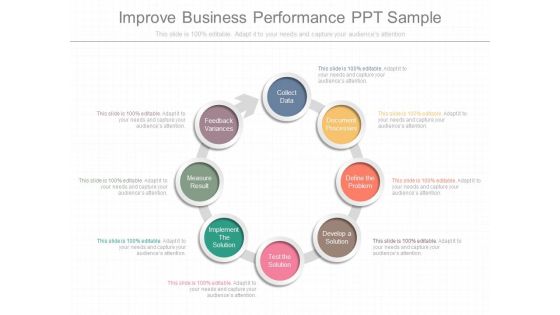
Improve Business Performance Ppt Sample
This is a improve business performance ppt sample. This is a eight stage process. The stages in this process are feedback variances, measure result, implement the solution, test the solution, develop a solution, define the problem, document processes, collect data.
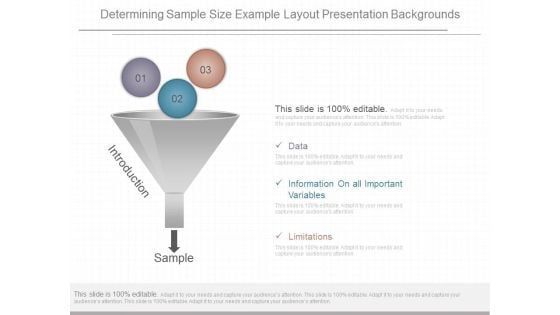
Determining Sample Size Example Layout Presentation Backgrounds
This is a determining sample size example layout presentation backgrounds. This is a three stage process. The stages in this process are data, information on all important variables, limitations, introduction, sample.
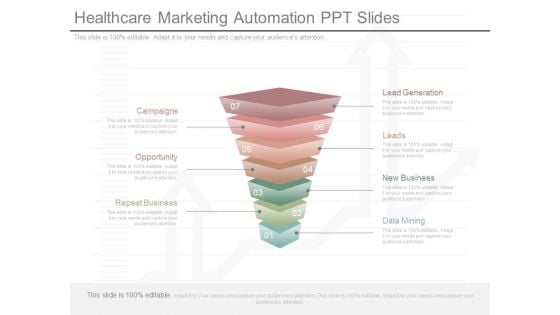
Healthcare Marketing Automation Ppt Slides
This is a healthcare marketing automation ppt slides. This is a seven stage process. The stages in this process are campaigns, opportunity, repeat business, lead generation, leads, new business, data mining.
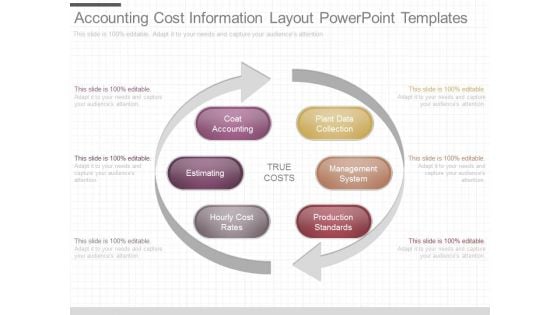
Accounting Cost Information Layout Powerpoint Templates
This is a accounting cost information layout powerpoint templates. This is a six stage process. The stages in this process are true costs, coat accounting, estimating, hourly cost rates, plant data collection, management system, production standards.
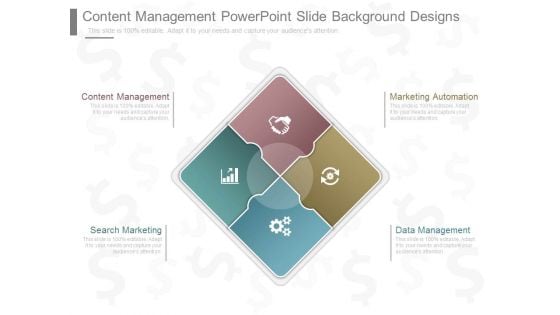
Content Management Powerpoint Slide Background Designs
This is a content management powerpoint slide background designs. This is a four stage process. The stages in this process are marketing automation, data management, content management, search marketing.
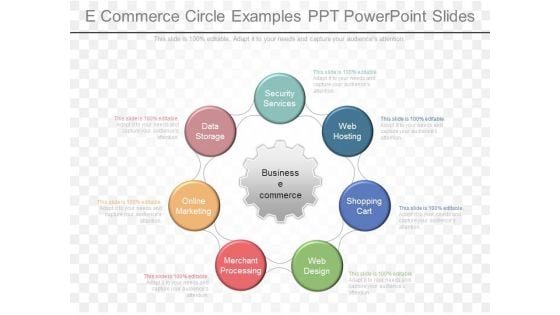
E Commerce Circle Examples Ppt Powerpoint Slides
This is a e commerce circle examples ppt powerpoint slides. This is a seven stage process. The stages in this process are business e commerce, security services, web hosting, shopping cart, web design, merchant processing, online marketing, data storage.
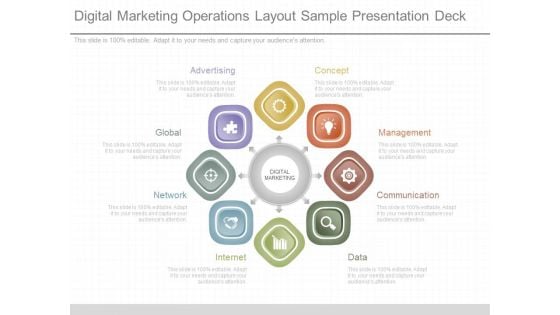
Digital Marketing Operations Layout Sample Presentation Deck
This is a digital marketing operations layout sample presentation deck. This is a eight stage process. The stages in this process are advertising, concept, management, communication, data, internet, network, global, digital marketing.
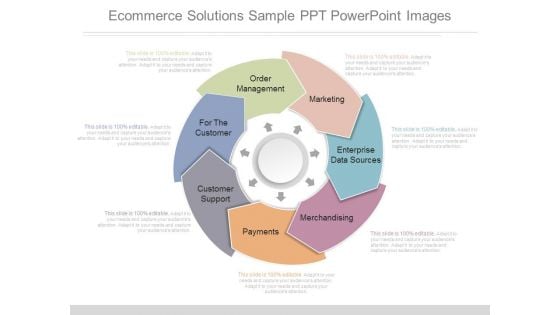
Ecommerce Solutions Sample Ppt Powerpoint Images
This is a ecommerce solutions sample ppt powerpoint images. This is a seven stage process. The stages in this process are order management, for the customer, customer support, payments, merchandising, enterprise data sources, marketing.
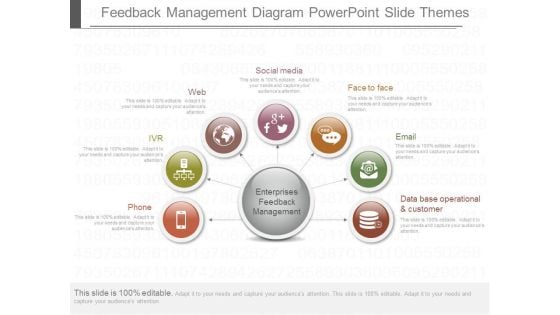
Feedback Management Diagram Powerpoint Slide Themes
This is a feedback management diagram powerpoint slide themes. This is a seven stage process. The stages in this process are phone, ivr, web, social media, face to face, email, data base operational and customer, enterprises feedback management.
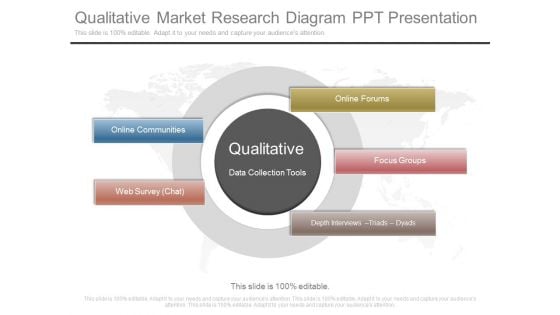
Qualitative Market Research Diagram Ppt Presentation
This is a qualitative market research diagram ppt presentation. This is a five stage process. The stages in this process are qualitative, data collection tools, online communities, web survey chat, online forums, focus groups, depth interviews triads dyads.
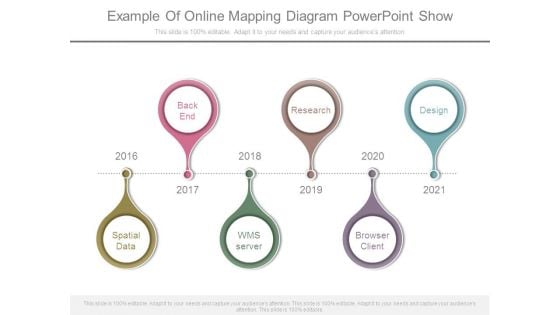
Example Of Online Mapping Diagram Powerpoint Show
This is a example of online mapping diagram powerpoint show. This is a six stage process. The stages in this process are back end, research, design, spatial data, wms server, browser client.
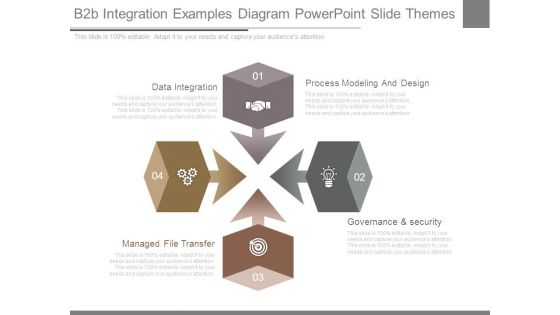
B2b Integration Examples Diagram Powerpoint Slide Themes
This is a b2b integration examples diagram powerpoint slide themes. This is a four stage process. The stages in this process are data integration, process modeling and design, governance and security, managed file transfer.
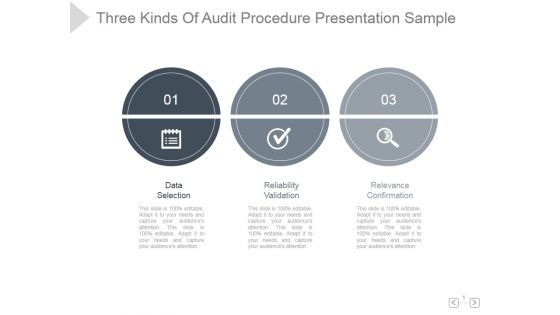
Three Kinds Of Audit Procedure Ppt PowerPoint Presentation Guidelines
This is a three kinds of audit procedure ppt powerpoint presentation guidelines. This is a three stage process. The stages in this process are data selection reliability validation, relevance confirmation.
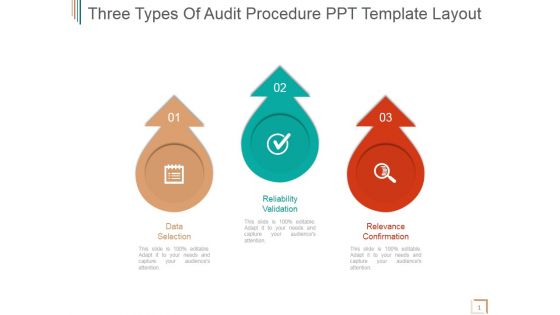
Three Types Of Audit Procedure Ppt PowerPoint Presentation Gallery
This is a three types of audit procedure ppt powerpoint presentation gallery. This is a three stage process. The stages in this process are data selection, reliability validation, relevance confirmation.
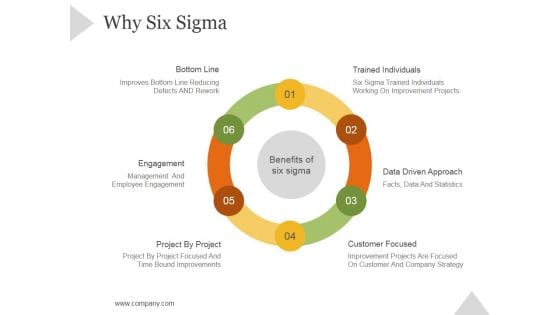
Why Six Sigma Ppt PowerPoint Presentation Introduction
This is a why six sigma ppt powerpoint presentation introduction. This is a six stage process. The stages in this process are bottom line, trained individuals, engagement, data, driven approach, customer focused, project by project.
Smart Action Plan Ppt PowerPoint Presentation Icon
This is a smart action plan ppt powerpoint presentation icon. This is a three stage process. The stages in this process are target data, activity, most responsible person, outcome deliverables, progress.
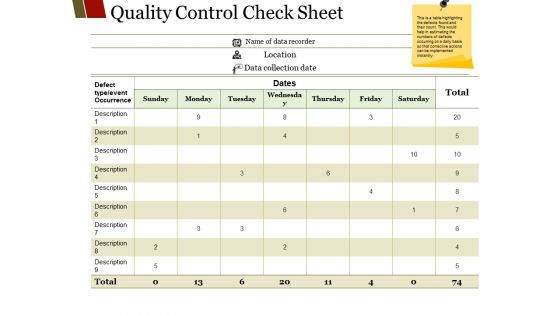
Quality Control Check Sheet Ppt PowerPoint Presentation Gallery Microsoft
This is a quality control check sheet ppt powerpoint presentation gallery microsoft. This is a nine stage process. The stages in this process are dates, defect type event occurrence, location, data collection date.
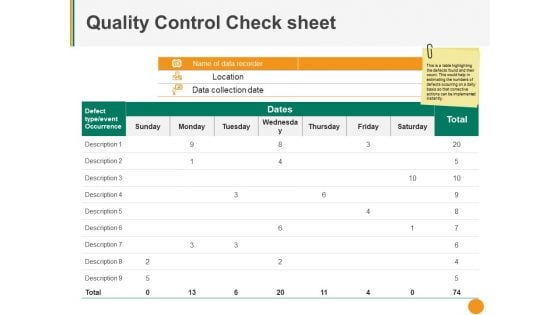
Quality Control Check Sheet Ppt PowerPoint Presentation Infographic Template Outline
This is a quality control check sheet ppt powerpoint presentation infographic template outline. This is a nine stage process. The stages in this process are defect type event occurrence, dates, location, name of data recorder, business.
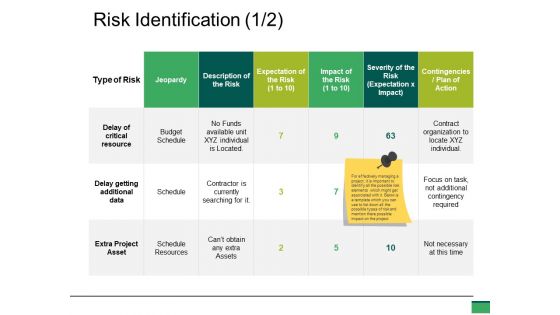
Risk Identification Ppt PowerPoint Presentation Summary Show
This is a risk identification ppt powerpoint presentation summary show. This is a six stage process. The stages in this process are delay getting additional data, delay of critical resource, extra project asset, budget schedule, schedule.
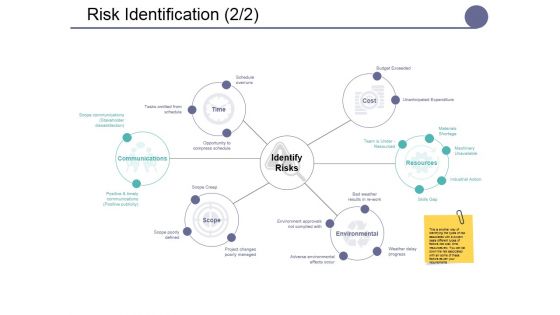
Risk Identification Template Ppt PowerPoint Presentation Summary Influencers
This is a risk identification template ppt powerpoint presentation summary influencers. This is a three stage process. The stages in this process are jeopardy, description of the risk, delay of critical resource, delay getting additional data, extra project asset.
Project Management Gantt Chart Ppt PowerPoint Presentation Icon Example
This is a project management gantt chart ppt powerpoint presentation icon example. This is a ten stage process. The stages in this process are lists, table, data, management, marketing.
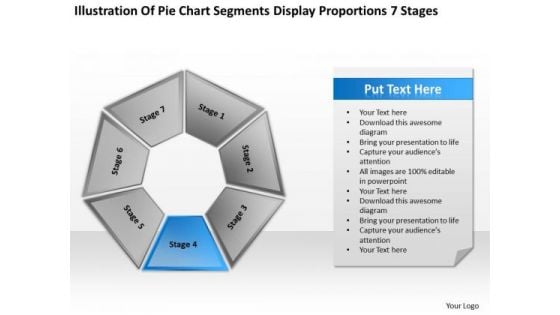
Pie Chart Segments Display Proportions 7 Stages Ppt Business Plans For Dummies PowerPoint Slides
We present our pie chart segments display proportions 7 stages ppt business plans for dummies PowerPoint Slides.Download and present our Process and Flows PowerPoint Templates because They will Put the wind in your sails. Skim smoothly over the choppy waters of the market. Download and present our Business PowerPoint Templates because you should once Tap the ingenuity of our PowerPoint Templates and Slides. They are programmed to succeed. Download and present our Shapes PowerPoint Templates because Our PowerPoint Templates and Slides ensures Effective communication. They help you put across your views with precision and clarity. Present our Future PowerPoint Templates because You have gained great respect for your brilliant ideas. Use our PowerPoint Templates and Slides to strengthen and enhance your reputation. Use our Success PowerPoint Templates because These PowerPoint Templates and Slides will give the updraft to your ideas. See them soar to great heights with ease.Use these PowerPoint slides for presentations relating to Process, abstract, multicolored, market, website, network, cross, statistics, model, document, business, plan, presentation,diagram, circle, data, marketing, management, chart, sphere, options, function, shiny, direction, piechart,design, company, navigation,financial, structure, multiple, button, steps, seven, flow. The prominent colors used in the PowerPoint template are Blue, Gray, White. Festoon your address with our Pie Chart Segments Display Proportions 7 Stages Ppt Business Plans For Dummies PowerPoint Slides. You will come up with a festival of ideas.


 Continue with Email

 Home
Home


