Template
Qualitative And Quantitative Consumer Analysis Methods Ppt PowerPoint Presentation Icon Show PDF
This slide shows various research tools and techniques to generated customer insight. Pitch your topic with ease and precision using this qualitative and quantitative consumer analysis methods ppt powerpoint presentation icon show pdf. This layout presents information on quantitative research, qualitive research, focus groups, observational study, surveys, documentary research, one on one interviews, understanding the market, measuring the market. It is also available for immediate download and adjustment. So, changes can be made in the color, design, graphics or any other component to create a unique layout.
Strategic Policy Deployment For Lean Methodology Ppt PowerPoint Presentation Icon Background Images PDF
This slide portrays the Hoshin Kanri Lean Model approach. It covers the long-term, annual and team objectives along with the PDCA cycle for improving the business process. Pitch your topic with ease and precision using this strategic policy deployment for lean methodology ppt powerpoint presentation icon background images pdf. This layout presents information on targets, implement, objective. It is also available for immediate download and adjustment. So, changes can be made in the color, design, graphics or any other component to create a unique layout.
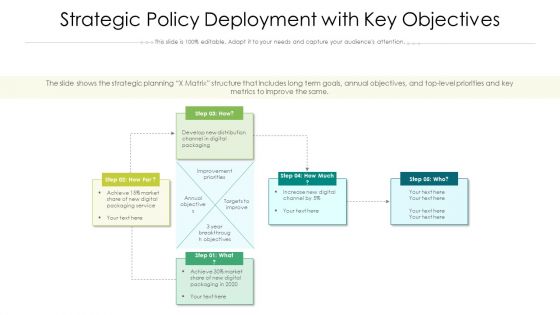
Strategic Policy Deployment With Key Objectives Ppt PowerPoint Presentation Gallery Demonstration PDF
The slide shows the strategic planning X Matrix structure that includes long term goals, annual objectives, and top-level priorities and key metrics to improve the same. Pitch your topic with ease and precision using this strategic policy deployment with key objectives ppt powerpoint presentation gallery demonstration pdf. This layout presents information on develop, service, improvement priorities. It is also available for immediate download and adjustment. So, changes can be made in the color, design, graphics or any other component to create a unique layout.
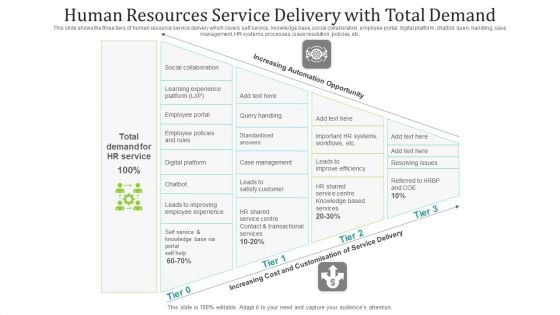
Human Resources Service Delivery With Total Demand Ppt PowerPoint Presentation File Layout Ideas PDF
This slide shows the three tiers of human resource service delivery which covers self service, knowledge base, social collaboration, employee portal, digital platform, chatbot, query handling, case management, HR systems, processes, issue resolution, policies, etc. Pitch your topic with ease and precision using this human resources service delivery with total demand ppt powerpoint presentation file layout ideas pdf. This layout presents information on service, cost, management. It is also available for immediate download and adjustment. So, changes can be made in the color, design, graphics or any other component to create a unique layout.

Integrated Risk Management Methodology With Data Set Analysis Ppt PowerPoint Presentation Infographics Microsoft PDF
This slide covers different risk measurement approach that will help project managers to do historical loss analysis and scenario analysis. Pitch your topic with ease and precision using this integrated risk management methodology with data set analysis ppt powerpoint presentation infographics microsoft pdf. This layout presents information on historical loss analysis, severity distribution analysis, integration risk measure. It is also available for immediate download and adjustment. So, changes can be made in the color, design, graphics or any other component to create a unique layout.
Hoshin Kanri Strategy Chart With Major Goal S Ppt PowerPoint Presentation Icon Example File PDF
The slide shows the strategic planning X Matrix structure that includes long term goals, annual objectives, and top-level priorities and key metrics to improve the same. Pitch your topic with ease and precision using this hoshin kanri strategy chart with major goal s ppt powerpoint presentation icon example file pdf. This layout presents information on digital, improvement, targets. It is also available for immediate download and adjustment. So, changes can be made in the color, design, graphics or any other component to create a unique layout.
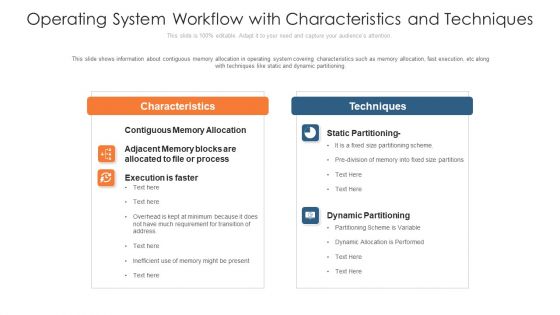
Operating System Workflow With Characteristics And Techniques Ppt PowerPoint Presentation File Mockup PDF
This slide shows information about contiguous memory allocation in operating system covering characteristics such as memory allocation, fast execution, etc along with techniques like static and dynamic partitioning. Pitch your topic with ease and precision using this operating system workflow with characteristics and techniques ppt powerpoint presentation file mockup pdf. This layout presents information on characteristics, techniques, execution. It is also available for immediate download and adjustment. So, changes can be made in the color, design, graphics or any other component to create a unique layout.
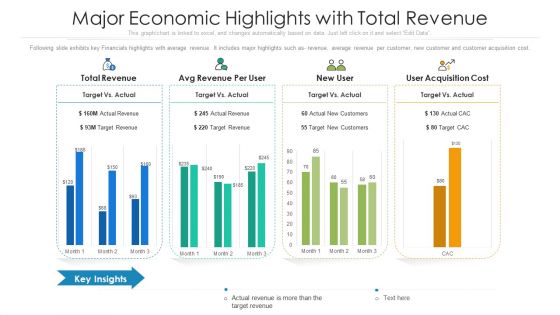
Major Economic Highlights With Total Revenue Ppt PowerPoint Presentation Gallery Design Ideas PDF
Following slide exhibits key Financials highlights with average revenue. It includes major highlights such as- revenue, average revenue per customer, new customer and customer acquisition cost. Pitch your topic with ease and precision using this major economic highlights with total revenue ppt powerpoint presentation gallery design ideas pdf. This layout presents information on revenue, acquisition, cost. It is also available for immediate download and adjustment. So, changes can be made in the color, design, graphics or any other component to create a unique layout.
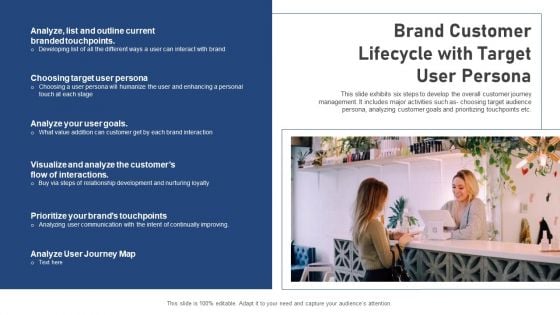
Brand Customer Lifecycle With Target User Persona Ppt PowerPoint Presentation File Maker PDF
This slide exhibits six steps to develop the overall customer journey management. It includes major activities such as- choosing target audience persona, analyzing customer goals and prioritizing touchpoints etc. Pitch your topic with ease and precision using this brand customer lifecycle with target user persona ppt powerpoint presentation file maker pdf. This layout presents information on analyze, development, communication. It is also available for immediate download and adjustment. So, changes can be made in the color, design, graphics or any other component to create a unique layout.
Online Business Customer Brand Lifecycle With Discovery Ppt PowerPoint Presentation Icon Layouts PDF
Following slide showcase E commerce customer journey mapping with online, automated, physical layer and so on. It includes major activities such as- buy product, exchange and return etc. Pitch your topic with ease and precision using this online business customer brand lifecycle with discovery ppt powerpoint presentation icon layouts pdf. This layout presents information on discovery, evaluation, transaction. It is also available for immediate download and adjustment. So, changes can be made in the color, design, graphics or any other component to create a unique layout.
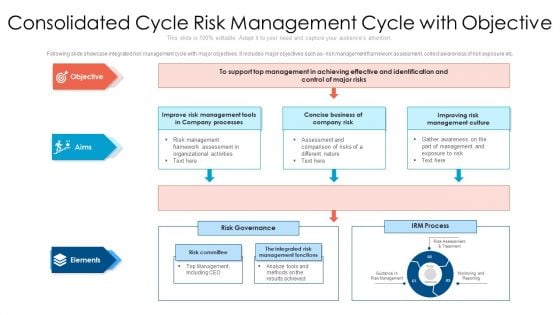
Consolidated Cycle Risk Management Cycle With Objective Ppt PowerPoint Presentation File Graphics PDF
Following slide showcase integrated risk management cycle with major objectives. It includes major objectives such as- risk management framework assessment, collect awareness of risk exposure etc. Pitch your topic with ease and precision using this consolidated cycle risk management cycle with objective ppt powerpoint presentation file graphics pdf. This layout presents information on objective, aims, elements. It is also available for immediate download and adjustment. So, changes can be made in the color, design, graphics or any other component to create a unique layout.
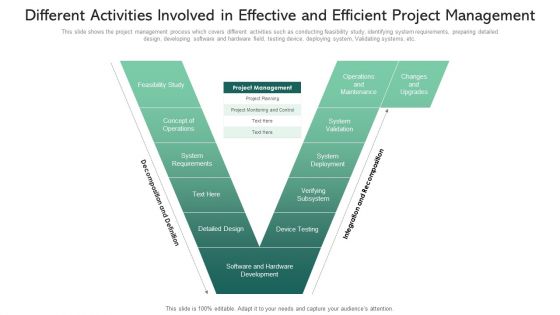
Different Activities Involved In Effective And Efficient Project Management Ppt PowerPoint Presentation File Introduction PDF
This slide shows the project management process which covers different activities such as conducting feasibility study, identifying system requirements, preparing detailed design, developing software and hardware field, testing device, deploying system, Validating systems, etc. Pitch your topic with ease and precision using this different activities involved in effective and efficient project management ppt powerpoint presentation file introduction pdf. This layout presents information on operations and maintenance, system validation, system deployment. It is also available for immediate download and adjustment. So, changes can be made in the color, design, graphics or any other component to create a unique layout.
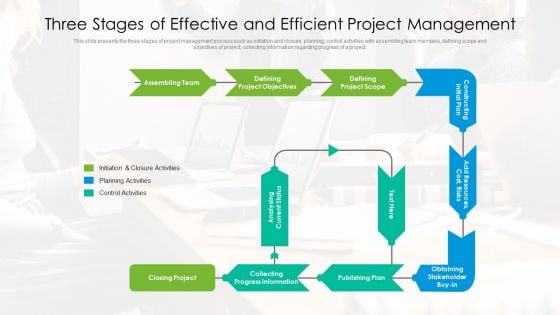
Three Stages Of Effective And Efficient Project Management Ppt PowerPoint Presentation File Themes PDF
This slide presents the three stages of project management process such as initiation and closure, planning, control activities with assembling team members, defining scope and objectives of project, collecting information regarding progress of a project. Pitch your topic with ease and precision using this three stages of effective and efficient project management ppt powerpoint presentation file themes pdf. This layout presents information on initiation, planning activities, control activities. It is also available for immediate download and adjustment. So, changes can be made in the color, design, graphics or any other component to create a unique layout.
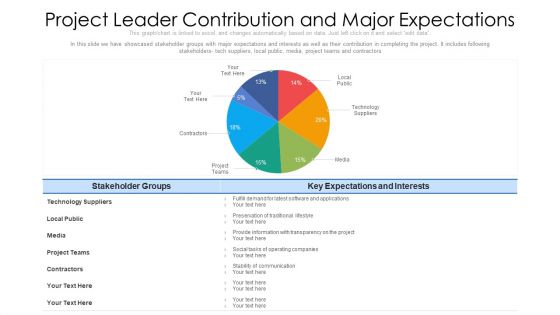
Project Leader Contribution And Major Expectations Ppt PowerPoint Presentation File Diagrams PDF
In this slide we have showcased stakeholder groups with major expectations and interests as well as their contribution in completing the project. It includes following stakeholders- tech suppliers, local public, media, project teams and contractors. Pitch your topic with ease and precision using this project leader contribution and major expectations ppt powerpoint presentation file diagrams pdf. This layout presents information on technology, media, contractors. It is also available for immediate download and adjustment. So, changes can be made in the color, design, graphics or any other component to create a unique layout.
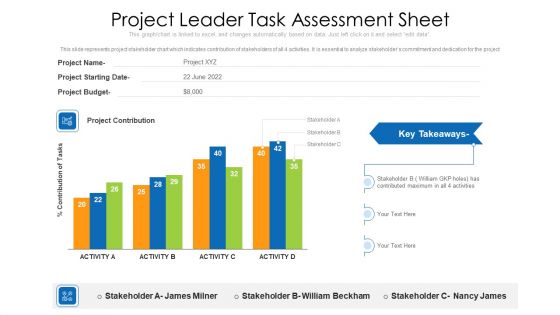
Project Leader Task Assessment Sheet Ppt PowerPoint Presentation Gallery Outline PDF
This slide represents project stakeholder chart which indicates contribution of stakeholders of all 4 activities. It is essential to analyze stakeholders commitment and dedication for the project. Pitch your topic with ease and precision using this project leader task assessment sheet ppt powerpoint presentation gallery outline pdf. This layout presents information on project leader task assessment sheet. It is also available for immediate download and adjustment. So, changes can be made in the color, design, graphics or any other component to create a unique layout.
Business Process Holding With Major Activities Ppt PowerPoint Presentation Icon Professional PDF
Following slide showcase business process ownership with major activities. It includes activities such as set vision, improve process, create new strategies and so on. Pitch your topic with ease and precision using this business process holding with major activities ppt powerpoint presentation icon professional pdf. This layout presents information on set vision, improve process, responsibilities, percent time, key activities. It is also available for immediate download and adjustment. So, changes can be made in the color, design, graphics or any other component to create a unique layout.
Process Holding And Delivery Raci Matrix Ppt PowerPoint Presentation Icon Show PDF
This slide showcase process ownership and delivery RACI matrix. It include activities such as subject project request, research solution design, create project charter and so on. Pitch your topic with ease and precision using this process holding and delivery raci matrix ppt powerpoint presentation icon show pdf. This layout presents information on responsible, accountable, informed, consulted, research solution. It is also available for immediate download and adjustment. So, changes can be made in the color, design, graphics or any other component to create a unique layout.
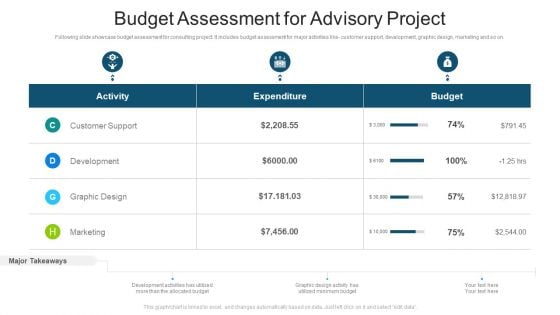
Budget Assessment For Advisory Project Ppt PowerPoint Presentation File Graphics Example PDF
Following slide showcase budget assessment for consulting project. It includes budget assessment for major activities like customer support, development, graphic design, marketing and so on. Pitch your topic with ease and precision using this budget assessment for advisory project ppt powerpoint presentation file graphics example pdf. This layout presents information on customer support, development, graphic design, marketing. It is also available for immediate download and adjustment. So, changes can be made in the color, design, graphics or any other component to create a unique layout.
Digital Marketing Advisory Project Timeline Ppt PowerPoint Presentation Icon Diagrams PDF
Following slide showcase consulting project digital marketing campaign timeline which includes multiple tasks and activities such as- need assessment, target market assessment, content writing and email campaign. Pitch your topic with ease and precision using this digital marketing advisory project timeline ppt powerpoint presentation icon diagrams pdf. This layout presents information on digital marketing advisory project timeline . It is also available for immediate download and adjustment. So, changes can be made in the color, design, graphics or any other component to create a unique layout.
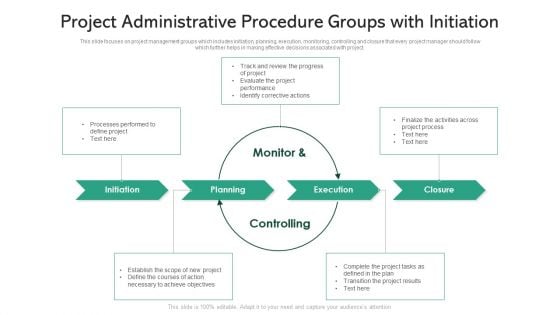
Project Administrative Procedure Groups With Initiation Ppt PowerPoint Presentation Gallery Graphics Example PDF
This slide focuses on project management groups which includes initiation, planning, execution, monitoring, controlling and closure that every project manager should follow which further helps in making effective decisions associated with project. Pitch your topic with ease and precision using this project administrative procedure groups with initiation ppt powerpoint presentation gallery graphics example pdf. This layout presents information on initiation, planning, execution, closure, controlling. It is also available for immediate download and adjustment. So, changes can be made in the color, design, graphics or any other component to create a unique layout.
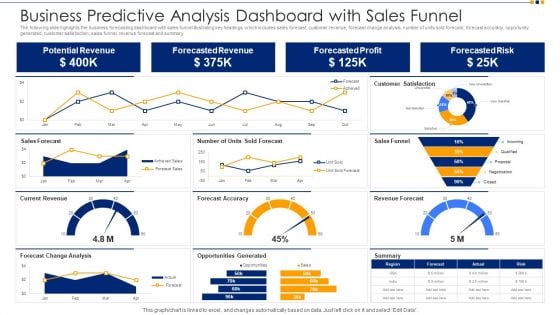
Business Predictive Analysis Dashboard With Sales Funnel Ppt Show Images PDF
The following slide highlights the business forecasting dashboard with sales funnel illustrating key headings which includes sales forecast, customer revenue, forecast change analysis, number of units sold forecast, forecast accuracy, opportunity generated, customer satisfaction, sales funnel, revenue forecast and summary. Pitch your topic with ease and precision using this business predictive analysis dashboard with sales funnel ppt show images pdf. This layout presents information on potential revenue, forecasted revenue, forecasted profit, forecasted risk. It is also available for immediate download and adjustment. So, changes can be made in the color, design, graphics or any other component to create a unique layout.
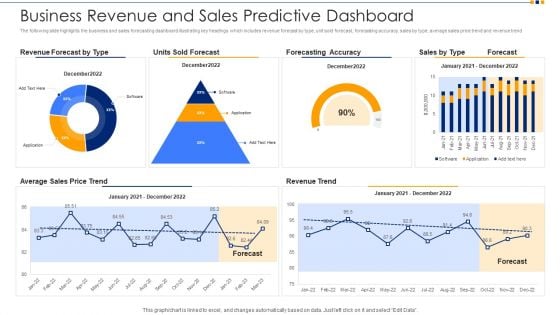
Business Revenue And Sales Predictive Dashboard Ppt Inspiration Background Designs PDF
The following slide highlights the business and sales forecasting dashboard illustrating key headings which includes revenue forecast by type, unit sold forecast, forecasting accuracy, sales by type, average sales price trend and revenue trend. Pitch your topic with ease and precision using this business revenue and sales predictive dashboard ppt inspiration background designs pdf. This layout presents information on revenue forecast by type, units sold forecast, forecasting accuracy, average sales price trend, revenue trend. It is also available for immediate download and adjustment. So, changes can be made in the color, design, graphics or any other component to create a unique layout.
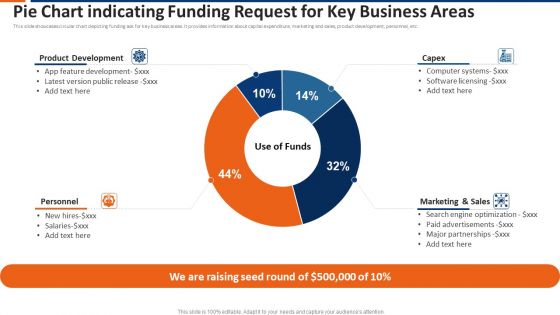
Pie Chart Indicating Funding Request For Key Business Areas Ppt Show Topics PDF
This slide showcases circular chart depicting funding ask for key business areas. It provides information about capital expenditure, marketing and sales, product development, personnel, etc. Pitch your topic with ease and precision using this pie chart indicating funding request for key business areas ppt show topics pdf. This layout presents information on product development, capex, marketing and sales, personnel. It is also available for immediate download and adjustment. So, changes can be made in the color, design, graphics or any other component to create a unique layout.
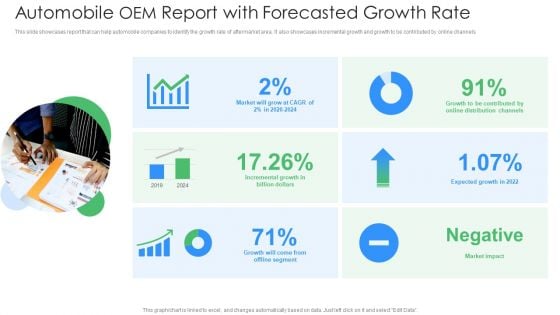
Automobile OEM Report With Forecasted Growth Rate Ppt PowerPoint Presentation File Background Images PDF
This slide showcases report that can help automobile companies to identify the growth rate of aftermarket area. It also showcases incremental growth and growth to be contributed by online channels. Pitch your topic with ease and precision using this automobile oem report with forecasted growth rate ppt powerpoint presentation file background images pdf. This layout presents information on incremental growth, billion dollars, growth, offline segment, market impact, expected growth in 2022. It is also available for immediate download and adjustment. So, changes can be made in the color, design, graphics or any other component to create a unique layout.
OEM Spare Parts Sales Tracking Dashboard Ppt PowerPoint Presentation Gallery Inspiration PDF
This slide showcases dashboard that can help organization to keep track of aftermarket components sales. Its key elements are sold quantity per spare part and deviation of sold units. Pitch your topic with ease and precision using this oem spare parts sales tracking dashboard ppt powerpoint presentation gallery inspiration pdf. This layout presents information on sold quantity, budgeted quantity, quantity ytd ly. It is also available for immediate download and adjustment. So, changes can be made in the color, design, graphics or any other component to create a unique layout.
SFA Dashboard To Track Performance Ppt PowerPoint Presentation Icon Example File PDF
This Slide visually represents sales force automation dashboard to track performance which can be utilized by marketing managers to streamline the process of automated selling. It includes information about sales pipeline, competitors, opportunities, key competitors, etc. Pitch your topic with ease and precision using this sfa dashboard to track performance ppt powerpoint presentation icon example file pdf. This layout presents information on sales pipeline, sales pipeline by sales rep, key competitors, forecast by month, key opportunities. It is also available for immediate download and adjustment. So, changes can be made in the color, design, graphics or any other component to create a unique layout.
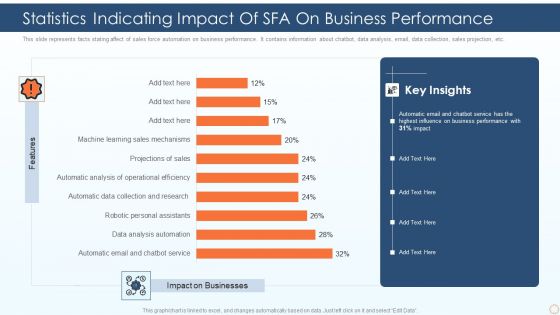
Statistics Indicating Impact Of SFA On Business Performance Ppt PowerPoint Presentation Gallery Outfit PDF
This slide represents facts stating affect of sales force automation on business performance. It contains information about chatbot, data analysis, email, data collection, sales projection, etc. Pitch your topic with ease and precision using this statistics indicating impact of sfa on business performance ppt powerpoint presentation gallery outfit pdf. This layout presents information on automatic email and chatbot service, data analysis automation, robotic personal assistants. It is also available for immediate download and adjustment. So, changes can be made in the color, design, graphics or any other component to create a unique layout.
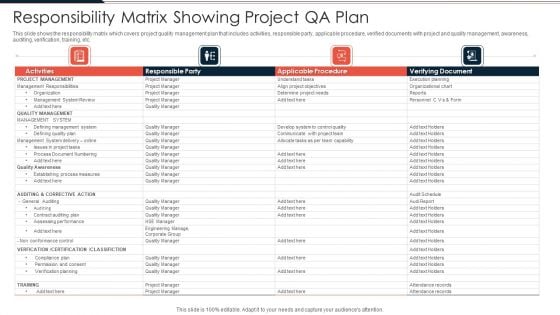
Responsibility Matrix Showing Project QA Plan Ppt PowerPoint Presentation File Skills PDF
This slide shows the responsibility matrix which covers project quality management plan that includes activities, responsible party, applicable procedure, verified documents with project and quality management, awareness, auditing, verification, training, etc. Pitch your topic with ease and precision using this responsibility matrix showing project qa plan ppt powerpoint presentation file skills pdf. This layout presents information on quality management, quality awareness, verification, certification. It is also available for immediate download and adjustment. So, changes can be made in the color, design, graphics or any other component to create a unique layout.
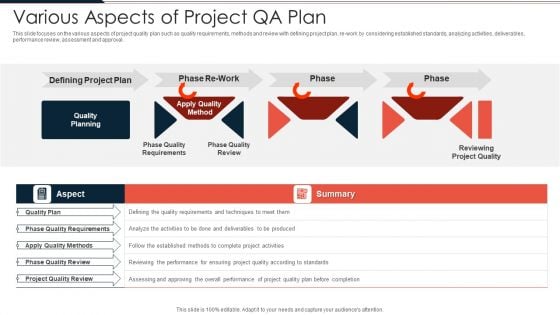
Various Aspects Of Project QA Plan Ppt PowerPoint Presentation File Design Inspiration PDF
This slide focuses on the various aspects of project quality plan such as quality requirements, methods and review with defining project plan, re work by considering established standards, analyzing activities, deliverables, performance review, assessment and approval. Pitch your topic with ease and precision using this various aspects of project qa plan ppt powerpoint presentation file design inspiration pdf. This layout presents information on defining project plan, phase quality requirements, phase quality review, phase quality requirements. It is also available for immediate download and adjustment. So, changes can be made in the color, design, graphics or any other component to create a unique layout.

RACE Framework For Marketing Product Launch Ppt PowerPoint Presentation File Graphic Tips PDF
Following slide highlights RACE framework which will help companies for marketing product launch. Reach, act, convert and engage are the elements of this framework that will results in successful completion of product launch campaign. Pitch your topic with ease and precision using this RACE Framework For Marketing Product Launch Ppt PowerPoint Presentation File Graphic Tips PDF. This layout presents information on Reach, Act, Convert, Engage. It is also available for immediate download and adjustment. So, changes can be made in the color, design, graphics or any other component to create a unique layout.
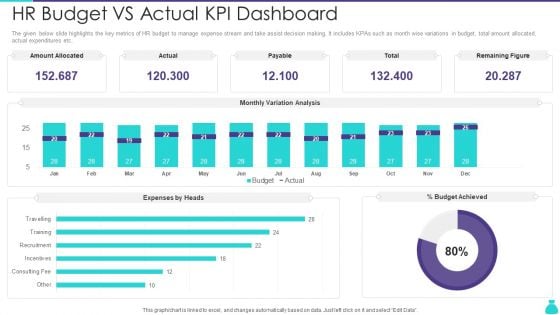
HR Budget Vs Actual KPI Dashboard Ppt PowerPoint Presentation File Structure PDF
The given below slide highlights the key metrics of HR budget to manage expense stream and take assist decision making. It includes KPAs such as month wise variations in budget, total amount allocated, actual expenditures etc. Pitch your topic with ease and precision using this HR Budget Vs Actual KPI Dashboard Ppt PowerPoint Presentation File Structure PDF. This layout presents information on Amount Allocated, Expenses by Heads, Budget Achieved. It is also available for immediate download and adjustment. So, changes can be made in the color, design, graphics or any other component to create a unique layout.
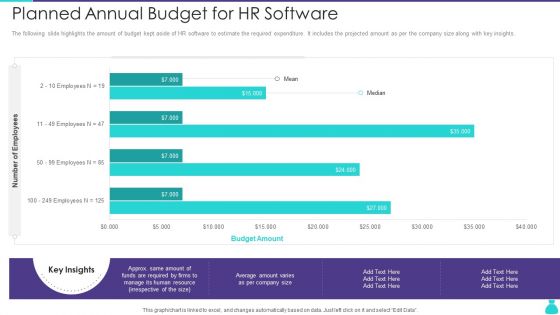
Planned Annual Budget For HR Software Ppt PowerPoint Presentation Gallery Outfit PDF
The following slide highlights the amount of budget kept aside of HR software to estimate the required expenditure. It includes the projected amount as per the company size along with key insights. Pitch your topic with ease and precision using this Planned Annual Budget For HR Software Ppt PowerPoint Presentation Gallery Outfit PDF. This layout presents information on Budget Amount, Employee. It is also available for immediate download and adjustment. So, changes can be made in the color, design, graphics or any other component to create a unique layout.
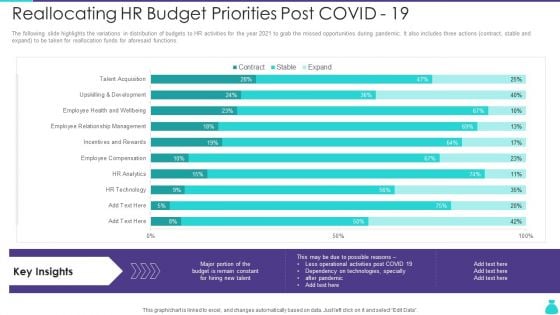
Reallocating HR Budget Priorities Post Covid 19 Ppt PowerPoint Presentation Gallery Graphics Download PDF
The following slide highlights the variations in distribution of budgets to HR activities for the year 2021 to grab the missed opportunities during pandemic. It also includes three actions contract, stable and expand to be taken for reallocation funds for aforesaid functions. Pitch your topic with ease and precision using this Reallocating HR Budget Priorities Post Covid 19 Ppt PowerPoint Presentation Gallery Graphics Download PDF. This layout presents information on HR Technology, HR Analytics, Employee Compensation. It is also available for immediate download and adjustment. So, changes can be made in the color, design, graphics or any other component to create a unique layout.
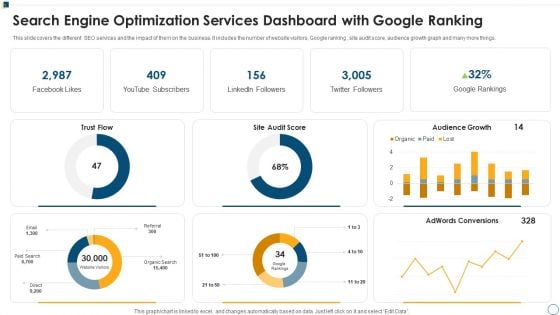
Search Engine Optimization Services Dashboard With Google Ranking Ppt Gallery Demonstration PDF
This slide covers the different SEO services and the impact of them on the business. It includes the number of website visitors, Google ranking , site audit score, audience growth graph and many more things. Pitch your topic with ease and precision using this Search Engine Optimization Services Dashboard With Google Ranking Ppt Gallery Demonstration PDF. This layout presents information on Audience Growth Paid, Adwords Conversions Score. It is also available for immediate download and adjustment. So, changes can be made in the color, design, graphics or any other component to create a unique layout.
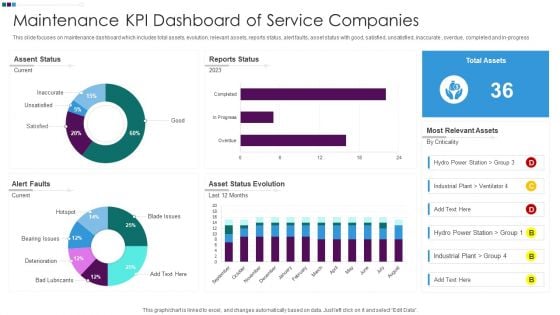
Maintenance KPI Dashboard Of Service Companies Ppt Outline Graphics Design PDF
This slide focuses on maintenance dashboard which includes total assets, evolution, relevant assets, reports status, alert faults, asset status with good, satisfied, unsatisfied, inaccurate , overdue, completed and in-progress. Pitch your topic with ease and precision using this Maintenance KPI Dashboard Of Service Companies Ppt Outline Graphics Design PDF. This layout presents information on Assent Status Current, Reports Status 2023, Asset Status Evolution. It is also available for immediate download and adjustment. So, changes can be made in the color, design, graphics or any other component to create a unique layout.
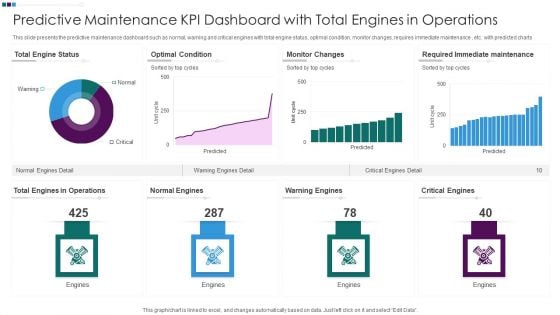
Predictive Maintenance KPI Dashboard With Total Engines In Operations Ppt Professional Inspiration PDF
This slide presents the predictive maintenance dashboard such as normal, warning and critical engines with total engine status, optimal condition, monitor changes, requires immediate maintenance , etc. with predicted charts. Pitch your topic with ease and precision using this Predictive Maintenance KPI Dashboard With Total Engines In Operations Ppt Professional Inspiration PDF. This layout presents information on Total Engine Status, Optimal Condition Monitor, Changes Warning Engines, Required Immediate Maintenance. It is also available for immediate download and adjustment. So, changes can be made in the color, design, graphics or any other component to create a unique layout.
Patient Healthcare Online Transformation Dashboard Ppt PowerPoint Presentation Icon Example File PDF
This slide displays the dashboard depicting the results of patients after the digital transformation. It includes the daily activity of the patients on the app, appointments, water balance, etc. Pitch your topic with ease and precision using this Patient Healthcare Online Transformation Dashboard Ppt PowerPoint Presentation Icon Example File PDF. This layout presents information on General Health, Water Balance, Transformation Dashboard. It is also available for immediate download and adjustment. So, changes can be made in the color, design, graphics or any other component to create a unique layout.
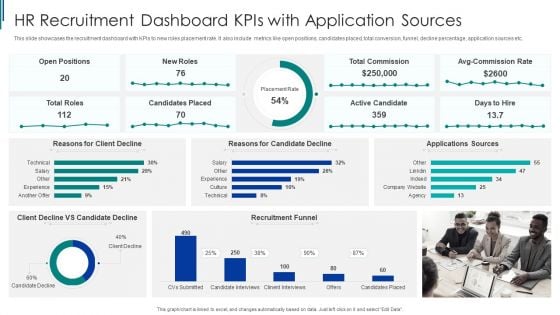
HR Recruitment Dashboard Kpis With Application Sources Ppt Pictures Styles PDF
This slide showcases the recruitment dashboard with KPIs to new roles placement rate. It also include metrics like open positions, candidates placed, total conversion, funnel, decline percentage, application sources etc. Pitch your topic with ease and precision using this HR Recruitment Dashboard Kpis With Application Sources Ppt Pictures Styles PDF. This layout presents information on Recruitment Funnel, HR Recruitment, Dashboard Kpis. It is also available for immediate download and adjustment. So, changes can be made in the color, design, graphics or any other component to create a unique layout.

HR Recruitment Dashboard Kpis With Open Positions Ppt Model Good PDF
Following slide showcases the recruitment dashboard metrics for measuring placement per department. It include KPIs like applications received by departments, applicant details, sources, time to hire. Pitch your topic with ease and precision using this HR Recruitment Dashboard Kpis With Open Positions Ppt Model Good PDF. This layout presents information on Offer Acceptance Ratio, Recruitment Funnel, Applicant Details. It is also available for immediate download and adjustment. So, changes can be made in the color, design, graphics or any other component to create a unique layout.
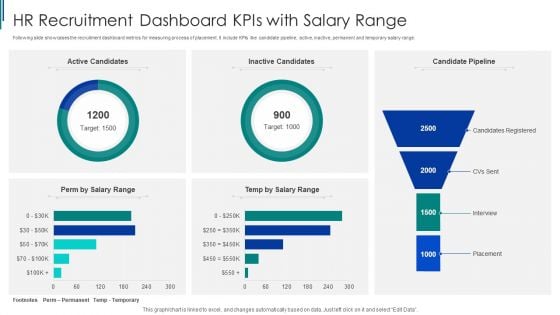
HR Recruitment Dashboard Kpis With Salary Range Ppt Inspiration Rules PDF
Following slide showcases the recruitment dashboard metrics for measuring process of placement. It include KPIs like candidate pipeline, active, inactive, permanent and temporary salary range. Pitch your topic with ease and precision using this HR Recruitment Dashboard Kpis With Salary Range Ppt Inspiration Rules PDF. This layout presents information on HR Recruitment, Dashboard Kpis, Salary Range. It is also available for immediate download and adjustment. So, changes can be made in the color, design, graphics or any other component to create a unique layout.
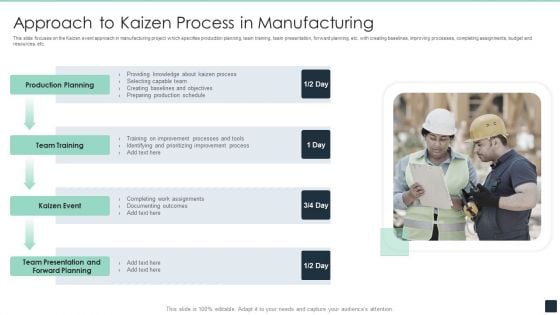
Approach To Kaizen Process In Manufacturing Ppt PowerPoint Presentation Gallery Show PDF
This slide focuses on the Kaizen event approach in manufacturing project which specifies production planning, team training, team presentation, forward planning, etc. with creating baselines, improving processes, completing assignments, budget and resources, etc. Pitch your topic with ease and precision using this Approach To Kaizen Process In Manufacturing Ppt PowerPoint Presentation Gallery Show PDF. This layout presents information on Production Planning, Team Training, Kaizen Event, Team Presentation, Forward Planning. It is also available for immediate download and adjustment. So, changes can be made in the color, design, graphics or any other component to create a unique layout.
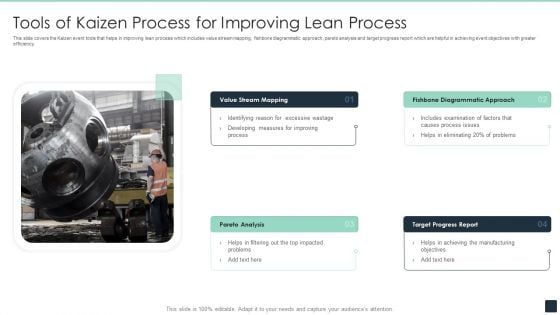
Tools Of Kaizen Process For Improving Lean Process Ppt PowerPoint Presentation File Clipart PDF
This slide covers the Kaizen event tools that helps in improving lean process which includes value stream mapping, fishbone diagrammatic approach, pareto analysis and target progress report which are helpful in achieving event objectives with greater efficiency. Pitch your topic with ease and precision using this Tools Of Kaizen Process For Improving Lean Process Ppt PowerPoint Presentation File Clipart PDF. This layout presents information on Value Stream Mapping, Fishbone Diagrammatic Approach, Pareto Analysis, Target Progress Report. It is also available for immediate download and adjustment. So, changes can be made in the color, design, graphics or any other component to create a unique layout.
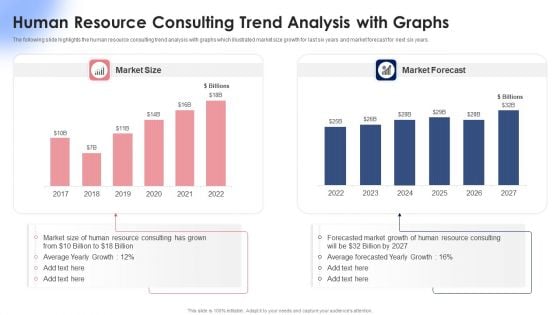
Human Resource Consulting Trend Analysis With Graphs Ppt Summary Clipart Images PDF
The following slide highlights the human resource consulting trend analysis with graphs which illustrated market size growth for last six years and market forecast for next six years. Pitch your topic with ease and precision using this Human Resource Consulting Trend Analysis With Graphs Ppt Summary Clipart Images PDF. This layout presents information on Market Size, Market Forecast, 2017 To 2022. It is also available for immediate download and adjustment. So, changes can be made in the color, design, graphics or any other component to create a unique layout.
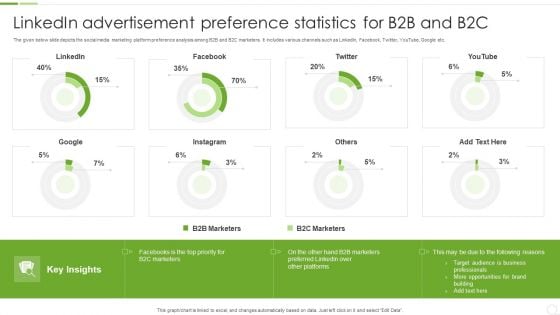
Linkedin Advertisement Preference Statistics For B2B And B2C Ppt Visual Aids Professional PDF
The given below slide depicts the social media marketing platform preference analysis among B2B and B2C marketers. It includes various channels such as LinkedIn, Facebook, Twitter, YouTube, Google etc. Pitch your topic with ease and precision using this Linkedin Advertisement Preference Statistics For B2B And B2C Ppt Visual Aids Professional PDF. This layout presents information on B2B Marketers, B2C Marketers, Target Audience. It is also available for immediate download and adjustment. So, changes can be made in the color, design, graphics or any other component to create a unique layout.
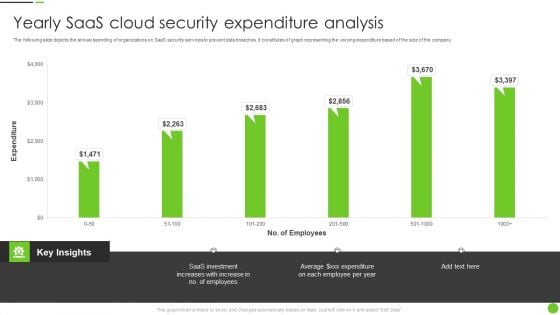
Yearly Saas Cloud Security Expenditure Analysis Ppt PowerPoint Presentation File Deck PDF
The following slide depicts the annual spending of organizations on SaaS security services to prevent data breaches. It constitutes of graph representing the varying expenditure based of the size of the company. Pitch your topic with ease and precision using this Yearly Saas Cloud Security Expenditure Analysis Ppt PowerPoint Presentation File Deck PDF. This layout presents information on Saas Investment, Employees. It is also available for immediate download and adjustment. So, changes can be made in the color, design, graphics or any other component to create a unique layout.
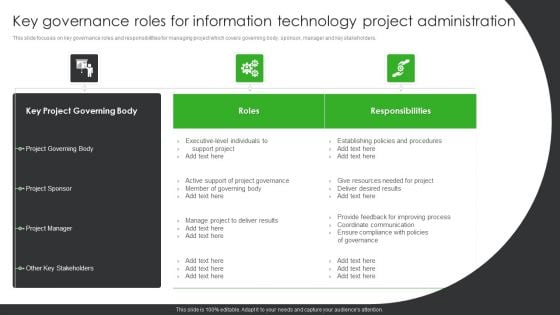
Key Governance Roles For Information Technology Project Administration Ppt PowerPoint Presentation Styles Background PDF
This slide focuses on key governance roles and responsibilities for managing project which covers governing body, sponsor, manager and key stakeholders. Pitch your topic with ease and precision using this Key Governance Roles For Information Technology Project Administration Ppt PowerPoint Presentation Styles Background PDF. This layout presents information on Project Governing Body, Project Governing Body, Project Sponsor. It is also available for immediate download and adjustment. So, changes can be made in the color, design, graphics or any other component to create a unique layout.

Four Dimensions Of Managed Cyber Security Solutions Service Ppt Pictures Model PDF
The following slide outlines the key dimensions of managed security service such as security information and event management, online staff augmentation, network security architecture and threat detection and alerts. Pitch your topic with ease and precision using this Four Dimensions Of Managed Cyber Security Solutions Service Ppt Pictures Model PDF. This layout presents information on Security Information, Event Management, Staff Augmentation. It is also available for immediate download and adjustment. So, changes can be made in the color, design, graphics or any other component to create a unique layout.
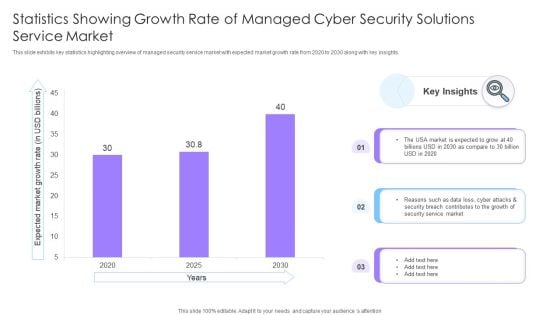
Statistics Showing Growth Rate Of Managed Cyber Security Solutions Service Market Ppt Show Inspiration PDF
This slide exhibits key statistics highlighting overview of managed security service market with expected market growth rate from 2020 to 2030 along with key insights. Pitch your topic with ease and precision using this Statistics Showing Growth Rate Of Managed Cyber Security Solutions Service Market Ppt Show Inspiration PDF. This layout presents information on Statistics Showing Growth, Cyber Security, Solutions Service Market. It is also available for immediate download and adjustment. So, changes can be made in the color, design, graphics or any other component to create a unique layout.
Stock Requirement Plan With Delivery Performance Ppt PowerPoint Presentation Icon Deck PDF
The following slide highlights the material requirement planning with delivery performance illustrating top clients by revenue details, top clients by revenue, delivery performance and shipments. Pitch your topic with ease and precision using this Stock Requirement Plan With Delivery Performance Ppt PowerPoint Presentation Icon Deck PDF. This layout presents information on Delivery Performance, Shipments, Top Clients Revenue. It is also available for immediate download and adjustment. So, changes can be made in the color, design, graphics or any other component to create a unique layout.
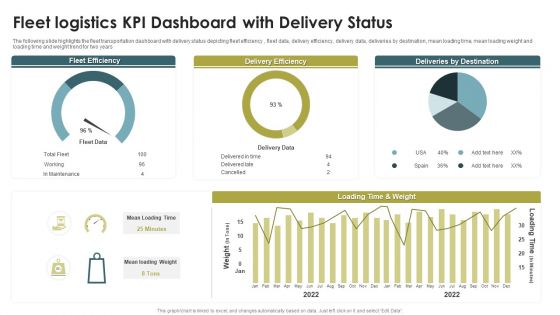
Fleet Logistics KPI Dashboard With Delivery Status Ppt Model Guide PDF
The following slide highlights the fleet transportation dashboard with delivery status depicting fleet efficiency , fleet data, delivery efficiency, delivery data, deliveries by destination, mean loading time, mean loading weight and loading time and weight trend for two years. Pitch your topic with ease and precision using this Fleet Logistics KPI Dashboard With Delivery Status Ppt Model Guide PDF. This layout presents information on Fleet Efficiency, Delivery Efficiency, Deliveries By Destination. It is also available for immediate download and adjustment. So, changes can be made in the color, design, graphics or any other component to create a unique layout.
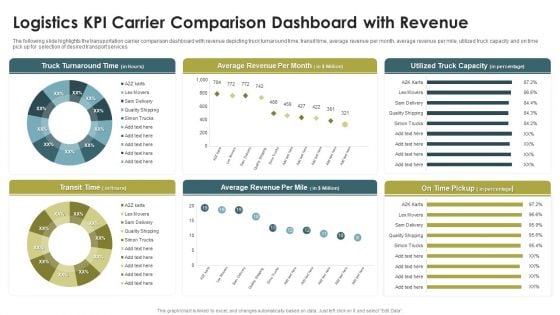
Logistics KPI Carrier Comparison Dashboard With Revenue Ppt Infographics Portfolio PDF
The following slide highlights the transportation carrier comparison dashboard with revenue depicting truck turnaround time, transit time, average revenue per month, average revenue per mile, utilized truck capacity and on time pick up for selection of desired transport services. Pitch your topic with ease and precision using this Logistics KPI Carrier Comparison Dashboard With Revenue Ppt Infographics Portfolio PDF. This layout presents information on Truck Turnaround Time, Average Revenue, Per Month, Transit Time. It is also available for immediate download and adjustment. So, changes can be made in the color, design, graphics or any other component to create a unique layout.
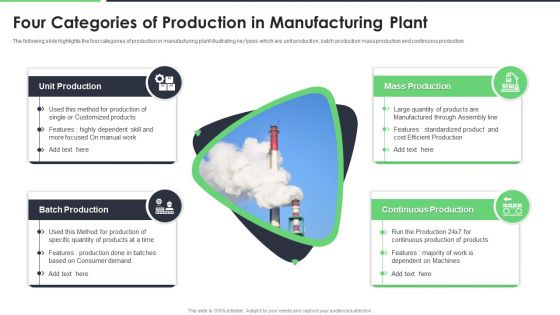
Four Categories Of Production In Manufacturing Plant Ppt Summary Show PDF
The following slide highlights the four categories of production in manufacturing plant illustrating key types which are unit production, batch production mass production and continuous production. Pitch your topic with ease and precision using this Four Categories Of Production In Manufacturing Plant Ppt Summary Show PDF. This layout presents information on Unit Production, Mass Production, Continuous Production, Batch Production. It is also available for immediate download and adjustment. So, changes can be made in the color, design, graphics or any other component to create a unique layout.
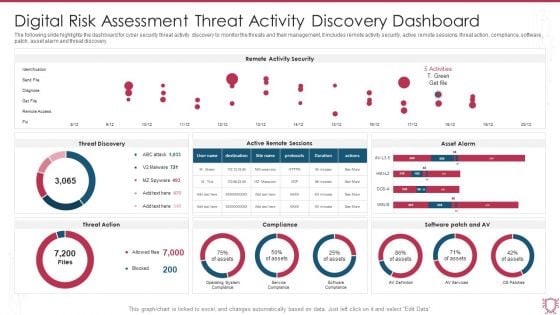
Digital Risk Assessment Threat Activity Discovery Dashboard Ppt Ideas Skills PDF
The following slide highlights the dashboard for cyber security threat activity discovery to monitor the threats and their management, it includes remote activity security, active remote sessions, threat action, compliance, software patch, asset alarm and threat discovery. Pitch your topic with ease and precision using this Digital Risk Assessment Threat Activity Discovery Dashboard Ppt Ideas Skills PDF. This layout presents information on Remote Activity Security, Threat Discovery, Asset Alarm. It is also available for immediate download and adjustment. So, changes can be made in the color, design, graphics or any other component to create a unique layout.
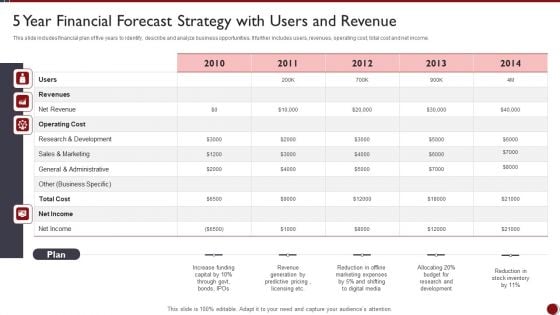
5 Year Financial Forecast Strategy With Users And Revenue Ppt PowerPoint Presentation Show Graphics Download PDF
This slide includes financial plan of five years to identify, describe and analyze business opportunities. It further includes users, revenues, operating cost, total cost and net income.Pitch your topic with ease and precision using this 5 Year Financial Forecast Strategy With Users And Revenue Ppt PowerPoint Presentation Show Graphics Download PDF. This layout presents information on Research Development, Sales Marketing, Business Specific. It is also available for immediate download and adjustment. So, changes can be made in the color, design, graphics or any other component to create a unique layout.

Web Development Gap Assessment Action Plan Ppt PowerPoint Presentation Layouts Design Ideas PDF
This slide covers the areas in which we have to focus to know where we are standing now and where we have to reach to close the gap and make the action plan accordingly.Pitch your topic with ease and precision using this Web Development Gap Assessment Action Plan Ppt PowerPoint Presentation Layouts Design Ideas PDF. This layout presents information on Customer Excellence, Community Impact, Cancellation Request. It is also available for immediate download and adjustment. So, changes can be made in the color, design, graphics or any other component to create a unique layout.
Market Insights Research Results With KPI Dashboard Ppt PowerPoint Presentation Icon File Formats PDF
The given below slide highlights the KPAs of market research associated with customer satisfaction. It includes net promoter score, customer effort score, monthly NPS and CES trend etc.Pitch your topic with ease and precision using this Market Insights Research Results With KPI Dashboard Ppt PowerPoint Presentation Icon File Formats PDF. This layout presents information on Satisfaction Score, Customer Effort, Customer Score. It is also available for immediate download and adjustment. So, changes can be made in the color, design, graphics or any other component to create a unique layout.
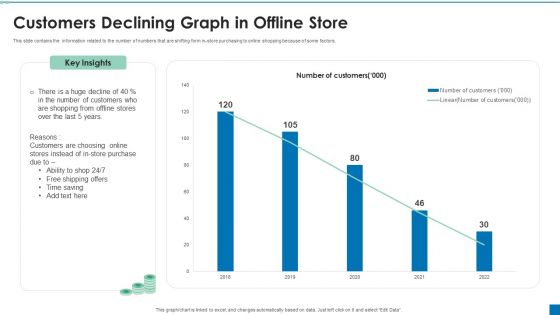
Customers Declining Graph In Offline Store Ppt PowerPoint Presentation Professional Clipart PDF
This slide contains the information related to the number of numbers that are shifting form in-store purchasing to online shopping because of some factors. Pitch your topic with ease and precision using this Customers Declining Graph In Offline Store Ppt PowerPoint Presentation Professional Clipart PDF. This layout presents information on Customers Choosing, Store Purchase, Time Saving. It is also available for immediate download and adjustment. So, changes can be made in the color, design, graphics or any other component to create a unique layout.
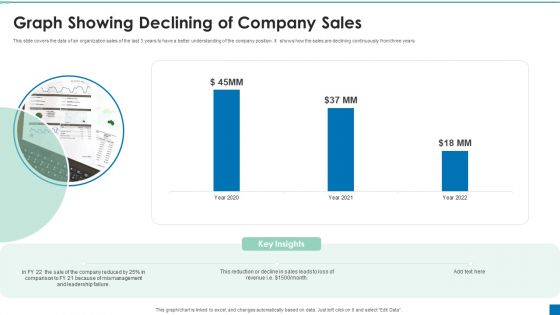
Graph Showing Declining Of Company Sales Ppt PowerPoint Presentation Portfolio Graphics Example PDF
This slide covers the data of an organization sales of the last 3 years to have a better understanding of the company position. It shows how the sales are declining continuously from three years.Pitch your topic with ease and precision using this Graph Showing Declining Of Company Sales Ppt PowerPoint Presentation Portfolio Graphics Example PDF. This layout presents information on Reduction Decline, Comparison, Mismanagement. It is also available for immediate download and adjustment. So, changes can be made in the color, design, graphics or any other component to create a unique layout.
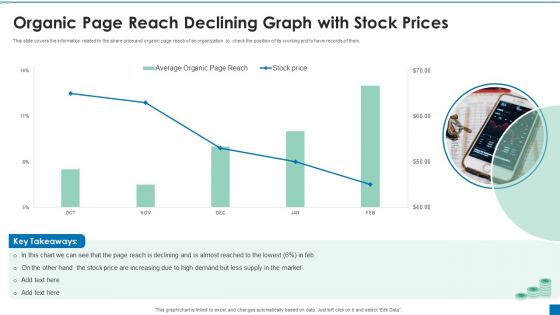
Organic Page Reach Declining Graph With Stock Prices Ppt PowerPoint Presentation Ideas Styles PDF
This slide covers the information related to the share price and organic page reach of an organization to check the position of its working and to have records of them.Pitch your topic with ease and precision using this Organic Page Reach Declining Graph With Stock Prices Ppt PowerPoint Presentation Ideas Styles PDF. This layout presents information on Increasing High, Reach Declining, Supply Market. It is also available for immediate download and adjustment. So, changes can be made in the color, design, graphics or any other component to create a unique layout.
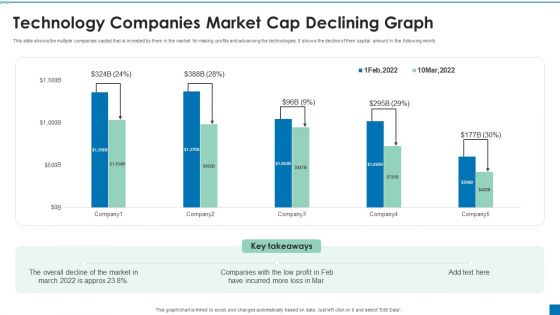
Technology Companies Market Cap Declining Graph Ppt PowerPoint Presentation File Smartart PDF
This slide shows the multiple companies capital that is invested by them in the market for making profits and advancing the technologies. It shows the decline of their capital amount in the following month. Pitch your topic with ease and precision using this Technology Companies Market Cap Declining Graph Ppt PowerPoint Presentation File Smartart PDF. This layout presents information on Overall Decline, Companies Low, Incurred Mor. It is also available for immediate download and adjustment. So, changes can be made in the color, design, graphics or any other component to create a unique layout.


 Continue with Email

 Home
Home


