Testing Dashboards

Actual Time Transaction Monitoring Software And Strategies Dashboard To Monitor Bank Transactions Guidelines PDF
This slide showcases dashboard to review bank transactions and activities. It provides information about credit, check, ATM, debit card, transaction volume, decline rate, visa, maestro, network end points, etc. Slidegeeks is here to make your presentations a breeze with Actual Time Transaction Monitoring Software And Strategies Dashboard To Monitor Bank Transactions Guidelines PDF With our easy to use and customizable templates, you can focus on delivering your ideas rather than worrying about formatting. With a variety of designs to choose from, you are sure to find one that suits your needs. And with animations and unique photos, illustrations, and fonts, you can make your presentation pop. So whether you are giving a sales pitch or presenting to the board, make sure to check out Slidegeeks first.
Streamlining Manufacturing Processes With Workflow Automation Dashboard For Monthly Procurement Process Automated Workflow Icons PDF
This slide presents a dashboard for monthly procurement activities in an organization. It includes number of suppliers, contract attainted, supplier share, top supplier report, average procurement cycle time, etc. Slidegeeks is here to make your presentations a breeze with Streamlining Manufacturing Processes With Workflow Automation Dashboard For Monthly Procurement Process Automated Workflow Icons PDF With our easy-to-use and customizable templates, you can focus on delivering your ideas rather than worrying about formatting. With a variety of designs to choose from, you are sure to find one that suits your needs. And with animations and unique photos, illustrations, and fonts, you can make your presentation pop. So whether you are giving a sales pitch or presenting to the board, make sure to check out Slidegeeks first

Techniques To Optimize Kpi Dashboard To Assess Employee Training Performance Designs PDF
This slide covers dashboard to analyze performance of training program. It involves details such as total number of classes, compensation cost, training hours and employee satisfaction rate. Slidegeeks is here to make your presentations a breeze with Techniques To Optimize Kpi Dashboard To Assess Employee Training Performance Designs PDF With our easy-to-use and customizable templates, you can focus on delivering your ideas rather than worrying about formatting. With a variety of designs to choose from, youre sure to find one that suits your needs. And with animations and unique photos, illustrations, and fonts, you can make your presentation pop. So whether youre giving a sales pitch or presenting to the board, make sure to check out Slidegeeks first.
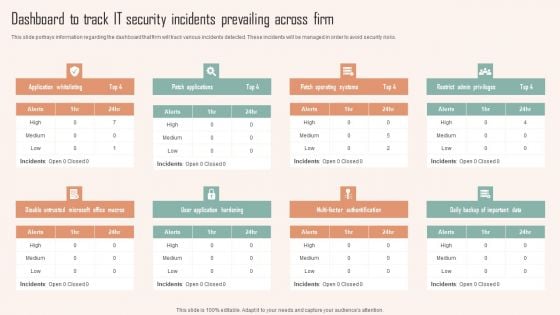
Dashboard To Track IT Security Incidents Prevailing Across Firm Ppt PowerPoint Presentation File Outline PDF
This slide portrays information regarding the dashboard that firm will track various incidents detected. These incidents will be managed in order to avoid security risks. Slidegeeks is here to make your presentations a breeze with Dashboard To Track IT Security Incidents Prevailing Across Firm Ppt PowerPoint Presentation File Outline PDF With our easy to use and customizable templates, you can focus on delivering your ideas rather than worrying about formatting. With a variety of designs to choose from, you are sure to find one that suits your needs. And with animations and unique photos, illustrations, and fonts, you can make your presentation pop. So whether you are giving a sales pitch or presenting to the board, make sure to check out Slidegeeks first.
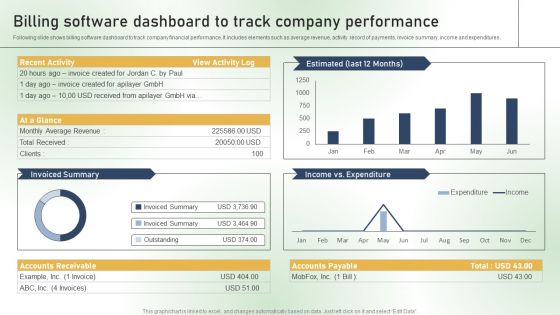
Billing Software Dashboard To Track Company Performance Ppt PowerPoint Presentation File Professional PDF
Following slide shows billing software dashboard to track company financial performance. It includes elements such as average revenue, activity record of payments, invoice summary, income and expenditures. Slidegeeks is here to make your presentations a breeze with Billing Software Dashboard To Track Company Performance Ppt PowerPoint Presentation File Professional PDF With our easy to use and customizable templates, you can focus on delivering your ideas rather than worrying about formatting. With a variety of designs to choose from, you are sure to find one that suits your needs. And with animations and unique photos, illustrations, and fonts, you can make your presentation pop. So whether you are giving a sales pitch or presenting to the board, make sure to check out Slidegeeks first.
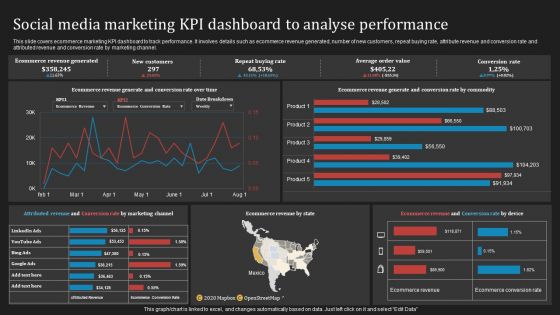
Deploying B2B Advertising Techniques For Lead Generation Social Media Marketing Kpi Dashboard Analyse Pictures PDF
This slide covers ecommerce marketing KPI dashboard to track performance. It involves details such as ecommerce revenue generated, number of new customers, repeat buying rate, attribute revenue and conversion rate and attributed revenue and conversion rate by marketing channel. Slidegeeks is here to make your presentations a breeze with Deploying B2B Advertising Techniques For Lead Generation Social Media Marketing Kpi Dashboard Analyse Pictures PDF With our easy to use and customizable templates, you can focus on delivering your ideas rather than worrying about formatting. With a variety of designs to choose from, you are sure to find one that suits your needs. And with animations and unique photos, illustrations, and fonts, you can make your presentation pop. So whether you are giving a sales pitch or presenting to the board, make sure to check out Slidegeeks first.
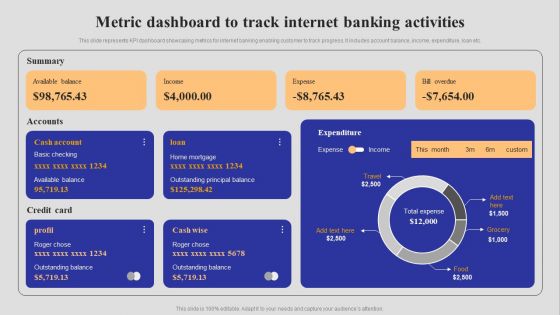
Introduction To Digital Banking Services Metric Dashboard To Track Internet Banking Activities Download PDF
This slide represents KPI dashboard showcasing metrics for internet banking enabling customer to track progress. It includes account balance, income, expenditure, loan etc. Slidegeeks is here to make your presentations a breeze with Introduction To Digital Banking Services Metric Dashboard To Track Internet Banking Activities Download PDF With our easy to use and customizable templates, you can focus on delivering your ideas rather than worrying about formatting. With a variety of designs to choose from, you are sure to find one that suits your needs. And with animations and unique photos, illustrations, and fonts, you can make your presentation pop. So whether you are giving a sales pitch or presenting to the board, make sure to check out Slidegeeks first.
Go Viral Campaign Strategies To Increase Engagement Dashboard For Tracking Viral Posts Across Digital Professional PDF
This slide showcases dashboard which can help marketers track viral posts across multiple platforms. It provides details about viral views, seed views, direct, searh, referrer, network, Facebook, Twitter, etc. Slidegeeks is here to make your presentations a breeze with Go Viral Campaign Strategies To Increase Engagement Dashboard For Tracking Viral Posts Across Digital Professional PDF With our easy to use and customizable templates, you can focus on delivering your ideas rather than worrying about formatting. With a variety of designs to choose from, you are sure to find one that suits your needs. And with animations and unique photos, illustrations, and fonts, you can make your presentation pop. So whether you are giving a sales pitch or presenting to the board, make sure to check out Slidegeeks first.
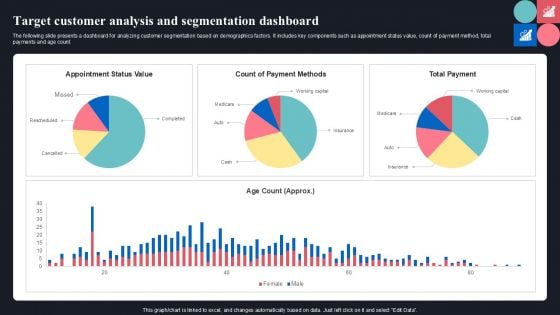
Target Customer Analysis And Segmentation Dashboard Ppt Portfolio Example Topics PDF
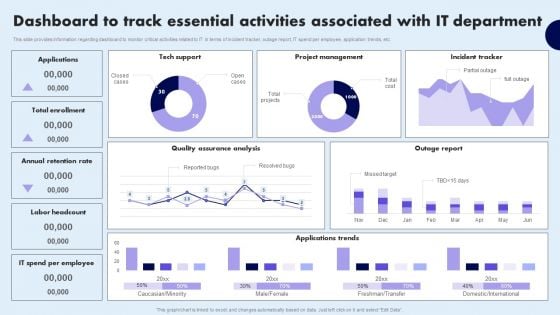
Dashboard To Track Essential Activities Associated With IT Department Microsoft PDF
This slide provides information regarding dashboard to monitor critical activities related to IT in terms of incident tracker, outage report, IT spend per employee, application trends, etc. Slidegeeks is here to make your presentations a breeze with Dashboard To Track Essential Activities Associated With IT Department Microsoft PDF With our easy-to-use and customizable templates, you can focus on delivering your ideas rather than worrying about formatting. With a variety of designs to choose from, you are sure to find one that suits your needs. And with animations and unique photos, illustrations, and fonts, you can make your presentation pop. So whether you are giving a sales pitch or presenting to the board, make sure to check out Slidegeeks first
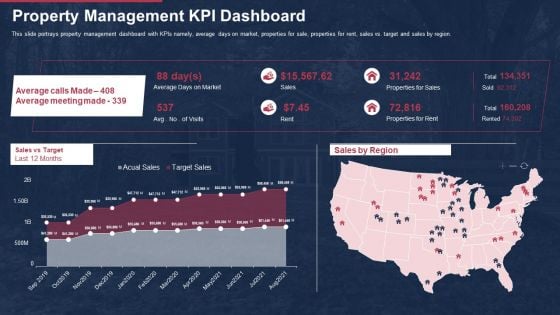
Building Promotional Campaign Real Estate Sales Property Management KPI Dashboard Rules PDF
Following slide illustrates information about the promotion strategy adopted by the firm to meet its objectives. Objectives covered in the slide are informative and persuasive promotion. Deliver an awe inspiring pitch with this creative building promotional campaign real estate sales property management kpi dashboard rules pdf bundle. Topics like process, producer, wholesalers, persuasive can be discussed with this completely editable template. It is available for immediate download depending on the needs and requirements of the user.
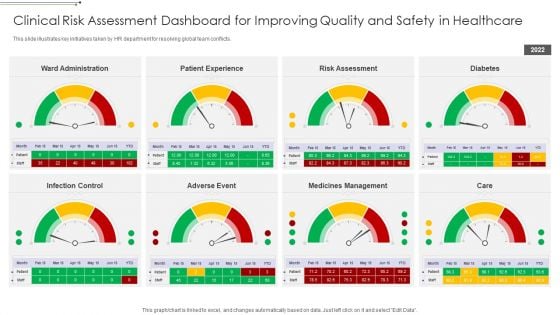
Clinical Risk Assessment Dashboard For Improving Quality And Safety In Healthcare Brochure PDF
This slide illustrates key initiatives taken by HR department for resolving global team conflicts. Pitch your topic with ease and precision using this Clinical Risk Assessment Dashboard For Improving Quality And Safety In Healthcare Brochure PDF This layout presents information on Ward Administration, Patient Experience, Risk Assessment It is also available for immediate download and adjustment. So, changes can be made in the color, design, graphics or any other component to create a unique layout.
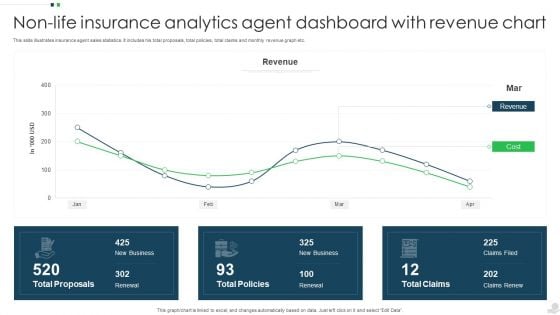
Non Life Insurance Analytics Agent Dashboard With Revenue Chart Infographics PDF
This slide illustrates insurance agent sales statistics. It includes his total proposals, total policies, total claims and monthly revenue graph etc. Showcasing this set of slides titled Non Life Insurance Analytics Agent Dashboard With Revenue Chart Infographics PDF. The topics addressed in these templates are Revenue, Cost, Total Proposals. All the content presented in this PPT design is completely editable. Download it and make adjustments in color, background, font etc. as per your unique business setting.
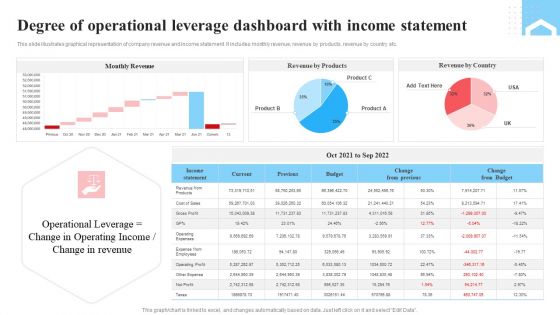
Degree Of Operational Leverage Dashboard With Income Statement Ppt Infographics Layout PDF
This slide illustrates graphical representation of company revenue and income statement. It includes monthly revenue, revenue by products, revenue by country etc. Pitch your topic with ease and precision using this Degree Of Operational Leverage Dashboard With Income Statement Ppt Infographics Layout PDF. This layout presents information on Monthly Revenue, Income Statement, Product. It is also available for immediate download and adjustment. So, changes can be made in the color, design, graphics or any other component to create a unique layout.
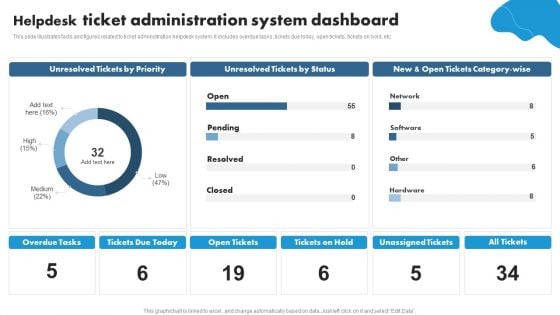
Helpdesk Ticket Administration System Dashboard Ppt PowerPoint Presentation Styles Topics PDF
This slide illustrates facts and figures related to ticket administration helpdesk system. It includes overdue tasks, tickets due today, open tickets, tickets on hold, etc.Showcasing this set of slides titled Helpdesk Ticket Administration System Dashboard Ppt PowerPoint Presentation Styles Topics PDF. The topics addressed in these templates are Unresolved Tickets, Tickets Status, Open Tickets. All the content presented in this PPT design is completely editable. Download it and make adjustments in color, background, font etc. as per your unique business setting.
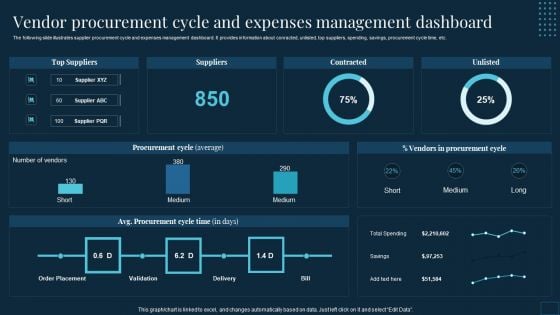
Vendor Management To Handle Purchase Vendor Procurement Cycle And Expenses Management Dashboard Topics PDF
The following slide illustrates supplier performance management program. It provides information about goals, evaluation criteria, conditions, potential outcomes, innovation, value, quality, management, cost, schedule, rating, etc.Deliver and pitch your topic in the best possible manner with this Vendor Management To Handle Purchase Vendor Procurement Cycle And Expenses Management Dashboard Topics PDF. Use them to share invaluable insights on Procurement Cycle, Total Spending, Contracted and impress your audience. This template can be altered and modified as per your expectations. So, grab it now.
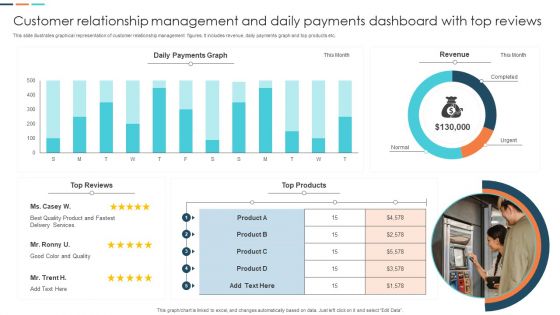
Customer Relationship Management And Daily Payments Dashboard With Top Reviews Professional PDF
This slide illustrates graphical representation of customer relationship management figures. It includes revenue, daily payments graph and top products etc. Showcasing this set of slides titled Customer Relationship Management And Daily Payments Dashboard With Top Reviews Professional PDF. The topics addressed in these templates are Quality Product, Services, Revenue. All the content presented in this PPT design is completely editable. Download it and make adjustments in color, background, font etc. as per your unique business setting.
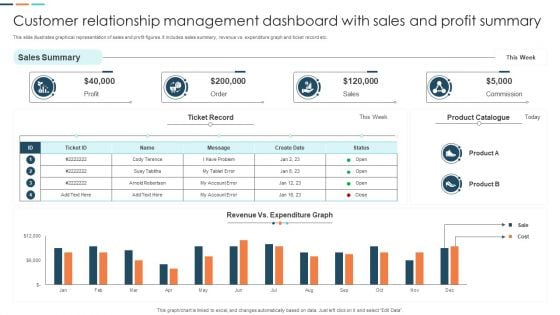
Customer Relationship Management Dashboard With Sales And Profit Summary Microsoft PDF
This slide illustrates graphical representation of sales and profit figures. It includes sales summary, revenue vs. expenditure graph and ticket record etc. Showcasing this set of slides titled Customer Relationship Management Dashboard With Sales And Profit Summary Microsoft PDF. The topics addressed in these templates are Product Catalogue, Sales, Profit. All the content presented in this PPT design is completely editable. Download it and make adjustments in color, background, font etc. as per your unique business setting.
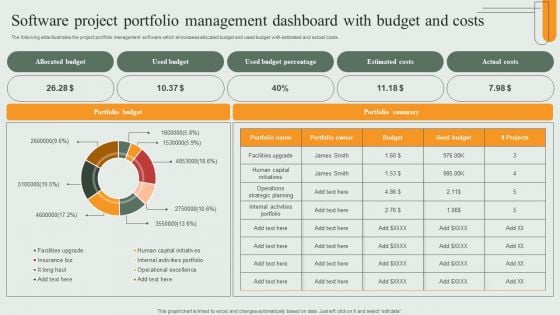
Software Project Portfolio Management Dashboard With Budget And Costs Structure PDF
The following slide illustrates the project portfolio management software which showcases allocated budget and used budget with estimated and actual costs. Showcasing this set of slides titled Software Project Portfolio Management Dashboard With Budget And Costs Structure PDF. The topics addressed in these templates are Allocated Budget, Used Budget, Used Budget Percentage. All the content presented in this PPT design is completely editable. Download it and make adjustments in color, background, font etc. as per your unique business setting.
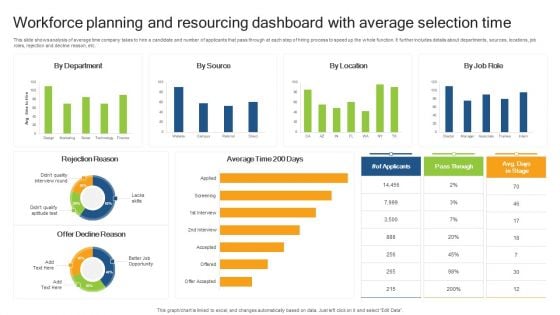
Workforce Planning And Resourcing Dashboard With Average Selection Time Demonstration PDF
This slide shows analysis of average time company takes to hire a candidate and number of applicants that pass through at each step of hiring process to speed up the whole function. It further includes details about departments, sources, locations, job roles, rejection and decline reason, etc. Showcasing this set of slides titled Workforce Planning And Resourcing Dashboard With Average Selection Time Demonstration PDF. The topics addressed in these templates are Rejection Reason, Offer Decline Reason, Average Time. All the content presented in this PPT design is completely editable. Download it and make adjustments in color, background, font etc. as per your unique business setting.
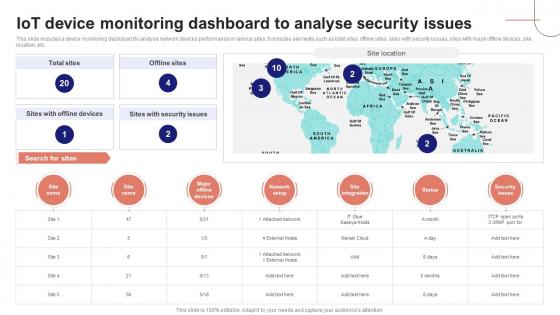
IoT Device Management Fundamentals IoT Device Monitoring Dashboard To Analyse IoT Ss V
This slide includes a device monitoring dashboard to analyse network devices performance in various sites. It includes elements such as total sites, offline sites, sites with security issues, sites with major offline devices, site location, etc. Slidegeeks is here to make your presentations a breeze with IoT Device Management Fundamentals IoT Device Monitoring Dashboard To Analyse IoT SS V With our easy-to-use and customizable templates, you can focus on delivering your ideas rather than worrying about formatting. With a variety of designs to choose from, you are sure to find one that suits your needs. And with animations and unique photos, illustrations, and fonts, you can make your presentation pop. So whether you are giving a sales pitch or presenting to the board, make sure to check out Slidegeeks first This slide includes a device monitoring dashboard to analyse network devices performance in various sites. It includes elements such as total sites, offline sites, sites with security issues, sites with major offline devices, site location, etc.
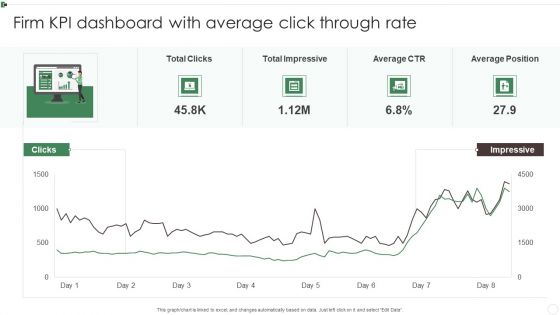
Firm KPI Dashboard With Average Click Through Rate Ppt Inspiration Sample PDF
This graph or chart is linked to excel, and changes automatically based on data. Just left click on it and select Edit Data. Pitch your topic with ease and precision using this Firm KPI Dashboard With Average Click Through Rate Ppt Inspiration Sample PDF. This layout presents information on Total Clicks, Total Impressive, Average CTR, Average Position. It is also available for immediate download and adjustment. So, changes can be made in the color, design, graphics or any other component to create a unique layout.
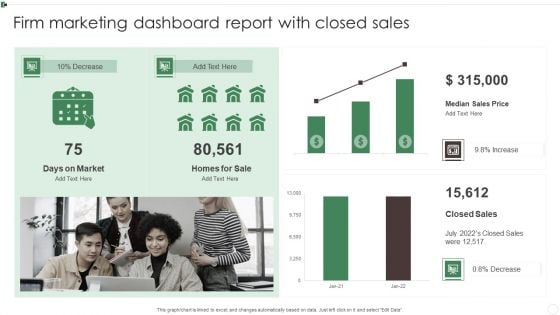
Firm Marketing Dashboard Report With Closed Sales Ppt Slides Graphics Example PDF
This graph or chart is linked to excel, and changes automatically based on data. Just left click on it and select Edit Data. Showcasing this set of slides titled Firm Marketing Dashboard Report With Closed Sales Ppt Slides Graphics Example PDF. The topics addressed in these templates are Days On Market, Homes For Sale, Median Sales Price, Closed Sales. All the content presented in this PPT design is completely editable. Download it and make adjustments in color, background, font etc. as per your unique business setting.
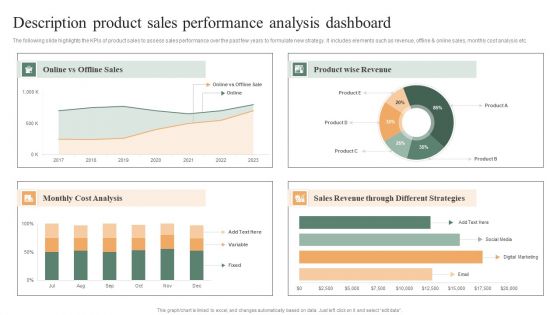
Description Product Sales Performance Analysis Dashboard Ppt PowerPoint Presentation File Samples PDF
The following slide highlights the KPIs of product sales to assess sales performance over the past few years to formulate new strategy. It includes elements such as revenue, offline and online sales, monthly cost analysis etc. Pitch your topic with ease and precision using this Description Product Sales Performance Analysis Dashboard Ppt PowerPoint Presentation File Samples PDF. This layout presents information on Product Wise Revenue, Monthly Cost Analysis, Sales Revenue, Different Strategies. It is also available for immediate download and adjustment. So, changes can be made in the color, design, graphics or any other component to create a unique layout.
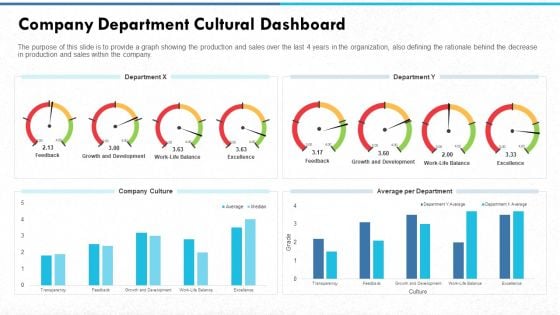
Managing Strong Company Culture In Business Company Department Cultural Dashboard Sample PDF
The purpose of this slide is to provide a graph showing the production and sales over the last 4 years in the organization, also defining the rationale behind the decrease in production and sales within the company. Deliver an awe-inspiring pitch with this creative managing strong company culture in business company department cultural dashboard sample pdf. bundle. Topics like company culture, average per department, department y, department x can be discussed with this completely editable template. It is available for immediate download depending on the needs and requirements of the user.
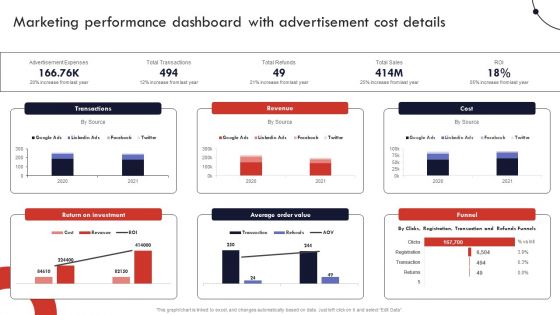
Product And Services Promotion Marketing Performance Dashboard With Advertisement Graphics PDF
This graph or chart is linked to excel, and changes automatically based on data. Just left click on it and select Edit Data. Slidegeeks is here to make your presentations a breeze with Product And Services Promotion Marketing Performance Dashboard With Advertisement Graphics PDF With our easy-to-use and customizable templates, you can focus on delivering your ideas rather than worrying about formatting. With a variety of designs to choose from, youre sure to find one that suits your needs. And with animations and unique photos, illustrations, and fonts, you can make your presentation pop. So whether youre giving a sales pitch or presenting to the board, make sure to check out Slidegeeks first.
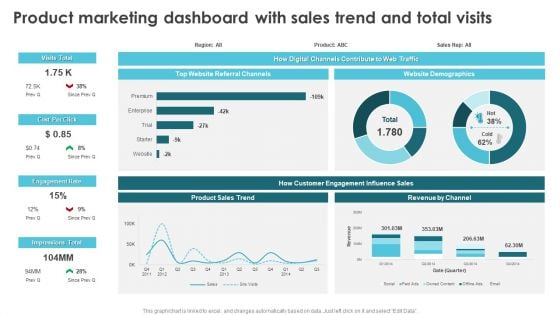
Product Marketing For Generating Product Marketing Dashboard With Sales Trend Designs PDF
This graph or chart is linked to excel, and changes automatically based on data. Just left click on it and select Edit Data. From laying roadmaps to briefing everything in detail, our templates are perfect for you. You can set the stage with your presentation slides. All you have to do is download these easy-to-edit and customizable templates. Product Marketing For Generating Product Marketing Dashboard With Sales Trend Designs PDF will help you deliver an outstanding performance that everyone would remember and praise you for. Do download this presentation today.
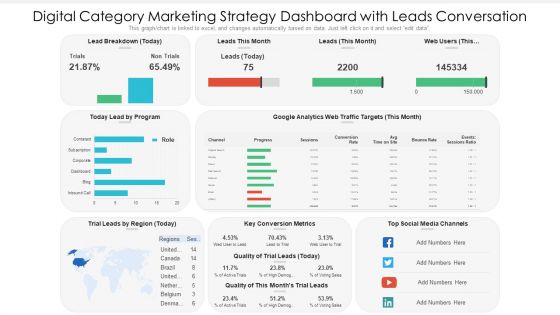
Digital Category Marketing Strategy Dashboard With Leads Conversation Ppt PowerPoint Presentation Slides Information PDF
This graph chart is linked to excel, and changes automatically based on data. Just left click on it and select edit data. Pitch your topic with ease and precision using this digital category marketing strategy dashboard with leads conversation ppt powerpoint presentation slides information pdf. This layout presents information on key conversion metrics, social media channels, lead by program. It is also available for immediate download and adjustment. So, changes can be made in the color, design, graphics or any other component to create a unique layout.

Funding Pitch On Key Financial Metrics Dashboard Ppt Ideas Deck PDF
This slide illustrates facts and figures related to important financial metrics It includes cash flow, DSO, ROCE, EPS diluted for Q4 FY21, Q3 FY22 and Q4 FY22 etc. Showcasing this set of slides titled Funding Pitch On Key Financial Metrics Dashboard Ppt Ideas Deck PDF. The topics addressed in these templates are Cash Flow, EPS Diluted, ROCE. All the content presented in this PPT design is completely editable. Download it and make adjustments in color, background, font etc. as per your unique business setting.
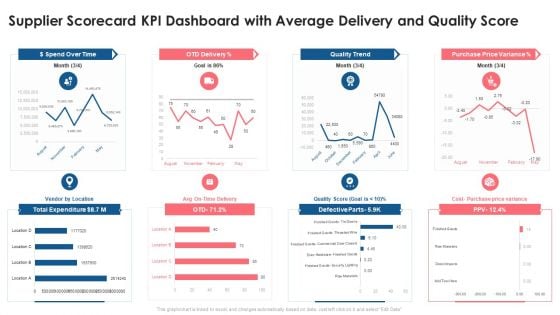
Supplier Scorecard Supplier Scorecard KPI Dashboard With Average Delivery And Quality Score Introduction PDF
This graph or chart is linked to excel, and changes automatically based on data. Just left click on it and select Edit Data. Deliver an awe inspiring pitch with this creative supplier scorecard supplier scorecard kpi dashboard with average delivery and quality score introduction pdf bundle. Topics like dollar spend over time, otd delivery, quality trend, purchase price variance, total expenditure can be discussed with this completely editable template. It is available for immediate download depending on the needs and requirements of the user.
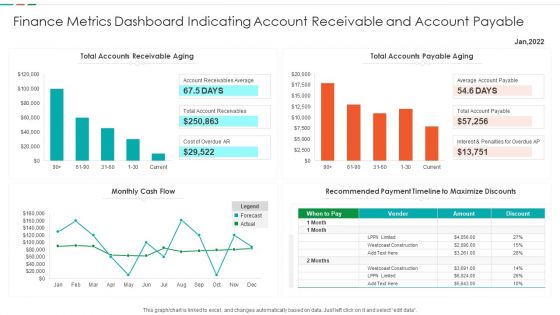
Finance Metrics Dashboard Indicating Account Receivable And Account Payable Demonstration PDF
This graph or chart is linked to excel, and changes automatically based on data. Just left click on it and select edit data. Showcasing this set of slides titled Finance Metrics Dashboard Indicating Account Receivable And Account Payable Demonstration PDF. The topics addressed in these templates are Total Accounts Receivable, Total Accounts Payable, Recommended Payment Timeline, Monthly Cash Flow. All the content presented in this PPT design is completely editable. Download it and make adjustments in color, background, font etc. as per your unique business setting.
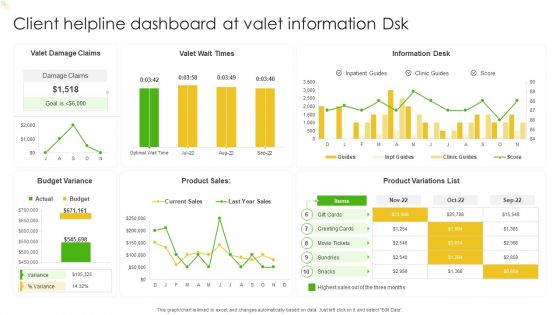
Client Helpline Dashboard At Valet Information Dsk Ppt Gallery Slide Portrait PDF
This graph or chart is linked to excel, and changes automatically based on data. Just left click on it and select Edit Data. Pitch your topic with ease and precision using this Client Helpline Dashboard At Valet Information Dsk Ppt Gallery Slide Portrait PDF. This layout presents information on Valet Damage Claims, Valet Wait Times, Information Desk. It is also available for immediate download and adjustment. So, changes can be made in the color, design, graphics or any other component to create a unique layout.

Firm KPI Dashboard With Schedule Performance Index Ppt Visual Aids PDF
This graph or chart is linked to excel, and changes automatically based on data. Just left click on it and select Edit Data. Pitch your topic with ease and precision using this Firm KPI Dashboard With Schedule Performance Index Ppt Visual Aids PDF. This layout presents information on Project Cost Performance, Project Planning Stage, Monitor And Control. It is also available for immediate download and adjustment. So, changes can be made in the color, design, graphics or any other component to create a unique layout.
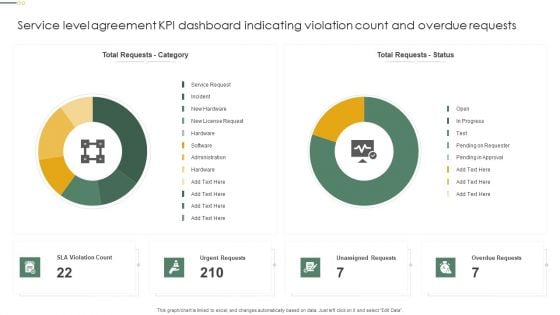
Service Level Agreement KPI Dashboard Indicating Violation Count And Overdue Requests Diagrams PDF
This graph or chart is linked to excel, and changes automatically based on data. Just left click on it and select Edit Data. Showcasing this set of slides titled Service Level Agreement KPI Dashboard Indicating Violation Count And Overdue Requests Diagrams PDF. The topics addressed in these templates are Total Requests Category, Total Requests Status, Urgent Requests. All the content presented in this PPT design is completely editable. Download it and make adjustments in color, background, font etc. as per your unique business setting.
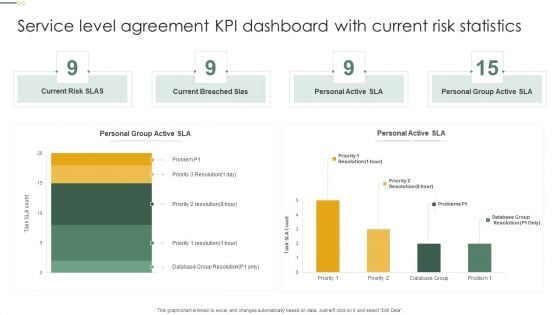
Service Level Agreement KPI Dashboard With Current Risk Statistics Topics PDF
This graph or chart is linked to excel, and changes automatically based on data. Just left click on it and select Edit Data. Pitch your topic with ease and precision using this Service Level Agreement KPI Dashboard With Current Risk Statistics Topics PDF. This layout presents information on Current Risk SLAS, Current Breached Slas, Personal Active SLA It is also available for immediate download and adjustment. So, changes can be made in the color, design, graphics or any other component to create a unique layout.
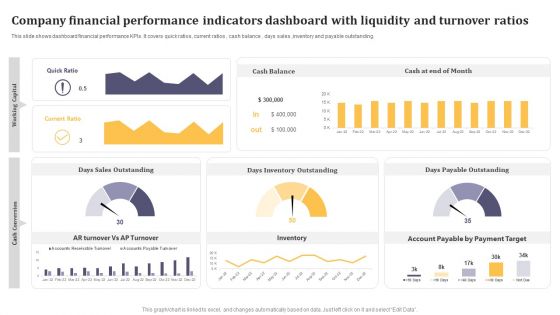
Company Financial Performance Indicators Dashboard With Liquidity And Turnover Ratios Formats PDF
This graph or chart is linked to excel, and changes automatically based on data. Just left click on it and select Edit Data. Pitch your topic with ease and precision using this Company Financial Performance Indicators Dashboard With Liquidity And Turnover Ratios Formats PDF. This layout presents information on Cash Balance, Days Inventory Outstanding, Days Payable Outstanding. It is also available for immediate download and adjustment. So, changes can be made in the color, design, graphics or any other component to create a unique layout.
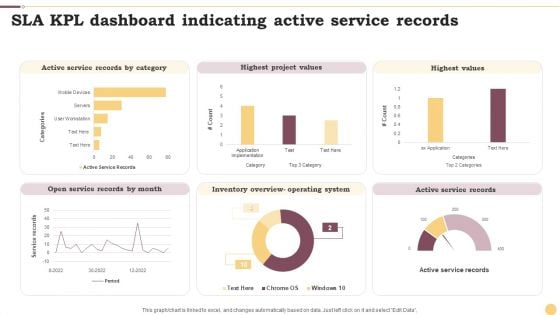
SLA KPL Dashboard Indicating Active Service Records Ppt Professional Graphics Example PDF
This graph or chart is linked to excel, and changes automatically based on data. Just left click on it and select Edit Data. Pitch your topic with ease and precision using this SLA KPL Dashboard Indicating Active Service Records Ppt Professional Graphics Example PDF. This layout presents information on Active Service Records, Highest Project Values, Highest Values. It is also available for immediate download and adjustment. So, changes can be made in the color, design, graphics or any other component to create a unique layout.
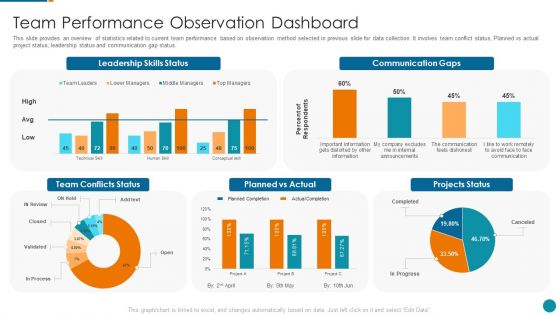
Strategic Procedure To Improve Employee Efficiency Team Performance Observation Dashboard Formats PDF
This slide provides an overview of statistics related to current team performance based on observation method selected in previous slide for data collection. It involves team conflict status, Planned vs actual project status, leadership status and communication gap status.Deliver an awe inspiring pitch with this creative strategic procedure to improve employee efficiency team performance observation dashboard formats pdf bundle. Topics like leadership skills status, communication gaps, planned vs actual can be discussed with this completely editable template. It is available for immediate download depending on the needs and requirements of the user.
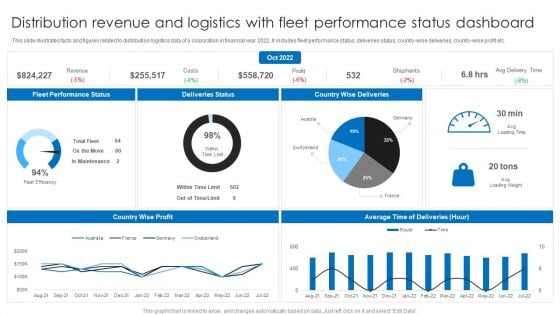
Distribution Revenue And Logistics With Fleet Performance Status Dashboard Ppt Layouts Background PDF
This slide illustrates facts and figures related to distribution logistics data of a corporation in financial year 2022. It includes fleet performance status, deliveries status, country-wise deliveries, country-wise profit etc. Pitch your topic with ease and precision using this Distribution Revenue And Logistics With Fleet Performance Status Dashboard Ppt Layouts Background PDF. This layout presents information on Deliveries Status, Country Wise Deliveries, Fleet Performance Status. It is also available for immediate download and adjustment. So, changes can be made in the color, design, graphics or any other component to create a unique layout.
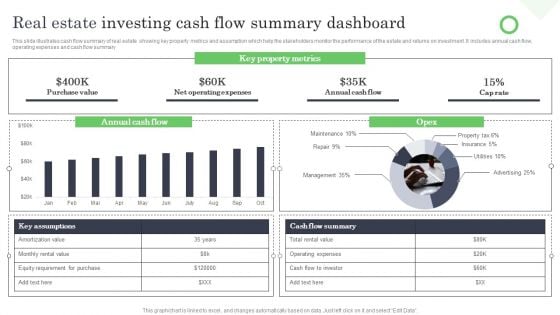
Real Estate Investing Cash Flow Summary Dashboard Ppt Model Design Ideas PDF
This slide illustrates cash flow summary of real estate showing key property metrics and assumption which help the stakeholders monitor the performance of the estate and returns on investment. It includes annual cash flow, operating expenses and cash flow summary. Showcasing this set of slides titled Real Estate Investing Cash Flow Summary Dashboard Ppt Model Design Ideas PDF. The topics addressed in these templates are Key Property Metrics, Cap Rate, Annual Cash Flow, Net Operating Expenses. All the content presented in this PPT design is completely editable. Download it and make adjustments in color, background, font etc. as per your unique business setting.
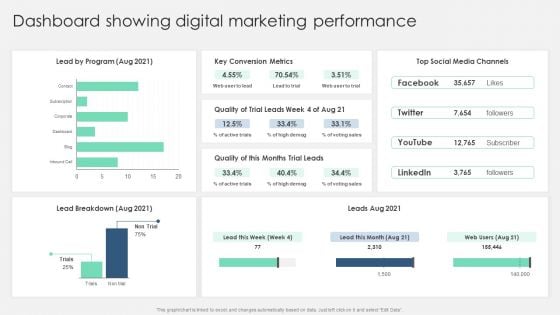
Product Marketing Management To Enforce Business Performance Dashboard Showing Digital Professional PDF
Do you know about Slidesgeeks Product Marketing Management To Enforce Business Performance Dashboard Showing Digital Professional PDF These are perfect for delivering any kind od presentation. Using it, create PowerPoint presentations that communicate your ideas and engage audiences. Save time and effort by using our pre designed presentation templates that are perfect for a wide range of topic. Our vast selection of designs covers a range of styles, from creative to business, and are all highly customizable and easy to edit. Download as a PowerPoint template or use them as Google Slides themes.
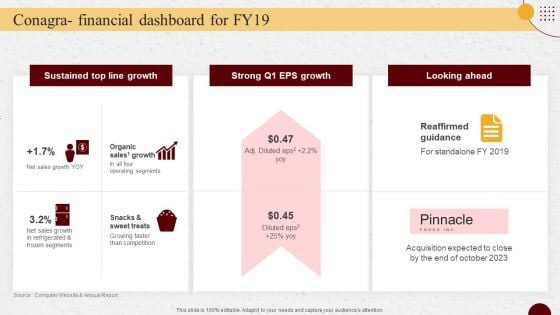
Industry Report Of Packaged Food Products Part 2 Conagra Financial Dashboard For Fy19 Microsoft PDF
Do you know about Slidesgeeks Industry Report Of Packaged Food Products Part 2 Conagra Financial Dashboard For Fy19 Microsoft PDF These are perfect for delivering any kind od presentation. Using it, create PowerPoint presentations that communicate your ideas and engage audiences. Save time and effort by using our pre designed presentation templates that are perfect for a wide range of topic. Our vast selection of designs covers a range of styles, from creative to business, and are all highly customizable and easy to edit. Download as a PowerPoint template or use them as Google Slides themes.
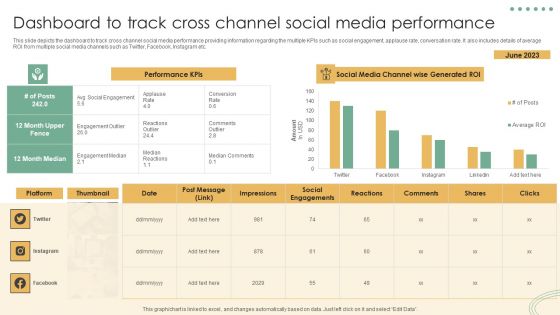
Online Marketing Techniques Assessment Approach Dashboard To Track Cross Channel Social Media Pictures PDF
Do you know about Slidesgeeks Online Marketing Techniques Assessment Approach Dashboard To Track Cross Channel Social Media Pictures PDF. These are perfect for delivering any kind od presentation. Using it, create PowerPoint presentations that communicate your ideas and engage audiences. Save time and effort by using our pre designed presentation templates that are perfect for a wide range of topic. Our vast selection of designs covers a range of styles, from creative to business, and are all highly customizable and easy to edit. Download as a PowerPoint template or use them as Google Slides themes.
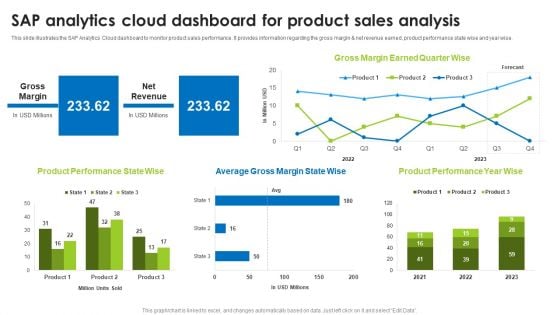
BI Technique For Data Informed Decisions Sap Analytics Cloud Dashboard For Product Sales Analysis Sample PDF
This slide illustrates the SAP Analytics Cloud dashboard to monitor product sales performance. It provides information regarding the gross margin and net revenue earned, product performance state wise and year wise. Welcome to our selection of the Budget Plan For BI Technique For Data Informed Decisions Clipart PDF. These are designed to help you showcase your creativity and bring your sphere to life. Planning and Innovation are essential for any business that is just starting out. This collection contains the designs that you need for your everyday presentations. All of our PowerPoints are 100 percent editable, so you can customize them to suit your needs. This multi purpose template can be used in various situations. Grab these presentation templates today.
Dashboard For Tracking New Food Product Launch Strategic Plan Effectiveness Themes PDF
This slide illustrates facts and figures related to new food item introduction for FY22. It includes social media views and interactions, weekly income, and promotional expenditure.Pitch your topic with ease and precision using this Dashboard For Tracking New Food Product Launch Strategic Plan Effectiveness Themes PDF. This layout presents information on Promotion Expenditure, Social Media, Views Interactions. It is also available for immediate download and adjustment. So, changes can be made in the color, design, graphics or any other component to create a unique layout.
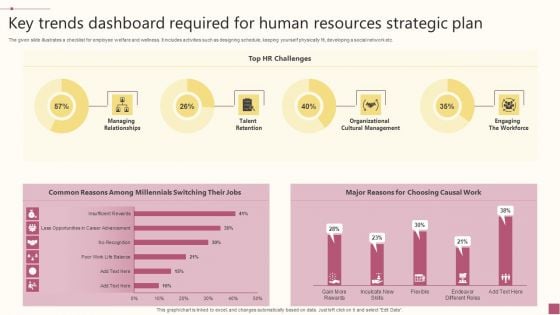
Key Trends Dashboard Required For Human Resources Strategic Plan Information PDF
The given slide illustrates a checklist for employee welfare and wellness. It includes activities such as designing schedule, keeping yourself physically fit, developing a social network etc. Showcasing this set of slides titled Key Trends Dashboard Required For Human Resources Strategic Plan Information PDF. The topics addressed in these templates are Organizational Cultural Management, Engaging Workforce, Talent Retention. All the content presented in this PPT design is completely editable. Download it and make adjustments in color, background, font etc. as per your unique business setting.
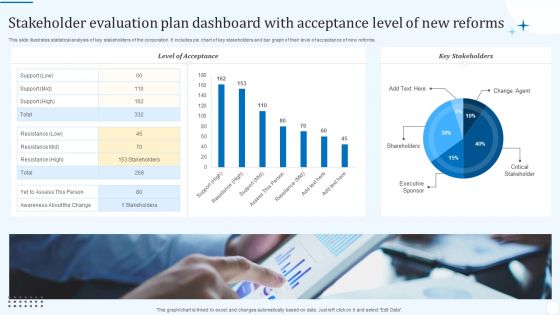
Stakeholder Evaluation Plan Dashboard With Acceptance Level Of New Reforms Background PDF
This slide illustrates statistical analysis of key stakeholders of the corporation. It includes pie chart of key stakeholders and bar graph of their level of acceptance of new reforms. Showcasing this set of slides titled Stakeholder Evaluation Plan Dashboard With Acceptance Level Of New Reforms Background PDF. The topics addressed in these templates are Level Acceptance, Key Stakeholders, Critical Stakeholder. All the content presented in this PPT design is completely editable. Download it and make adjustments in color, background, font etc. as per your unique business setting.
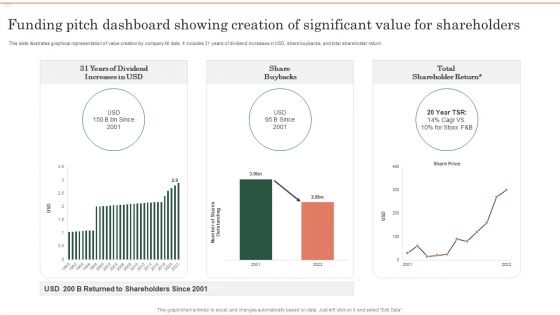
Funding Pitch Dashboard Showing Creation Of Significant Value For Shareholders Themes PDF
This slide illustrates graphical representation of value creation by company till date. It includes 31 years of dividend increases in USD, share buybacks, and total shareholder return. Showcasing this set of slides titled Funding Pitch Dashboard Showing Creation Of Significant Value For Shareholders Themes PDF. The topics addressed in these templates are 31 Years Dividend, Increases USD, Share Buybacks. All the content presented in this PPT design is completely editable. Download it and make adjustments in color, background, font etc. as per your unique business setting.
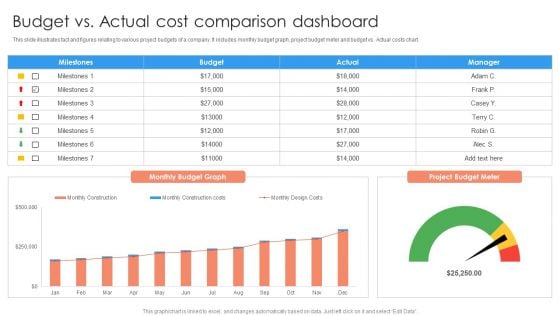
Budget Vs Actual Cost Comparison Dashboard Ppt PowerPoint Presentation Professional Format Ideas PDF
This slide illustrates fact and figures relating to various project budgets of a company. It includes monthly budget graph, project budget meter and budget vs. Actual costs chart.Pitch your topic with ease and precision using this Budget Vs Actual Cost Comparison Dashboard Ppt PowerPoint Presentation Professional Format Ideas PDF. This layout presents information on Milestones, Budget Graph, Manager. It is also available for immediate download and adjustment. So, changes can be made in the color, design, graphics or any other component to create a unique layout.
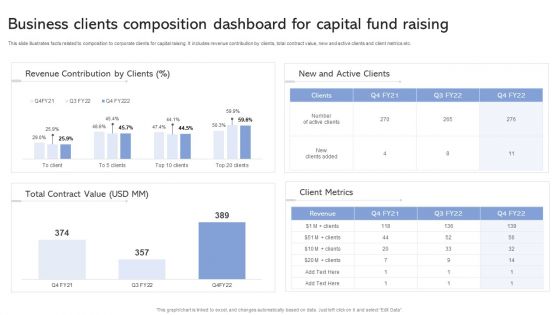
Business Clients Composition Dashboard For Capital Fund Raising Ppt Infographic Template Microsoft PDF
This slide illustrates facts related to composition to corporate clients for capital raising. It includes revenue contribution by clients, total contract value, new and active clients and client metrics etc. Showcasing this set of slides titled Business Clients Composition Dashboard For Capital Fund Raising Ppt Infographic Template Microsoft PDF. The topics addressed in these templates are Revenue Contribution Clients, Client Metrics, Total Contract Value. All the content presented in this PPT design is completely editable. Download it and make adjustments in color, background, font etc. as per your unique business setting.
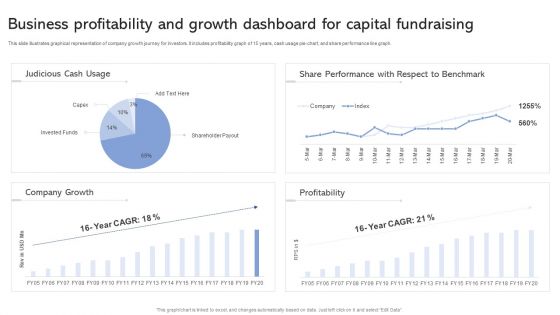
Business Profitability And Growth Dashboard For Capital Fundraising Ppt Slides Guide PDF
This slide illustrates graphical representation of company growth journey for investors. It includes profitability graph of 15 years, cash usage pie-chart, and share performance line graph. Showcasing this set of slides titled Business Profitability And Growth Dashboard For Capital Fundraising Ppt Slides Guide PDF. The topics addressed in these templates are Judicious Cash Usage, Share Performance, Respect To Benchmark. All the content presented in this PPT design is completely editable. Download it and make adjustments in color, background, font etc. as per your unique business setting.
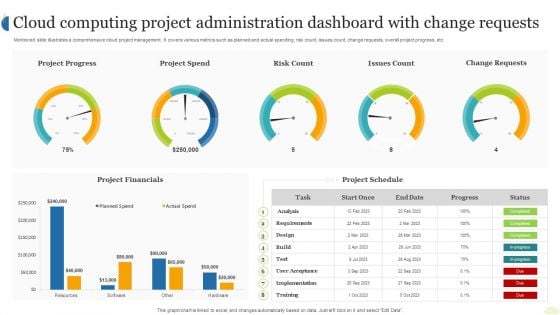
Cloud Computing Project Administration Dashboard With Change Requests Ppt Layouts Background Images PDF
Mentioned slide illustrates a comprehensive cloud project management. It covers various metrics such as planned and actual spending, risk count, issues count, change requests, overall project progress, etc. Showcasing this set of slides titled Cloud Computing Project Administration Dashboard With Change Requests Ppt Layouts Background Images PDF. The topics addressed in these templates are Project Financials, Project Spend, Project Progress. All the content presented in this PPT design is completely editable. Download it and make adjustments in color, background, font etc. as per your unique business setting.
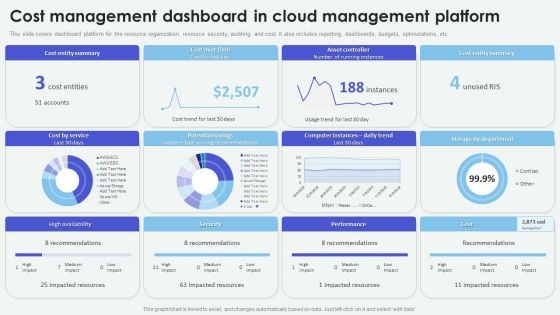
Cloud Based Computing Analysis Cost Management Dashboard In Cloud Management Formats PDF
Slidegeeks is here to make your presentations a breeze with Cloud Based Computing Analysis Cost Management Dashboard In Cloud Management Formats PDF With our easy-to-use and customizable templates, you can focus on delivering your ideas rather than worrying about formatting. With a variety of designs to choose from, youre sure to find one that suits your needs. And with animations and unique photos, illustrations, and fonts, you can make your presentation pop. So whether youre giving a sales pitch or presenting to the board, make sure to check out Slidegeeks first
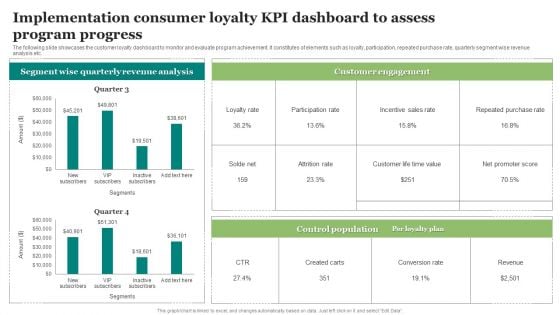
Implementation Consumer Loyalty KPI Dashboard To Assess Program Progress Guidelines PDF
The following slide illustrates the impact of executing artificial technology and machine learning in customer loyalty program. It includes elements such as predictive insights, prescriptive analytics, fraud prevention, intelligent interference etc. Showcasing this set of slides titled Implementation Consumer Loyalty KPI Dashboard To Assess Program Progress Guidelines PDF. The topics addressed in these templates are Implementation Consumer, Assess Program. All the content presented in this PPT design is completely editable. Download it and make adjustments in color, background, font etc. as per your unique business setting.
Ecommerce Website Creation Action Steps Playbook Ecommerce Website Performance Tracking Dashboard Template PDF
Slidegeeks is here to make your presentations a breeze with Ecommerce Website Creation Action Steps Playbook Ecommerce Website Performance Tracking Dashboard Template PDF With our easy-to-use and customizable templates, you can focus on delivering your ideas rather than worrying about formatting. With a variety of designs to choose from, youre sure to find one that suits your needs. And with animations and unique photos, illustrations, and fonts, you can make your presentation pop. So whether youre giving a sales pitch or presenting to the board, make sure to check out Slidegeeks first.
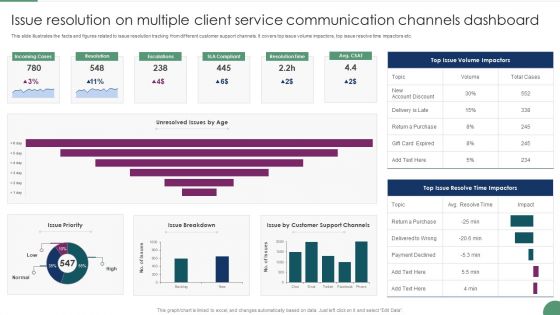
Issue Resolution On Multiple Client Service Communication Channels Dashboard Microsoft PDF
This slide illustrates the facts and figures related to issue resolution tracking from different customer support channels. It covers top issue volume impactors, top issue resolve time impactors etc. Pitch your topic with ease and precision using this Issue Resolution On Multiple Client Service Communication Channels Dashboard Microsoft PDF This layout presents information on Incoming Cases, Resolution, Escalations. It is also available for immediate download and adjustment. So, changes can be made in the color, design, graphics or any other component to create a unique layout.
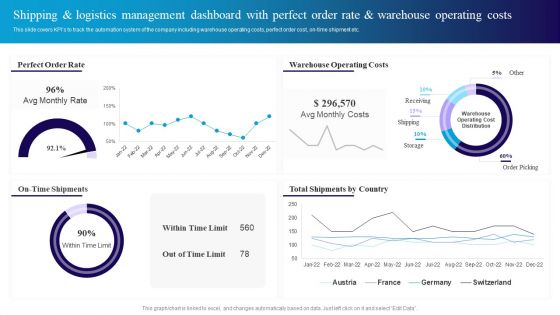
Shipping And Logistics Management Dashboard With Perfect Order Rate And Warehouse Sample PDF
This slide covers KPIs to track the automation system of the company including warehouse operating costs, perfect order cost, ontime shipment etc. This Shipping And Logistics Management Dashboard With Perfect Order Rate And Warehouse Sample PDF from Slidegeeks makes it easy to present information on your topic with precision. It provides customization options, so you can make changes to the colors, design, graphics, or any other component to create a unique layout. It is also available for immediate download, so you can begin using it right away. Slidegeeks has done good research to ensure that you have everything you need to make your presentation stand out. Make a name out there for a brilliant performance.

Survey Response Results KPI Dashboard Infographic Ppt PowerPoint Presentation Complete Deck With Slides
If designing a presentation takes a lot of your time and resources and you are looking for a better alternative, then this Survey Response Results KPI Dashboard Infographic Ppt PowerPoint Presentation Complete Deck With Slides is the right fit for you. This is a prefabricated set that can help you deliver a great presentation on the topic. All the twelv slides included in this sample template can be used to present a birds-eye view of the topic. These slides are also fully editable, giving you enough freedom to add specific details to make this layout more suited to your business setting. Apart from the content, all other elements like color, design, theme are also replaceable and editable. This helps in designing a variety of presentations with a single layout. Not only this, you can use this PPT design in formats like PDF, PNG, and JPG once downloaded. Therefore, without any further ado, download and utilize this sample presentation as per your liking.
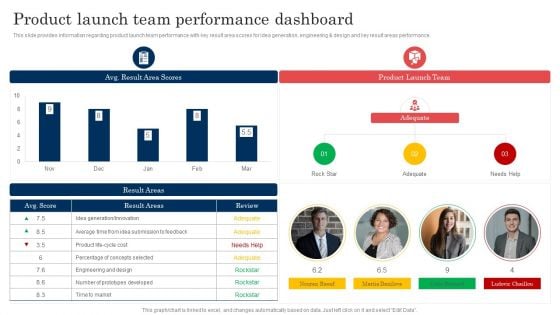
Commodity Launch Administration Playbook Product Launch Team Performance Dashboard Infographics PDF
This slide provides information regarding product launch team performance with key result area scores for idea generation, engineering and design and key result areas performance. Do you know about Slidesgeeks Commodity Launch Administration Playbook Product Launch Team Performance Dashboard Infographics PDF These are perfect for delivering any kind od presentation. Using it, create PowerPoint presentations that communicate your ideas and engage audiences. Save time and effort by using our pre-designed presentation templates that are perfect for a wide range of topic. Our vast selection of designs covers a range of styles, from creative to business, and are all highly customizable and easy to edit. Download as a PowerPoint template or use them as Google Slides themes.
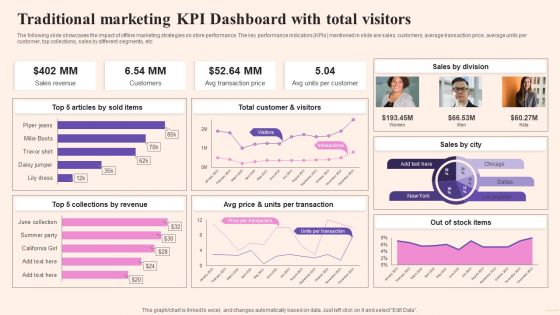
Comprehensive Guide To Build Marketing Traditional Marketing KPI Dashboard With Total Designs PDF
The following slide showcases the impact of offline marketing strategies on store performance. The key performance indicators KPIs mentioned in slide are sales, customers, average transaction price, average units per customer, top collections, sales by different segments, etc. Retrieve professionally designed Comprehensive Guide To Build Marketing Traditional Marketing KPI Dashboard With Total Designs PDF to effectively convey your message and captivate your listeners. Save time by selecting pre-made slideshows that are appropriate for various topics, from business to educational purposes. These themes come in many different styles, from creative to corporate, and all of them are easily adjustable and can be edited quickly. Access them as PowerPoint templates or as Google Slides themes. You do not have to go on a hunt for the perfect presentation because Slidegeeks got you covered from everywhere.


 Continue with Email

 Home
Home


