Thank You Icon
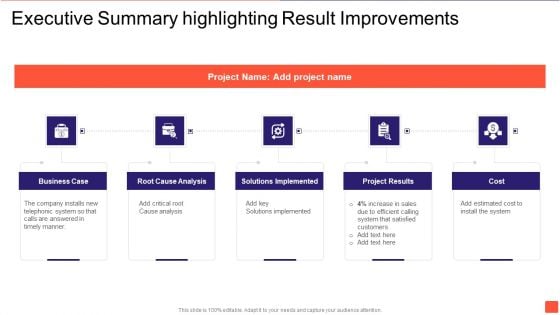
Executive Summary Highlighting Result Improvements Diagrams PDF
Persuade your audience using this Executive Summary Highlighting Result Improvements Diagrams PDF. This PPT design covers five stages, thus making it a great tool to use. It also caters to a variety of topics including Solutions Implemented, Project Results, Cost. Download this PPT design now to present a convincing pitch that not only emphasizes the topic but also showcases your presentation skills.
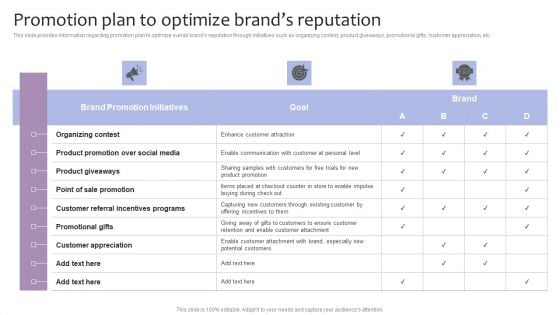
Strategic Brand Management Promotion Plan To Optimize Brands Reputation Diagrams PDF
This slide provides information regarding promotion plan to optimize overall brands reputation through initiatives such as organizing contest, product giveaways, promotional gifts, customer appreciation, etc. Deliver and pitch your topic in the best possible manner with this Strategic Brand Management Promotion Plan To Optimize Brands Reputation Diagrams PDF. Use them to share invaluable insights on Brand Promotion Initiatives, Goals, Customer Appreciation and impress your audience. This template can be altered and modified as per your expectations. So, grab it now.
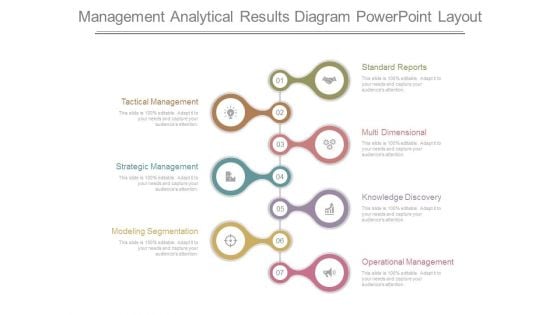
Management Analytical Results Diagram Powerpoint Layout
This is a management analytical results diagram powerpoint layout. This is a seven stage process. The stages in this process are standard reports, multi dimensional, knowledge discovery, operational management, modeling segmentation, strategic management, tactical management.
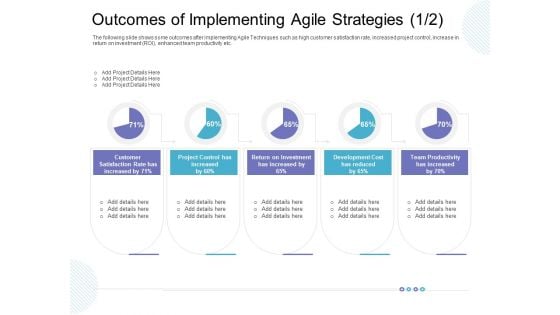
Outcomes Of Implementing Agile Strategies Has Sample PDF
The following slide shows some outcomes after implementing Agile Techniques such as high customer satisfaction rate, increased project control, increase in return on investment ROI, enhanced team productivity etc. Deliver an awe-inspiring pitch with this creative outcomes of implementing agile strategies has sample pdf bundle. Topics like customer satisfaction rate, team productivity, project control, return on investment, development cost can be discussed with this completely editable template. It is available for immediate download depending on the needs and requirements of the user.
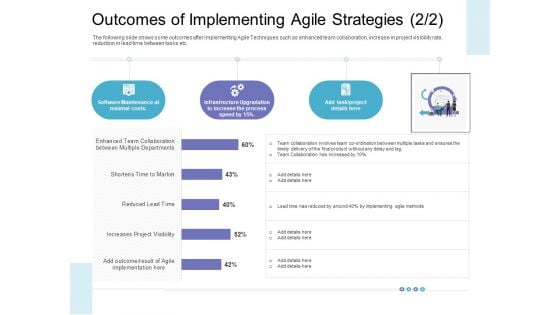
Outcomes Of Implementing Agile Strategies Lag Template PDF
The following slide shows some outcomes after implementing Agile Techniques such as enhanced team collaboration, increase in project visibility rate, reduction in lead time between tasks etc. Deliver and pitch your topic in the best possible manner with this outcomes of implementing agile strategies lag template pdf. Use them to share invaluable insights on infrastructure, software maintenance at minimal costs, increase the process and impress your audience. This template can be altered and modified as per your expectations. So, grab it now.
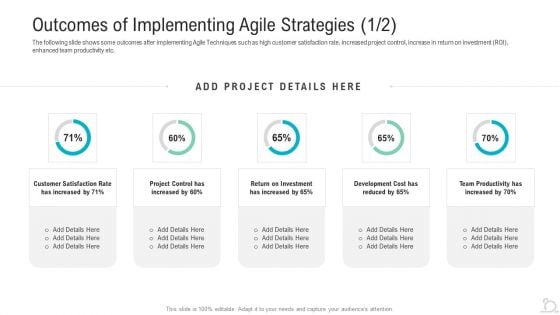
Outcomes Of Implementing Agile Strategies Rate Ppt Outline Mockup PDF
The following slide shows some outcomes after implementing Agile Techniques such as high customer satisfaction rate, increased project control, increase in return on investment ROI, enhanced team productivity etc. Deliver an awe-inspiring pitch with this creative outcomes of implementing agile strategies rate ppt outline mockup pdf bundle. Topics like team productivity, development cost, return on investment can be discussed with this completely editable template. It is available for immediate download depending on the needs and requirements of the user.
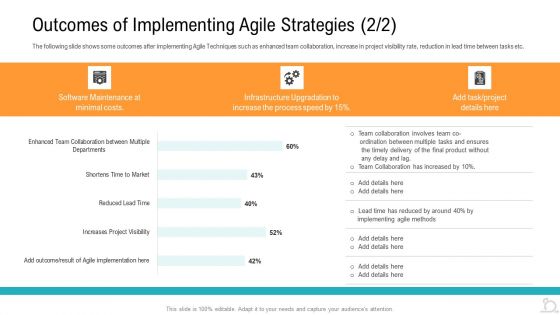
Outcomes Of Implementing Agile Strategies Costs Slides PDF
The following slide shows some outcomes after implementing Agile Techniques such as enhanced team collaboration, increase in project visibility rate, reduction in lead time between tasks etc. Deliver an awe inspiring pitch with this creative outcomes of implementing agile strategies costs slides pdf bundle. Topics like software maintenance, infrastructure upgradation, team collaboration can be discussed with this completely editable template. It is available for immediate download depending on the needs and requirements of the user.
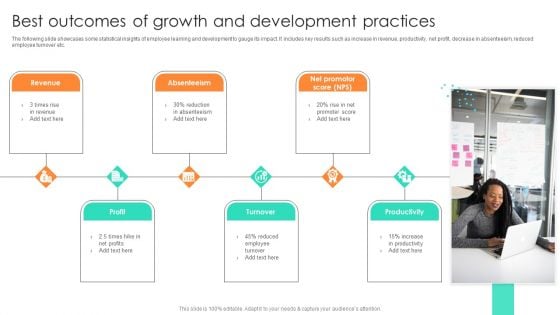
Best Outcomes Of Growth And Development Practices Template PDF
The following slide showcases some statistical insights of employee learning and development to gauge its impact. It includes key results such as increase in revenue, productivity, net profit, decrease in absenteeism, reduced employee turnover etc. Presenting Best Outcomes Of Growth And Development Practices Template PDF to dispense important information. This template comprises six stages. It also presents valuable insights into the topics including Revenue, Absenteeism, Profit. This is a completely customizable PowerPoint theme that can be put to use immediately. So, download it and address the topic impactfully.
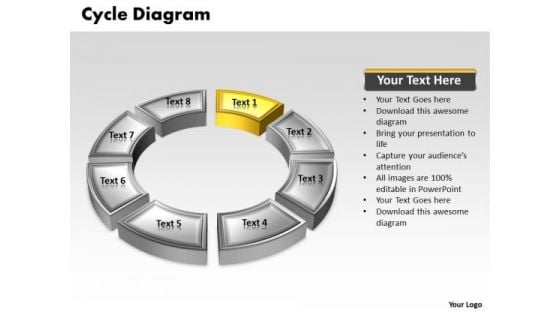
Ppt Yellow Animated Text Cycle Network Diagram PowerPoint Template Templates
PPT yellow animated text cycle network diagram powerpoint template Templates-Use this Circular diagram to show activities that are related to the business plan metrics and monitor the results to determine if the business plan is proceeding as planned.-PPT yellow animated text cycle network diagram powerpoint template Templates-Abstract, Blank, Business, Chart, Circular, Circulation, Cycle, Design, Diagram, Empty, Executive, Icon, Illustration, Management, Model, Numbers, Organization, Procedure, Process Recognize your calling with our Ppt Yellow Animated Text Cycle Network Diagram PowerPoint Template Templates. Download without worries with our money back guaranteee.
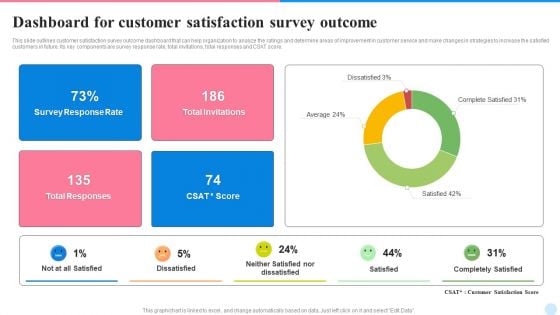
Dashboard For Customer Satisfaction Survey Outcome Demonstration PDF
This slide outlines customer satisfaction survey outcome dashboard that can help organization to analyze the ratings and determine areas of improvement in customer service and make changes in strategies to increase the satisfied customers in future. Its key components are survey response rate, total invitations, total responses and CSAT score. Showcasing this set of slides titled Dashboard For Customer Satisfaction Survey Outcome Demonstration PDF. The topics addressed in these templates are Total Invitations, Survey Response Rate, Total Responses. All the content presented in this PPT design is completely editable. Download it and make adjustments in color, background, font etc. as per your unique business setting.
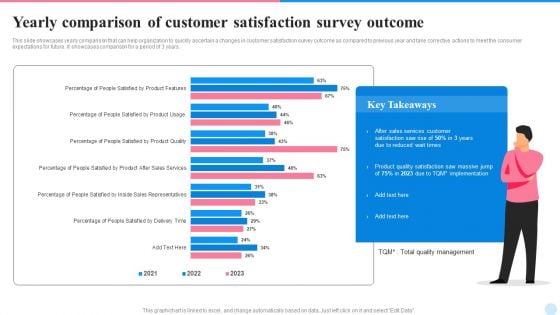
Yearly Comparison Of Customer Satisfaction Survey Outcome Demonstration PDF
This slide showcases yearly comparison that can help organization to quickly ascertain a changes in customer satisfaction survey outcome as compared to previous year and take corrective actions to meet the consumer expectations for future. It showcases comparison for a period of 3 years. Showcasing this set of slides titled Yearly Comparison Of Customer Satisfaction Survey Outcome Demonstration PDF. The topics addressed in these templates are Sales Services Customer, Implementation, Product Quality Satisfaction. All the content presented in this PPT design is completely editable. Download it and make adjustments in color, background, font etc. as per your unique business setting.
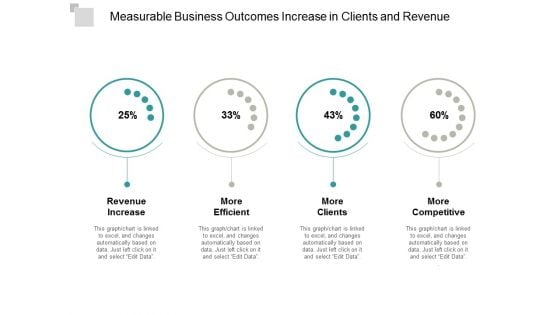
Measurable Business Outcomes Increase In Clients And Revenue Ppt PowerPoint Presentation Layouts Format Ideas
Presenting this set of slides with name measurable business outcomes increase in clients and revenue ppt powerpoint presentation layouts format ideas. The topics discussed in these slides are business outcomes, business results, business output. This is a completely editable PowerPoint presentation and is available for immediate download. Download now and impress your audience.
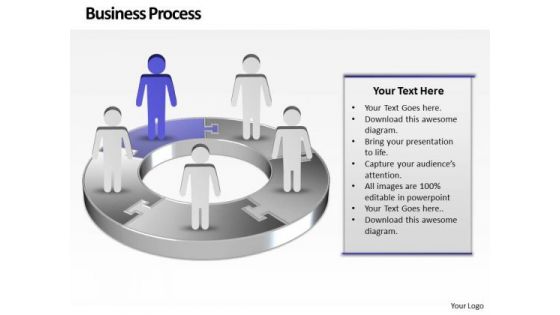
Ppt Purple Men Standing On Free Concept Pie PowerPoint Presentation Chart Templates
PPT purple men standing on free concept pie powerpoint presentation chart Templates-Use this Circular Arrow diagram to show activities that are related to the business plan metrics and monitor the results to determine if the business plan is proceeding as planned.-PPT purple men standing on free concept pie powerpoint presentation chart Templates-3d, arrow, background, blue, chart, circle, circular, clipart, colorful, connection, continuity, cycle, cyclic, diagram, direction, flow, graph, icon, illustration, isolated, loop, motion, process, progress, recycle, ring, round, step, sticker, symbol, teamwork, template, turn, vector Analyse the effect of different factors. Our Ppt Purple Men Standing On Free Concept Pie PowerPoint Presentation Chart Templates will give them equal attention.
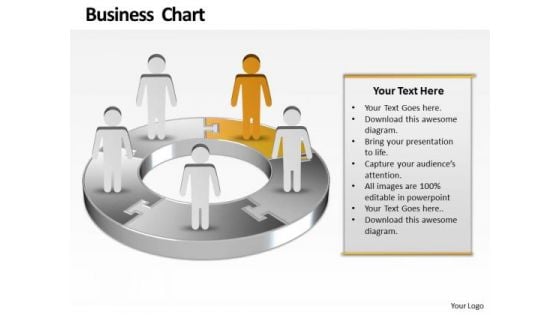
Ppt Yellow Men Standing On Business PowerPoint Presentation Pie Chart Templates
PPT yellow men standing on business powerpoint presentation pie chart Templates-Use this Circular Arrow diagram to show activities that are related to the business plan metrics and monitor the results to determine if the business plan is proceeding as planned.-PPT yellow men standing on business powerpoint presentation pie chart Templates-3d, arrow, background, blue, chart, circle, circular, clipart, colorful, connection, continuity, cycle, cyclic, diagram, direction, flow, graph, icon, illustration, isolated, loop, motion, process, progress, recycle, ring, round, step, sticker, symbol, teamwork, template, turn, vector Deal with matters in an equitable way. Reach a settlement with the help of our Ppt Yellow Men Standing On Business PowerPoint Presentation Pie Chart Templates.
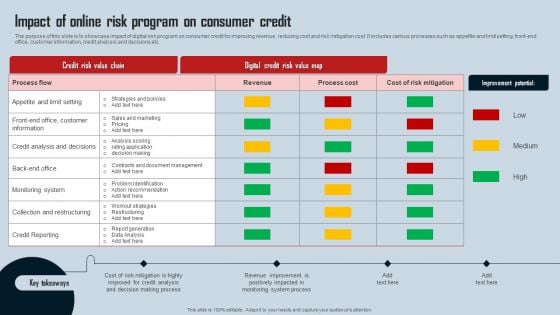
Impact Of Online Risk Program On Consumer Credit Diagrams PDF
The purpose of this slide is to showcase impact of digital risk program on consumer credit for improving revenue, reducing cost and risk mitigation cost. It includes various processes such as appetite and limit setting, front-end office, customer information, credit analysis and decisions etc. Showcasing this set of slides titled Impact Of Online Risk Program On Consumer Credit Diagrams PDF. The topics addressed in these templates are Appetite Limit Setting, Analysis Scoring, Rating Application. All the content presented in this PPT design is completely editable. Download it and make adjustments in color, background, font etc. as per your unique business setting.
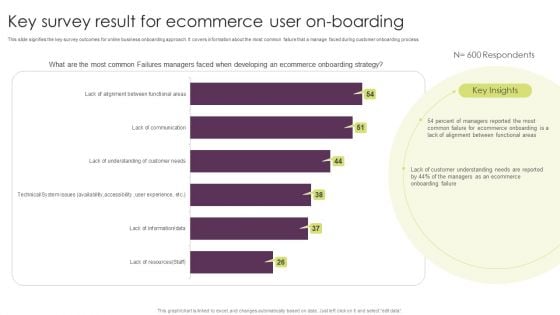
Key Survey Result For Ecommerce User On Boarding Professional PDF
This slide signifies the key survey outcomes for online business onboarding approach. It covers information about the most common failure that a manage faced during customer onboarding process. Showcasing this set of slides titled Key Survey Result For Ecommerce User On-Boarding Professional PDF. The topics addressed in these templates are Key Survey Result Ecommerce, User On-Boarding. All the content presented in this PPT design is completely editable. Download it and make adjustments in color, background, font etc. as per your unique business setting.
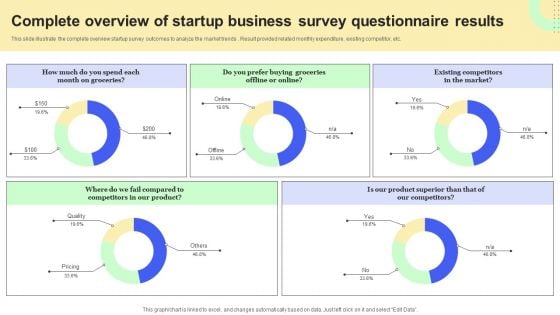
Complete Overview Of Startup Business Survey Questionnaire Results Survey SS
This slide illustrate the complete overview startup survey outcomes to analyze the market trends . Result provided related monthly expenditure, existing competitor, etc. Showcasing this set of slides titled Complete Overview Of Startup Business Survey Questionnaire Results Survey SS. The topics addressed in these templates are Month On Groceries, Groceries Offline Or Online, Existing Competitors Market. All the content presented in this PPT design is completely editable. Download it and make adjustments in color, background, font etc. as per your unique business setting.
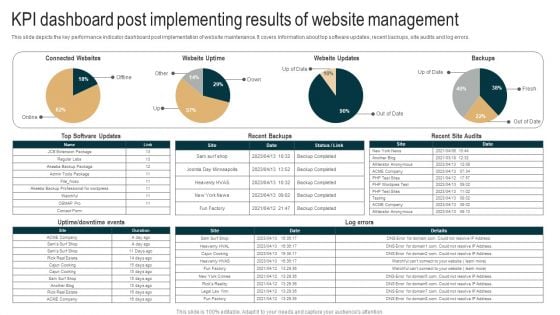
KPI Dashboard Post Implementing Results Of Website Management Themes PDF
This slide depicts the key performance indicator dashboard post implementation of website maintenance. It covers information about top software updates, recent backups, site audits and log errors. Showcasing this set of slides titled KPI Dashboard Post Implementing Results Of Website Management Themes PDF. The topics addressed in these templates are Website Updates, Website Uptime, Connected Websites. All the content presented in this PPT design is completely editable. Download it and make adjustments in color, background, font etc. as per your unique business setting.
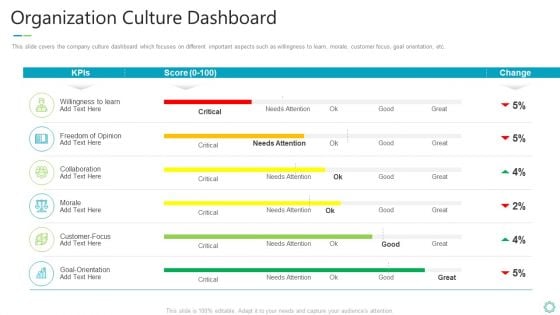
Transforming Organizational Processes And Outcomes Organization Culture Dashboard Designs PDF
This slide covers the company culture dashboard which focuses on different important aspects such as willingness to learn, morale, customer focus, goal orientation, etc. Deliver and pitch your topic in the best possible manner with this transforming organizational processes and outcomes organization culture dashboard designs pdf. Use them to share invaluable insights on organization culture dashboard and impress your audience. This template can be altered and modified as per your expectations. So, grab it now.
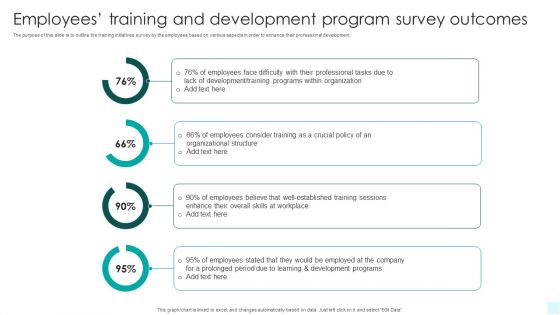
Employees Training And Development Program Survey Outcomes Infographics PDF
The purpose of this slide is to outline the training initiatives survey by the employees based on various aspects in order to enhance their professional development. Showcasing this set of slides titled Employees Training And Development Program Survey Outcomes Infographics PDF. The topics addressed in these templates are Organizational Structure, Development, Employees. All the content presented in this PPT design is completely editable. Download it and make adjustments in color, background, font etc. as per your unique business setting.
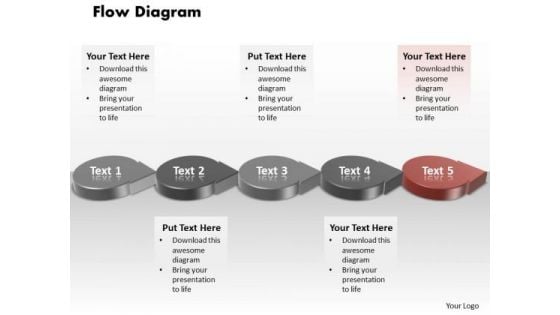
Ppt Red Circular Arrow Process Flow Network Diagram PowerPoint Template Templates
PPT red circular arrow process flow network diagram powerpoint template Templates-Use this Circular Arrow diagram to show activities that are related to the business plan metrics and monitor the results to determine if the business plan is proceeding as planned.-PPT red circular arrow process flow network diagram powerpoint template Templates-3d, arrow, background, blue, chart, clipart, colorful, connection, continuity, cycle, cyclic, diagram, direction, flow, graph, icon, illustration, isolated, loop, motion, process, progress, step, sticker, symbol, teamwork, template, turn, vector Call on the expertise of our Ppt Red Circular Arrow Process Flow Network Diagram PowerPoint Template Templates team. Experience excellence in their every design.

So Close To Win Sports PowerPoint Themes And PowerPoint Slides 0211
Microsoft PowerPoint Theme and Slide with a golf ball by the cup Our So Close To Win Sports PowerPoint Themes And PowerPoint Slides 0211 are designed by an avant-garde team. They are always abreast of the state of the art.
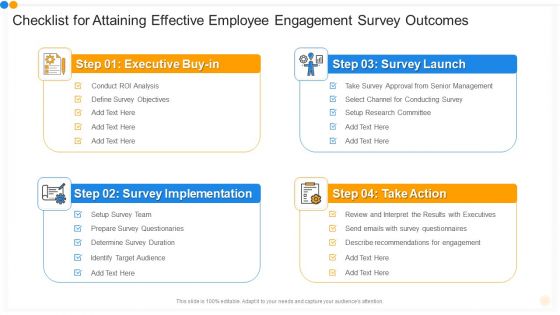
Checklist For Attaining Effective Employee Engagement Survey Outcomes Guidelines PDF
Persuade your audience using this checklist for attaining effective employee engagement survey outcomes guidelines pdf. This PPT design covers four stages, thus making it a great tool to use. It also caters to a variety of topics including executive buy in, survey implementation, take action, survey launch. Download this PPT design now to present a convincing pitch that not only emphasizes the topic but also showcases your presentation skills.
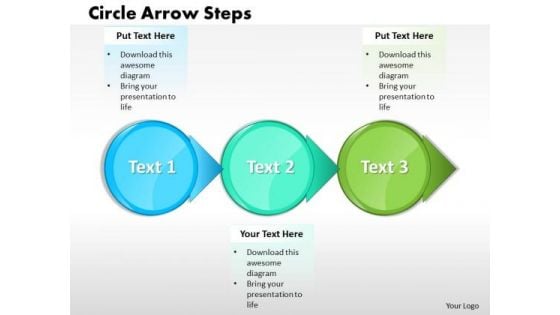
Ppt Three Circle Text Arrow Process Create PowerPoint Macro Templates
PPT three circle text arrow process create powerpoint macro Templates-Use this Circular diagram to show activities that are related to the business plan metrics and monitor the results to determine if the business plan is proceeding as planned.-PPT three circle text arrow process create powerpoint macro Templates-3d, Advertisement, Advertising, Arrow, Border, Business, Circles, Collection, Customer, Design, Element, Icon, Idea, Illustration, Info, Information, Isolated, Label, Light, Location, Needle, New, Notification, Notify, Point, Pointer, Promotion, Role, Rounded Half the effort for double the rewards. Our Ppt Three Circle Text Arrow Process Create PowerPoint Macro Templates deliver exponential returns.
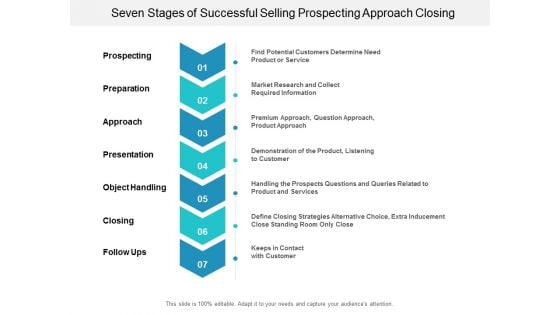
Seven Stages Of Successful Selling Prospecting Approach Closing Ppt Powerpoint Presentation Slides Ideas
This is a seven stages of successful selling prospecting approach closing ppt powerpoint presentation slides ideas. This is a seven stage process. The stages in this process are arrow steps, arrow stages, arrow phases.
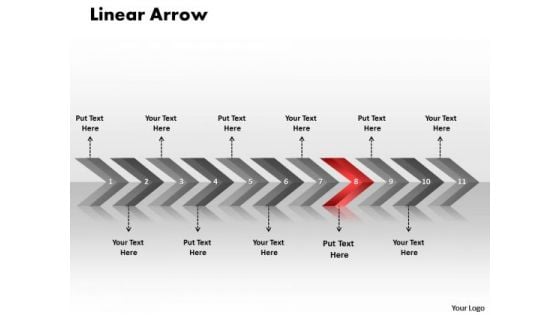
Flow Ppt Linear Arrows 11 States Diagram Project Management PowerPoint 9 Graphic
flow PPT linear arrows 11 states diagram project management powerpoint 9 Graphic-This Linear arrow template helps expound on the logic of your detailed thought process to take your company forward. Break it all down to Key Result Areas. Motivate your team to cross all barriers-flow PPT linear arrows 11 states diagram project management powerpoint 9 Graphic-Aim, Angle, Arrow, Arrowheads, Badge, Banner, Connection, Curve, Design, Direction, Download, Element, Fuchsia, Icon, Illustration, Indicator, Internet, Label, Link, Magenta, Mark, Marker, Next, Object, Orange, Orientation, Pointer, Shadow, Shape, Signs Symbol Motivate your team to excellent performances. Nurture their abilities through our Flow Ppt Linear Arrows 11 States Diagram Project Management PowerPoint 9 Graphic.
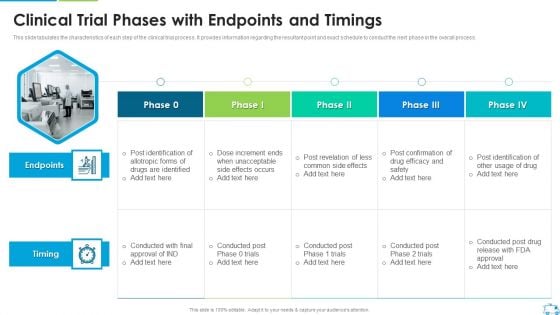
Clinical Trial Phases With Endpoints And Timings Formats PDF
This slide tabulates the characteristics of each step of the clinical trial process. It provides information regarding the resultant point and exact schedule to conduct the next phase in the overall process.Deliver and pitch your topic in the best possible manner with this Clinical Trial Phases With Endpoints And Timings Formats PDF Use them to share invaluable insights on Post Revelation, Less Common Side Effects, Dose Increment Ends and impress your audience. This template can be altered and modified as per your expectations. So, grab it now.
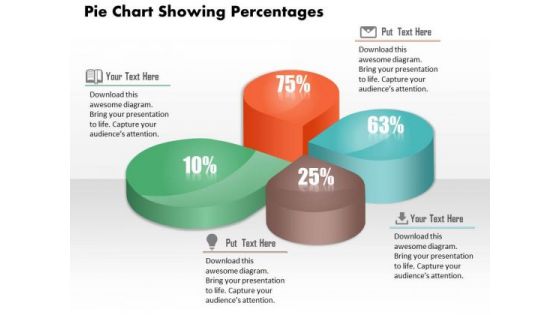
Business Diagram Pie Chart Showing Percentages Presentation Template
This image slide displays business consulting diagram of pie chart showing percentage. Pie Charts can be used to display a wide variety of information. When data is represented in the form of a pie chart the human eye finds it very easy to compare the data and quickly draw conclusions. In short they are a great visual aid and will add a touch of professionalism to any presentation which requires the display of data.

Working On Results Business PowerPoint Themes And PowerPoint Slides 0811
Microsoft PowerPoint Theme and Slide with two people working hard to maximize company results Our Working On Results Business PowerPoint Themes And PowerPoint Slides 0811 team keep their eyes open. Always digging out new designs for you.
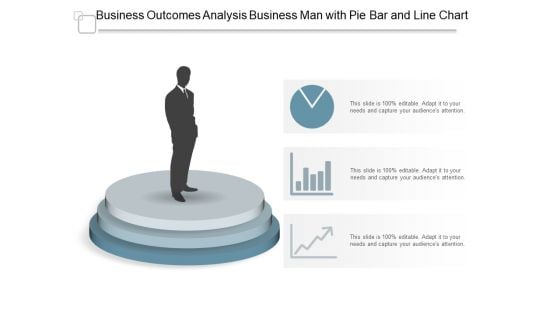
Business Outcomes Analysis Business Man With Pie Bar And Line Chart Ppt Powerpoint Presentation Infographics Visual Aids
This is a business outcomes analysis business man with pie bar and line chart ppt powerpoint presentation infographics visual aids. This is a three stage process. The stages in this process are business outcomes, business results, business output.
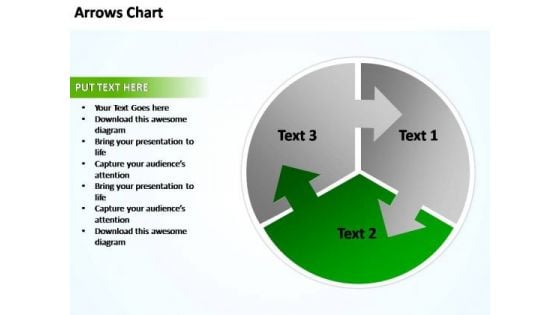
PowerPoint Templates Business Circular Plan With Arrows Chart Ppt Designs
PowerPoint Templates Business Circular Plan With Arrows Chart PPT Designs-Explore the various directions and layers existing in your in your plans and processes. Unravel the desired and essential elements of your overall strategy. Explain the relevance of the different layers and stages and directions in getting down to your core competence, ability and desired result. Exert influence with our PowerPoint Templates Business Circular Plan With Arrows Chart Ppt Designs. Get opinions going for you.
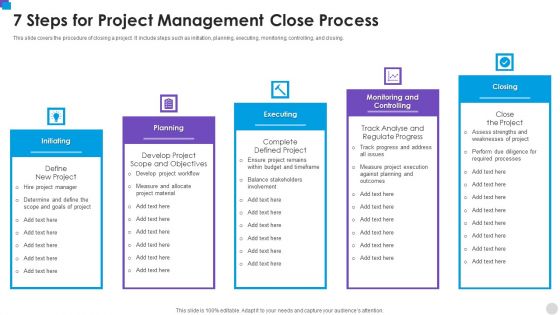
7 Steps For Project Management Close Process Microsoft PDF
This slide covers the procedure of closing a project. It include steps such as initiation, planning, executing, monitoring, controlling, and closing. Presenting 7 Steps For Project Management Close Process Microsoft PDF to dispense important information. This template comprises five stages. It also presents valuable insights into the topics including Planning, Monitoring And Controlling, Executing. This is a completely customizable PowerPoint theme that can be put to use immediately. So, download it and address the topic impactfully.
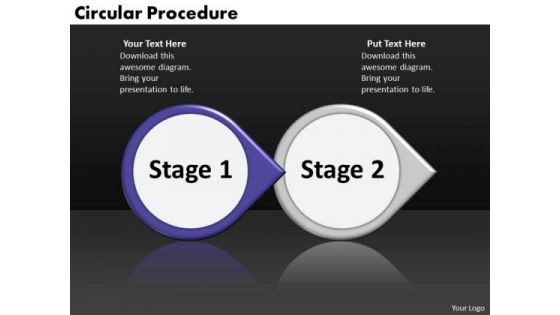
Ppt Circular Arrow Perception Of 2 Steps Involved Procedure PowerPoint Templates
PPT circular arrow perception of 2 steps involved procedure PowerPoint Templates-This PowerPoint Diagram consists of two circular text Boxes specifying two different Processes combined to result in one Mission. This Diagram will fit for Business processes like Marketing, Management etc.-PPT circular arrow perception of 2 steps involved procedure PowerPoint Templates-3d, Abstract, Advertisement, Aim, Arrow, Business, Circular, Cursor, Direction, Down, Environment, Form, Glossy, Graphic, Icon, Illustration, Information, Mark, Motion, Perspective, Point, Sale, Shadow, Shape, Shiny, Sign Examine the facts in all their combinations. Run the comb through with our Ppt Circular Arrow Perception Of 2 Steps Involved Procedure PowerPoint Templates.
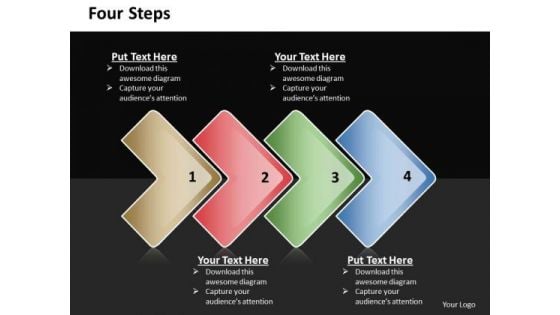
Ppt Direct Description Of 4 Steps Included Procedure PowerPoint Templates
PPT direct description of 4 steps included procedure PowerPoint Templates-Develop competitive advantage with our above template which contains a diagram of pointed arrows. It helps expound on the logic of your detailed thought process to take your company forward. Break it all down to Key Result Areas. Motivate your team to cross all barriers-PPT direct description of 4 steps included procedure PowerPoint Templates-Aim, Arrow, Arrowheads, Badge, Border, Click, Connection, Curve, Design, Direction, Download, Element, Fuchsia, Icon, Illustration, Indicator, Internet, Magenta, Mark, Object, Orientation, Pointer, Shadow, Shape, Sign Our Ppt Direct Description Of 4 Steps Included Procedure PowerPoint Templates are arguably exceptional. Your ideas will be hard to argue against.
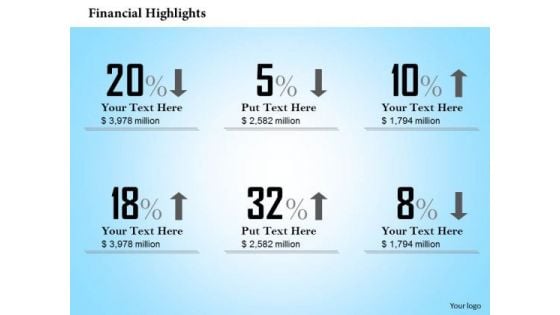
Marketing Diagram Financial Result Analysis Diagram Sales Diagram
Establish Your Dominion With Our Marketing Diagram Financial Result Analysis Diagram Sales Diagram Powerpoint Templates. Rule The Stage With Your Thoughts. Your Ideas Demand Attention. Our Marketing Diagram Financial Result Analysis Diagram Sales Diagram Powerpoint Templates Will Get It Done.
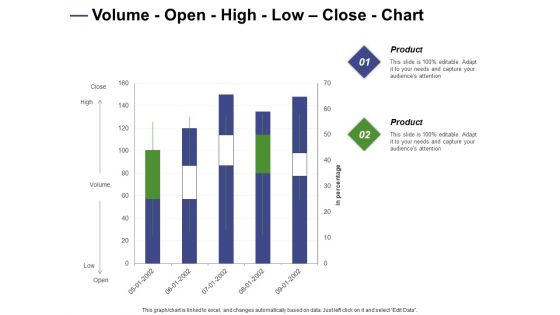
Designing Compensation Systems For Professionals Volume Open High Low Close Chart Introduction PDF
Presenting this set of slides with name designing compensation systems for professionals volume open high low close chart introduction pdf. The topics discussed in these slide is volume open high low close chart. This is a completely editable PowerPoint presentation and is available for immediate download. Download now and impress your audience.
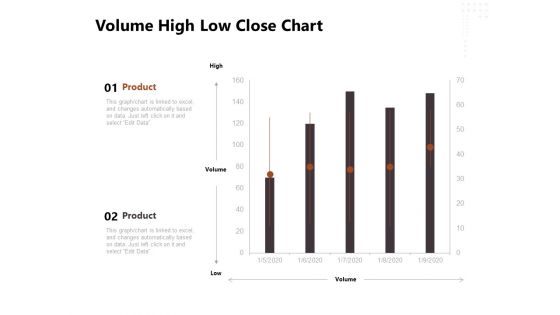
Project Management Timeline Volume High Low Close Chart Ppt Gallery Outfit PDF
Presenting this set of slides with name project management timeline volume high low close chart ppt gallery outfit pdf. The topics discussed in these slide is volume high low close chart. This is a completely editable PowerPoint presentation and is available for immediate download. Download now and impress your audience.
Herbal Medicines Science PowerPoint Presentation Slides R
Microsoft PowerPoint Slides and Backgrounds with green herbal pills over a white background Our Herbal Medicines Science PowerPoint Presentation Slides R are committed to benefit you. They ensure your thoughts get the credit.
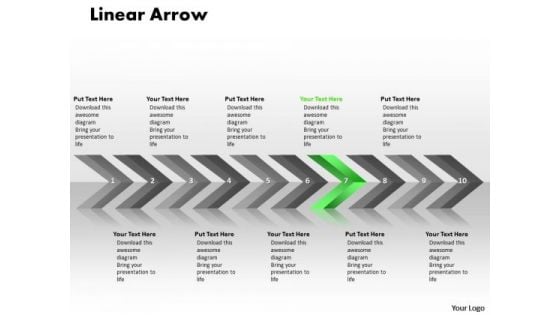
Marketing Ppt Linear Arrows 10 Stages Business Communication PowerPoint 8 Image
marketing PPT linear arrows 10 stages business communication powerpoint 8 Image-This Linear Arrow design provides a graphic tool that allows users to easily draft the strategy map and monitor performance through the same. Use this impressive template to unravel your recipe for a mouth watering result.-marketing PPT linear arrows 10 stages business communication powerpoint 8 Image-Aim, Angle, Arrow, Arrowheads, Badge, Banner, Connection, Curve, Design, Direction, Download, Element, Fuchsia, Icon, Illustration, Indicator, Internet, Label, Link, Magenta, Mark, Marker, Next, Object, Orange, Orientation, Pointer, Shadow, Shape, Signs Symbol Spice up the discourse with our Marketing Ppt Linear Arrows 10 Stages Business Communication PowerPoint 8 Image. Strengthen the flavour of your thoughts.
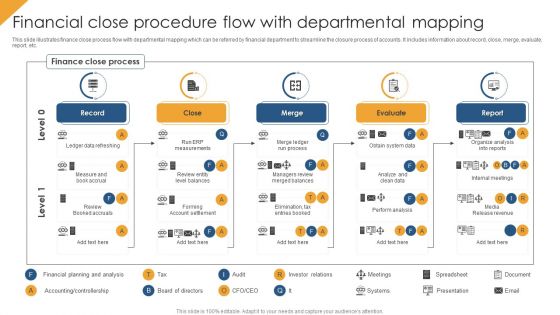
Financial Close Procedure Flow With Departmental Mapping Guidelines PDF
This slide illustrates finance close process flow with departmental mapping which can be referred by financial department to streamline the closure process of accounts. It includes information about record, close, merge, evaluate, report, etc. Presenting Financial Close Procedure Flow With Departmental Mapping Guidelines PDF to dispense important information. This template comprises five stages. It also presents valuable insights into the topics including Record, Close, Merge, Evaluate, Report. This is a completely customizable PowerPoint theme that can be put to use immediately. So, download it and address the topic impactfully.

Results Themed Street Symbol PowerPoint Themes And PowerPoint Slides 0911
Microsoft PowerPoint Theme and Slide with a street sign with a results theme Find the perfect fit with our Results Themed Street Symbol PowerPoint Themes And PowerPoint Slides 0911. Try us out and see what a difference our templates make.
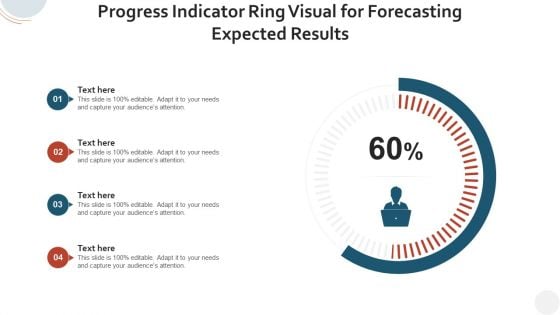
Progress Indicator Ring Visual For Forecasting Expected Results Diagrams PDF
Pitch your topic with ease and precision using this progress indicator ring visual for forecasting expected results diagrams pdf. This layout presents information on progress indicator ring visual for forecasting expected results. It is also available for immediate download and adjustment. So, changes can be made in the color, design, graphics or any other component to create a unique layout.
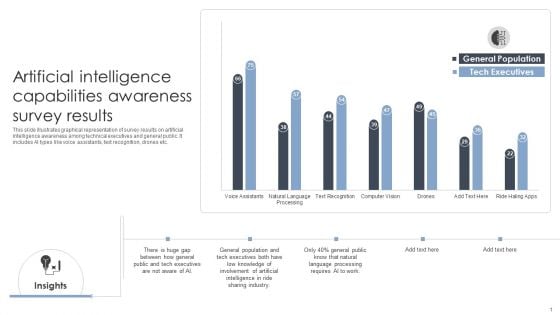
Artificial Intelligence Capabilities Awareness Survey Results Diagrams PDF
Showcasing this set of slides titled Artificial Intelligence Capabilities Awareness Survey Results Diagrams PDF. The topics addressed in these templates are Awareness, Survey, Results. All the content presented in this PPT design is completely editable. Download it and make adjustments in color, background, font etc. as per your unique business setting.
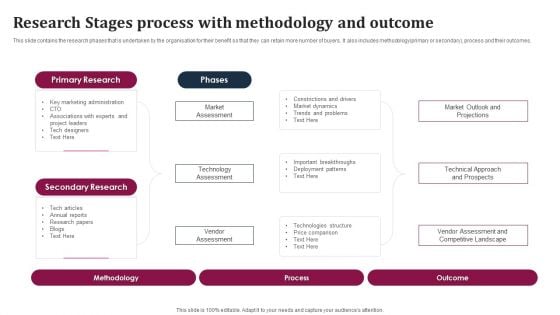
Research Stages Process With Methodology And Outcome Ideas PDF
This slide contains the research phases that is undertaken by the organisation for their benefit so that they can retain more number of buyers. It also includes methodology primary or secondary, process and their outcomes. Pitch your topic with ease and precision using this Research Stages Process With Methodology And Outcome Ideas PDF. This layout presents information on Primary Research, Secondary Research, Marketing Administration. It is also available for immediate download and adjustment. So, changes can be made in the color, design, graphics or any other component to create a unique layout.
Improving Brand Recognition To Boost Brand Awareness Activities Tracking Dashboard Themes PDF
This slide provides information regarding brand activities tracking dashboard in terms of site traffic, attention, search, brand mentions, inbound traffic, etc. Create an editable Improving Brand Recognition To Boost Brand Awareness Activities Tracking Dashboard Themes PDF that communicates your idea and engages your audience. Whether youre presenting a business or an educational presentation, pre-designed presentation templates help save time. Improving Brand Recognition To Boost Brand Awareness Activities Tracking Dashboard Themes PDF is highly customizable and very easy to edit, covering many different styles from creative to business presentations. Slidegeeks has creative team members who have crafted amazing templates. So, go and get them without any delay.
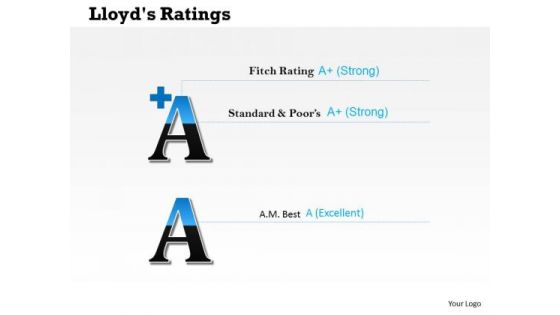
Business Cycle Diagram Financial Result Ratings Diagram Strategy Diagram
Document Your Views On Our Business Cycle Diagram Financial Result Ratings Diagram Strategy Diagram Powerpoint Templates. They Will Create A Strong Impression. Plan Your Documentary Shot By Shot. Break Them Down On Our Business Cycle Diagram Financial Result Ratings Diagram Strategy Diagram Powerpoint Templates.
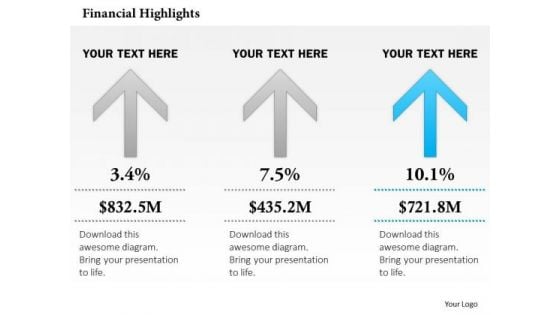
Marketing Diagram Three Financial Result Arrows Diagram Sales Diagram
Your Listeners Will Never Doodle. Our Marketing Diagram Three Financial Result Arrows Diagram Sales Diagram Powerpoint Templates Will Hold Their Concentration. Do The One Thing With Your Thoughts. Uphold Custom With Our Marketing Diagram Three Financial Result Arrows Diagram Sales Diagram Powerpoint Templates.
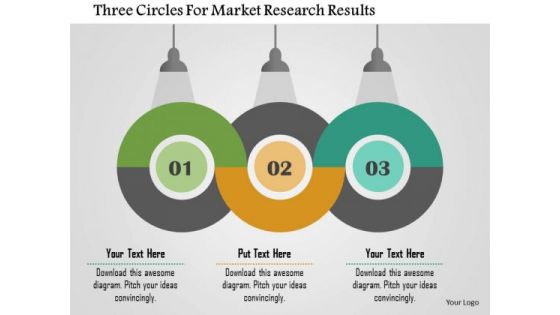
Business Diagram Three Circles For Market Research Results Presentation Template
Our above slide displays three circles representing market research results. Download our above diagram to express information in a visual way. This diagram offers a way for your audience to visually conceptualize the process.
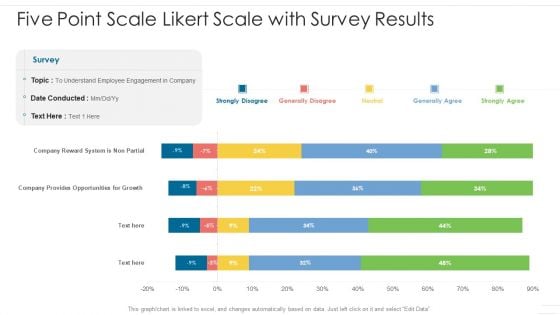
Five Point Scale Likert Scale With Survey Results Diagrams PDF
Pitch your topic with ease and precision using this five point scale likert scale with survey results diagrams pdf. This layout presents information on service, customer, survey. It is also available for immediate download and adjustment. So, changes can be made in the color, design, graphics or any other component to create a unique layout.
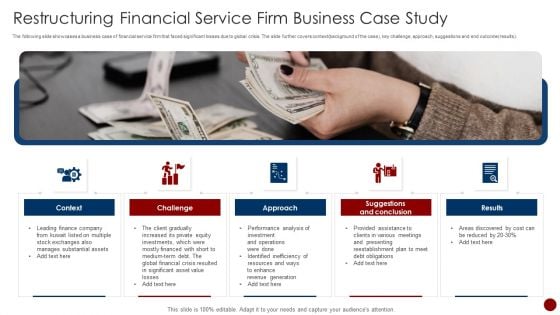
Restructuring Financial Service Firm Business Case Study Professional PDF
The following slide showcases a business case of financial service firm that faced significant losses due to global crisis. The slide further covers context background of the case, key challenge, approach, suggestions and end outcome results. Presenting Restructuring Financial Service Firm Business Case Study Professional PDF to dispense important information. This template comprises five stages. It also presents valuable insights into the topics including Approach, Context, Suggestions And Conclusion. This is a completely customizable PowerPoint theme that can be put to use immediately. So, download it and address the topic impactfully.

Construction Project Management Checklist For Closing Decision Sample PDF
The following slide showcases a checklist to be reviewed while making construction project closing decision. It comprises of some questions and their status yes no. Presenting Construction Project Management Checklist For Closing Decision Sample PDF to dispense important information. This template comprises one stages. It also presents valuable insights into the topics including Final Inspection Done, Completion Certificate Received, Final Budget Report Created. This is a completely customizable PowerPoint theme that can be put to use immediately. So, download it and address the topic impactfully.
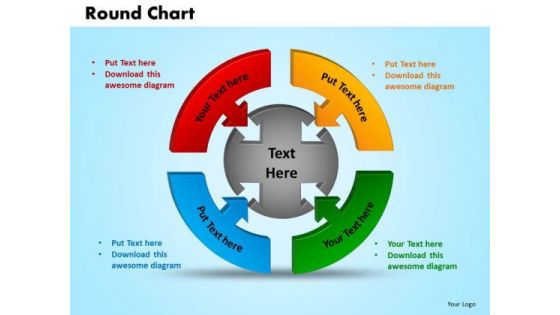
PowerPoint Presentation Round Chart Sales Ppt Themes
PowerPoint Presentation Round Chart Sales PPT Themes-This PowerPoint Diagram represents the Round Sales Chart in which four different approaches which results in one common Outcome. It Imitates the concept of Teamwork as they are inter-related to each other.-PowerPoint Presentation Round Chart Sales PPT Themes Tick through all the factors involved. Check it down with our PowerPoint Presentation Round Chart Sales Ppt Themes.
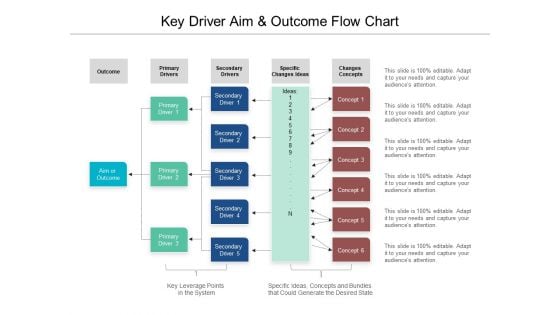
Key Driver Aim And Outcome Flow Chart Ppt PowerPoint Presentation Ideas Skills
Presenting this set of slides with name key driver aim and outcome flow chart ppt powerpoint presentation ideas skills. This is a five stage process. The stages in this process are driver diagram, engagement driver, retention driver. This is a completely editable PowerPoint presentation and is available for immediate download. Download now and impress your audience.
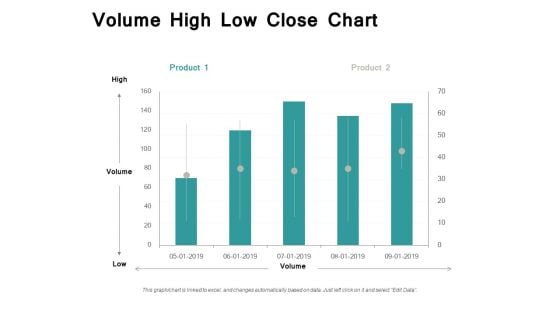
Volume High Low Close Chart Ppt PowerPoint Presentation Infographic Template Example File
Presenting this set of slides with name volume high low close chart ppt powerpoint presentation infographic template example file. The topics discussed in these slides are finance, marketing, management, investment, analysis. This is a completely editable PowerPoint presentation and is available for immediate download. Download now and impress your audience.

Agile Project Playbook Presentation Key Phases In Agile Product Development Lifecycle Elements PDF
This slide provides information regarding various phases associated to agile product development in terms of envision, speculate, explore, adapt and close. Deliver and pitch your topic in the best possible manner with this agile project playbook presentation key phases in agile product development lifecycle elements pdf. Use them to share invaluable insights on adapt, release plan, explore, close, speculate and impress your audience. This template can be altered and modified as per your expectations. So, grab it now.
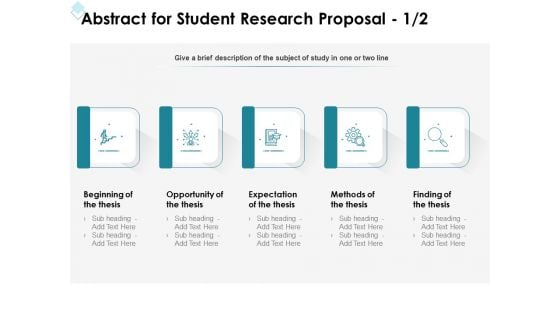
Academic Investigation Abstract For Student Research Proposal Thesis Ppt Portfolio Themes PDF
Presenting this set of slides with name academic investigation abstract for student research proposal thesis ppt portfolio themes pdf. This is a three stage process. The stages in this process are scope, result, conclusion. This is a completely editable PowerPoint presentation and is available for immediate download. Download now and impress your audience.
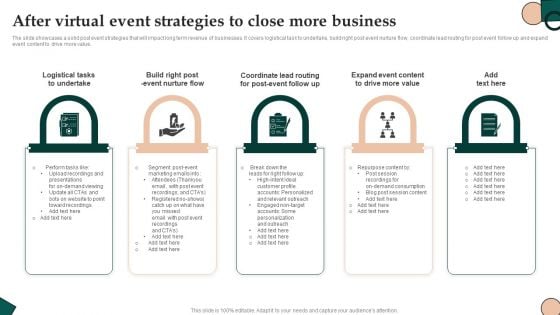
After Virtual Event Strategies To Close More Business Introduction PDF
The slide showcases a solid post event strategies that will impact long term revenue of businesses. It covers logistical task to undertake, build right post event nurture flow, coordinate lead routing for post event follow up and expand event content to drive more value. Presenting After Virtual Event Strategies To Close More Business Introduction PDF to dispense important information. This template comprises four stages. It also presents valuable insights into the topics including Logistical Tasks To Undertake, Expand Event Content, Drive More Value. This is a completely customizable PowerPoint theme that can be put to use immediately. So, download it and address the topic impactfully.

Firm Marketing Dashboard Report With Closed Sales Ppt Slides Graphics Example PDF
This graph or chart is linked to excel, and changes automatically based on data. Just left click on it and select Edit Data. Showcasing this set of slides titled Firm Marketing Dashboard Report With Closed Sales Ppt Slides Graphics Example PDF. The topics addressed in these templates are Days On Market, Homes For Sale, Median Sales Price, Closed Sales. All the content presented in this PPT design is completely editable. Download it and make adjustments in color, background, font etc. as per your unique business setting.

Newborn Baby PowerPoint Themes And PowerPoint Slides 0711
Microsoft PowerPoint Theme and Slide with newborn baby sleeping on its stomach lying in a white hammock made out of cotton cloth Bring matters to a successful conclusion. Our Newborn Baby PowerPoint Themes And PowerPoint Slides 0711 provide a grand finale.
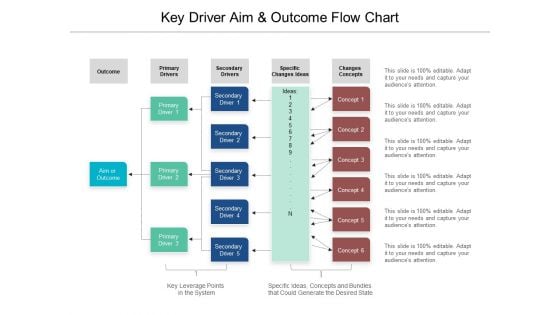
Key Driver Aim And Outcome Flow Chart Ppt PowerPoint Presentation Gallery Format
Presenting this set of slides with name key driver aim and outcome flow chart ppt powerpoint presentation gallery format. This is a five stage process. The stages in this process are driver diagram, change management, improve customer. This is a completely editable PowerPoint presentation and is available for immediate download. Download now and impress your audience.

 Home
Home