Three Blocks
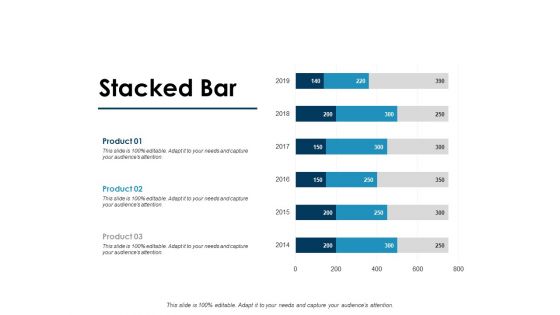
Stacked Bar Graph Ppt PowerPoint Presentation Portfolio Slide Portrait
This is a stacked bar graph ppt powerpoint presentation portfolio slide portrait. This is a three stage process. The stages in this process are finance, marketing, management, investment, analysis.
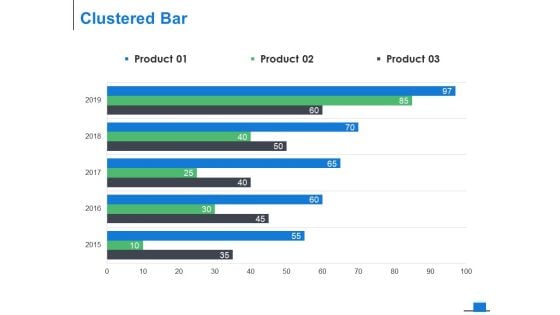
Clustered Bar Graph Ppt PowerPoint Presentation Model Background Designs
This is a clustered bar graph ppt powerpoint presentation model background designs. This is a three stage process. The stages in this process are finance, marketing, management, investment, analysis.
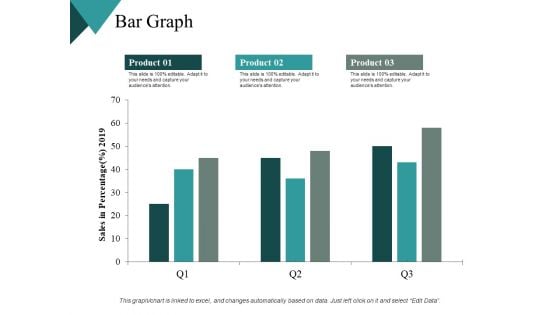
Bar Graph Finance Ppt PowerPoint Presentation Outline Background Designs
This is a bar graph finance ppt powerpoint presentation outline background designs. This is a three stage process. The stages in this process are financial, maximum, medium, minimum, marketing.

Bar Chart Finance Marketing Ppt PowerPoint Presentation File Good
This is a bar chart finance marketing ppt powerpoint presentation file good. This is a three stage process. The stages in this process are finance, marketing, management, investment, analysis.
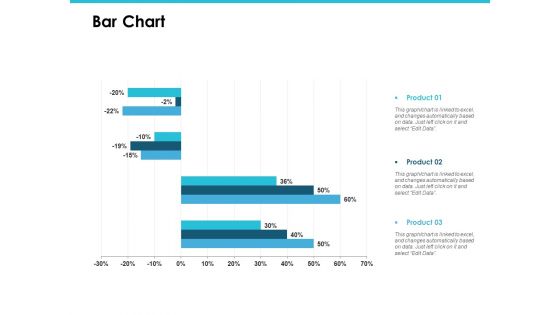
Bar Chart Management Investment Ppt PowerPoint Presentation File Rules
This is a bar chart management investment ppt powerpoint presentation file rules. This is a three stage process. The stages in this process are finance, marketing, management, investment, analysis.
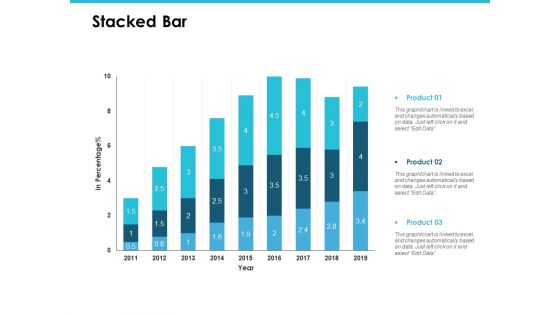
Stacked Bar Finance Marketing Ppt PowerPoint Presentation Portfolio Graphics Pictures
This is a stacked bar finance marketing ppt powerpoint presentation portfolio graphics pictures. This is a three stage process. The stages in this process are finance, marketing, management, investment, analysis.
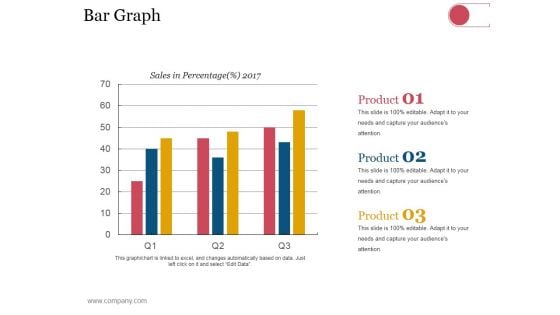
Bar Graph Ppt PowerPoint Presentation Visual Aids Model
This is a bar graph ppt powerpoint presentation visual aids model. This is a three stage process. The stages in this process are business, strategy, analysis, planning, sales in percentage.

Puzzle Pieces For Business Alliance Ppt PowerPoint Presentation Infographic Template Format Ideas
This is a puzzle pieces for business alliance ppt powerpoint presentation infographic template format ideas. This is a three stage process. The stages in this process are handshake, relationship, partnership.
Creative Solution Icon Man Fixing Puzzle Pieces Ppt PowerPoint Presentation Icon Templates
This is a creative solution icon man fixing puzzle pieces ppt powerpoint presentation icon templates. This is a three stage process. The stages in this process are problem solving icon, puzzle, planning.
Puzzle Pieces With Keys Vector Icon Ppt PowerPoint Presentation Inspiration Styles
This is a puzzle pieces with keys vector icon ppt powerpoint presentation inspiration styles. This is a three stage process. The stages in this process are problem solving icon, puzzle, planning.
Solution Icon Human Mind With Puzzle Pieces Ppt PowerPoint Presentation Portfolio Skills
This is a solution icon human mind with puzzle pieces ppt powerpoint presentation portfolio skills. This is a three stage process. The stages in this process are problem solving icon, puzzle, planning.
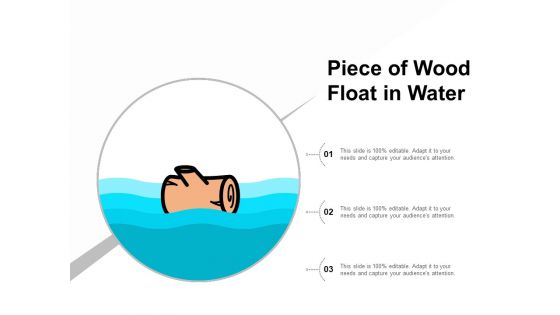
Piece Of Wood Float In Water Ppt PowerPoint Presentation Slides Ideas
This is a piece of wood float in water ppt powerpoint presentation slides ideas. This is a three stage process. The stages in this process are flood, drowning, submerge.
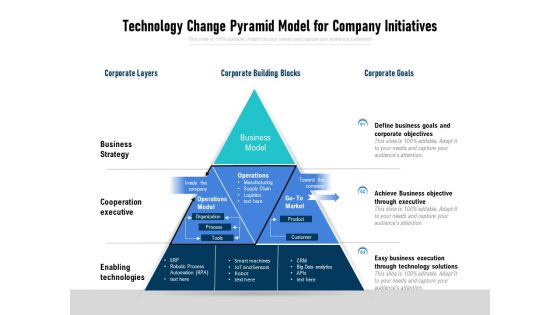
Technology Change Pyramid Model For Company Initiatives Ppt PowerPoint Presentation Model Images PDF
Persuade your audience using this technology change pyramid model for company initiatives ppt powerpoint presentation model images pdf. This PPT design covers three stages, thus making it a great tool to use. It also caters to a variety of topics including corporate layers, corporate building blocks, corporate goals, business strategy, cooperation executive, enabling technologies, define business goals and corporate objectives, achieve business objective through executive, easy business execution through technology solutions. Download this PPT design now to present a convincing pitch that not only emphasizes the topic but also showcases your presentation skills.
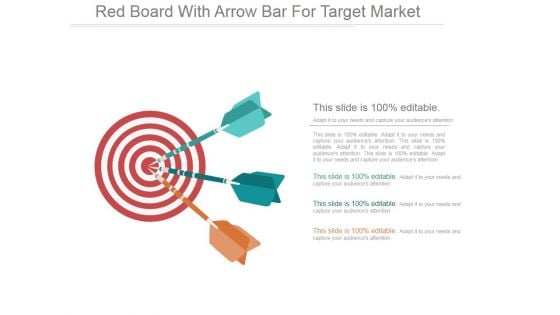
Red Board With Arrow Bar For Target Market Ppt PowerPoint Presentation Clipart
This is a red board with arrow bar for target market ppt powerpoint presentation clipart. This is a three stage process. The stages in this process are our goals, arrows, marketing, strategy, business, success.
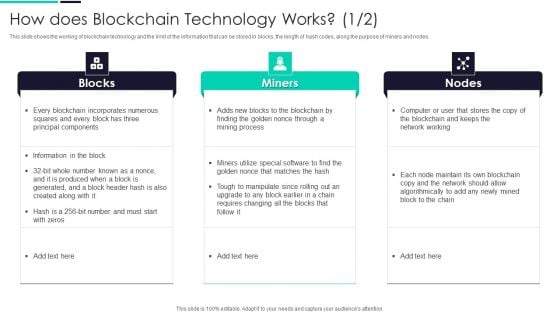
Blockchain And DLT Framework How Does Blockchain Technology Works Summary PDF
This slide shows the working of blockchain technology and the limit of the information that can be stored in blocks, the length of hash codes, along the purpose of miners and nodes. This is a Blockchain And DLT Framework How Does Blockchain Technology Works Summary PDF template with various stages. Focus and dispense information on three stages using this creative set, that comes with editable features. It contains large content boxes to add your information on topics like Blockchain Incorporates, Chain Requires, Network Working. You can also showcase facts, figures, and other relevant content using this PPT layout. Grab it now.
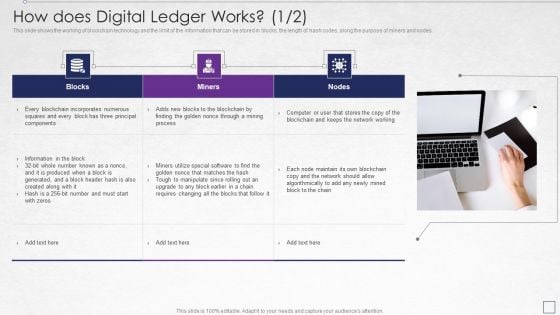
Digitized Record Book Technology How Does Digital Ledger Works Brochure PDF
This slide shows the working of blockchain technology and the limit of the information that can be stored in blocks, the length of hash codes, along the purpose of miners and nodes. This is a digitized record book technology how does digital ledger works brochure pdf template with various stages. Focus and dispense information on three stages using this creative set, that comes with editable features. It contains large content boxes to add your information on topics like network, requires, information, produced. You can also showcase facts, figures, and other relevant content using this PPT layout. Grab it now.
Green Arrows On Bars Vector Icon Ppt PowerPoint Presentation Infographic Template Templates Cpb
This is a green arrows on bars vector icon ppt powerpoint presentation infographic template templates cpb. This is a three stage process. The stages in this process are bar chart icon, bar graph icon, data chart icon.
Growing Arrow On Bar Graph Vector Icon Ppt PowerPoint Presentation Designs Cpb
This is a growing arrow on bar graph vector icon ppt powerpoint presentation designs cpb . This is a three stage process. The stages in this process are bar chart icon, bar graph icon, data chart icon.
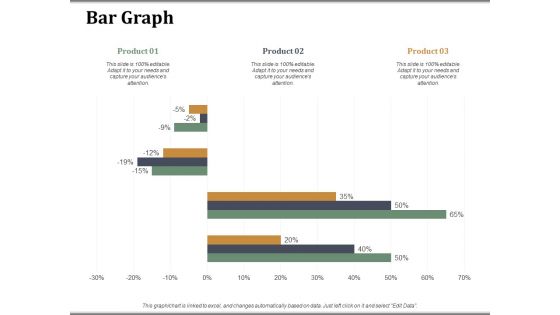
Bar Graph Companys Business Model Canvas Ppt PowerPoint Presentation Visual Aids Model
This is a bar graph companys business model canvas ppt powerpoint presentation visual aids model. This is a three stage process. The stages in this process are bar graph, finance, marketing, strategy, analysis, business.
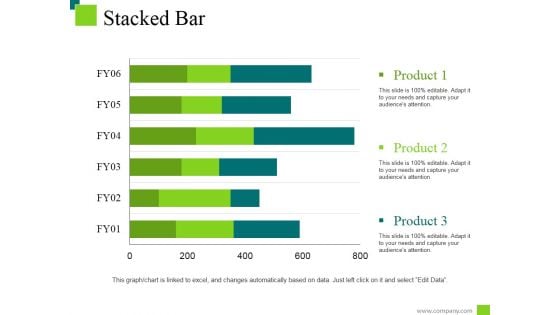
Stacked Bar Template 2 Ppt PowerPoint Presentation Infographic Template File Formats
This is a stacked bar template 2 ppt powerpoint presentation infographic template file formats. This is a three stage process. The stages in this process are product, business, marketing, management.
Growth Arrow On Bar Graph Icon Ppt Powerpoint Presentation Infographic Template Clipart
This is a growth arrow on bar graph icon ppt powerpoint presentation infographic template clipart. This is a three stage process. The stages in this process are financial statements icon, accounting ratio icon, balance sheet icon.

Bar Chart With Magnifying Glass For Financial Analysis Ppt Powerpoint Presentation Infographics Designs Download
This is a bar chart with magnifying glass for financial analysis ppt powerpoint presentation infographics designs download. This is a three stage process. The stages in this process are business metrics, business kpi, business dashboard.
Business Outcomes Vector Icons Showing Pie And Bar Graph Ppt Powerpoint Presentation File Graphic Images
This is a business outcomes vector icons showing pie and bar graph ppt powerpoint presentation file graphic images. This is a three stage process. The stages in this process are business outcomes, business results, business output.
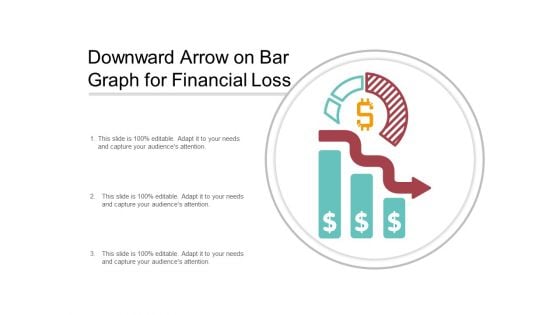
Downward Arrow On Bar Graph For Financial Loss Ppt PowerPoint Presentation Infographics Sample
This is a downward arrow on bar graph for financial loss ppt powerpoint presentation infographics sample. This is a three stage process. The stages in this process are business failure, unsuccessful business, business non success.
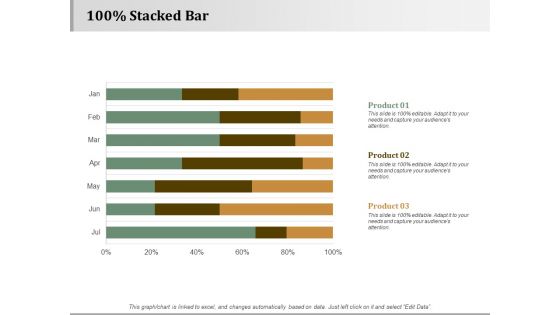
100 Percent Stacked Bar Strategy Approaches Ppt PowerPoint Presentation Gallery Visual Aids
This is a 100 percent stacked bar strategy approaches ppt powerpoint presentation gallery visual aids. This is a three stage process. The stages in this process are business, management, strategy, analysis, marketing.
Demonstration Icon Man Showing Bar Chart Ppt Powerpoint Presentation Styles Ideas
This is a demonstration icon man showing bar chart ppt powerpoint presentation styles ideas. This is a three stage process. The stages in this process are illustration, show, demo.
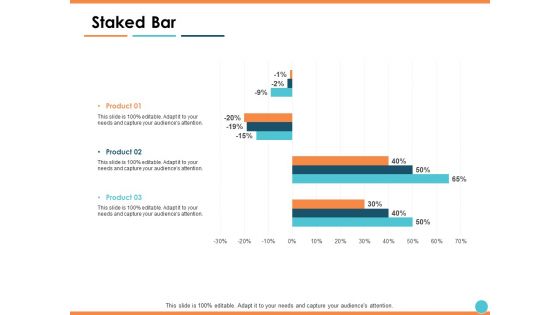
Staked Bar Planning Business Ppt PowerPoint Presentation Infographic Template Infographic Template
This is a staked bar planning business ppt powerpoint presentation infographic template infographic template. This is a three stage process. The stages in this process are finance, marketing, analysis, business, investment.
Bar Graph Icon Showing Operating Rhythm Ppt Powerpoint Presentation Ideas Templates
This is a bar graph icon showing operating rhythm ppt powerpoint presentation ideas templates. This is a three stage process. The stages in this process are six sigma, operating rhythm, business rhythm.
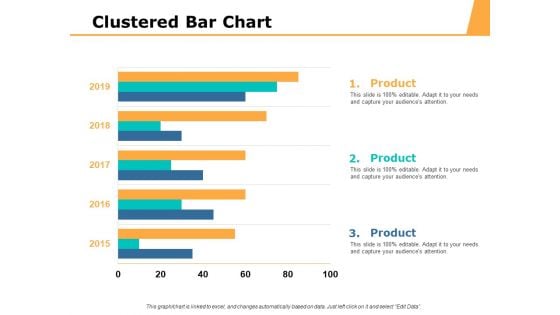
Clustered Bar Chart Percentage Product Ppt PowerPoint Presentation Portfolio Example Introduction
This is a clustered bar chart percentage product ppt powerpoint presentation portfolio example introduction. This is a three stage process. The stages in this process are area chart, finance, marketing, management, investment.
Growth Arrow On Bar Graph Vector Ppt Powerpoint Presentation Layouts Master Slide
This is a growth arrow on bar graph vector ppt powerpoint presentation layouts master slide. This is a three stage process. The stages in this process are increasing arrows, improving arrows, growing arrows.
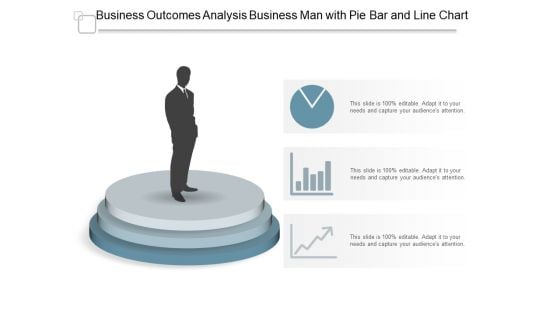
Business Outcomes Analysis Business Man With Pie Bar And Line Chart Ppt Powerpoint Presentation Infographics Visual Aids
This is a business outcomes analysis business man with pie bar and line chart ppt powerpoint presentation infographics visual aids. This is a three stage process. The stages in this process are business outcomes, business results, business output.
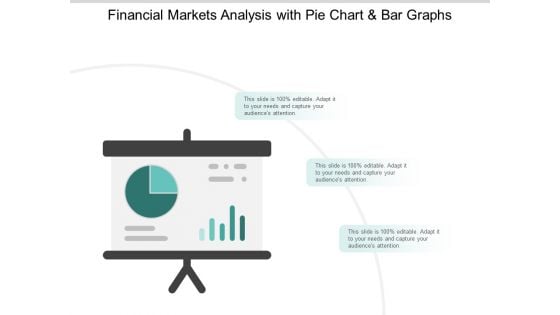
Stock Market Survey Reporting With Pie Chat And Bar Graph Ppt PowerPoint Presentation Infographic Template Example 2015
This is a stock market survey reporting with pie chat and bar graph ppt powerpoint presentation infographic template example 2015. This is a three stage process. The stages in this process are stock market, financial markets, bull market.

Man Standing With Stack Of Us Currency Notes Bundles Ppt Powerpoint Presentation File Slides
This is a man standing with stack of us currency notes bundles ppt powerpoint presentation file slides. This is a three stage process. The stages in this process are stacked bar, pile bar, heap bar.
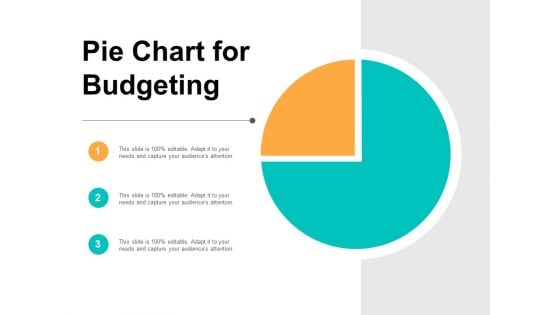
Pie Chart For Budgeting Ppt PowerPoint Presentation Pictures Vector
This is a pie chart for budgeting ppt powerpoint presentation pictures vector. This is a three stage process. The stages in this process are sectioned circle, segmented circle, partitioned circle.
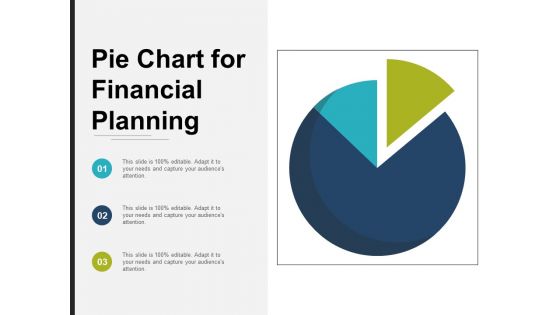
Pie Chart For Financial Planning Ppt PowerPoint Presentation Professional Aids
This is a pie chart for financial planning ppt powerpoint presentation professional aids. This is a three stage process. The stages in this process are sectioned circle, segmented circle, partitioned circle.
Financial Graph Economic Growth Vector Icon Ppt PowerPoint Presentation Infographics Graphic Images Cpb
This is a financial graph economic growth vector icon ppt powerpoint presentation infographics graphic images cpb. This is a three stage process. The stages in this process are bar chart icon, bar graph icon, data chart icon.
Histogram Column Chart With Red Arrow Vector Icon Ppt PowerPoint Presentation Outline Ideas Cpb
This is a histogram column chart with red arrow vector icon ppt powerpoint presentation outline ideas cpb. This is a three stage process. The stages in this process are bar chart icon, bar graph icon, data chart icon.
Histogram Financial Analysis Vector Icon Ppt PowerPoint Presentation Layouts File Formats Cpb
This is a histogram financial analysis vector icon ppt powerpoint presentation layouts file formats cpb. This is a three stage process. The stages in this process are bar chart icon, bar graph icon, data chart icon.
Histogram Icon Showing Economic Fluctuations Ppt PowerPoint Presentation Slides Samples Cpb
This is a histogram icon showing economic fluctuations ppt powerpoint presentation slides samples cpb. This is a three stage process. The stages in this process are bar chart icon, bar graph icon, data chart icon.
Histogram Showing Business Trends Vector Icon Ppt PowerPoint Presentation Styles Portrait Cpb
This is a histogram showing business trends vector icon ppt powerpoint presentation styles portrait cpb. This is a three stage process. The stages in this process are bar chart icon, bar graph icon, data chart icon.
Histogram With Dollar For Financial Success Vector Icon Ppt PowerPoint Presentation Portfolio Example File Cpb
This is a histogram with dollar for financial success vector icon ppt powerpoint presentation portfolio example file cpb. This is a three stage process. The stages in this process are bar chart icon, bar graph icon, data chart icon.
Histogram With Gear Vector Icon Ppt PowerPoint Presentation Professional Slides Cpb
This is a histogram with gear vector icon ppt powerpoint presentation professional slides cpb. This is a three stage process. The stages in this process are bar chart icon, bar graph icon, data chart icon.
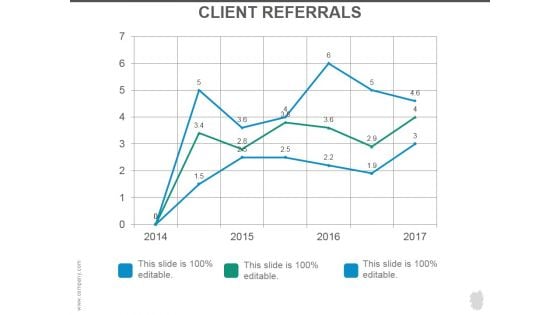
Client Referrals Ppt PowerPoint Presentation Example 2015
This is a client referrals ppt powerpoint presentation example 2015. This is a three stage process. The stages in this process are business, marketing, management, bar graph, line bar.
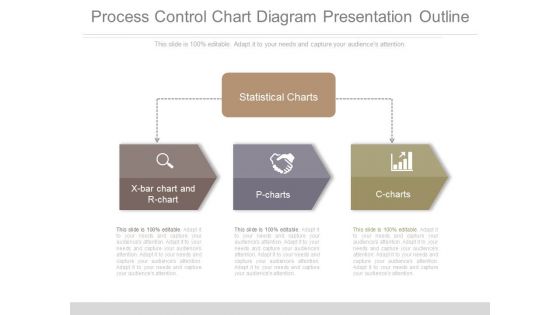
Process Control Chart Diagram Presentation Outline
This is a process control chart diagram presentation outline. This is a three stage process. The stages in this process are statistical charts, x bar chart and r chart, p charts, c charts.
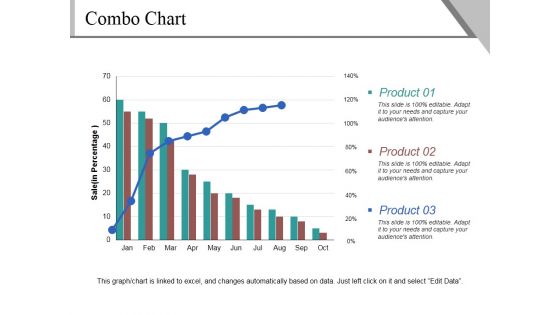
Combo Chart Ppt PowerPoint Presentation Ideas Visual Aids
This is a combo chart ppt powerpoint presentation ideas visual aids. This is a three stage process. The stages in this process are product, sales, bar graph, business, marketing.

Clustered Column Line Ppt PowerPoint Presentation Slide
This is a clustered column line ppt powerpoint presentation slide. This is a three stage process. The stages in this process are bar graph, growth, finance, product, sales in percentage.
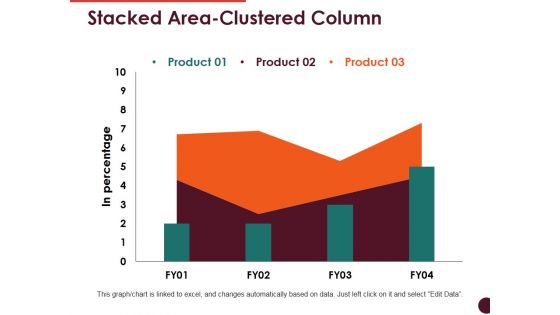
Stacked Area Clustered Column Ppt PowerPoint Presentation Summary Professional
This is a stacked area clustered column ppt powerpoint presentation summary professional. This is a three stage process. The stages in this process are product, bar graph, growth, success, in percentage.
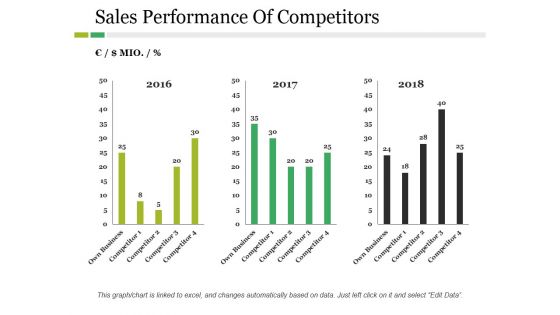
Sales Performance Of Competitors Ppt PowerPoint Presentation Inspiration Example
This is a sales performance of competitors ppt powerpoint presentation inspiration example. This is a three stage process. The stages in this process are business, marketing, year, bar graph, finance.
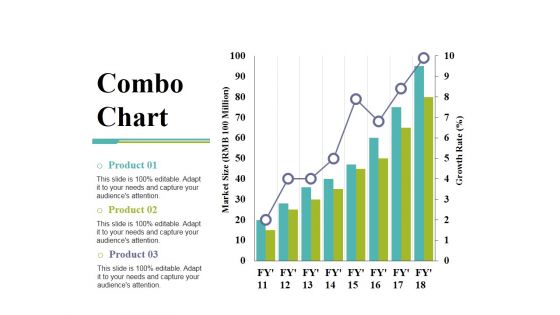
Combo Chart Ppt PowerPoint Presentation Show Deck
This is a combo chart ppt powerpoint presentation show deck. This is a three stage process. The stages in this process are growth rate, market size, product, bar graph, growth.
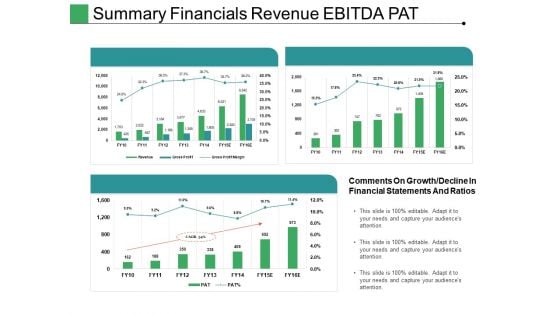
Summary Financials Revenue Ebitda Pat Ppt PowerPoint Presentation Ideas Tips
This is a summary financials revenue ebitda pat ppt powerpoint presentation ideas tips. This is a three stage process. The stages in this process are comments on growth, bar graph, growth, success, business.
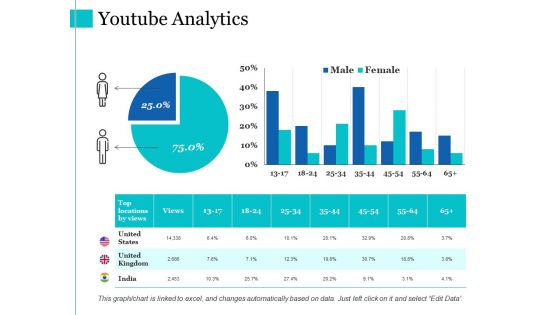
Youtube Analytics Ppt PowerPoint Presentation Layouts Graphic Images
This is a youtube analytics ppt powerpoint presentation layouts graphic images. This is a three stage process. The stages in this process are youtube analytics, finance, percentage, bar graph.
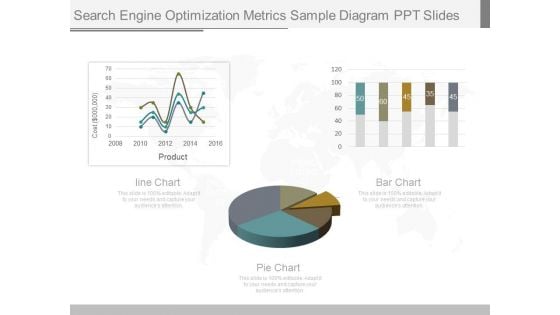
Search Engine Optimization Metrics Sample Diagram Ppt Slides
This is a search engine optimization metrics sample diagram ppt slides. This is a three stage process. The stages in this process are cost, product, line chart, bar chart, pie chart.
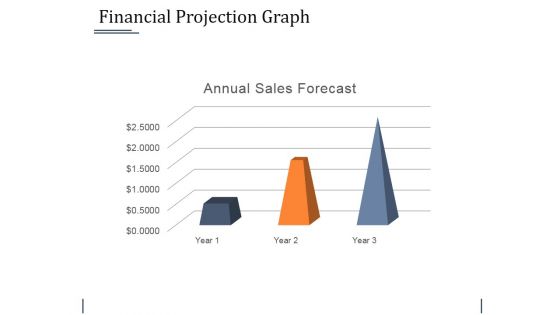
Financial Projection Graph Template 2 Ppt PowerPoint Presentation Infographic Template Gallery
This is a financial projection graph template 2 ppt powerpoint presentation infographic template gallery. This is a three stage process. The stages in this process are business, bar graph, finance, marketing, strategy, analysis.
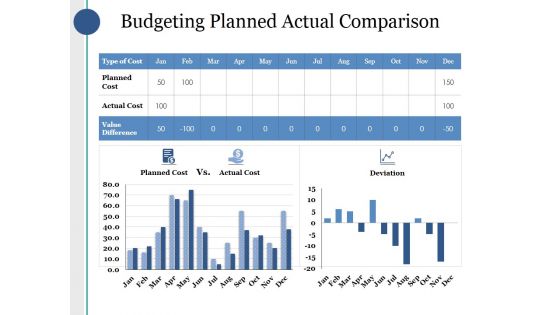
Budgeting Planned Actual Comparison Ppt PowerPoint Presentation Portfolio Background
This is a budgeting planned actual comparison ppt powerpoint presentation portfolio background. This is a three stage process. The stages in this process are planned cost, actual cost, value difference, deviation, bar graph.
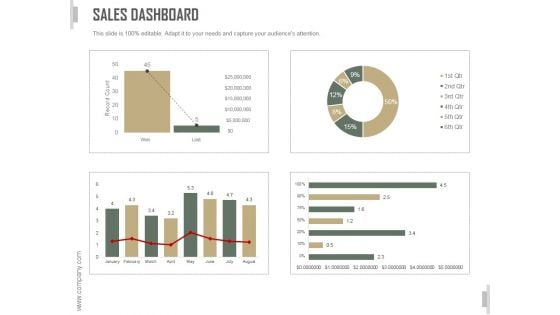
Sales Dashboard Slide Ppt PowerPoint Presentation Template
This is a sales dashboard slide ppt powerpoint presentation template. This is a three stage process. The stages in this process are business, strategy, marketing, analysis, bar graph, growth strategy.
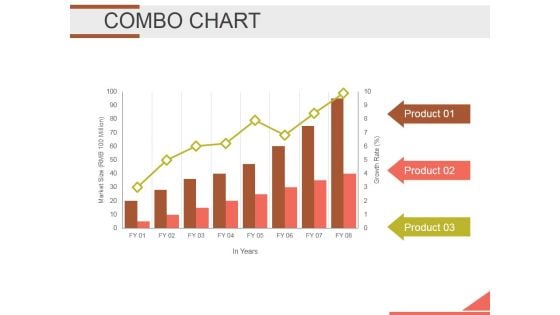
Combo Chart Ppt PowerPoint Presentation Infographics Infographics
This is a combo chart ppt powerpoint presentation infographics infographics. This is a three stage process. The stages in this process are bar graph, growth, finance, marketing, strategy, business.
Crm Dashboard Deals By Expected Close Date Ppt PowerPoint Presentation Portfolio Icons
This is a crm dashboard deals by expected close date ppt powerpoint presentation portfolio icons. This is a three stage process. The stages in this process are bar graph, finance, marketing, strategy, business, analysis, growth.
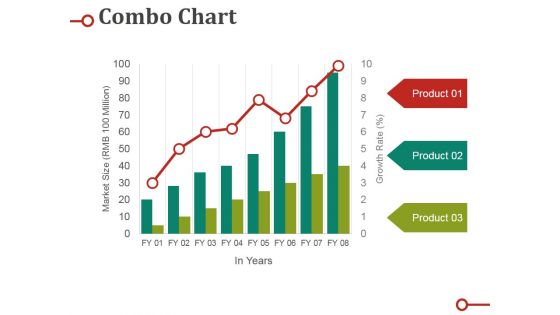
Combo Chart Ppt PowerPoint Presentation Gallery Sample
This is a combo chart ppt powerpoint presentation gallery sample. This is a three stage process. The stages in this process are market size, product, growth rate, bar, graph.
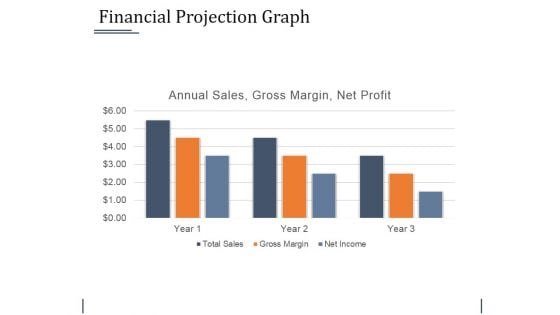
Financial Projection Graph Template 1 Ppt PowerPoint Presentation Professional Example Introduction
This is a financial projection graph template 1 ppt powerpoint presentation professional example introduction. This is a three stage process. The stages in this process are business, bar graph, finance, marketing, strategy, analysis.
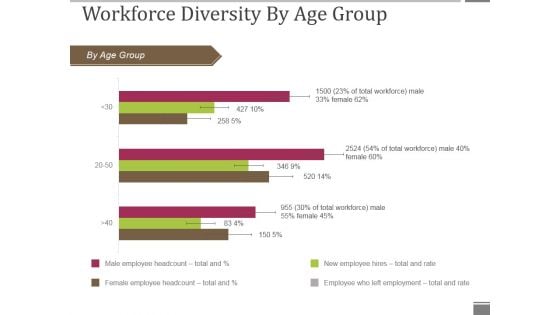
Workforce Diversity By Age Group Ppt PowerPoint Presentation Visual Aids Gallery
This is a workforce diversity by age group ppt powerpoint presentation visual aids gallery. This is a three stage process. The stages in this process are by age group, bar graph, business, marketing, presentation.


 Continue with Email

 Home
Home


