Time Icon
Performance Tracking Dashboard For Reinforcement Learning Model Role Of Reinforcement Mockup Pdf
This slide represents the performance tracking dashboard for the reinforcement learning model based on different time frames and categories. Explore a selection of the finest Performance Tracking Dashboard For Reinforcement Learning Model Role Of Reinforcement Mockup Pdf here. With a plethora of professionally designed and pre-made slide templates, you can quickly and easily find the right one for your upcoming presentation. You can use our Performance Tracking Dashboard For Reinforcement Learning Model Role Of Reinforcement Mockup Pdf to effectively convey your message to a wider audience. Slidegeeks has done a lot of research before preparing these presentation templates. The content can be personalized and the slides are highly editable. Grab templates today from Slidegeeks. This slide represents the performance tracking dashboard for the reinforcement learning model based on different time frames and categories.
Impact On Asset Metrics Post Implementing Of Tech Asset Management Pictures Pdf
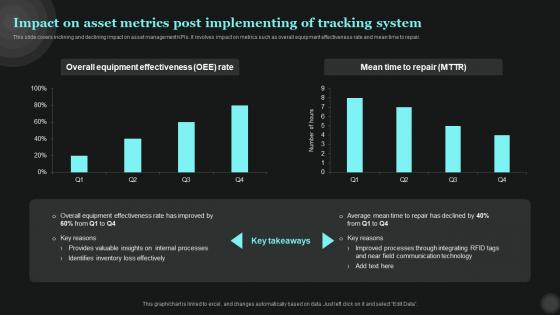
This slide covers inclining and declining impact on asset management KPIs. It involves impact on metrics such as overall equipment effectiveness rate and mean time to repair. From laying roadmaps to briefing everything in detail, our templates are perfect for you. You can set the stage with your presentation slides. All you have to do is download these easy-to-edit and customizable templates. Impact On Asset Metrics Post Implementing Of Tech Asset Management Pictures Pdf will help you deliver an outstanding performance that everyone would remember and praise you for. Do download this presentation today. This slide covers inclining and declining impact on asset management KPIs. It involves impact on metrics such as overall equipment effectiveness rate and mean time to repair.
Email Campaign Performance Evaluation Comprehensive CDP Guide For Promoters Designs Pdf
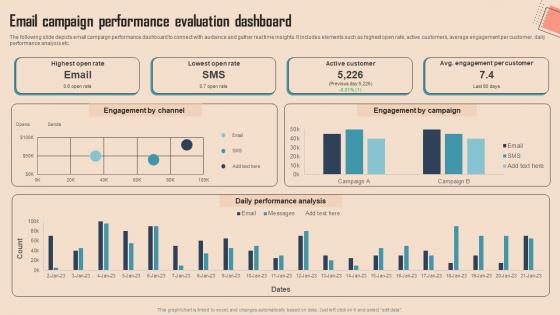
The following slide depicts email campaign performance dashboard to connect with audience and gather real time insights. It includes elements such as highest open rate, active customers, average engagement per customer, daily performance analysis etc.Make sure to capture your audiences attention in your business displays with our gratis customizable Email Campaign Performance Evaluation Comprehensive CDP Guide For Promoters Designs Pdf. These are great for business strategies, office conferences, capital raising or task suggestions. If you desire to acquire more customers for your tech business and ensure they stay satisfied, create your own sales presentation with these plain slides. The following slide depicts email campaign performance dashboard to connect with audience and gather real time insights. It includes elements such as highest open rate, active customers, average engagement per customer, daily performance analysis etc.
KPI Dashboard To Track Business Performance Business Environmental Analysis Formats Pdf
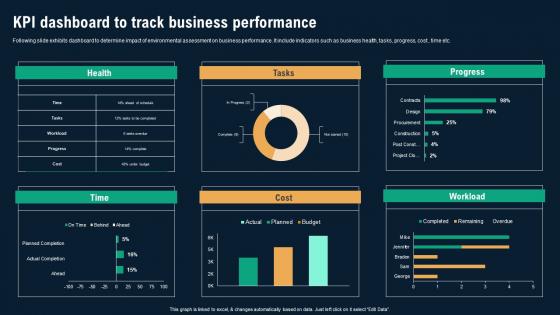
Following slide exhibits dashboard to determine impact of environmental assessment on business performance. It include indicators such as business health, tasks, progress, cost , time etc. The KPI Dashboard To Track Business Performance Business Environmental Analysis Formats Pdf is a compilation of the most recent design trends as a series of slides. It is suitable for any subject or industry presentation, containing attractive visuals and photo spots for businesses to clearly express their messages. This template contains a variety of slides for the user to input data, such as structures to contrast two elements, bullet points, and slides for written information. Slidegeeks is prepared to create an impression. Following slide exhibits dashboard to determine impact of environmental assessment on business performance. It include indicators such as business health, tasks, progress, cost , time etc.
Current Scenario For Customer Conversion Of Customer Support Services Rules Pdf
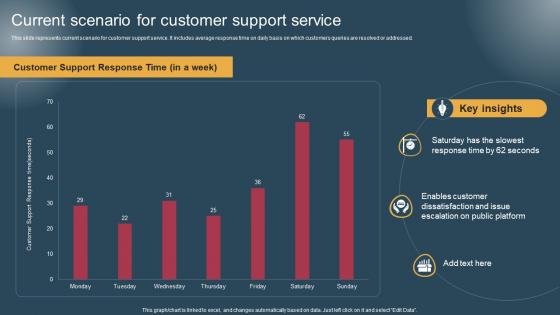
This slide represents current scenario for customer support service. It includes average response time on daily basis on which customers queries are resolved or addressed. Do you have to make sure that everyone on your team knows about any specific topic I yes, then you should give Current Scenario For Customer Conversion Of Customer Support Services Rules Pdf a try. Our experts have put a lot of knowledge and effort into creating this impeccable Current Scenario For Customer Conversion Of Customer Support Services Rules Pdf. You can use this template for your upcoming presentations, as the slides are perfect to represent even the tiniest detail. You can download these templates from the Slidegeeks website and these are easy to edit. So grab these today. This slide represents current scenario for customer support service. It includes average response time on daily basis on which customers queries are resolved or addressed.
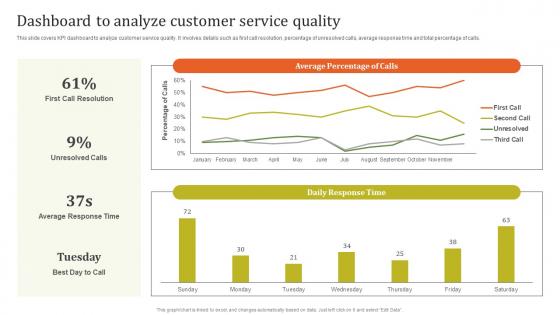
Dashboard To Analyze Customer Executing Effective Quality Enhancement Mockup Pdf
This slide covers KPI dashboard to analyze customer service quality. It involves details such as first call resolution, percentage of unresolved calls, average response time and total percentage of calls. From laying roadmaps to briefing everything in detail, our templates are perfect for you. You can set the stage with your presentation slides. All you have to do is download these easy to edit and customizable templates. Dashboard To Analyze Customer Executing Effective Quality Enhancement Mockup Pdf will help you deliver an outstanding performance that everyone would remember and praise you for. Do download this presentation today. This slide covers KPI dashboard to analyze customer service quality. It involves details such as first call resolution, percentage of unresolved calls, average response time and total percentage of calls.
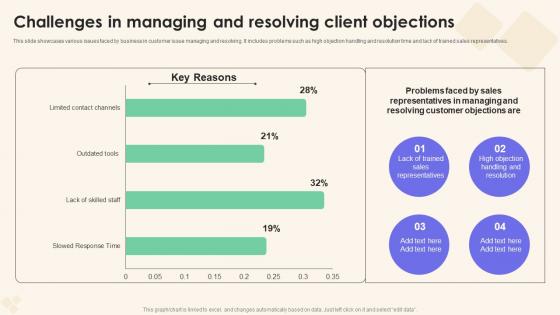
Challenges In Managing And Resolving Sales Performance Enhancement Professional Pdf
This slide showcases various issues faced by business in customer issue managing and resolving. It includes problems such as high objection handling and resolution time and lack of trained sales representatives. Want to ace your presentation in front of a live audience Our Challenges In Managing And Resolving Sales Performance Enhancement Professional Pdf can help you do that by engaging all the users towards you. Slidegeeks experts have put their efforts and expertise into creating these impeccable powerpoint presentations so that you can communicate your ideas clearly. Moreover, all the templates are customizable, and easy to edit and downloadable. Use these for both personal and commercial use. This slide showcases various issues faced by business in customer issue managing and resolving. It includes problems such as high objection handling and resolution time and lack of trained sales representatives.
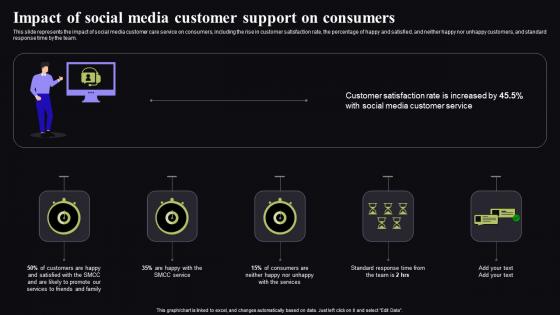
Video Conferencing In Corporate Clipart Impact Of Social Media Customer Support Pdf
This slide represents the impact of social media customer care service on consumers, including the rise in customer satisfaction rate, the percentage of happy and satisfied, and neither happy nor unhappy customers, and standard response time by the team. If your project calls for a presentation, then Slidegeeks is your go-to partner because we have professionally designed, easy-to-edit templates that are perfect for any presentation. After downloading, you can easily edit Video Conferencing In Corporate Clipart Impact Of Social Media Customer Support Pdf and make the changes accordingly. You can rearrange slides or fill them with different images. Check out all the handy templates This slide represents the impact of social media customer care service on consumers, including the rise in customer satisfaction rate, the percentage of happy and satisfied, and neither happy nor unhappy customers, and standard response time by the team.
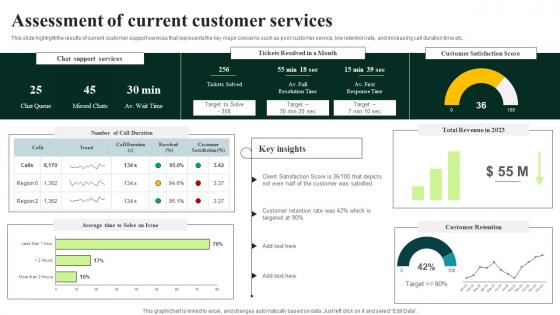
Client Feedback Strategies Assessment Of Current Customer Services Microsoft Pdf
This slide highlight the results of current customer support services that represents the key major concerns such as poor customer service, low retention rate, and increasing call duration time etc. If your project calls for a presentation, then Slidegeeks is your go to partner because we have professionally designed, easy to edit templates that are perfect for any presentation. After downloading, you can easily edit Client Feedback Strategies Assessment Of Current Customer Services Microsoft Pdf and make the changes accordingly. You can rearrange slides or fill them with different images. Check out all the handy templates This slide highlight the results of current customer support services that represents the key major concerns such as poor customer service, low retention rate, and increasing call duration time etc.
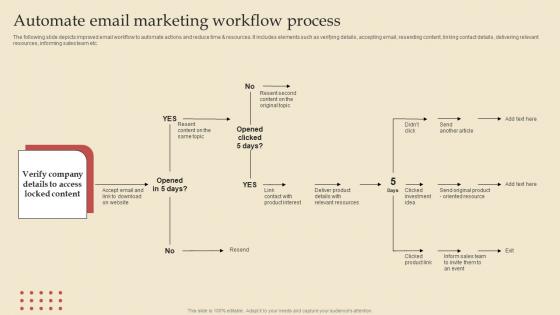
Automate Email Describing Business Performance Administration Goals Clipart Pdf
The following slide depicts improved email workflow to automate actions and reduce time and resources. It includes elements such as verifying details, accepting email, resending content, linking contact details, delivering relevant resources, informing sales team etc. This Automate Email Describing Business Performance Administration Goals Clipart Pdf is perfect for any presentation, be it in front of clients or colleagues. It is a versatile and stylish solution for organizing your meetings. The Automate Email Describing Business Performance Administration Goals Clipart Pdf features a modern design for your presentation meetings. The adjustable and customizable slides provide unlimited possibilities for acing up your presentation. Slidegeeks has done all the homework before launching the product for you. So, do not wait, grab the presentation templates today The following slide depicts improved email workflow to automate actions and reduce time and resources. It includes elements such as verifying details, accepting email, resending content, linking contact details, delivering relevant resources, informing sales team etc.
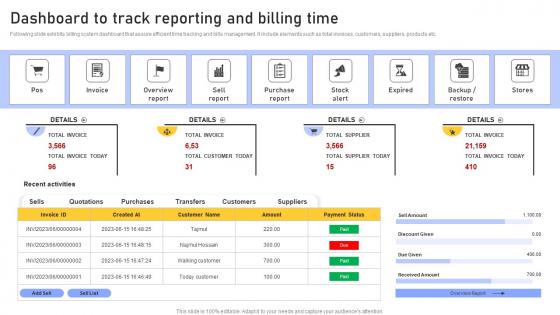
Dashboard To Track Reporting Enhancing Customer Service Operations Using CRM Technology Inspiration Pdf
Following slide exhibits billing system dashboard that assure efficient time tracking and bills management. It include elements such as total invoices, customers, suppliers, products etc. Slidegeeks is here to make your presentations a breeze with Dashboard To Track Reporting Enhancing Customer Service Operations Using CRM Technology Inspiration Pdf With our easy to use and customizable templates, you can focus on delivering your ideas rather than worrying about formatting. With a variety of designs to choose from, you are sure to find one that suits your needs. And with animations and unique photos, illustrations, and fonts, you can make your presentation pop. So whether you are giving a sales pitch or presenting to the board, make sure to check out Slidegeeks first Following slide exhibits billing system dashboard that assure efficient time tracking and bills management. It include elements such as total invoices, customers, suppliers, products etc.
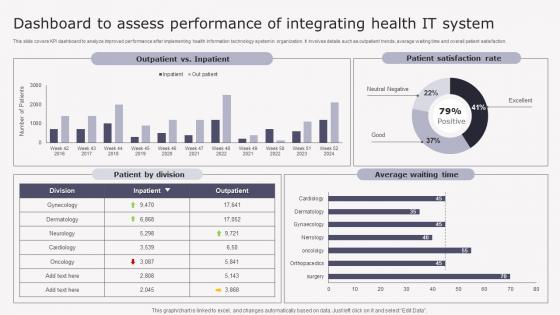
Transforming Medicare Services Using Health Dashboard To Assess Performance Introduction Pdf
This slide covers KPI dashboard to analyze improved performance after implementing health information technology system in organization. It involves details such as outpatient trends, average waiting time and overall patient satisfaction. Do you have to make sure that everyone on your team knows about any specific topic I yes, then you should give Transforming Medicare Services Using Health Dashboard To Assess Performance Introduction Pdf a try. Our experts have put a lot of knowledge and effort into creating this impeccable Transforming Medicare Services Using Health Dashboard To Assess Performance Introduction Pdf. You can use this template for your upcoming presentations, as the slides are perfect to represent even the tiniest detail. You can download these templates from the Slidegeeks website and these are easy to edit. So grab these today This slide covers KPI dashboard to analyze improved performance after implementing health information technology system in organization. It involves details such as outpatient trends, average waiting time and overall patient satisfaction.
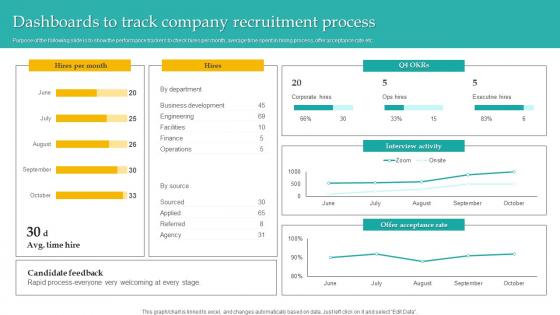
Dashboards To Track Company Administering Diversity And Inclusion At Workplace Mockup Pdf
Purpose of the following slide is to show the performance trackers to check hires per month, average time spent in hiring process, offer acceptance rate etc. From laying roadmaps to briefing everything in detail, our templates are perfect for you. You can set the stage with your presentation slides. All you have to do is download these easy to edit and customizable templates. Dashboards To Track Company Administering Diversity And Inclusion At Workplace Mockup Pdf will help you deliver an outstanding performance that everyone would remember and praise you for. Do download this presentation today. Purpose of the following slide is to show the performance trackers to check hires per month, average time spent in hiring process, offer acceptance rate etc.
Leveraging Logistics Automation Dashboard For Tracking Impact Of Procurement Ideas Pdf
This slide covers the dashboard for analysing procurement performance after automation. It include KPIs such as on time delivery, percentage of returns, compliance index percentage, procurement ROI, cost saving, budget spent on training, etc. Slidegeeks is here to make your presentations a breeze with Leveraging Logistics Automation Dashboard For Tracking Impact Of Procurement Ideas Pdf With our easy to use and customizable templates, you can focus on delivering your ideas rather than worrying about formatting. With a variety of designs to choose from, you are sure to find one that suits your needs. And with animations and unique photos, illustrations, and fonts, you can make your presentation pop. So whether you are giving a sales pitch or presenting to the board, make sure to check out Slidegeeks first. This slide covers the dashboard for analysing procurement performance after automation. It include KPIs such as on time delivery, percentage of returns, compliance index percentage, procurement ROI, cost saving, budget spent on training, etc.
Impact On Asset Metrics Post Maximizing Efficiency With Asset Tracking Solutions Download Pdf
This slide covers inclining and declining impact on asset management KPIs. It involves impact on metrics such as overall equipment effectiveness rate and mean time to repair. Are you in need of a template that can accommodate all of your creative concepts This one is crafted professionally and can be altered to fit any style. Use it with Google Slides or PowerPoint. Include striking photographs, symbols, depictions, and other visuals. Fill, move around, or remove text boxes as desired. Test out color palettes and font mixtures. Edit and save your work, or work with colleagues. Download Impact On Asset Metrics Post Maximizing Efficiency With Asset Tracking Solutions Download Pdf and observe how to make your presentation outstanding. Give an impeccable presentation to your group and make your presentation unforgettable. This slide covers inclining and declining impact on asset management KPIs. It involves impact on metrics such as overall equipment effectiveness rate and mean time to repair.
Dashboard For Digital Biomarkers Biomedical Data Science And Health Informatics Slides Pdf
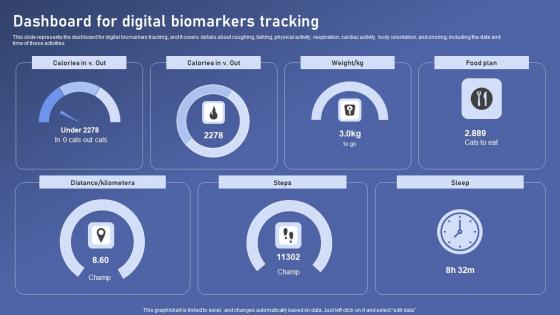
This slide represents the dashboard for digital biomarkers tracking, and it covers details about coughing, talking, physical activity, respiration, cardiac activity, body orientation, and snoring, including the date and time of these activities Make sure to capture your audiences attention in your business displays with our gratis customizable Dashboard For Digital Biomarkers Biomedical Data Science And Health Informatics Slides Pdf. These are great for business strategies, office conferences, capital raising or task suggestions. If you desire to acquire more customers for your tech business and ensure they stay satisfied, create your own sales presentation with these plain slides. This slide represents the dashboard for digital biomarkers tracking, and it covers details about coughing, talking, physical activity, respiration, cardiac activity, body orientation, and snoring, including the date and time of these activities
Impact Social Media Customer Digital Signage In Internal Communication Channels Microsoft Pdf
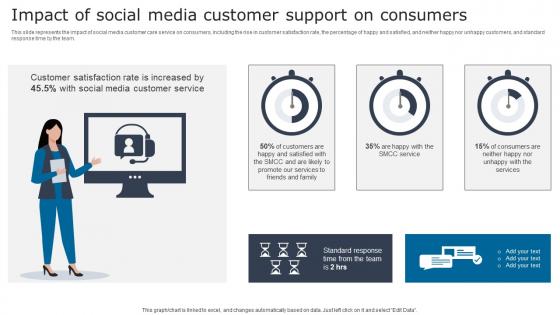
This slide represents the impact of social media customer care service on consumers, including the rise in customer satisfaction rate, the percentage of happy and satisfied, and neither happy nor unhappy customers, and standard response time by the team. Find a pre designed and impeccable Impact Social Media Customer Digital Signage In Internal Communication Channels Microsoft Pdf. The templates can ace your presentation without additional effort. You can download these easy to edit presentation templates to make your presentation stand out from others. So, what are you waiting for Download the template from Slidegeeks today and give a unique touch to your presentation. This slide represents the impact of social media customer care service on consumers, including the rise in customer satisfaction rate, the percentage of happy and satisfied, and neither happy nor unhappy customers, and standard response time by the team.
Social Media Customer Service Digital Signage In Internal Communication Channels Template Pdf
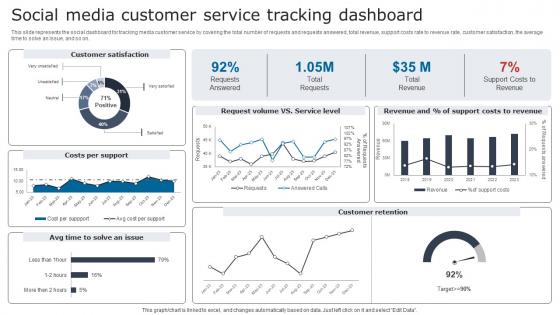
This slide represents the social dashboard for tracking media customer service by covering the total number of requests and requests answered, total revenue, support costs rate to revenue rate, customer satisfaction, the average time to solve an issue, and so on. If your project calls for a presentation, then Slidegeeks is your go to partner because we have professionally designed, easy to edit templates that are perfect for any presentation. After downloading, you can easily edit Social Media Customer Service Digital Signage In Internal Communication Channels Template Pdf and make the changes accordingly. You can rearrange slides or fill them with different images. Check out all the handy templates This slide represents the social dashboard for tracking media customer service by covering the total number of requests and requests answered, total revenue, support costs rate to revenue rate, customer satisfaction, the average time to solve an issue, and so on.
RFM Analysis Sample For Analyzing Customer Buying Guide For Segmenting And Formulating Portrait Pdf
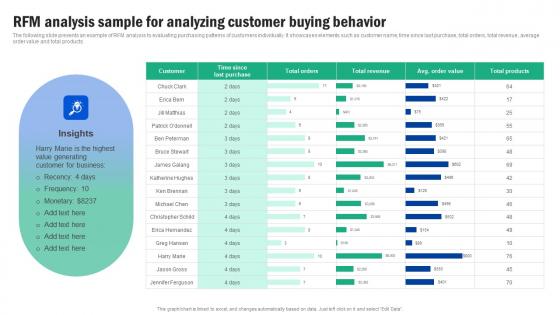
The following slide presents an example of RFM analysis to evaluating purchasing patterns of customers individually. It showcases elements such as customer name, time since last purchase, total orders, total revenue, average order value and total products. If your project calls for a presentation, then Slidegeeks is your go to partner because we have professionally designed, easy to edit templates that are perfect for any presentation. After downloading, you can easily edit RFM Analysis Sample For Analyzing Customer Buying Guide For Segmenting And Formulating Portrait Pdf and make the changes accordingly. You can rearrange slides or fill them with different images. Check out all the handy templates The following slide presents an example of RFM analysis to evaluating purchasing patterns of customers individually. It showcases elements such as customer name, time since last purchase, total orders, total revenue, average order value and total products.
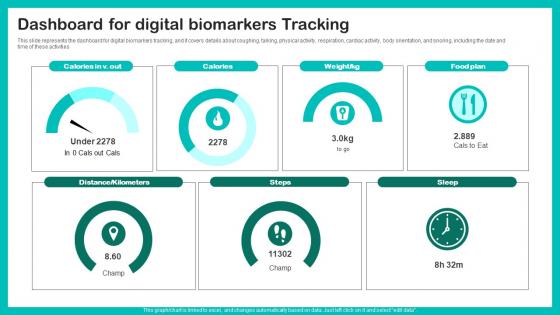
Digital Biomarkers For Personalized Health Insights Dashboard For Digital Biomarkers Template Pdf
This slide represents the dashboard for digital biomarkers tracking, and it covers details about coughing, talking, physical activity, respiration, cardiac activity, body orientation, and snoring, including the date and time of these activities Get a simple yet stunning designed Digital Biomarkers For Personalized Health Insights Dashboard For Digital Biomarkers Template Pdf. It is the best one to establish the tone in your meetings. It is an excellent way to make your presentations highly effective. So, download this PPT today from Slidegeeks and see the positive impacts. Our easy to edit Digital Biomarkers For Personalized Health Insights Dashboard For Digital Biomarkers Template Pdf can be your go to option for all upcoming conferences and meetings. So, what are you waiting for Grab this template today. This slide represents the dashboard for digital biomarkers tracking, and it covers details about coughing, talking, physical activity, respiration, cardiac activity, body orientation, and snoring, including the date and time of these activities
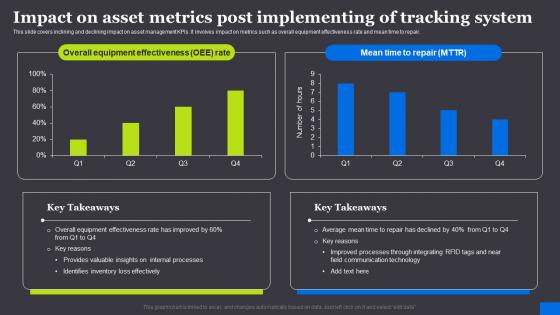
Impact On Asset Metrics Post Implementing RFID Solutions For Asset Traceability Clipart Pdf
This slide covers inclining and declining impact on asset management KPIs. It involves impact on metrics such as overall equipment effectiveness rate and mean time to repair. Are you in need of a template that can accommodate all of your creative concepts This one is crafted professionally and can be altered to fit any style. Use it with Google Slides or PowerPoint. Include striking photographs, symbols, depictions, and other visuals. Fill, move around, or remove text boxes as desired. Test out color palettes and font mixtures. Edit and save your work, or work with colleagues. Download Impact On Asset Metrics Post Implementing RFID Solutions For Asset Traceability Clipart Pdf and observe how to make your presentation outstanding. Give an impeccable presentation to your group and make your presentation unforgettable. This slide covers inclining and declining impact on asset management KPIs. It involves impact on metrics such as overall equipment effectiveness rate and mean time to repair.
Dashboard For Tracking Impact Of Warehouse Leveraging Logistics Automation Information Pdf
This slide covers the dashboard with after automation warehouse overview. It include KPIs such as autonomous robots status, robotic arms status, battery level, performance, time to return, etc.Get a simple yet stunning designed Dashboard For Tracking Impact Of Warehouse Leveraging Logistics Automation Information Pdf. It is the best one to establish the tone in your meetings. It is an excellent way to make your presentations highly effective. So, download this PPT today from Slidegeeks and see the positive impacts. Our easy-to-edit Dashboard For Tracking Impact Of Warehouse Leveraging Logistics Automation Information Pdf can be your go-to option for all upcoming conferences and meetings. So, what are you waiting for Grab this template today. This slide covers the dashboard with after automation warehouse overview. It include KPIs such as autonomous robots status, robotic arms status, battery level, performance, time to return, etc.
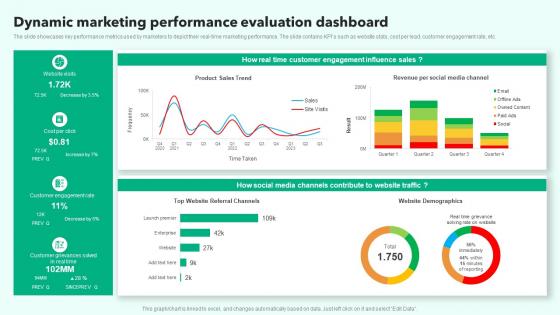
Dynamic Marketing Performance Evaluation Dashboard Microsoft Pdf
The slide showcases key performance metrics used by marketers to depict their real time marketing performance. The slide contains KPIs such as website stats, cost per lead, customer engagement rate, etc. Pitch your topic with ease and precision using this Dynamic Marketing Performance Evaluation Dashboard Microsoft Pdf. This layout presents information on Influence Sales, Customer Engagement, Customer Engagement Rate. It is also available for immediate download and adjustment. So, changes can be made in the color, design, graphics or any other component to create a unique layout. The slide showcases key performance metrics used by marketers to depict their real time marketing performance. The slide contains KPIs such as website stats, cost per lead, customer engagement rate, etc.
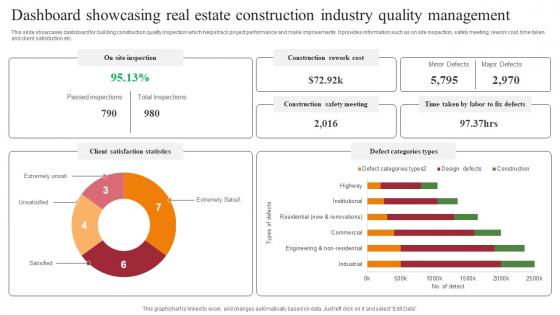
Dashboard Showcasing Real Estate Construction Industry Quality Management Topics Pdf
This slide showcases dashboard for building construction quality inspection which helps track project performance and make improvements. It provides information such as on site inspection, safety meeting, rework cost, time taken and client satisfaction etc. Pitch your topic with ease and precision using this Dashboard Showcasing Real Estate Construction Industry Quality Management Topics Pdf. This layout presents information on Client Satisfaction Statistics, Defect Categories Types. It is also available for immediate download and adjustment. So, changes can be made in the color, design, graphics or any other component to create a unique layout. This slide showcases dashboard for building construction quality inspection which helps track project performance and make improvements. It provides information such as on site inspection, safety meeting, rework cost, time taken and client satisfaction etc.
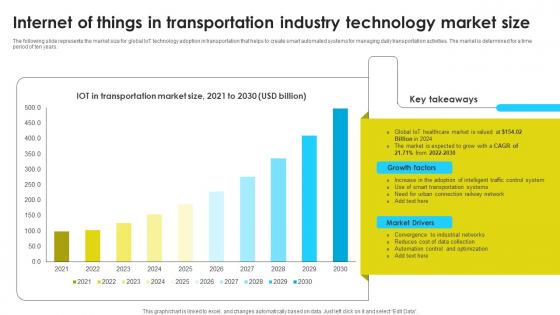
Internet Of Things In Transportation Industry Technology Market Size Pictures Pdf
The following slide represents the market size for global IoT technology adoption in transportation that helps to create smart automated systems for managing daily transportation activities. The market is determined for a time period of ten years. Pitch your topic with ease and precision using this Internet Of Things In Transportation Industry Technology Market Size Pictures Pdf This layout presents information on Internet Of Things, Transportation Industry, Technology Market Size It is also available for immediate download and adjustment. So, changes can be made in the color, design, graphics or any other component to create a unique layout. The following slide represents the market size for global IoT technology adoption in transportation that helps to create smart automated systems for managing daily transportation activities. The market is determined for a time period of ten years.
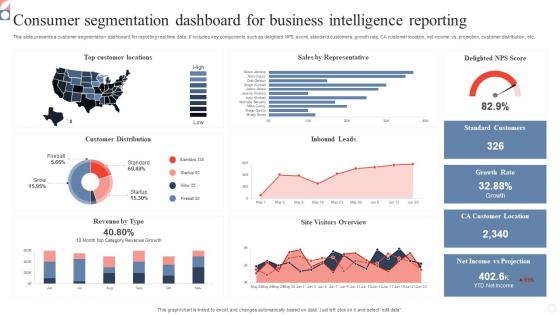
Consumer Segmentation Dashboard For Business Intelligence Reporting Topics Pdf
This slide presents a customer segmentation dashboard for reporting real time data. It includes key components such as delighted NPS score, standard customers, growth rate, CA customer location, net income vs. projection, customer distribution, etc. Pitch your topic with ease and precision using this Consumer Segmentation Dashboard For Business Intelligence Reporting Topics Pdf. This layout presents information on Consumer Segmentation Dashboard, Business Intelligence Reporting, Growth Rate. It is also available for immediate download and adjustment. So, changes can be made in the color, design, graphics or any other component to create a unique layout. This slide presents a customer segmentation dashboard for reporting real time data. It includes key components such as delighted NPS score, standard customers, growth rate, CA customer location, net income vs. projection, customer distribution, etc.
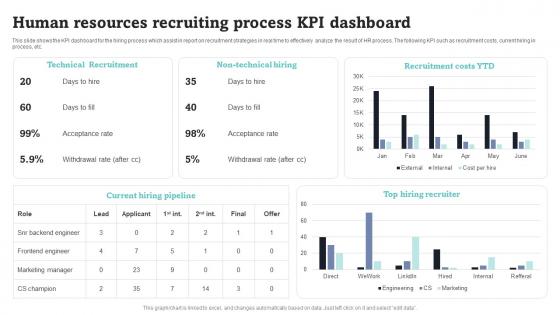
Human Resources Recruiting Process KPI Dashboard Summary Pdf
This slide shows the KPI dashboard for the hiring process which assist in report on recruitment strategies in real time to effectively analyze the result of HR process. The following KPI such as recruitment costs, current hiring in process, etc. Showcasing this set of slides titled Human Resources Recruiting Process KPI Dashboard Summary Pdf. The topics addressed in these templates are Technical Recruitment, Non Technical Hiring, Recruitment Costs. All the content presented in this PPT design is completely editable. Download it and make adjustments in color, background, font etc. as per your unique business setting. This slide shows the KPI dashboard for the hiring process which assist in report on recruitment strategies in real time to effectively analyze the result of HR process. The following KPI such as recruitment costs, current hiring in process, etc.
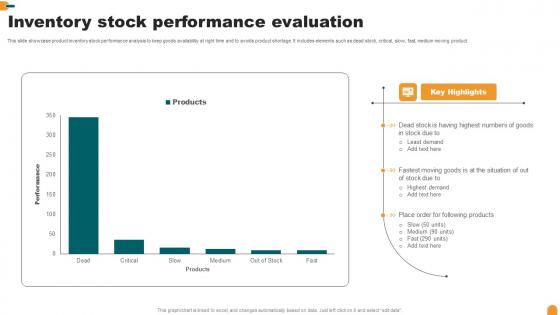
Inventory Stock Performance Evaluation Ideas Pdf
This slide showcase product inventory stock performance analysis to keep goods availability at right time and to avoids product shortage. It includes elements such as dead stock, critical, slow, fast, medium moving product.Showcasing this set of slides titled Inventory Stock Performance Evaluation Ideas Pdf The topics addressed in these templates are Least Demand, Highest Demand, Dead Stock All the content presented in this PPT design is completely editable. Download it and make adjustments in color, background, font etc. as per your unique business setting. This slide showcase product inventory stock performance analysis to keep goods availability at right time and to avoids product shortage. It includes elements such as dead stock, critical, slow, fast, medium moving product.
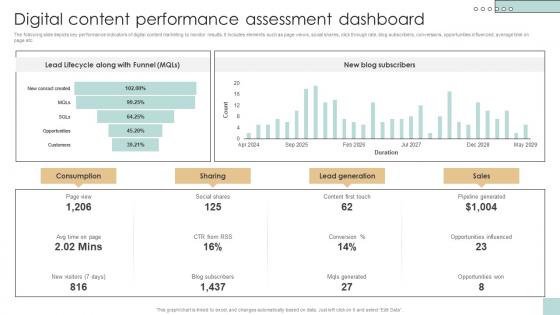
Digital Content Performance Assessment Developing And Creating Digital Content Strategy SS V
The following slide depicts key performance indicators of digital content marketing to monitor results. It includes elements such as page views, social shares, click through rate, blog subscribers, conversions, opportunities influenced, average time on page etc. If your project calls for a presentation, then Slidegeeks is your go-to partner because we have professionally designed, easy-to-edit templates that are perfect for any presentation. After downloading, you can easily edit Digital Content Performance Assessment Developing And Creating Digital Content Strategy SS V and make the changes accordingly. You can rearrange slides or fill them with different images. Check out all the handy templates The following slide depicts key performance indicators of digital content marketing to monitor results. It includes elements such as page views, social shares, click through rate, blog subscribers, conversions, opportunities influenced, average time on page etc.
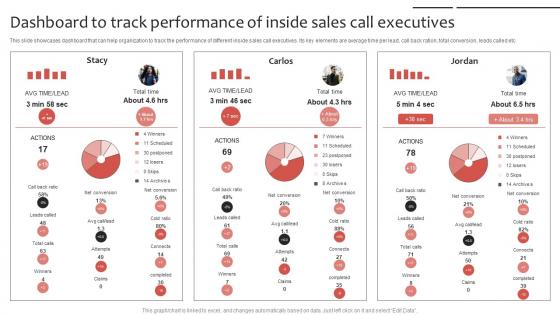
Phone Sales Strategy To Drive Leads Dashboard To Track Performance Strategy SS V
This slide showcases dashboard that can help organization to track the performance of different inside sales call executives. Its key elements are average time per lead, call back ration, total conversion, leads called etc. Slidegeeks has constructed Phone Sales Strategy To Drive Leads Dashboard To Track Performance Strategy SS V after conducting extensive research and examination. These presentation templates are constantly being generated and modified based on user preferences and critiques from editors. Here, you will find the most attractive templates for a range of purposes while taking into account ratings and remarks from users regarding the content. This is an excellent jumping-off point to explore our content and will give new users an insight into our top-notch PowerPoint Templates. This slide showcases dashboard that can help organization to track the performance of different inside sales call executives. Its key elements are average time per lead, call back ration, total conversion, leads called etc.
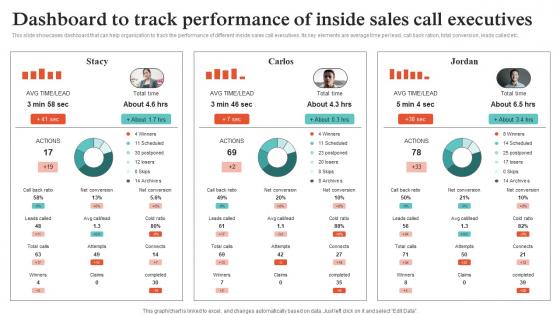
Virtual Sales Strategies For Business Dashboard To Track Performance Of Inside Strategy SS V
This slide showcases dashboard that can help organization to track the performance of different inside sales call executives. Its key elements are average time per lead, call back ration, total conversion, leads called etc. Make sure to capture your audiences attention in your business displays with our gratis customizable Virtual Sales Strategies For Business Dashboard To Track Performance Of Inside Strategy SS V. These are great for business strategies, office conferences, capital raising or task suggestions. If you desire to acquire more customers for your tech business and ensure they stay satisfied, create your own sales presentation with these plain slides. This slide showcases dashboard that can help organization to track the performance of different inside sales call executives. Its key elements are average time per lead, call back ration, total conversion, leads called etc.
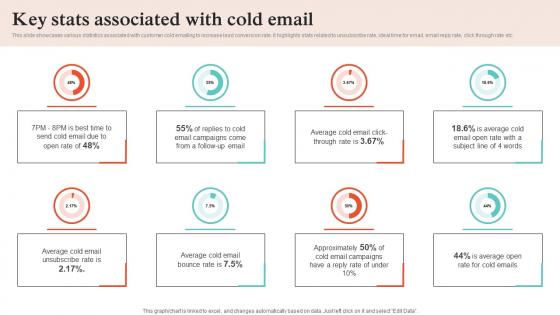
Virtual Sales Strategies Key Stats Associated With Cold Email Strategy SS V
This slide showcases various statistics associated with customer cold emailing to increase lead conversion rate. It highlights stats related to unsubscribe rate, ideal time for email, email reply rate, click through rate etc. Slidegeeks has constructed Virtual Sales Strategies Key Stats Associated With Cold Email Strategy SS V after conducting extensive research and examination. These presentation templates are constantly being generated and modified based on user preferences and critiques from editors. Here, you will find the most attractive templates for a range of purposes while taking into account ratings and remarks from users regarding the content. This is an excellent jumping-off point to explore our content and will give new users an insight into our top-notch PowerPoint Templates. This slide showcases various statistics associated with customer cold emailing to increase lead conversion rate. It highlights stats related to unsubscribe rate, ideal time for email, email reply rate, click through rate etc.
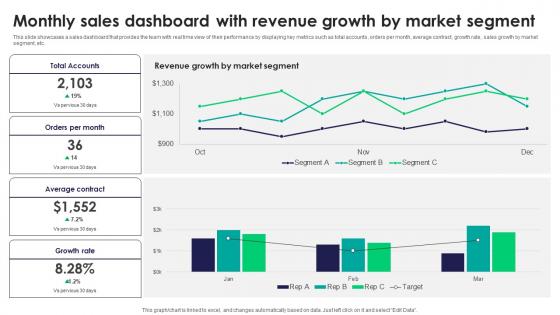
Monthly Sales Dashboard With Revenue Growth By Tactics For Improving Field Sales Team SA SS V
This slide showcases a sales dashboard that provides the team with real time view of their performance by displaying key metrics such as total accounts, orders per month, average contract, growth rate, sales growth by market segment, etc. The Monthly Sales Dashboard With Revenue Growth By Tactics For Improving Field Sales Team SA SS V is a compilation of the most recent design trends as a series of slides. It is suitable for any subject or industry presentation, containing attractive visuals and photo spots for businesses to clearly express their messages. This template contains a variety of slides for the user to input data, such as structures to contrast two elements, bullet points, and slides for written information. Slidegeeks is prepared to create an impression. This slide showcases a sales dashboard that provides the team with real time view of their performance by displaying key metrics such as total accounts, orders per month, average contract, growth rate, sales growth by market segment, etc.
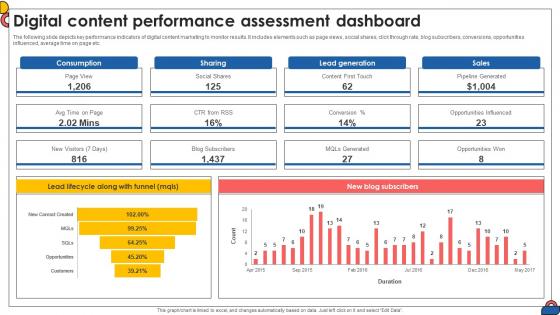
Digital Content Performance Assessment Dashboard Comprehensive Guide To Implement Strategy SS V
The following slide depicts key performance indicators of digital content marketing to monitor results. It includes elements such as page views, social shares, click through rate, blog subscribers, conversions, opportunities influenced, average time on page etc.If your project calls for a presentation, then Slidegeeks is your go-to partner because we have professionally designed, easy-to-edit templates that are perfect for any presentation. After downloading, you can easily edit Digital Content Performance Assessment Dashboard Comprehensive Guide To Implement Strategy SS V and make the changes accordingly. You can rearrange slides or fill them with different images. Check out all the handy templates The following slide depicts key performance indicators of digital content marketing to monitor results. It includes elements such as page views, social shares, click through rate, blog subscribers, conversions, opportunities influenced, average time on page etc.
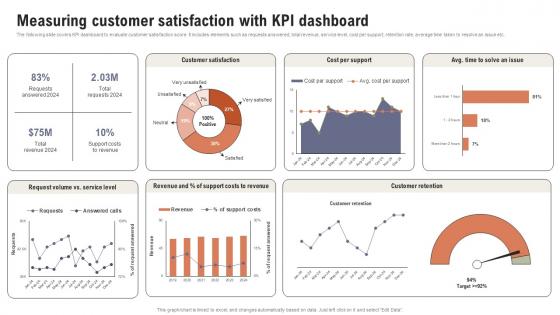
Measuring Customer Satisfaction With KPI Boosting Customer Retention Rate With Live Chat
The following slide covers KPI dashboard to evaluate customer satisfaction score. It includes elements such as requests answered, total revenue, service level, cost per support, retention rate, average time taken to resolve an issue etc. This modern and well-arranged Measuring Customer Satisfaction With KPI Boosting Customer Retention Rate With Live Chat provides lots of creative possibilities. It is very simple to customize and edit with the Powerpoint Software. Just drag and drop your pictures into the shapes. All facets of this template can be edited with Powerpoint, no extra software is necessary. Add your own material, put your images in the places assigned for them, adjust the colors, and then you can show your slides to the world, with an animated slide included. The following slide covers KPI dashboard to evaluate customer satisfaction score. It includes elements such as requests answered, total revenue, service level, cost per support, retention rate, average time taken to resolve an issue etc.
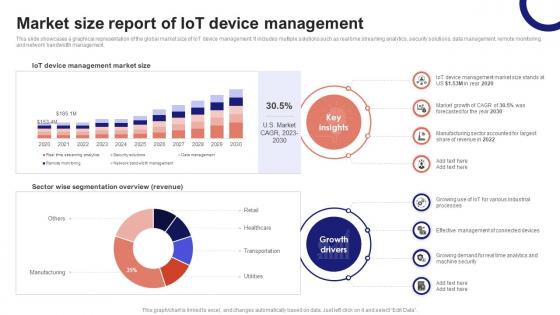
IoT Device Management Fundamentals Market Size Report Of IoT Device Management IoT Ss V
This slide showcases a graphical representation of the global market size of IoT device management. It includes multiple solutions such as real time streaming analytics, security solutions, data management, remote monitoring, and network bandwidth management. Slidegeeks has constructed IoT Device Management Fundamentals Market Size Report Of IoT Device Management IoT SS V after conducting extensive research and examination. These presentation templates are constantly being generated and modified based on user preferences and critiques from editors. Here, you will find the most attractive templates for a range of purposes while taking into account ratings and remarks from users regarding the content. This is an excellent jumping-off point to explore our content and will give new users an insight into our top-notch PowerPoint Templates. This slide showcases a graphical representation of the global market size of IoT device management. It includes multiple solutions such as real time streaming analytics, security solutions, data management, remote monitoring, and network bandwidth management.

Hr Recruitment Dashboard Showcasing Open Positions By Analysing Hr Data For Effective Decision Making
This slide showcases a dashboard that helps organizations track and monitor the hiring process. It includes total applicants, shortlisted candidates, hired candidates, rejected candidates, time to hire, cost to hire, etc. The Hr Recruitment Dashboard Showcasing Open Positions By Analysing Hr Data For Effective Decision Making is a compilation of the most recent design trends as a series of slides. It is suitable for any subject or industry presentation, containing attractive visuals and photo spots for businesses to clearly express their messages. This template contains a variety of slides for the user to input data, such as structures to contrast two elements, bullet points, and slides for written information. Slidegeeks is prepared to create an impression. This slide showcases a dashboard that helps organizations track and monitor the hiring process. It includes total applicants, shortlisted candidates, hired candidates, rejected candidates, time to hire, cost to hire, etc.

Monthly Sales Dashboard With Revenue Efficient Sales Territory Management To Build SA SS V
This slide showcases a sales dashboard that provides the team with real time view of their performance by displaying key metrics such as total accounts, orders per month, average contract, growth rate, sales growth by market segment, etc. The Monthly Sales Dashboard With Revenue Efficient Sales Territory Management To Build SA SS V is a compilation of the most recent design trends as a series of slides. It is suitable for any subject or industry presentation, containing attractive visuals and photo spots for businesses to clearly express their messages. This template contains a variety of slides for the user to input data, such as structures to contrast two elements, bullet points, and slides for written information. Slidegeeks is prepared to create an impression. This slide showcases a sales dashboard that provides the team with real time view of their performance by displaying key metrics such as total accounts, orders per month, average contract, growth rate, sales growth by market segment, etc.
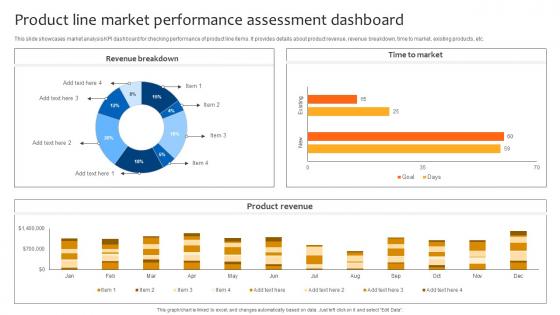
Deploying Strategies For Business Product Line Market Performance Assessment Dashboard Strategy SS V
This slide showcases market analysis KPI dashboard for checking performance of product line items. It provides details about product revenue, revenue breakdown, time to market, existing products, etc. Take your projects to the next level with our ultimate collection of Deploying Strategies For Business Product Line Market Performance Assessment Dashboard Strategy SS V. Slidegeeks has designed a range of layouts that are perfect for representing task or activity duration, keeping track of all your deadlines at a glance. Tailor these designs to your exact needs and give them a truly corporate look with your own brand colors they will make your projects stand out from the rest This slide showcases market analysis KPI dashboard for checking performance of product line items. It provides details about product revenue, revenue breakdown, time to market, existing products, etc.
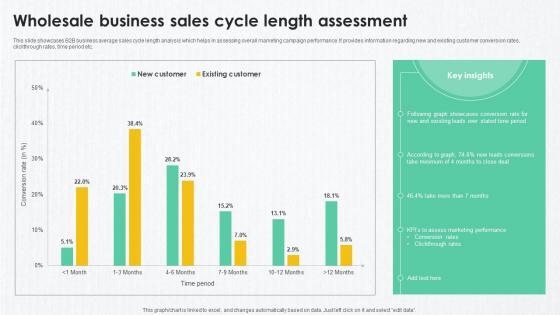
B2B Marketing Techniques Wholesale Business Sales Cycle Length Assessment
This slide showcases B2B business average sales cycle length analysis which helps in assessing overall marketing campaign performance. It provides information regarding new and existing customer conversion rates, clickthrough rates, time period etc. Slidegeeks is here to make your presentations a breeze with B2B Marketing Techniques Wholesale Business Sales Cycle Length Assessment With our easy-to-use and customizable templates, you can focus on delivering your ideas rather than worrying about formatting. With a variety of designs to choose from, you are sure to find one that suits your needs. And with animations and unique photos, illustrations, and fonts, you can make your presentation pop. So whether you are giving a sales pitch or presenting to the board, make sure to check out Slidegeeks first This slide showcases B2B business average sales cycle length analysis which helps in assessing overall marketing campaign performance. It provides information regarding new and existing customer conversion rates, clickthrough rates, time period etc.
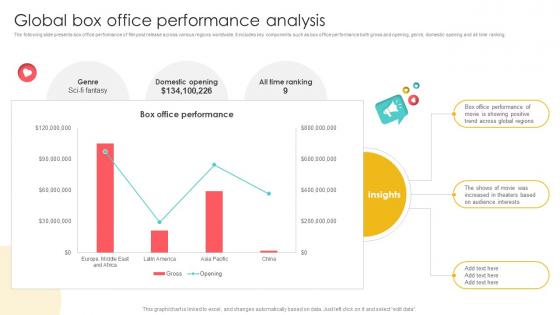
Marketing Channels For Movie Global Box Office Performance Analysis Strategy SS V
The following slide presents box office performance of film post release across various regions worldwide. It includes key components such as box office performance both gross and opening, genre, domestic opening and all time ranking. This Marketing Channels For Movie Global Box Office Performance Analysis Strategy SS V is perfect for any presentation, be it in front of clients or colleagues. It is a versatile and stylish solution for organizing your meetings. The Marketing Channels For Movie Global Box Office Performance Analysis Strategy SS V features a modern design for your presentation meetings. The adjustable and customizable slides provide unlimited possibilities for acing up your presentation. Slidegeeks has done all the homework before launching the product for you. So, do not wait, grab the presentation templates today The following slide presents box office performance of film post release across various regions worldwide. It includes key components such as box office performance both gross and opening, genre, domestic opening and all time ranking.
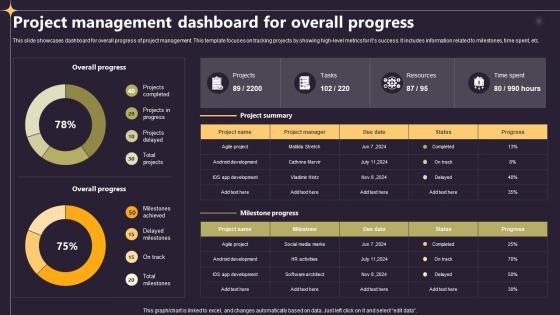
Closing A Project By Fulfilling Project Management Dashboard For Overall Progress PM SS V
This slide showcases dashboard for overall progress of project management. This template focuses on tracking projects by showing high-level metrics for its success. It includes information related to milestones, time spent, etc. This modern and well-arranged Closing A Project By Fulfilling Overview Of Planning Project In An Organisation PM SS V provides lots of creative possibilities. It is very simple to customize and edit with the Powerpoint Software. Just drag and drop your pictures into the shapes. All facets of this template can be edited with Powerpoint, no extra software is necessary. Add your own material, put your images in the places assigned for them, adjust the colors, and then you can show your slides to the world, with an animated slide included. This slide showcases dashboard for overall progress of project management. This template focuses on tracking projects by showing high-level metrics for its success. It includes information related to milestones, time spent, etc.
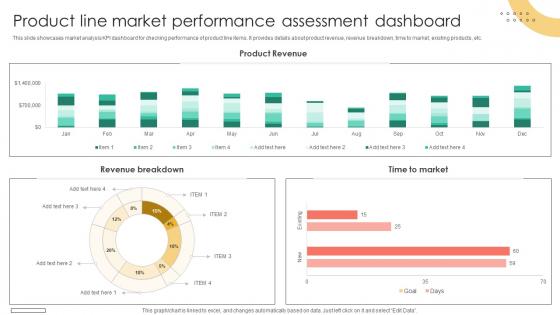
Brand Extension Techniques Product Line Market Performance Assessment Dashboard Strategy SS V
This slide showcases market analysis KPI dashboard for checking performance of product line items. It provides details about product revenue, revenue breakdown, time to market, existing products, etc. This Brand Extension Techniques Product Line Market Performance Assessment Dashboard Strategy SS V from Slidegeeks makes it easy to present information on your topic with precision. It provides customization options, so you can make changes to the colors, design, graphics, or any other component to create a unique layout. It is also available for immediate download, so you can begin using it right away. Slidegeeks has done good research to ensure that you have everything you need to make your presentation stand out. Make a name out there for a brilliant performance. This slide showcases market analysis KPI dashboard for checking performance of product line items. It provides details about product revenue, revenue breakdown, time to market, existing products, etc.
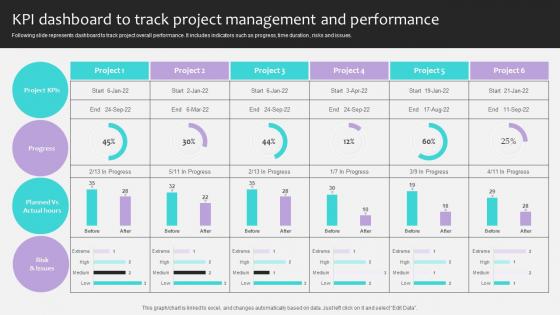
Project Stakeholders Management KPI Dashboard To Track Project Management Ppt Presentation
Following slide represents dashboard to track project overall performance. It includes indicators such as progress, time duration , risks and issues. Slidegeeks has constructed Project Stakeholders Management KPI Dashboard To Track Project Management Ppt Presentation after conducting extensive research and examination. These presentation templates are constantly being generated and modified based on user preferences and critiques from editors. Here, you will find the most attractive templates for a range of purposes while taking into account ratings and remarks from users regarding the content. This is an excellent jumping-off point to explore our content and will give new users an insight into our top-notch PowerPoint Templates. Following slide represents dashboard to track project overall performance. It includes indicators such as progress, time duration , risks and issues.
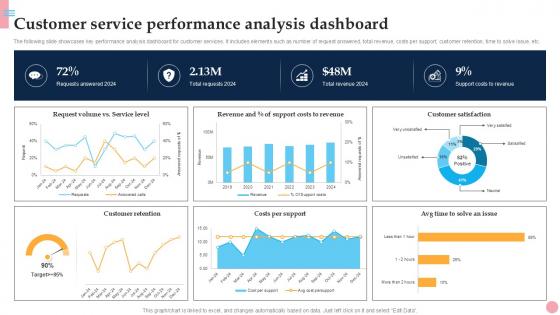
Customer Service Performance How To Improve Company PPT Sample Strategy SS V
The following slide showcases key performance analysis dashboard for customer services. It includes elements such as number of request answered, total revenue, costs per support, customer retention, time to solve issue, etc. Slidegeeks is here to make your presentations a breeze with Customer Service Performance How To Improve Company PPT Sample Strategy SS V With our easy-to-use and customizable templates, you can focus on delivering your ideas rather than worrying about formatting. With a variety of designs to choose from, you are sure to find one that suits your needs. And with animations and unique photos, illustrations, and fonts, you can make your presentation pop. So whether you are giving a sales pitch or presenting to the board, make sure to check out Slidegeeks first The following slide showcases key performance analysis dashboard for customer services. It includes elements such as number of request answered, total revenue, costs per support, customer retention, time to solve issue, etc.

Measuring Customer Satisfaction Improving Customer Retention PPT Template
The following slide covers KPI dashboard to evaluate customer satisfaction score. It includes elements such as requests answered, total revenue, service level, cost per support, retention rate, average time taken to resolve an issue etc. This modern and well-arranged Measuring Customer Satisfaction Improving Customer Retention PPT Template provides lots of creative possibilities. It is very simple to customize and edit with the Powerpoint Software. Just drag and drop your pictures into the shapes. All facets of this template can be edited with Powerpoint, no extra software is necessary. Add your own material, put your images in the places assigned for them, adjust the colors, and then you can show your slides to the world, with an animated slide included. The following slide covers KPI dashboard to evaluate customer satisfaction score. It includes elements such as requests answered, total revenue, service level, cost per support, retention rate, average time taken to resolve an issue etc.
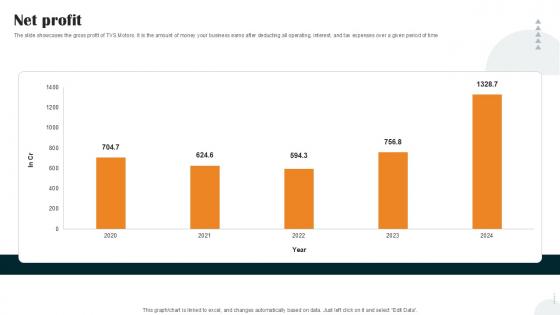
Net Profit Vehicle Manufacturer Company Profile PPT Slide CP SS V
The slide showcases the gross profit of TVS Motors. It is the amount of money your business earns after deducting all operating, interest, and tax expenses over a given period of time. This Net Profit Vehicle Manufacturer Company Profile PPT Slide CP SS V is perfect for any presentation, be it in front of clients or colleagues. It is a versatile and stylish solution for organizing your meetings. The Net Profit Vehicle Manufacturer Company Profile PPT Slide CP SS V features a modern design for your presentation meetings. The adjustable and customizable slides provide unlimited possibilities for acing up your presentation. Slidegeeks has done all the homework before launching the product for you. So, do not wait, grab the presentation templates today The slide showcases the gross profit of TVS Motors. It is the amount of money your business earns after deducting all operating, interest, and tax expenses over a given period of time
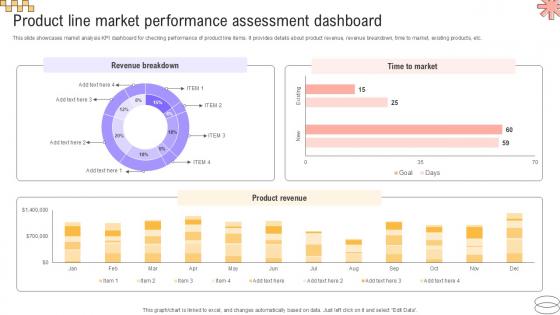
Product Line Market Performance Implementing Geographic Extension PPT Slide Strategy SS V
This slide showcases market analysis KPI dashboard for checking performance of product line items. It provides details about product revenue, revenue breakdown, time to market, existing products, etc. Take your projects to the next level with our ultimate collection of Product Line Market Performance Implementing Geographic Extension PPT Slide Strategy SS V. Slidegeeks has designed a range of layouts that are perfect for representing task or activity duration, keeping track of all your deadlines at a glance. Tailor these designs to your exact needs and give them a truly corporate look with your own brand colors they will make your projects stand out from the rest This slide showcases market analysis KPI dashboard for checking performance of product line items. It provides details about product revenue, revenue breakdown, time to market, existing products, etc.
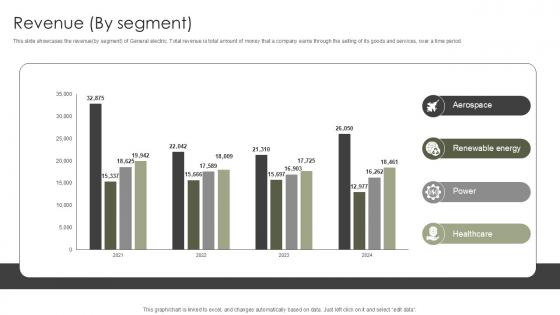
Revenue By Segment Military Aircraft Engine Manufacturing PPT Slide CP SS V
This slide showcases the revenueby segment of General electric. Total revenue is total amount of money that a company earns through the selling of its goods and services, over a time period. Slidegeeks is one of the best resources for PowerPoint templates. You can download easily and regulate Revenue By Segment Military Aircraft Engine Manufacturing PPT Slide CP SS V for your personal presentations from our wonderful collection. A few clicks is all it takes to discover and get the most relevant and appropriate templates. Use our Templates to add a unique zing and appeal to your presentation and meetings. All the slides are easy to edit and you can use them even for advertisement purposes. This slide showcases the revenueby segment of General electric. Total revenue is total amount of money that a company earns through the selling of its goods and services, over a time period.
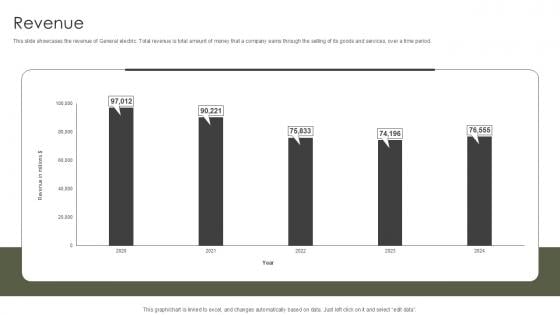
Revenue Military Aircraft Engine Manufacturing PPT PowerPoint CP SS V
This slide showcases the revenue of General electric. Total revenue is total amount of money that a company earns through the selling of its goods and services, over a time period. Want to ace your presentation in front of a live audience Our Revenue Military Aircraft Engine Manufacturing PPT PowerPoint CP SS V can help you do that by engaging all the users towards you. Slidegeeks experts have put their efforts and expertise into creating these impeccable powerpoint presentations so that you can communicate your ideas clearly. Moreover, all the templates are customizable, and easy-to-edit and downloadable. Use these for both personal and commercial use. This slide showcases the revenue of General electric. Total revenue is total amount of money that a company earns through the selling of its goods and services, over a time period.

Measuring Customer Satisfaction Enhancing Customer Experience Ppt Sample
The following slide covers KPI dashboard to evaluate customer satisfaction score. It includes elements such as requests answered, total revenue, service level, cost per support, retention rate, average time taken to resolve an issue etc. This modern and well-arranged Measuring Customer Satisfaction Enhancing Customer Experience Ppt Sample provides lots of creative possibilities. It is very simple to customize and edit with the Powerpoint Software. Just drag and drop your pictures into the shapes. All facets of this template can be edited with Powerpoint, no extra software is necessary. Add your own material, put your images in the places assigned for them, adjust the colors, and then you can show your slides to the world, with an animated slide included. The following slide covers KPI dashboard to evaluate customer satisfaction score. It includes elements such as requests answered, total revenue, service level, cost per support, retention rate, average time taken to resolve an issue etc.
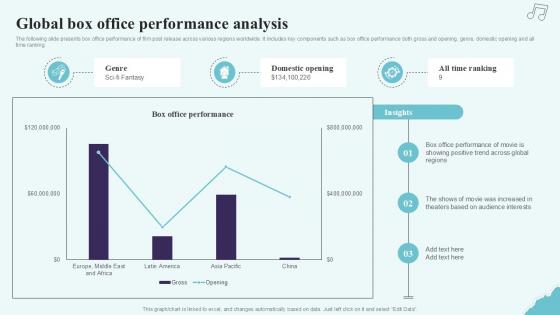
Global Box Office Performance Analysis Strategic Plan To Increase Film Ppt Example Strategy SS V
The following slide presents box office performance of film post release across various regions worldwide. It includes key components such as box office performance both gross and opening, genre, domestic opening and all time ranking. This modern and well-arranged Global Box Office Performance Analysis Strategic Plan To Increase Film Ppt Example Strategy SS V provides lots of creative possibilities. It is very simple to customize and edit with the Powerpoint Software. Just drag and drop your pictures into the shapes. All facets of this template can be edited with Powerpoint, no extra software is necessary. Add your own material, put your images in the places assigned for them, adjust the colors, and then you can show your slides to the world, with an animated slide included. The following slide presents box office performance of film post release across various regions worldwide. It includes key components such as box office performance both gross and opening, genre, domestic opening and all time ranking.
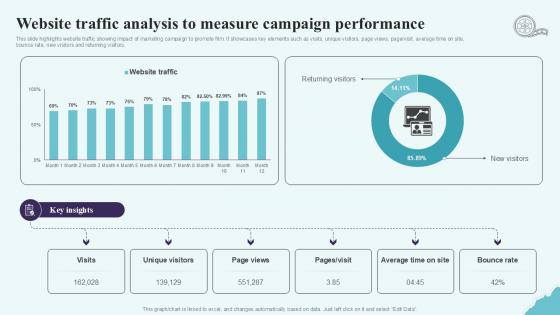
Website Traffic Analysis To Measure Strategic Plan To Increase Film Ppt Example Strategy SS V
This slide highlights website traffic showing impact of marketing campaign to promote film. It showcases key elements such as visits, unique visitors, page views, pageorvisit, average time on site, bounce rate, new visitors and returning visitors. Welcome to our selection of the Website Traffic Analysis To Measure Strategic Plan To Increase Film Ppt Example Strategy SS V. These are designed to help you showcase your creativity and bring your sphere to life. Planning and Innovation are essential for any business that is just starting out. This collection contains the designs that you need for your everyday presentations. All of our PowerPoints are 100Percent editable, so you can customize them to suit your needs. This multi-purpose template can be used in various situations. Grab these presentation templates today. This slide highlights website traffic showing impact of marketing campaign to promote film. It showcases key elements such as visits, unique visitors, page views, pageorvisit, average time on site, bounce rate, new visitors and returning visitors.
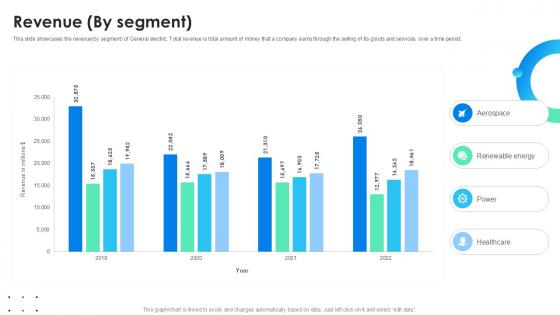
Revenue By Segment Global Energy Company Profile PPT Slide CP SS V
This slide showcases the revenueby segment of General electric. Total revenue is total amount of money that a company earns through the selling of its goods and services, over a time period. Slidegeeks is one of the best resources for PowerPoint templates. You can download easily and regulate Revenue By Segment Global Energy Company Profile PPT Slide CP SS V for your personal presentations from our wonderful collection. A few clicks is all it takes to discover and get the most relevant and appropriate templates. Use our Templates to add a unique zing and appeal to your presentation and meetings. All the slides are easy to edit and you can use them even for advertisement purposes. This slide showcases the revenueby segment of General electric. Total revenue is total amount of money that a company earns through the selling of its goods and services, over a time period.
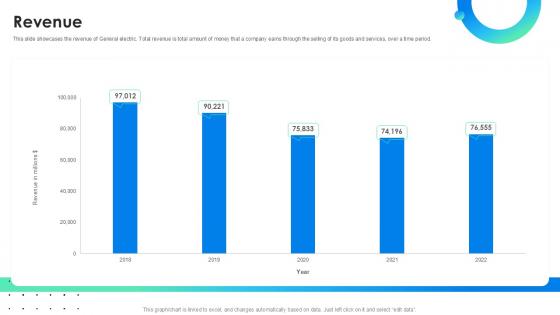
Revenue Global Energy Company Profile PPT Sample CP SS V
This slide showcases the revenue of General electric. Total revenue is total amount of money that a company earns through the selling of its goods and services, over a time period. Want to ace your presentation in front of a live audience Our Revenue Global Energy Company Profile PPT Sample CP SS V can help you do that by engaging all the users towards you. Slidegeeks experts have put their efforts and expertise into creating these impeccable powerpoint presentations so that you can communicate your ideas clearly. Moreover, all the templates are customizable, and easy-to-edit and downloadable. Use these for both personal and commercial use. This slide showcases the revenue of General electric. Total revenue is total amount of money that a company earns through the selling of its goods and services, over a time period.
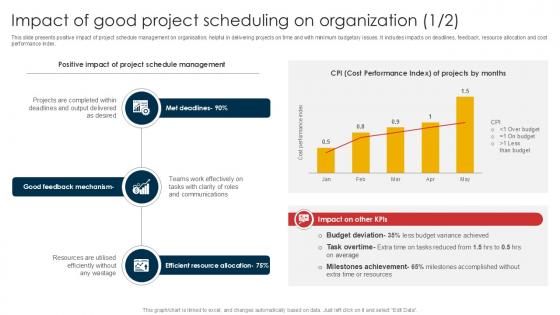
Impact Of Good Project Scheduling On Schedule Management Techniques PPT Template
This slide presents positive impact of project schedule management on organisation, helpful in delivering projects on time and with minimum budgetary issues. It includes impacts on deadlines, feedback, resource allocation and cost performance index. This modern and well-arranged Impact Of Good Project Scheduling On Schedule Management Techniques PPT Template provides lots of creative possibilities. It is very simple to customize and edit with the Powerpoint Software. Just drag and drop your pictures into the shapes. All facets of this template can be edited with Powerpoint, no extra software is necessary. Add your own material, put your images in the places assigned for them, adjust the colors, and then you can show your slides to the world, with an animated slide included. This slide presents positive impact of project schedule management on organisation, helpful in delivering projects on time and with minimum budgetary issues. It includes impacts on deadlines, feedback, resource allocation and cost performance index.

Project Cost And Performance Schedule Management Techniques PPT Example
This slide presents project cost and performance analysis dashboard, that highlights effectiveness of scheduling on output. It provides information on project cost, performance, stages and resource capacity compared with time. Slidegeeks has constructed Project Cost And Performance Schedule Management Techniques PPT Example after conducting extensive research and examination. These presentation templates are constantly being generated and modified based on user preferences and critiques from editors. Here, you will find the most attractive templates for a range of purposes while taking into account ratings and remarks from users regarding the content. This is an excellent jumping-off point to explore our content and will give new users an insight into our top-notch PowerPoint Templates. This slide presents project cost and performance analysis dashboard, that highlights effectiveness of scheduling on output. It provides information on project cost, performance, stages and resource capacity compared with time
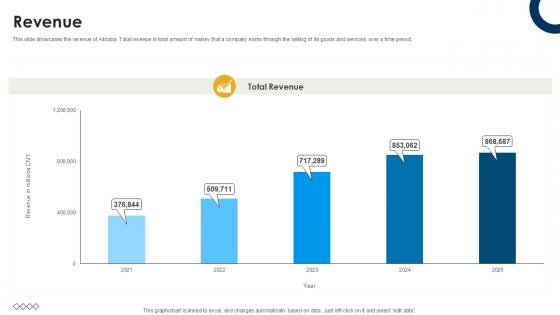
Revenue International Trade Of Products And Services PPT Slide CP SS V
This slide showcases the revenue of Alibaba. Total revenue is total amount of money that a company earns through the selling of its goods and services, over a time period. This Revenue International Trade Of Products And Services PPT Slide CP SS V from Slidegeeks makes it easy to present information on your topic with precision. It provides customization options, so you can make changes to the colors, design, graphics, or any other component to create a unique layout. It is also available for immediate download, so you can begin using it right away. Slidegeeks has done good research to ensure that you have everything you need to make your presentation stand out. Make a name out there for a brilliant performance. This slide showcases the revenue of Alibaba. Total revenue is total amount of money that a company earns through the selling of its goods and services, over a time period.
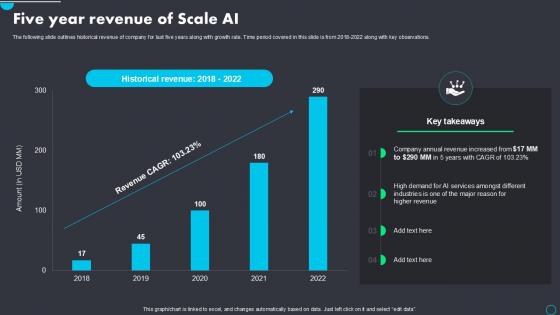
Implementing Scale AI Five Year Revenue Of Scale AI PPT Presentation AI SS V
The following slide outlines historical revenue of company for last five years along with growth rate. Time period covered in this slide is from 2018-2022 along with key observations. Do you have to make sure that everyone on your team knows about any specific topic I yes, then you should give Implementing Scale AI Five Year Revenue Of Scale AI PPT Presentation AI SS V a try. Our experts have put a lot of knowledge and effort into creating this impeccable Implementing Scale AI Five Year Revenue Of Scale AI PPT Presentation AI SS V. You can use this template for your upcoming presentations, as the slides are perfect to represent even the tiniest detail. You can download these templates from the Slidegeeks website and these are easy to edit. So grab these today The following slide outlines historical revenue of company for last five years along with growth rate. Time period covered in this slide is from 2018-2022 along with key observations.
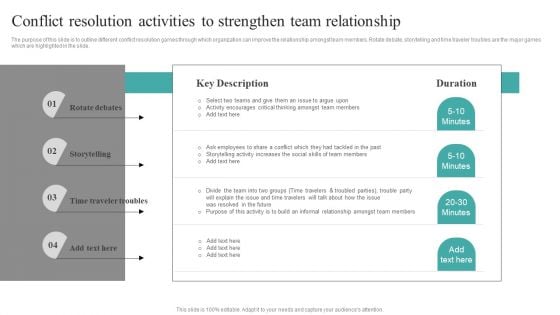
Common Conflict Situations Conflict Resolution Activities To Strengthen Team Relationship Diagrams PDF
The purpose of this slide is to outline different conflict resolution games through which organization can improve the relationship amongst team members. Rotate debate, storytelling and time traveler troubles are the major games which are highlighted in the slide. Find highly impressive Common Conflict Situations Conflict Resolution Activities To Strengthen Team Relationship Diagrams PDF on Slidegeeks to deliver a meaningful presentation. You can save an ample amount of time using these presentation templates. No need to worry to prepare everything from scratch because Slidegeeks experts have already done a huge research and work for you. You need to download Common Conflict Situations Conflict Resolution Activities To Strengthen Team Relationship Diagrams PDF for your upcoming presentation. All the presentation templates are 100 percent editable and you can change the color and personalize the content accordingly. Download now.


 Continue with Email

 Home
Home


