Timeline Dashboard
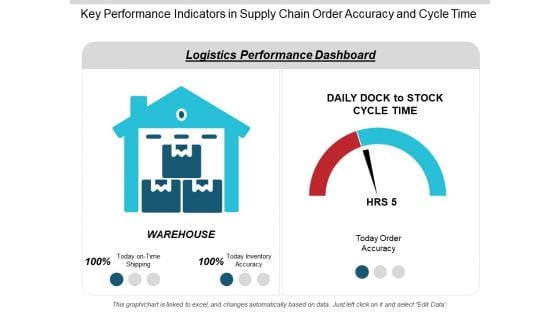
Key Performance Indicators In Supply Chain Order Accuracy And Cycle Time Ppt PowerPoint Presentation Infographics Slideshow
This is a key performance indicators in supply chain order accuracy and cycle time ppt powerpoint presentation infographics slideshow. This is a two stage process. The stages in this process are logistics performance, logistics dashboard, logistics kpis.
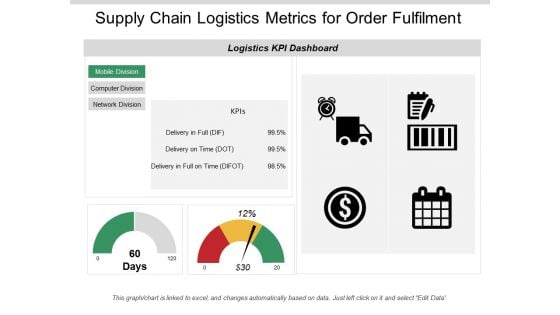
Supply Chain Logistics Metrics For Order Fulfilment Ppt PowerPoint Presentation Infographic Template Information
This is a supply chain logistics metrics for order fulfilment ppt powerpoint presentation infographic template information. This is a two stage process. The stages in this process are logistics performance, logistics dashboard, logistics kpis.
Business Trends Bar Chart Vector Icon Ppt PowerPoint Presentation Inspiration Graphic Images PDF
Persuade your audience using this business trends bar chart vector icon ppt powerpoint presentation inspiration graphic images pdf. This PPT design covers three stages, thus making it a great tool to use. It also caters to a variety of topics including business trends bar chart vector icon. Download this PPT design now to present a convincing pitch that not only emphasizes the topic but also showcases your presentation skills.
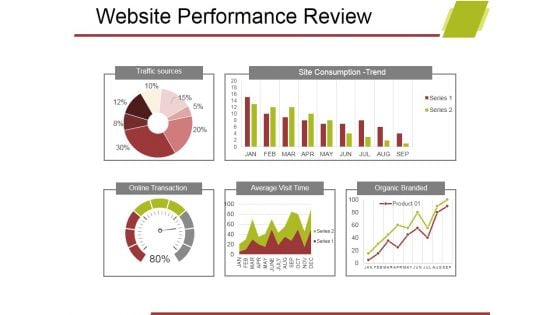
Website Performance Review Template 1 Ppt PowerPoint Presentation Portfolio Master Slide
This is a website performance review template 1 ppt powerpoint presentation portfolio master slide. This is a five stage process. The stages in this process are traffic sources, site consumption trend, online transaction, average visit time, organic branded.
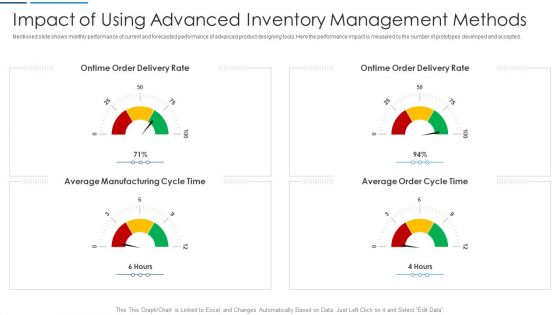
Information Technology Transformation Impact Of Using Advanced Inventory Management Methods Time Guidelines PDF
Mentioned slide shows monthly performance of current and forecasted performance of advanced product designing tools. Here the performance impact is measured by the number of prototypes developed and accepted. This is a information technology transformation impact of using advanced inventory management methods time guidelines pdf template with various stages. Focus and dispense information on four stages using this creative set, that comes with editable features. It contains large content boxes to add your information on topics like average manufacturing cycle, average order cycle time, inventory management. You can also showcase facts, figures, and other relevant content using this PPT layout. Grab it now.
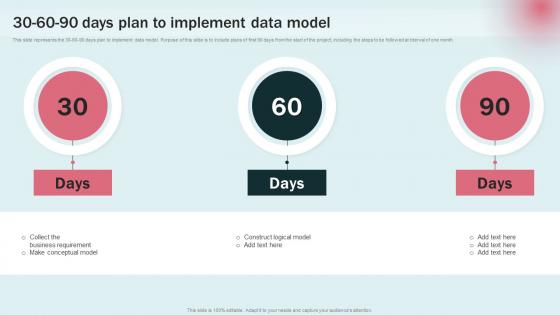
30 60 90 Days Plan To Implement Data Modeling Approaches For Modern Analytics Guidelines Pdf
This slide represents the 30 60 90 days plan to implement data model. Purpose of this slide is to include plans of first 90 days from the start of the project, including the steps to be followed at interval of one month. Find a pre designed and impeccable 30 60 90 Days Plan To Implement Data Modeling Approaches For Modern Analytics Guidelines Pdf. The templates can ace your presentation without additional effort. You can download these easy to edit presentation templates to make your presentation stand out from others. So, what are you waiting for Download the template from Slidegeeks today and give a unique touch to your presentation. This slide represents the 30 60 90 days plan to implement data model. Purpose of this slide is to include plans of first 90 days from the start of the project, including the steps to be followed at interval of one month.
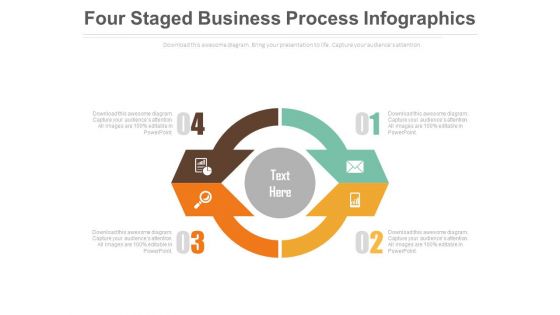
Four Steps Circular Infographic Powerpoint Slides
This innovative, stunningly beautiful dashboard has been designed for data visualization. It contains circular infographic design. This PowerPoint template helps to display your information in a useful, simple and orderly way.
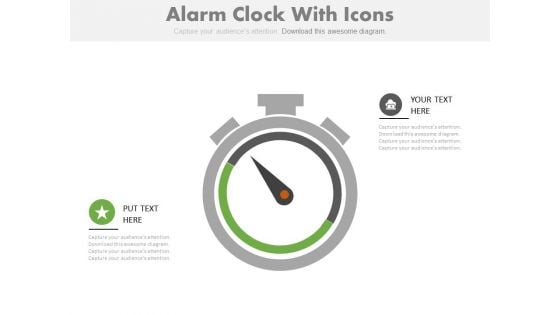
Stopwatch For Speed Calculation Powerpoint Slides
This innovative, stunningly beautiful dashboard has been designed for speed calculation. It contains graphics of stopwatch. This PowerPoint template helps to display your information in a useful, simple and orderly way.
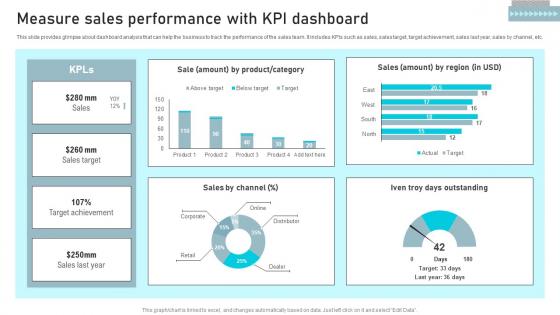
Measure Sales Performance With Business Sales Enhancement Campaign Inspiration Pdf
This slide provides glimpse about dashboard analysis that can help the business to track the performance of the sales team. It includes KPIs such as sales, sales target, target achievement, sales last year, sales by channel, etc. The Measure Sales Performance With Business Sales Enhancement Campaign Inspiration Pdf is a compilation of the most recent design trends as a series of slides. It is suitable for any subject or industry presentation, containing attractive visuals and photo spots for businesses to clearly express their messages. This template contains a variety of slides for the user to input data, such as structures to contrast two elements, bullet points, and slides for written information. Slidegeeks is prepared to create an impression. This slide provides glimpse about dashboard analysis that can help the business to track the performance of the sales team. It includes KPIs such as sales, sales target, target achievement, sales last year, sales by channel, etc.
Market Trends Chart With Icons Powerpoint Slides
This PowerPoint template has been designed with business info graphic chart. You may use this business slide design to display market trends. This PPT slide is powerful tool to describe your ideas.
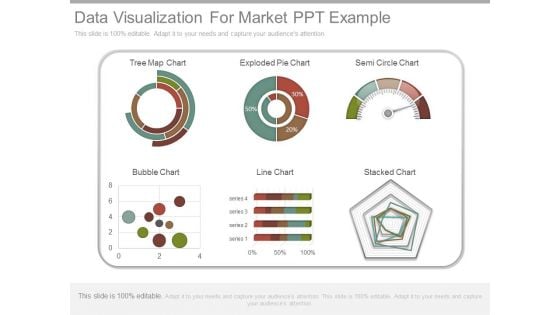
Data Visualization For Market Ppt Example
This is a data visualization for market ppt example. This is a six stage process. The stages in this process are tree map chart, exploded pie chart, semi circle chart, bubble chart, line chart, stacked chart, series.
Circle Diagram With Team Icon Powerpoint Slides
This PowerPoint template has been designed with circle diagram and team icons. You may download this PPT slide to display team planning and strategy. This PowerPoint template helps to display your information in a useful, simple and orderly way.
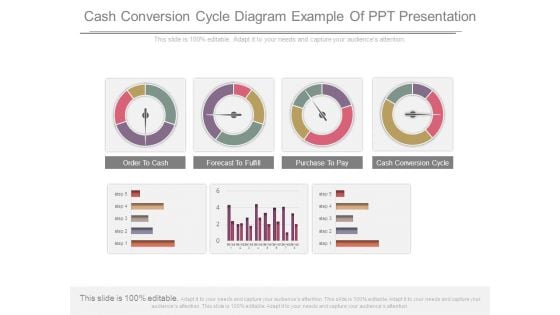
Cash Conversion Cycle Diagram Example Of Ppt Presentation
This is a cash conversion cycle diagram example of ppt presentation. This is a four stage process. The stages in this process are order to cash, forecast to fulfill, purchase to pay, cash conversion cycle.
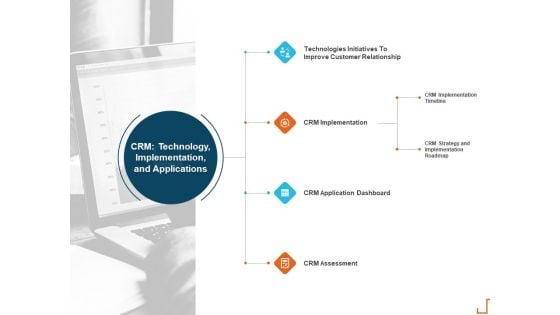
Introducing CRM Framework Within Organization CRM Technology Implementation And Applications Inspiration PDF
Presenting this set of slides with name introducing crm framework within organization crm technology implementation and applications inspiration pdf. This is a four stage process. The stages in this process are technologies initiatives to improve customer relationship, crm implementation, crm application dashboard, crm assessment, crm implementation timeline, crm strategy and implementation roadmap. This is a completely editable PowerPoint presentation and is available for immediate download. Download now and impress your audience.
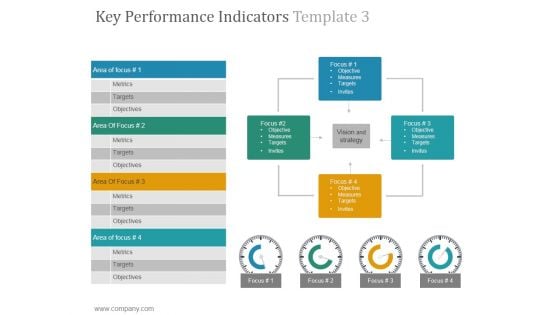
Key Performance Indicators Template 3 Ppt PowerPoint Presentation Graphics
This is a key performance indicators template 3 ppt powerpoint presentation graphics. This is a four stage process. The stages in this process are objective, measures, targets, invites, vision and strategy.
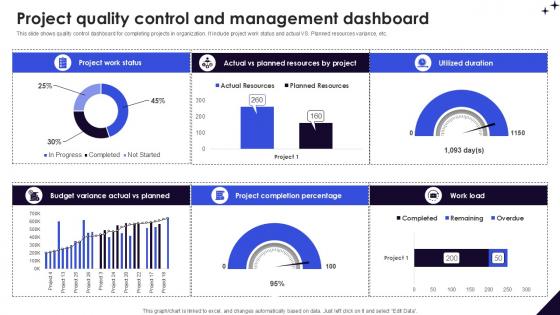
Project Quality Control And Management DMAIC Methodology To Maintain PPT Sample
This slide shows quality control dashboard for completing projects in organization. It include project work status and actual VS. Planned resources variance, etc. The Project Quality Control And Management DMAIC Methodology To Maintain PPT Sample is a compilation of the most recent design trends as a series of slides. It is suitable for any subject or industry presentation, containing attractive visuals and photo spots for businesses to clearly express their messages. This template contains a variety of slides for the user to input data, such as structures to contrast two elements, bullet points, and slides for written information. Slidegeeks is prepared to create an impression. This slide shows quality control dashboard for completing projects in organization. It include project work status and actual VS. Planned resources variance, etc.
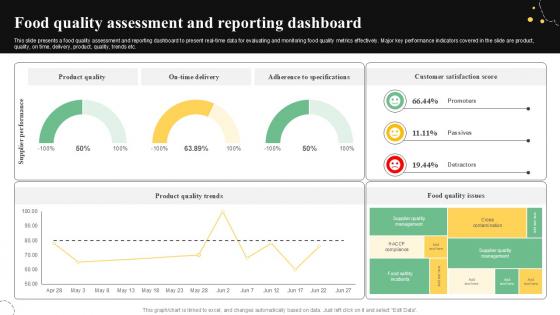
Food Quality Assessment And Reporting Quality Control Guide For Food PPT Sample
This slide presents a food quality assessment and reporting dashboard to present real-time data for evaluating and monitoring food quality metrics effectively. Major key performance indicators covered in the slide are product, quality, on time, delivery, product, quality, trends etc. Crafting an eye-catching presentation has never been more straightforward. Let your presentation shine with this tasteful yet straightforward Food Quality Assessment And Reporting Quality Control Guide For Food PPT Sample template. It offers a minimalistic and classy look that is great for making a statement. The colors have been employed intelligently to add a bit of playfulness while still remaining professional. Construct the ideal Food Quality Assessment And Reporting Quality Control Guide For Food PPT Sample that effortlessly grabs the attention of your audience Begin now and be certain to wow your customers This slide presents a food quality assessment and reporting dashboard to present real-time data for evaluating and monitoring food quality metrics effectively. Major key performance indicators covered in the slide are product, quality, on time, delivery, product, quality, trends etc.
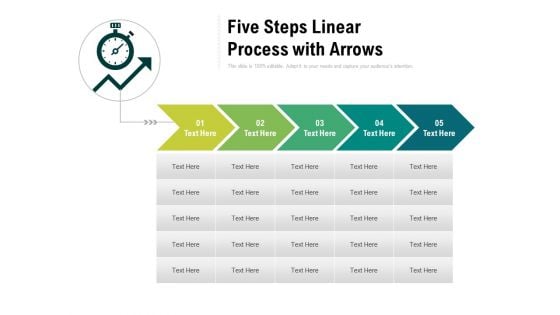
Five Steps Linear Process With Arrows Ppt PowerPoint Presentation Gallery Smartart PDF
Presenting this set of slides with name five steps linear process with arrows ppt powerpoint presentation gallery smartart pdf. This is a five stage process. The stages in this process are five steps linear process with arrows. This is a completely editable PowerPoint presentation and is available for immediate download. Download now and impress your audience.
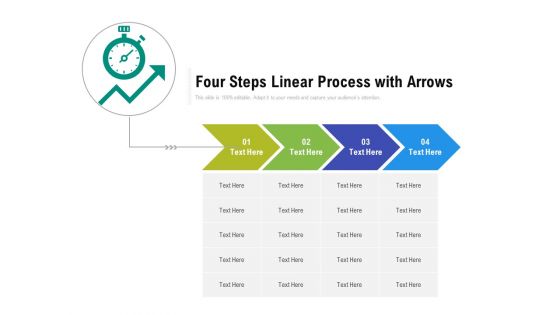
Four Steps Linear Process With Arrows Ppt PowerPoint Presentation File Clipart PDF
Presenting this set of slides with name four steps linear process with arrows ppt powerpoint presentation file clipart pdf. This is a four stage process. The stages in this process are four steps linear process with arrows. This is a completely editable PowerPoint presentation and is available for immediate download. Download now and impress your audience.
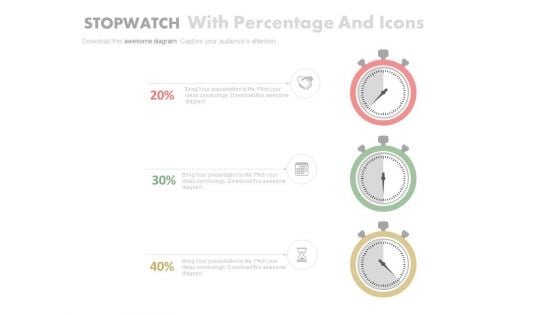
Three Stopwatches To Display Profit Trends Powerpoint Slides
This PowerPoint template has been designed with graphics of three stopwatches. Use this PPT slide to depict profit trends. Download this template to make impressive presentations.

Net Promoter Score Kpn Diagram Powerpoint Show
This is a net promoter score kpn diagram powerpoint show. This is a three stage process. The stages in this process are net promoter score, criticasters, passief tevredenen, promoters, spreiding van de antwoorden.
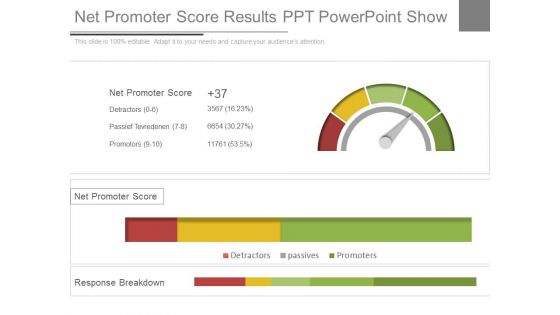
Net Promoter Score Results Ppt Powerpoint Show
This is a net promoter score results ppt powerpoint show. This is a five stage process. The stages in this process are net promoter score, detractors, passief tevredenen, promotors, passives, response breakdown.
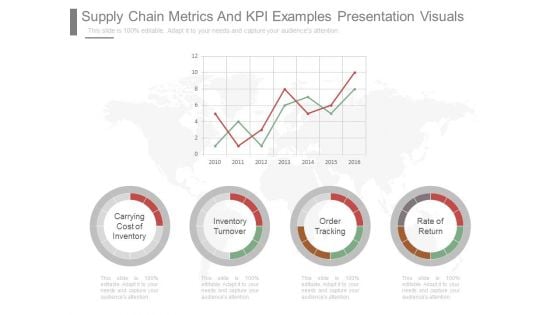
Supply Chain Metrics And Kpi Examples Presentation Visuals
This is a supply chain metrics and kpi examples presentation visuals. This is a four stage process. The stages in this process are carrying cost of inventory, inventory turnover, order tracking, rate of return.
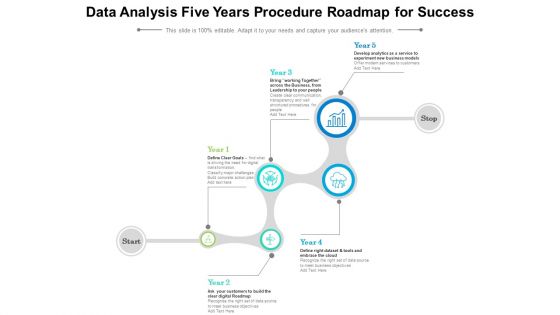
Data Analysis Five Years Procedure Roadmap For Success Slides
We present our data analysis five years procedure roadmap for success slides. This PowerPoint layout is easy to edit so you can change the font size, font type, color, and shape conveniently. In addition to this, the PowerPoint layout is Google Slides compatible, so you can share it with your audience and give them access to edit it. Therefore, download and save this well researched data analysis five years procedure roadmap for success slides in different formats like PDF, PNG, and JPG to smoothly execute your business plan.
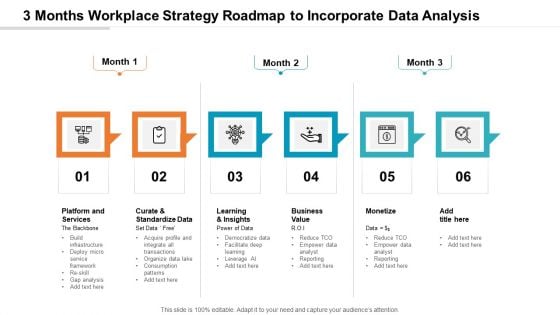
3 Months Workplace Strategy Roadmap To Incorporate Data Analysis Slides
Presenting our jaw-dropping 3 months workplace strategy roadmap to incorporate data analysis slides. You can alternate the color, font size, font type, and shapes of this PPT layout according to your strategic process. This PPT presentation is compatible with Google Slides and is available in both standard screen and widescreen aspect ratios. You can also download this well-researched PowerPoint template design in different formats like PDF, JPG, and PNG. So utilize this visually-appealing design by clicking the download button given below.
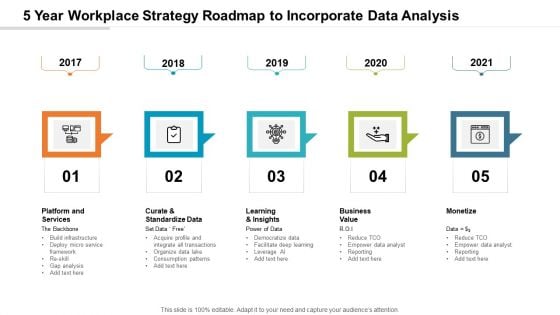
5 Year Workplace Strategy Roadmap To Incorporate Data Analysis Slides
Presenting our jaw-dropping 5 year workplace strategy roadmap to incorporate data analysis slides. You can alternate the color, font size, font type, and shapes of this PPT layout according to your strategic process. This PPT presentation is compatible with Google Slides and is available in both standard screen and widescreen aspect ratios. You can also download this well-researched PowerPoint template design in different formats like PDF, JPG, and PNG. So utilize this visually-appealing design by clicking the download button given below.
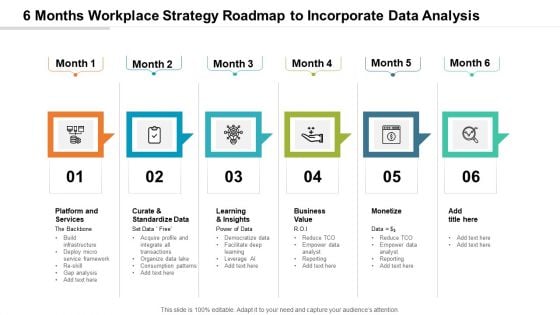
6 Months Workplace Strategy Roadmap To Incorporate Data Analysis Structure
Presenting our jaw-dropping 6 months workplace strategy roadmap to incorporate data analysis structure. You can alternate the color, font size, font type, and shapes of this PPT layout according to your strategic process. This PPT presentation is compatible with Google Slides and is available in both standard screen and widescreen aspect ratios. You can also download this well-researched PowerPoint template design in different formats like PDF, JPG, and PNG. So utilize this visually-appealing design by clicking the download button given below.
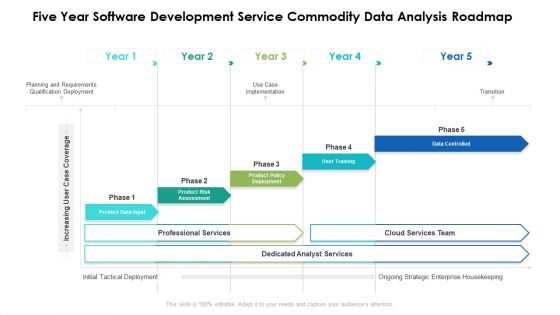
Five Year Software Development Service Commodity Data Analysis Roadmap Clipart
Presenting our innovatively structured five year software development service commodity data analysis roadmap clipart Template. Showcase your roadmap process in different formats like PDF, PNG, and JPG by clicking the download button below. This PPT design is available in both Standard Screen and Widescreen aspect ratios. It can also be easily personalized and presented with modified font size, font type, color, and shapes to measure your progress in a clear way.
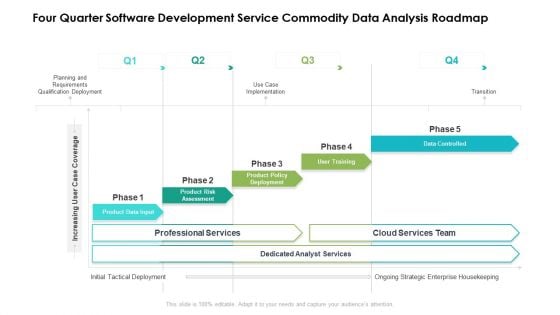
Four Quarter Software Development Service Commodity Data Analysis Roadmap Brochure
Presenting our innovatively structured four quarter software development service commodity data analysis roadmap brochure Template. Showcase your roadmap process in different formats like PDF, PNG, and JPG by clicking the download button below. This PPT design is available in both Standard Screen and Widescreen aspect ratios. It can also be easily personalized and presented with modified font size, font type, color, and shapes to measure your progress in a clear way.
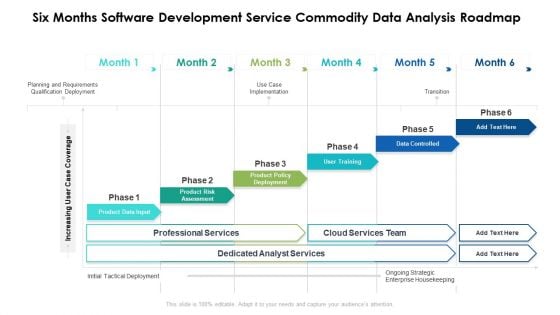
Six Months Software Development Service Commodity Data Analysis Roadmap Introduction
Presenting our innovatively structured six months software development service commodity data analysis roadmap introduction Template. Showcase your roadmap process in different formats like PDF, PNG, and JPG by clicking the download button below. This PPT design is available in both Standard Screen and Widescreen aspect ratios. It can also be easily personalized and presented with modified font size, font type, color, and shapes to measure your progress in a clear way.
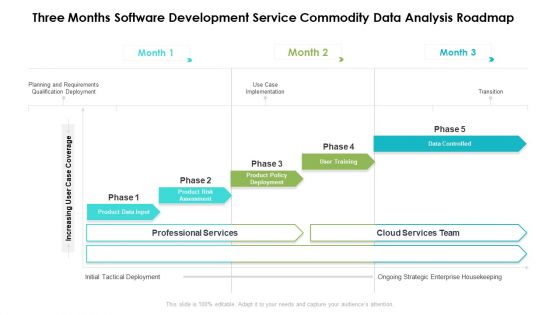
Three Months Software Development Service Commodity Data Analysis Roadmap Clipart
Presenting our innovatively structured three months software development service commodity data analysis roadmap clipart Template. Showcase your roadmap process in different formats like PDF, PNG, and JPG by clicking the download button below. This PPT design is available in both Standard Screen and Widescreen aspect ratios. It can also be easily personalized and presented with modified font size, font type, color, and shapes to measure your progress in a clear way.
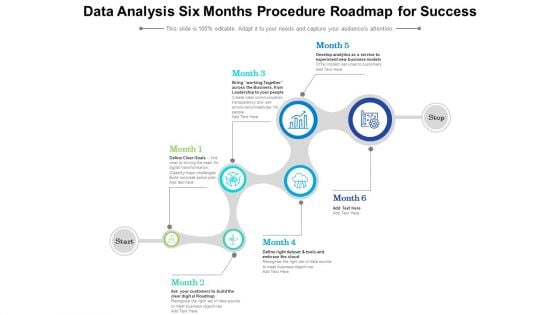
Data Analysis Six Months Procedure Roadmap For Success Ideas
Presenting our innovatively structured data analysis six months procedure roadmap for success ideas Template. Showcase your roadmap process in different formats like PDF, PNG, and JPG by clicking the download button below. This PPT design is available in both Standard Screen and Widescreen aspect ratios. It can also be easily personalized and presented with modified font size, font type, color, and shapes to measure your progress in a clear way.
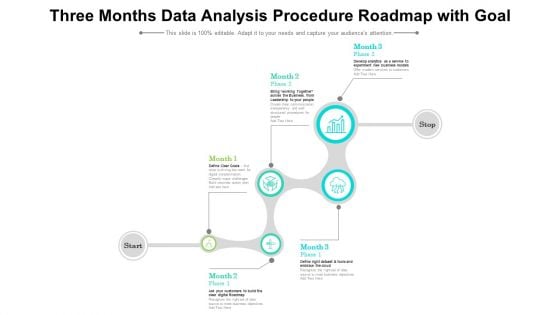
Three Months Data Analysis Procedure Roadmap With Goal Formats
Presenting our innovatively structured three months data analysis procedure roadmap with goal formats Template. Showcase your roadmap process in different formats like PDF, PNG, and JPG by clicking the download button below. This PPT design is available in both Standard Screen and Widescreen aspect ratios. It can also be easily personalized and presented with modified font size, font type, color, and shapes to measure your progress in a clear way.
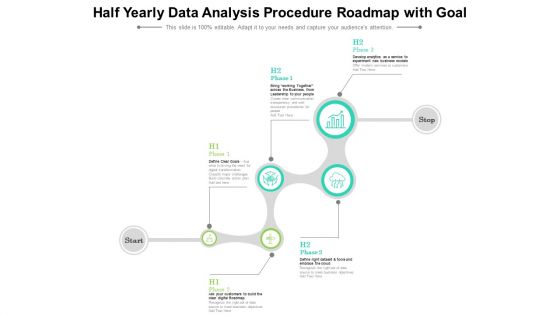
Half Yearly Data Analysis Procedure Roadmap With Goal Summary
Introducing our half yearly data analysis procedure roadmap with goal summary. This PPT presentation is Google Slides compatible, therefore, you can share it easily with the collaborators for measuring the progress. Also, the presentation is available in both standard screen and widescreen aspect ratios. So edit the template design by modifying the font size, font type, color, and shapes as per your requirements. As this PPT design is fully editable it can be presented in PDF, JPG and PNG formats.
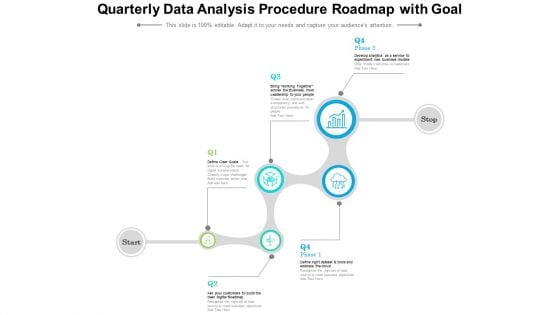
Quarterly Data Analysis Procedure Roadmap With Goal Summary
Introducing our quarterly data analysis procedure roadmap with goal summary. This PPT presentation is Google Slides compatible, therefore, you can share it easily with the collaborators for measuring the progress. Also, the presentation is available in both standard screen and widescreen aspect ratios. So edit the template design by modifying the font size, font type, color, and shapes as per your requirements. As this PPT design is fully editable it can be presented in PDF, JPG and PNG formats.
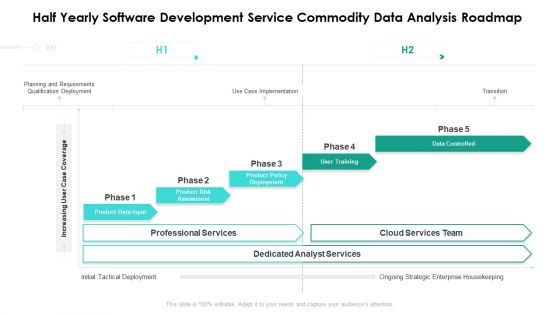
Half Yearly Software Development Service Commodity Data Analysis Roadmap Rules
Presenting the half yearly software development service commodity data analysis roadmap rules. The template includes a roadmap that can be used to initiate a strategic plan. Not only this, the PowerPoint slideshow is completely editable and you can effortlessly modify the font size, font type, and shapes according to your needs. This PPT slide can be easily reached in standard screen and widescreen aspect ratios. The set is also available in various formats like PDF, PNG, and JPG. So download and use it multiple times as per your knowledge.
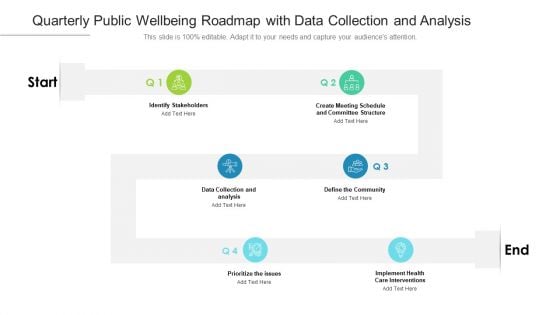
Quarterly Public Wellbeing Roadmap With Data Collection And Analysis Clipart
Presenting the quarterly public wellbeing roadmap with data collection and analysis clipart. The template includes a roadmap that can be used to initiate a strategic plan. Not only this, the PowerPoint slideshow is completely editable and you can effortlessly modify the font size, font type, and shapes according to your needs. This PPT slide can be easily reached in standard screen and widescreen aspect ratios. The set is also available in various formats like PDF, PNG, and JPG. So download and use it multiple times as per your knowledge.
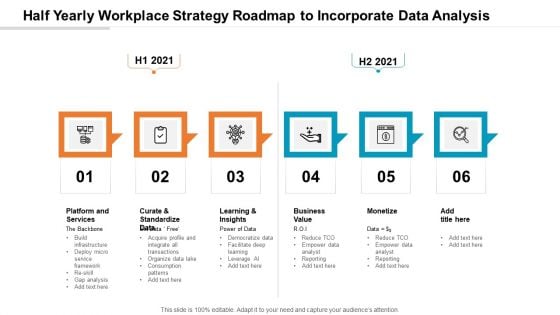
Half Yearly Workplace Strategy Roadmap To Incorporate Data Analysis Demonstration
Presenting the half yearly workplace strategy roadmap to incorporate data analysis demonstration. The template includes a roadmap that can be used to initiate a strategic plan. Not only this, the PowerPoint slideshow is completely editable and you can effortlessly modify the font size, font type, and shapes according to your needs. This PPT slide can be easily reached in standard screen and widescreen aspect ratios. The set is also available in various formats like PDF, PNG, and JPG. So download and use it multiple times as per your knowledge.
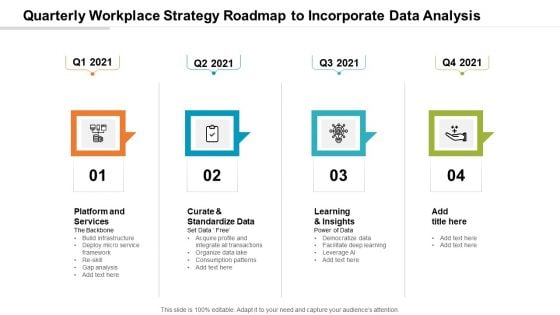
Quarterly Workplace Strategy Roadmap To Incorporate Data Analysis Download
Presenting the quarterly workplace strategy roadmap to incorporate data analysis download. The template includes a roadmap that can be used to initiate a strategic plan. Not only this, the PowerPoint slideshow is completely editable and you can effortlessly modify the font size, font type, and shapes according to your needs. This PPT slide can be easily reached in standard screen and widescreen aspect ratios. The set is also available in various formats like PDF, PNG, and JPG. So download and use it multiple times as per your knowledge.
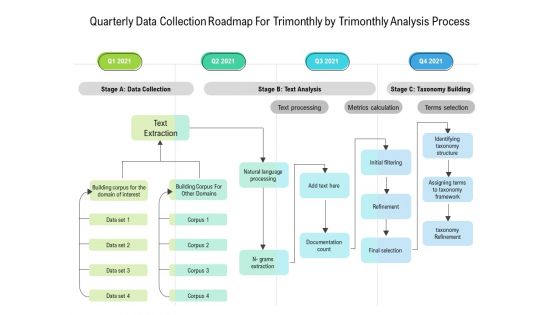
Quarterly Data Collection Roadmap For Trimonthly By Trimonthly Analysis Process Information
We present our quarterly data collection roadmap for trimonthly by trimonthly analysis process information. This PowerPoint layout is easy to edit so you can change the font size, font type, color, and shape conveniently. In addition to this, the PowerPoint layout is Google Slides compatible, so you can share it with your audience and give them access to edit it. Therefore, download and save this well researched quarterly data collection roadmap for trimonthly by trimonthly analysis process information in different formats like PDF, PNG, and JPG to smoothly execute your business plan.
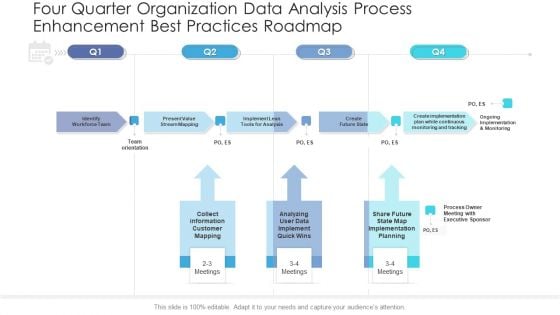
Four Quarter Organization Data Analysis Process Enhancement Best Practices Roadmap Demonstration
We present our four quarter organization data analysis process enhancement best practices roadmap demonstration. This PowerPoint layout is easy to edit so you can change the font size, font type, color, and shape conveniently. In addition to this, the PowerPoint layout is Google Slides compatible, so you can share it with your audience and give them access to edit it. Therefore, download and save this well researched four quarter organization data analysis process enhancement best practices roadmap demonstration in different formats like PDF, PNG, and JPG to smoothly execute your business plan.
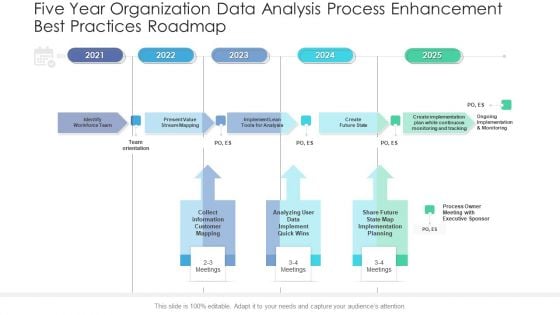
Five Year Organization Data Analysis Process Enhancement Best Practices Roadmap Rules
Presenting our innovatively structured five year organization data analysis process enhancement best practices roadmap rules Template. Showcase your roadmap process in different formats like PDF, PNG, and JPG by clicking the download button below. This PPT design is available in both Standard Screen and Widescreen aspect ratios. It can also be easily personalized and presented with modified font size, font type, color, and shapes to measure your progress in a clear way.
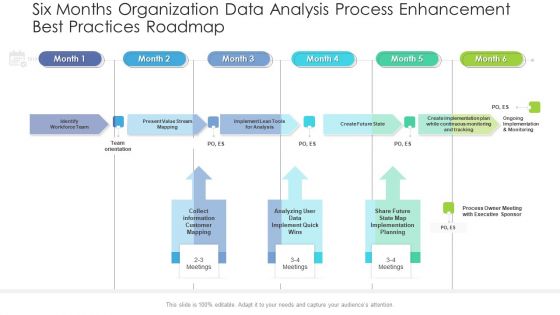
Six Months Organization Data Analysis Process Enhancement Best Practices Roadmap Inspiration
Presenting our innovatively structured six months organization data analysis process enhancement best practices roadmap inspiration Template. Showcase your roadmap process in different formats like PDF, PNG, and JPG by clicking the download button below. This PPT design is available in both Standard Screen and Widescreen aspect ratios. It can also be easily personalized and presented with modified font size, font type, color, and shapes to measure your progress in a clear way.
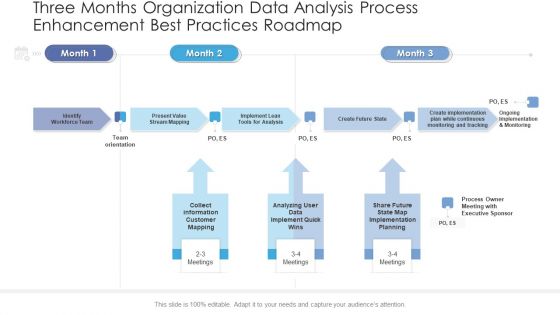
Three Months Organization Data Analysis Process Enhancement Best Practices Roadmap Portrait
Presenting our innovatively structured three months organization data analysis process enhancement best practices roadmap portrait Template. Showcase your roadmap process in different formats like PDF, PNG, and JPG by clicking the download button below. This PPT design is available in both Standard Screen and Widescreen aspect ratios. It can also be easily personalized and presented with modified font size, font type, color, and shapes to measure your progress in a clear way.
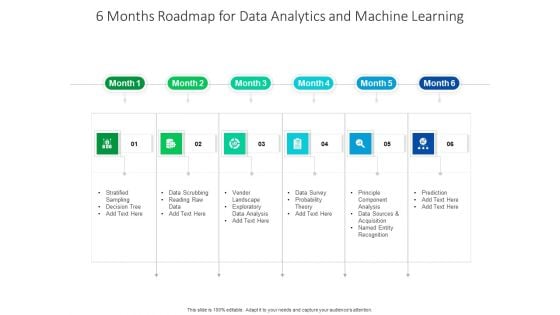
6 Months Roadmap For Data Analytics And Machine Learning Rules
Introducing our 6 months roadmap for data analytics and machine learning rules. This PPT presentation is Google Slides compatible, therefore, you can share it easily with the collaborators for measuring the progress. Also, the presentation is available in both standard screen and widescreen aspect ratios. So edit the template design by modifying the font size, font type, color, and shapes as per your requirements. As this PPT design is fully editable it can be presented in PDF, JPG and PNG formats.
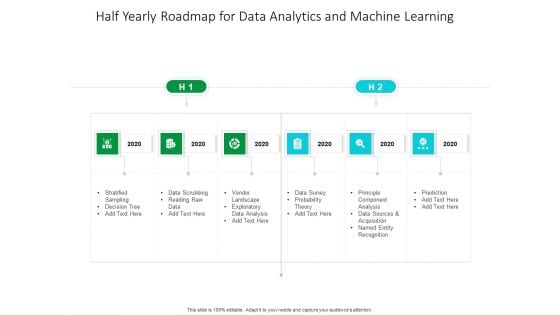
Half Yearly Roadmap For Data Analytics And Machine Learning Diagrams
Introducing our half yearly roadmap for data analytics and machine learning diagrams. This PPT presentation is Google Slides compatible, therefore, you can share it easily with the collaborators for measuring the progress. Also, the presentation is available in both standard screen and widescreen aspect ratios. So edit the template design by modifying the font size, font type, color, and shapes as per your requirements. As this PPT design is fully editable it can be presented in PDF, JPG and PNG formats.
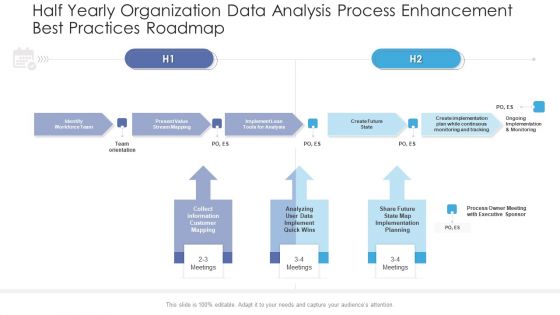
Half Yearly Organization Data Analysis Process Enhancement Best Practices Roadmap Portrait
Presenting the half yearly organization data analysis process enhancement best practices roadmap portrait. The template includes a roadmap that can be used to initiate a strategic plan. Not only this, the PowerPoint slideshow is completely editable and you can effortlessly modify the font size, font type, and shapes according to your needs. This PPT slide can be easily reached in standard screen and widescreen aspect ratios. The set is also available in various formats like PDF, PNG, and JPG. So download and use it multiple times as per your knowledge.
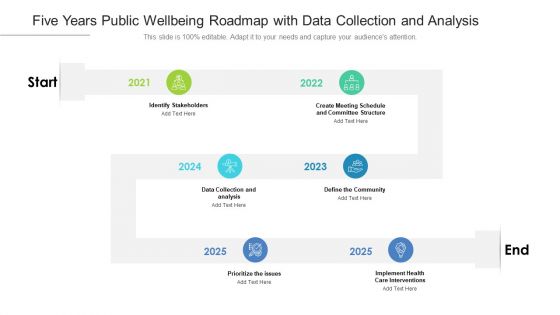
Five Years Public Wellbeing Roadmap With Data Collection And Analysis Topics
Presenting the five years public wellbeing roadmap with data collection and analysis topics. The template includes a roadmap that can be used to initiate a strategic plan. Not only this, the PowerPoint slideshow is completely editable and you can effortlessly modify the font size, font type, and shapes according to your needs. This PPT slide can be easily reached in standard screen and widescreen aspect ratios. The set is also available in various formats like PDF, PNG, and JPG. So download and use it multiple times as per your knowledge.
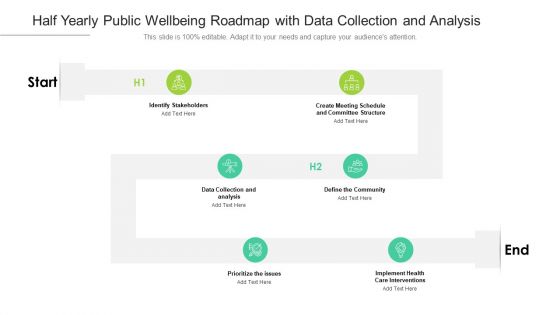
Half Yearly Public Wellbeing Roadmap With Data Collection And Analysis Graphics
Presenting the half yearly public wellbeing roadmap with data collection and analysis graphics. The template includes a roadmap that can be used to initiate a strategic plan. Not only this, the PowerPoint slideshow is completely editable and you can effortlessly modify the font size, font type, and shapes according to your needs. This PPT slide can be easily reached in standard screen and widescreen aspect ratios. The set is also available in various formats like PDF, PNG, and JPG. So download and use it multiple times as per your knowledge.
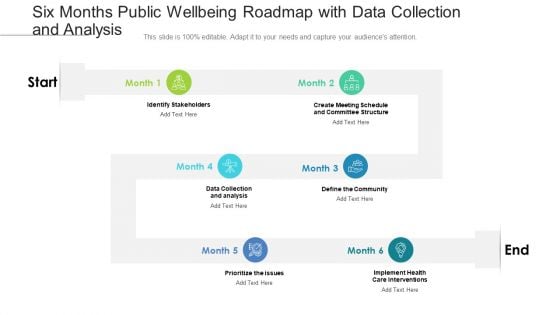
Six Months Public Wellbeing Roadmap With Data Collection And Analysis Clipart
Presenting the six months public wellbeing roadmap with data collection and analysis clipart. The template includes a roadmap that can be used to initiate a strategic plan. Not only this, the PowerPoint slideshow is completely editable and you can effortlessly modify the font size, font type, and shapes according to your needs. This PPT slide can be easily reached in standard screen and widescreen aspect ratios. The set is also available in various formats like PDF, PNG, and JPG. So download and use it multiple times as per your knowledge.
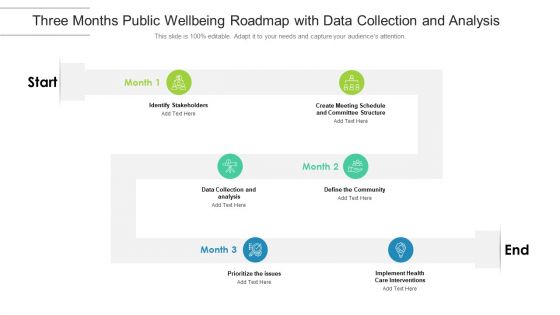
Three Months Public Wellbeing Roadmap With Data Collection And Analysis Guidelines
Presenting the three months public wellbeing roadmap with data collection and analysis guidelines. The template includes a roadmap that can be used to initiate a strategic plan. Not only this, the PowerPoint slideshow is completely editable and you can effortlessly modify the font size, font type, and shapes according to your needs. This PPT slide can be easily reached in standard screen and widescreen aspect ratios. The set is also available in various formats like PDF, PNG, and JPG. So download and use it multiple times as per your knowledge.
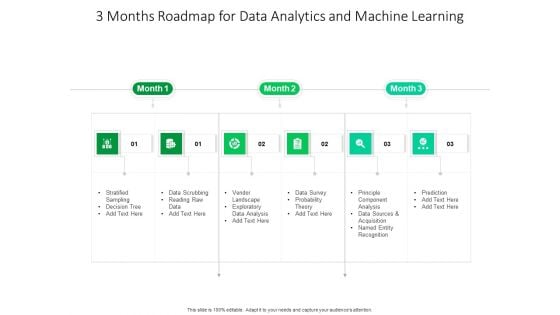
3 Months Roadmap For Data Analytics And Machine Learning Formats
Presenting the 3 months roadmap for data analytics and machine learning formats. The template includes a roadmap that can be used to initiate a strategic plan. Not only this, the PowerPoint slideshow is completely editable and you can effortlessly modify the font size, font type, and shapes according to your needs. This PPT slide can be easily reached in standard screen and widescreen aspect ratios. The set is also available in various formats like PDF, PNG, and JPG. So download and use it multiple times as per your knowledge.

5 Year Roadmap For Data Analytics And Machine Learning Elements
Presenting the 5 year roadmap for data analytics and machine learning elements. The template includes a roadmap that can be used to initiate a strategic plan. Not only this, the PowerPoint slideshow is completely editable and you can effortlessly modify the font size, font type, and shapes according to your needs. This PPT slide can be easily reached in standard screen and widescreen aspect ratios. The set is also available in various formats like PDF, PNG, and JPG. So download and use it multiple times as per your knowledge.
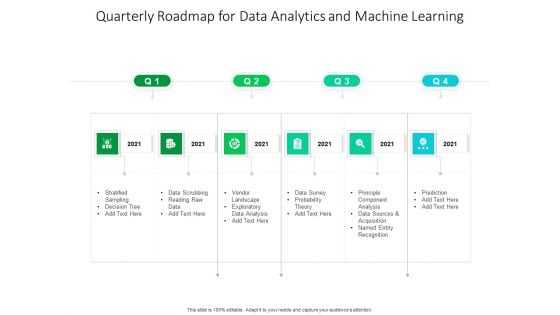
Quarterly Roadmap For Data Analytics And Machine Learning Information
Presenting the quarterly roadmap for data analytics and machine learning information. The template includes a roadmap that can be used to initiate a strategic plan. Not only this, the PowerPoint slideshow is completely editable and you can effortlessly modify the font size, font type, and shapes according to your needs. This PPT slide can be easily reached in standard screen and widescreen aspect ratios. The set is also available in various formats like PDF, PNG, and JPG. So download and use it multiple times as per your knowledge.

Five Years Data Analytics Career Roadmap For Chief Scientist Microsoft
We present our five years data analytics career roadmap for chief scientist microsoft. This PowerPoint layout is easy-to-edit so you can change the font size, font type, color, and shape conveniently. In addition to this, the PowerPoint layout is Google Slides compatible, so you can share it with your audience and give them access to edit it. Therefore, download and save this well-researched five years data analytics career roadmap for chief scientist microsoft in different formats like PDF, PNG, and JPG to smoothly execute your business plan.
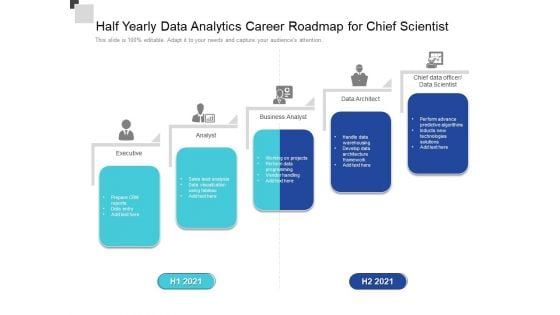
Half Yearly Data Analytics Career Roadmap For Chief Scientist Download
We present our half yearly data analytics career roadmap for chief scientist download. This PowerPoint layout is easy-to-edit so you can change the font size, font type, color, and shape conveniently. In addition to this, the PowerPoint layout is Google Slides compatible, so you can share it with your audience and give them access to edit it. Therefore, download and save this well-researched half yearly data analytics career roadmap for chief scientist download in different formats like PDF, PNG, and JPG to smoothly execute your business plan.
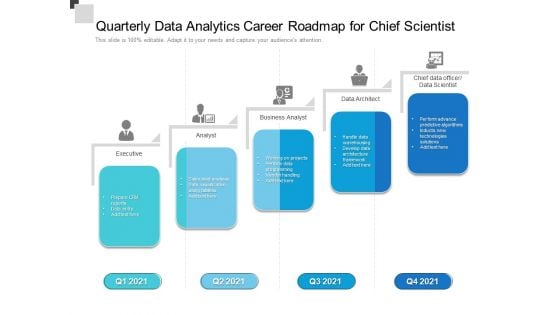
Quarterly Data Analytics Career Roadmap For Chief Scientist Infographics
We present our quarterly data analytics career roadmap for chief scientist infographics. This PowerPoint layout is easy-to-edit so you can change the font size, font type, color, and shape conveniently. In addition to this, the PowerPoint layout is Google Slides compatible, so you can share it with your audience and give them access to edit it. Therefore, download and save this well-researched quarterly data analytics career roadmap for chief scientist infographics in different formats like PDF, PNG, and JPG to smoothly execute your business plan.
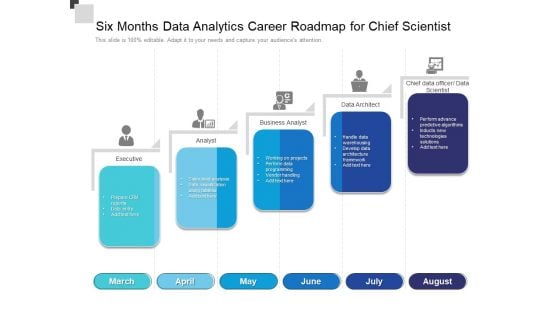
Six Months Data Analytics Career Roadmap For Chief Scientist Portrait
We present our six months data analytics career roadmap for chief scientist portrait. This PowerPoint layout is easy-to-edit so you can change the font size, font type, color, and shape conveniently. In addition to this, the PowerPoint layout is Google Slides compatible, so you can share it with your audience and give them access to edit it. Therefore, download and save this well-researched six months data analytics career roadmap for chief scientist portrait in different formats like PDF, PNG, and JPG to smoothly execute your business plan.
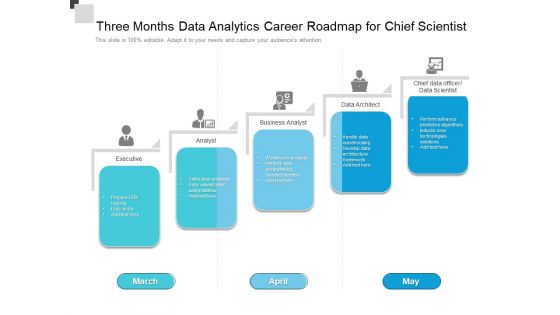
Three Months Data Analytics Career Roadmap For Chief Scientist Graphics
We present our three months data analytics career roadmap for chief scientist graphics. This PowerPoint layout is easy-to-edit so you can change the font size, font type, color, and shape conveniently. In addition to this, the PowerPoint layout is Google Slides compatible, so you can share it with your audience and give them access to edit it. Therefore, download and save this well-researched three months data analytics career roadmap for chief scientist graphics in different formats like PDF, PNG, and JPG to smoothly execute your business plan.
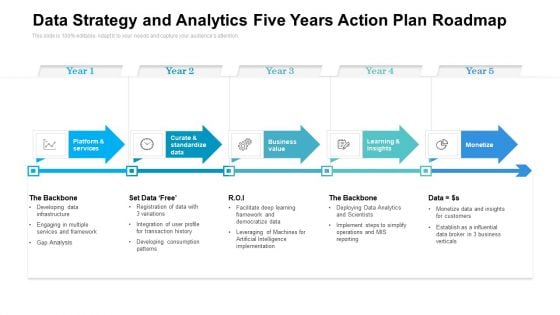
Data Strategy And Analytics Five Years Action Plan Roadmap Graphics
We present our data strategy and analytics five years action plan roadmap graphics. This PowerPoint layout is easy to edit so you can change the font size, font type, color, and shape conveniently. In addition to this, the PowerPoint layout is Google Slides compatible, so you can share it with your audience and give them access to edit it. Therefore, download and save this well researched data strategy and analytics five years action plan roadmap graphics in different formats like PDF, PNG, and JPG to smoothly execute your business plan.


 Continue with Email

 Home
Home


