Timeline Dashboard
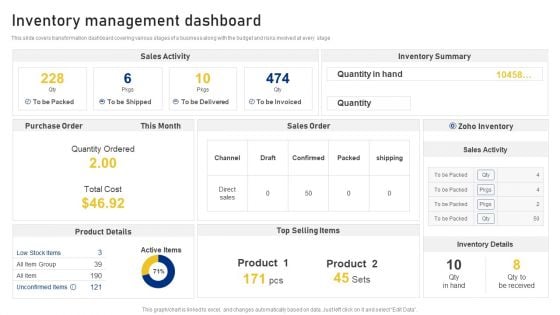
Reshaping Business In Digital Inventory Management Dashboard Mockup PDF
This slide covers transformation dashboard covering various stages of a business along with the budget and risks involved at every stage Deliver and pitch your topic in the best possible manner with this Reshaping Business In Digital Inventory Management Dashboard Mockup PDF. Use them to share invaluable insights on Sales Activity, Inventory Summary, Quantity, Sales Order and impress your audience. This template can be altered and modified as per your expectations. So, grab it now.
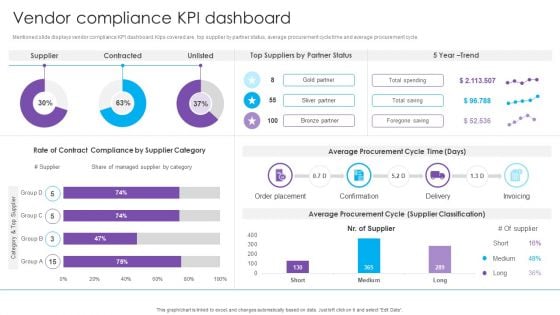
Vendor Compliance KPI Dashboard Real Estate Project Funding Inspiration PDF
Mentioned slide displays vendor compliance KPI dashboard. Kips covered are top supplier by partner status, average procurement cycle time and average procurement cycle.Deliver and pitch your topic in the best possible manner with this Vendor Compliance KPI Dashboard Real Estate Project Funding Inspiration PDF. Use them to share invaluable insights on Contract Compliance, Average Procurement, Order Placement and impress your audience. This template can be altered and modified as per your expectations. So, grab it now.
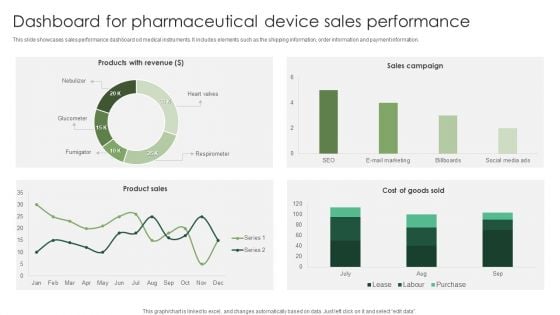
Dashboard For Pharmaceutical Device Sales Performance Graphics PDF
This slide showcases sales performance dashboard od medical instruments. It includes elements such as the shipping information, order information and payment information. Showcasing this set of slides titled Dashboard For Pharmaceutical Device Sales Performance Graphics PDF. The topics addressed in these templates are Pharmaceutical Device, Sales Performance. All the content presented in this PPT design is completely editable. Download it and make adjustments in color, background, font etc. as per your unique business setting.
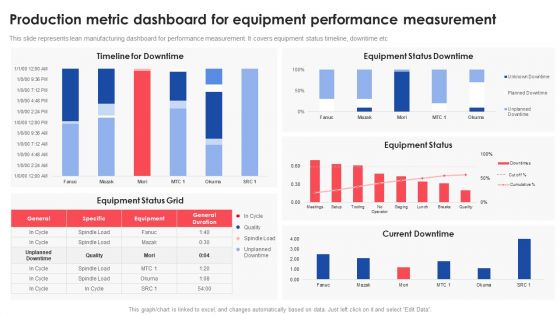
Production Metric Dashboard For Equipment Performance Measurement Deploying And Managing Lean Portrait PDF
This slide represents lean manufacturing dashboard for performance measurement. It covers equipment status timeline, downtime etcDeliver and pitch your topic in the best possible manner with this Production Metric Dashboard For Equipment Performance Measurement Deploying And Managing Lean Portrait PDF. Use them to share invaluable insights on Timeline Downtime, Equipment, Current Downtime and impress your audience. This template can be altered and modified as per your expectations. So, grab it now.
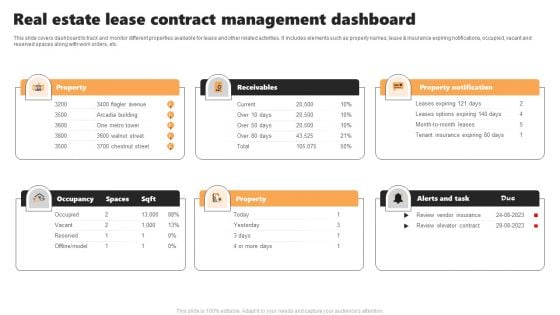
Real Estate Lease Contract Management Dashboard Pictures PDF
This slide covers dashboard to track and monitor different properties available for lease and other related activities. It includes elements such as property names, lease and insurance expiring notifications, occupied, vacant and reserved spaces along with work orders, etc.Persuade your audience using this Real Estate Lease Contract Management Dashboard Pictures PDF. This PPT design covers six stages, thus making it a great tool to use. It also caters to a variety of topics including Property Notification, Leases Options, Tenant Insurance. Download this PPT design now to present a convincing pitch that not only emphasizes the topic but also showcases your presentation skills.
Performance Tracking Dashboard For Reinforcement Learning Model Sample PDF
This slide represents the performance tracking dashboard for the reinforcement learning model based on different time frames and categories. From laying roadmaps to briefing everything in detail, our templates are perfect for you. You can set the stage with your presentation slides. All you have to do is download these easy to edit and customizable templates. Performance Tracking Dashboard For Reinforcement Learning Model Sample PDF will help you deliver an outstanding performance that everyone would remember and praise you for. Do download this presentation today.
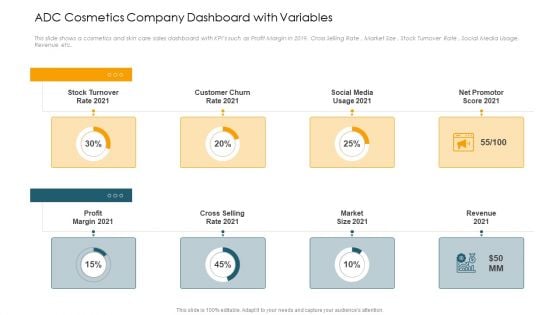
ADC Cosmetics Company Dashboard With Variables Ppt Backgrounds PDF
This slide shows a cosmetics and skin care sales dashboard with KPIs such as Profit Margin in 2019, Cross Selling Rate , Market Size , Stock Turnover Rate , Social Media Usage, Revenue etc.Presenting adc cosmetics company dashboard with variables ppt backgrounds pdf. to provide visual cues and insights. Share and navigate important information on eight stages that need your due attention. This template can be used to pitch topics like stock turnover rate 2021, social media usage 2021, net promotor score 2021. In addtion, this PPT design contains high resolution images, graphics, etc, that are easily editable and available for immediate download.
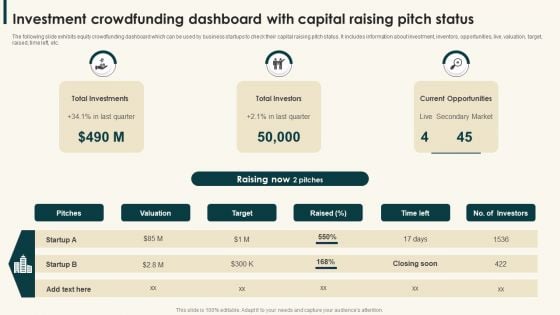
Investment Crowdfunding Dashboard With Capital Raising Pitch Status Sample PDF
The following slide exhibits equity crowdfunding dashboard which can be used by business startups to check their capital raising pitch status. It includes information about investment, inventors, opportunities, live, valuation, target, raised, time left, etc.Presenting Investment Crowdfunding Dashboard With Capital Raising Pitch Status Sample PDF to dispense important information. This template comprises three stages. It also presents valuable insights into the topics including Total Investments, Total Investors, Current Opportunities. This is a completely customizable PowerPoint theme that can be put to use immediately. So, download it and address the topic impactfully.
Cost And Purchase Order Procurement Dashboard Icons PDF
This slide provides an overview of the cost and purchase order-related performance indicators to improve efficiency and optimize processes. The dashboard includes the cost of the purchase order, cost reduction, savings, procurement ROI and top 5 suppliers. If you are looking for a format to display your unique thoughts, then the professionally designed Cost And Purchase Order Procurement Dashboard Icons PDF is the one for you. You can use it as a Google Slides template or a PowerPoint template. Incorporate impressive visuals, symbols, images, and other charts. Modify or reorganize the text boxes as you desire. Experiment with shade schemes and font pairings. Alter, share or cooperate with other people on your work. Download Cost And Purchase Order Procurement Dashboard Icons PDF and find out how to give a successful presentation. Present a perfect display to your team and make your presentation unforgettable.
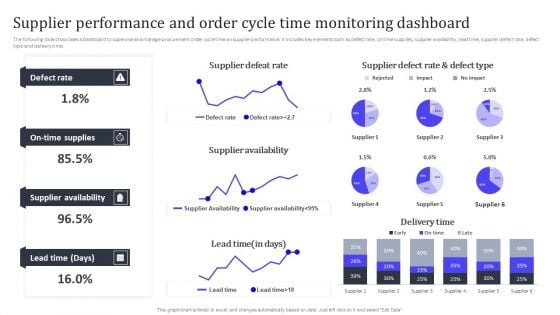
Supplier Performance And Order Cycle Time Monitoring Dashboard Introduction PDF
The following slide showcases a dashboard to supervise and manage procurement order cycle time an supplier performance. It includes key elements such as defect rate, on time supplies, supplier availability, lead time, supplier defect rate, defect type and delivery time. Do you have to make sure that everyone on your team knows about any specific topic I yes, then you should give Supplier Performance And Order Cycle Time Monitoring Dashboard Introduction PDF a try. Our experts have put a lot of knowledge and effort into creating this impeccable Supplier Performance And Order Cycle Time Monitoring Dashboard Introduction PDF. You can use this template for your upcoming presentations, as the slides are perfect to represent even the tiniest detail. You can download these templates from the Slidegeeks website and these are easy to edit. So grab these today.
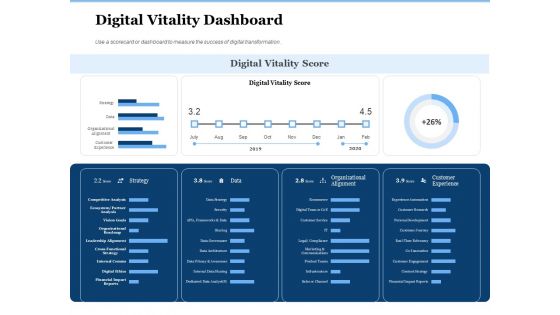
Generate Digitalization Roadmap For Business Digital Vitality Dashboard Diagrams PDF
Deliver an awe inspiring pitch with this creative generate digitalization roadmap for business digital vitality dashboard diagrams pdf bundle. Topics like strategy, organizational alignment, digital vitality score, customer experience can be discussed with this completely editable template. It is available for immediate download depending on the needs and requirements of the user.
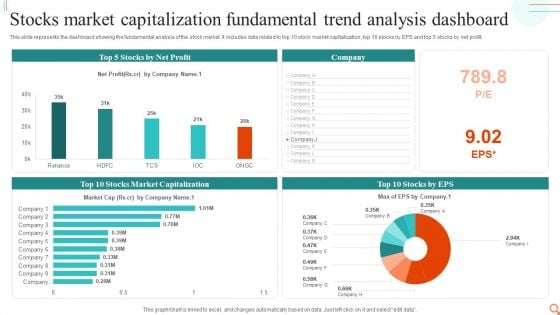
Stocks Market Capitalization Fundamental Trend Analysis Dashboard Designs PDF
This slide represents the dashboard showing the fundamental analysis of the stock market. It includes data related to top 10 stock market capitalization, top 10 stocks by EPS and top 5 stocks by net profit.Showcasing this set of slides titled Stocks Market Capitalization Fundamental Trend Analysis Dashboard Designs PDF. The topics addressed in these templates are Market Capitalization, Net Profit. All the content presented in this PPT design is completely editable. Download it and make adjustments in color, background, font etc. as per your unique business setting.
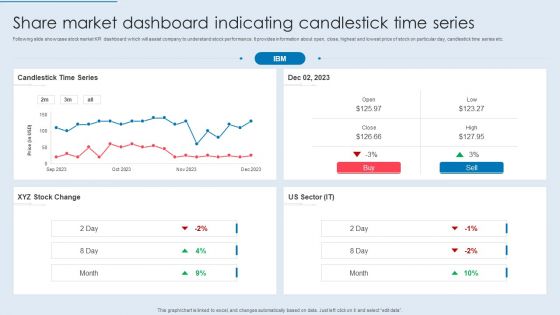
Share Market Dashboard Indicating Candlestick Time Series Formats PDF
Following slide showcase stock market KPI dashboard which will assist company to understand stock performance. It provides information about open, close, highest and lowest price of stock on particular day, candlestick time series etc. Pitch your topic with ease and precision using this Share Market Dashboard Indicating Candlestick Time Series Formats PDF. This layout presents information on Candlestick Time Series, Stock Change, US Sector. It is also available for immediate download and adjustment. So, changes can be made in the color, design, graphics or any other component to create a unique layout.
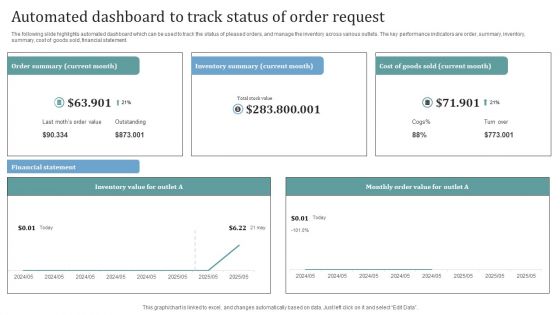
Automated Dashboard To Track Status Of Order Request Themes PDF
The following slide highlights automated dashboard which can be used to track the status of pleased orders, and manage the inventory across various outlets. The key performance indicators are order, summary, inventory, summary, cost of goods sold, financial statement. Showcasing this set of slides titled Automated Dashboard To Track Status Of Order Request Themes PDF. The topics addressed in these templates are Inventory Value, Inventory Summary, Cost. All the content presented in this PPT design is completely editable. Download it and make adjustments in color, background, font etc. as per your unique business setting.
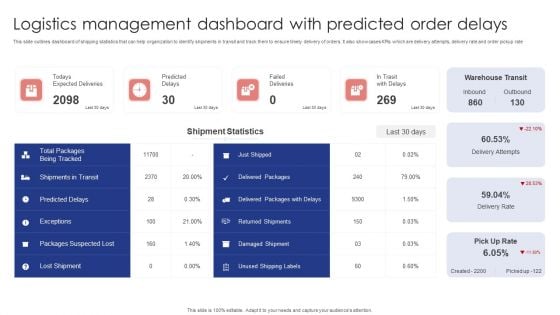
Logistics Management Dashboard With Predicted Order Delays Slides PDF
This slide outlines dashboard of shipping statistics that can help organization to identify shipments in transit and track them to ensure timely delivery of orders. It also showcases KPIs which are delivery attempts, delivery rate and order pickup rate. Showcasing this set of slides titled Logistics Management Dashboard With Predicted Order Delays Slides PDF. The topics addressed in these templates are Warehouse Transit, Shipment Statistics, Failed Deliveries. All the content presented in this PPT design is completely editable. Download it and make adjustments in color, background, font etc. as per your unique business setting.
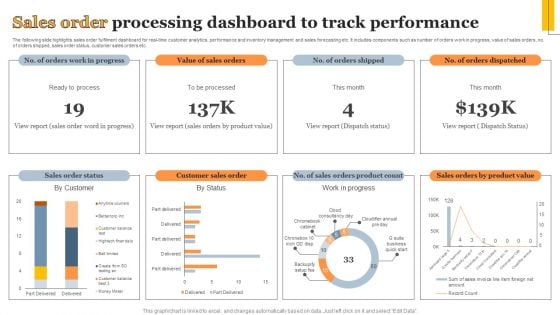
Sales Order Processing Dashboard To Track Performance Information PDF
The following slide highlights sales order fulfilment dashboard for real-time customer analytics, performance and inventory management and sales forecasting etc. It includes components such as number of orders work in progress, value of sales orders, no. of orders shipped, sales order status, customer sales orders etc. Showcasing this set of slides titled Sales Order Processing Dashboard To Track Performance Information PDF. The topics addressed in these templates are Sales Order Status, Customer Sales Order, Work Progress. All the content presented in this PPT design is completely editable. Download it and make adjustments in color, background, font etc. as per your unique business setting.
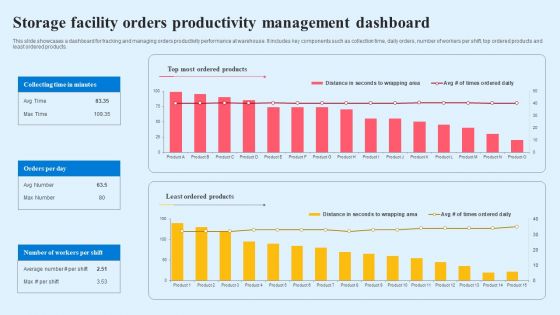
Storage Facility Orders Productivity Management Dashboard Diagrams PDF
This slide showcases a dashboard for tracking and managing orders productivity performance at warehouse. It includes key components such as collection time, daily orders, number of workers per shift, top ordered products and least ordered products. Showcasing this set of slides titled Storage Facility Orders Productivity Management Dashboard Diagrams PDF. The topics addressed in these templates are Top Most Ordered Products, Least Ordered Products, Orders Per Day. All the content presented in this PPT design is completely editable. Download it and make adjustments in color, background, font etc. as per your unique business setting.
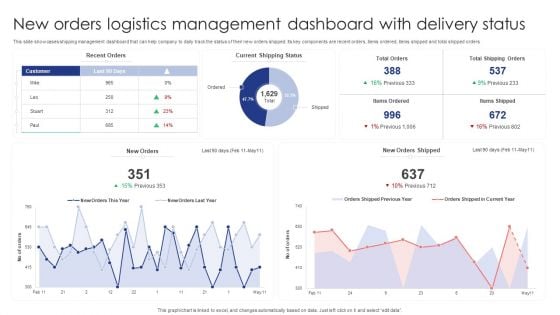
New Orders Logistics Management Dashboard With Delivery Status Designs PDF
This slide showcases shipping management dashboard that can help company to daily track the status of their new orders shipped. Its key components are recent orders, items ordered, items shipped and total shipped orders. Pitch your topic with ease and precision using this New Orders Logistics Management Dashboard With Delivery Status Designs PDF. This layout presents information on Recent Orders, Current Shipping Status, New Orders. It is also available for immediate download and adjustment. So, changes can be made in the color, design, graphics or any other component to create a unique layout.
Dashboard For Tracking Sales Order Processing Rate Inspiration PDF
The following slide showcases sales order fulfilment rate dashboard to measure efficiency of shipping, process and packaging. It includes components such as partially fulfilled orders, pending orders, total number of orders etc. Showcasing this set of slides titled Dashboard For Tracking Sales Order Processing Rate Inspiration PDF. The topics addressed in these templates are Order Fulfilment, Partially Fulfilled, Pending. All the content presented in this PPT design is completely editable. Download it and make adjustments in color, background, font etc. as per your unique business setting.
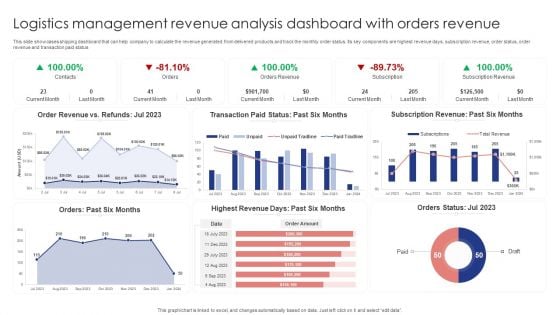
Logistics Management Revenue Analysis Dashboard With Orders Revenue Brochure PDF
This slide showcases shipping dashboard that can help company to calculate the revenue generated from delivered products and track the monthly order status. Its key components are highest revenue days, subscription revenue, order status, order revenue and transaction paid status. Showcasing this set of slides titled Logistics Management Revenue Analysis Dashboard With Orders Revenue Brochure PDF. The topics addressed in these templates are Order Revenue, Transaction Paid, Subscription Revenue. All the content presented in this PPT design is completely editable. Download it and make adjustments in color, background, font etc. as per your unique business setting.
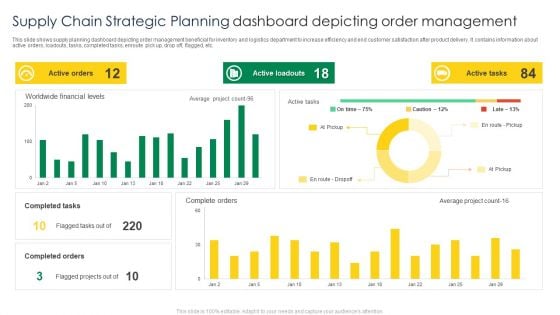
Supply Chain Strategic Planning Dashboard Depicting Order Management Mockup PDF
This slide shows supply planning dashboard depicting order management beneficial for inventory and logistics department to increase efficiency and end customer satisfaction after product delivery. It contains information about active orders, loadouts, tasks, completed tasks, enroute pick up, drop off, flagged, etc. Pitch your topic with ease and precision using this Supply Chain Strategic Planning Dashboard Depicting Order Management Mockup PDF. This layout presents information on Active Orders, Active Loadouts, Active Tasks. It is also available for immediate download and adjustment. So, changes can be made in the color, design, graphics or any other component to create a unique layout.
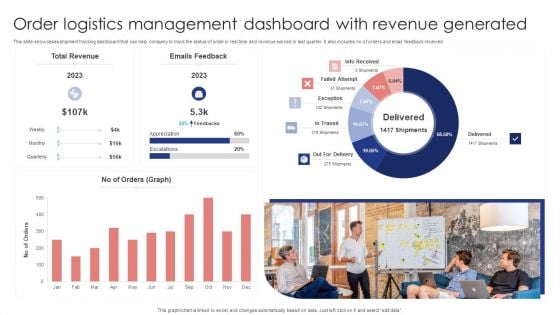
Order Logistics Management Dashboard With Revenue Generated Slides PDF
This slide showcases shipment tracking dashboard that can help company to track the status of order in real time and revenue earned in last quarter. It also includes no of orders and email feedback received. Showcasing this set of slides titled Order Logistics Management Dashboard With Revenue Generated Slides PDF. The topics addressed in these templates are Total Revenue, Emails Feedback, Orders Graph. All the content presented in this PPT design is completely editable. Download it and make adjustments in color, background, font etc. as per your unique business setting.
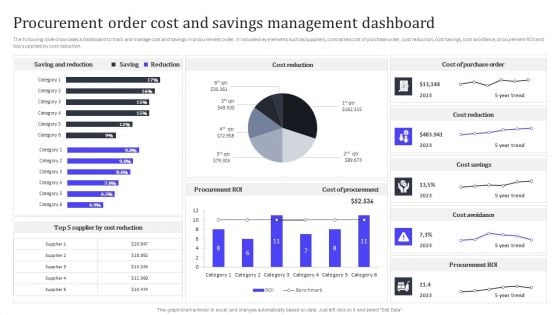
Procurement Order Cost And Savings Management Dashboard Ideas PDF
The following slide showcases a dashboard to track and manage cost and savings in procurement order. It includes key elements such as suppliers, contracted cost of purchase order, cost reduction, cost savings, cost avoidance, procurement ROI and top suppliers by cost reduction. There are so many reasons you need a Procurement Order Cost And Savings Management Dashboard Ideas PDF. The first reason is you can not spend time making everything from scratch, Thus, Slidegeeks has made presentation templates for you too. You can easily download these templates from our website easily.
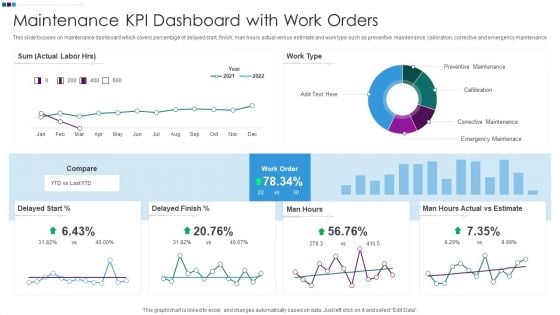
Maintenance KPI Dashboard With Work Orders Ppt Gallery Model PDF
This slide focuses on maintenance dashboard which covers percentage of delayed start, finish, man hours actual versus estimate and work type such as preventive maintenance, calibration, corrective and emergency maintenance. Showcasing this set of slides titled Maintenance KPI Dashboard With Work Orders Ppt Gallery Model PDF. The topics addressed in these templates are Preventive Maintenance Callibration, Man Hours Actual, Delayed Finish Percent. All the content presented in this PPT design is completely editable. Download it and make adjustments in color, background, font etc. as per your unique business setting.
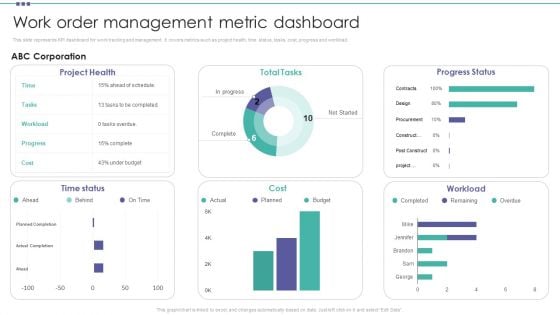
Work Order Management Metric Dashboard Organization Physical Assets Template PDF
This slide represents KPI dashboard for work tracking and management. It covers metrics such as project health, time status, tasks, cost, progress and workload. Boost your pitch with our creative Work Order Management Metric Dashboard Organization Physical Assets Template PDF. Deliver an awe-inspiring pitch that will mesmerize everyone. Using these presentation templates you will surely catch everyones attention. You can browse the ppts collection on our website. We have researchers who are experts at creating the right content for the templates. So you do not have to invest time in any additional work. Just grab the template now and use them.
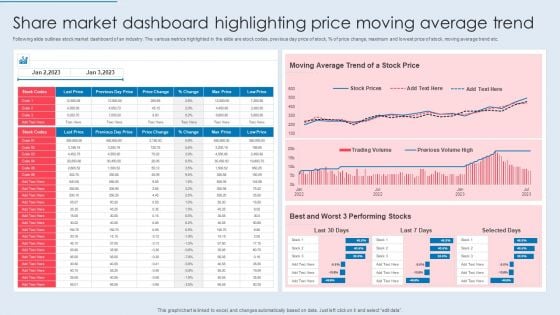
Share Market Dashboard Highlighting Price Moving Average Trend Themes PDF
Following slide outlines stock market dashboard of an industry. The various metrics highlighted in the slide are stock codes, previous day price of stock, percent of price change, maximum and lowest price of stock, moving average trend etc. Pitch your topic with ease and precision using this Share Market Dashboard Highlighting Price Moving Average Trend Themes PDF. This layout presents information on Moving Average, Stock Price, Performing Stocks. It is also available for immediate download and adjustment. So, changes can be made in the color, design, graphics or any other component to create a unique layout.
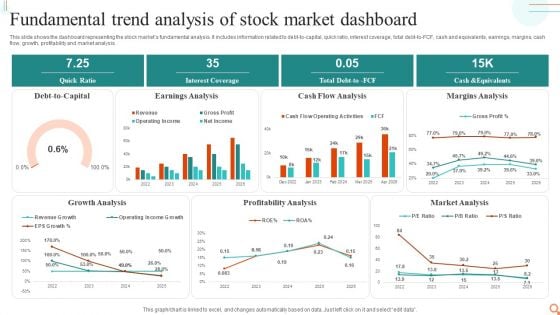
Fundamental Trend Analysis Of Stock Market Dashboard Professional PDF
This slide shows the dashboard representing the stock markets fundamental analysis. It includes information related to debt-to-capital, quick ratio, interest coverage, total debt-to-FCF, cash and equivalents, earnings, margins, cash flow, growth, profitability and market analysis.Showcasing this set of slides titled Fundamental Trend Analysis Of Stock Market Dashboard Professional PDF. The topics addressed in these templates are Earnings Analysis, Cash Flow Analysis, Margins Analysis. All the content presented in this PPT design is completely editable. Download it and make adjustments in color, background, font etc. as per your unique business setting.
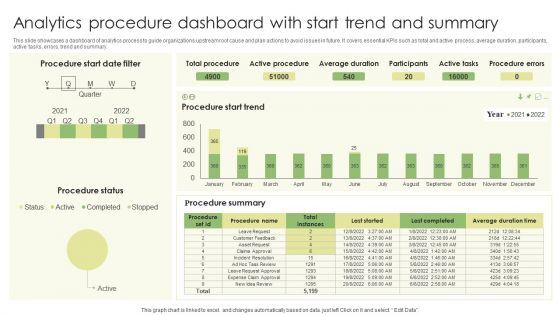
Analytics Procedure Dashboard With Start Trend And Summary Infographics PDF
This slide showcases a dashboard of analytics process to guide organizations upstream root cause and plan actions to avoid issues in future. It covers essential KPIs such as total and active process, average duration, participants, active tasks, errors, trend and summary. Showcasing this set of slides titled Analytics Procedure Dashboard With Start Trend And Summary Infographics PDF. The topics addressed in these templates are Procedure Status, Average Duration, Active Tasks. All the content presented in this PPT design is completely editable. Download it and make adjustments in color, background, font etc. as per your unique business setting.
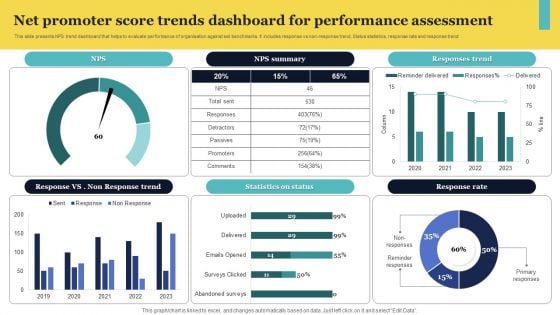
Net Promoter Score Trends Dashboard For Performance Assessment Elements PDF
This slide presents NPS trend dashboard that helps to evaluate performance of organisation against set benchmarks. It includes response vs non-response trend, Status statistics, response rate and response trend Pitch your topic with ease and precision using this Net Promoter Score Trends Dashboard For Performance Assessment Elements PDF. This layout presents information on Response Trend, Summary, Status. It is also available for immediate download and adjustment. So, changes can be made in the color, design, graphics or any other component to create a unique layout.
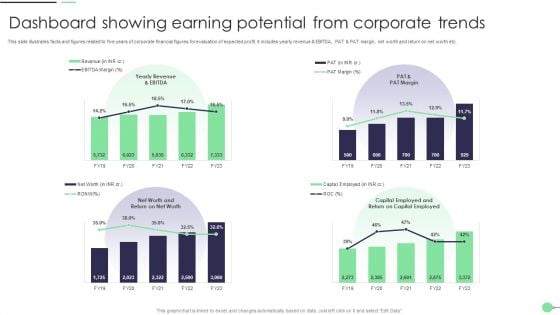
Dashboard Showing Earning Potential From Corporate Trends Demonstration PDF
This slide illustrates facts and figures related to five years of corporate financial figures for evaluation of expected profit. It includes yearly revenue and EBITDA, PAT and PAT margin, net worth and return on net worth etc. Showcasing this set of slides titled Dashboard Showing Earning Potential From Corporate Trends Demonstration PDF. The topics addressed in these templates are Potential From Corporate Trends, Dashboard Showing Earning. All the content presented in this PPT design is completely editable. Download it and make adjustments in color, background, font etc. as per your unique business setting.
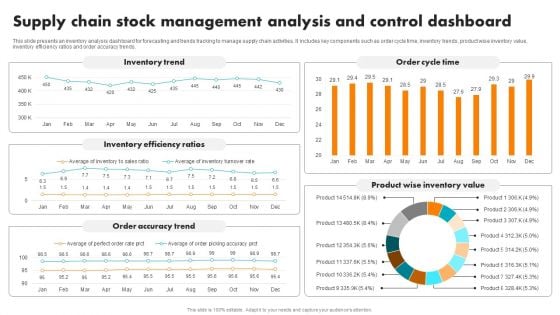
Supply Chain Stock Management Analysis And Control Dashboard Brochure PDF
This slide presents an inventory analysis dashboard for forecasting and trends tracking to manage supply chain activities. It includes key components such as order cycle time, inventory trends, product wise inventory value, inventory efficiency ratios and order accuracy trends. Pitch your topic with ease and precision using this Supply Chain Stock Management Analysis And Control Dashboard Brochure PDF. This layout presents information on Inventory Trend, Inventory Efficiency Ratios, Order Accuracy Trend, Order Cycle Time, Product Wise Inventory Value. It is also available for immediate download and adjustment. So, changes can be made in the color, design, graphics or any other component to create a unique layout.
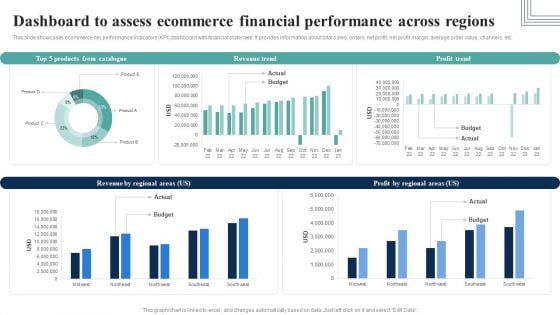
Dashboard To Assess Ecommerce Financial Performance Across Regions Infographics PDF
This slide showcases ecommerce key performance indicators KPI dashboard with financial statement. It provides information about total sales, orders, net profit, net profit margin, average order value, channels, etc.Here you can discover an assortment of the finest PowerPoint and Google Slides templates. With these templates, you can create presentations for a variety of purposes while simultaneously providing your audience with an eye-catching visual experience. Download Dashboard To Assess Ecommerce Financial Performance Across Regions Infographics PDF to deliver an impeccable presentation. These templates will make your job of preparing presentations much quicker, yet still, maintain a high level of quality. Slidegeeks has experienced researchers who prepare these templates and write high-quality content for you. Later on, you can personalize the content by editing the Dashboard To Assess Ecommerce Financial Performance Across Regions Infographics PDF.
Warehouse Data KPI With Order Performance Dashboard Icons PDF
Pitch your topic with ease and precision using this Warehouse Data KPI With Order Performance Dashboard Icons PDF This layout presents information on Inventory Accuracy, Order Accuracy Europe, Total Accuracy It is also available for immediate download and adjustment. So, changes can be made in the color, design, graphics or any other component to create a unique layout.
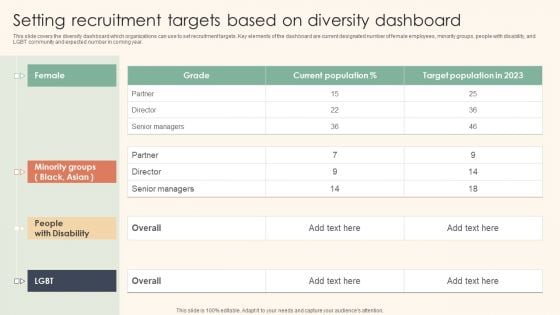
Setting Recruitment Targets Based On Diversity Dashboard Information PDF
This slide covers the diversity dashboard which organizations can use to set recruitment targets. Key elements of the dashboard are current designated number of female employees, minority groups, people with disability, and LGBT community and expected number in coming year. The Setting Recruitment Targets Based On Diversity Dashboard Information PDF is a compilation of the most recent design trends as a series of slides. It is suitable for any subject or industry presentation, containing attractive visuals and photo spots for businesses to clearly express their messages. This template contains a variety of slides for the user to input data, such as structures to contrast two elements, bullet points, and slides for written information. Slidegeeks is prepared to create an impression.
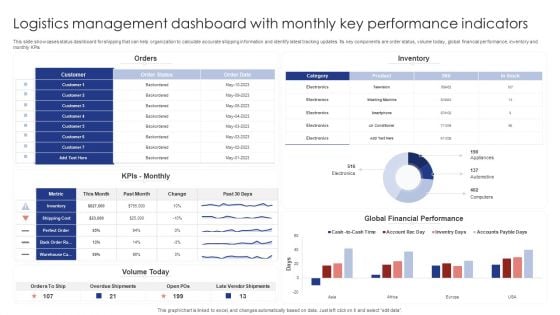
Logistics Management Dashboard With Monthly Key Performance Indicators Rules PDF
This slide showcases status dashboard for shipping that can help organization to calculate accurate shipping information and identify latest tracking updates. Its key components are order status, volume today, global financial performance, inventory and monthly KPIs. Pitch your topic with ease and precision using this Logistics Management Dashboard With Monthly Key Performance Indicators Rules PDF. This layout presents information on Orders, Inventory, Kpis Monthly. It is also available for immediate download and adjustment. So, changes can be made in the color, design, graphics or any other component to create a unique layout.
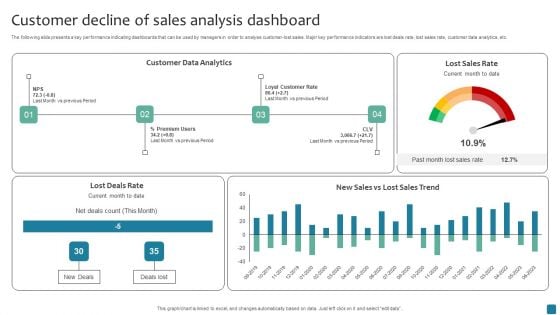
Customer Decline Of Sales Analysis Dashboard Rules PDF
The following slide presents a key performance indicating dashboards that can be used by managers in order to analyse customer-lost sales. Major key performance indicators are lost deals rate, lost sales rate, customer data analytics, etc. Pitch your topic with ease and precision using this Customer Decline Of Sales Analysis Dashboard Rules PDF. This layout presents information on Customer Data Analytics. It is also available for immediate download and adjustment. So, changes can be made in the color, design, graphics or any other component to create a unique layout.
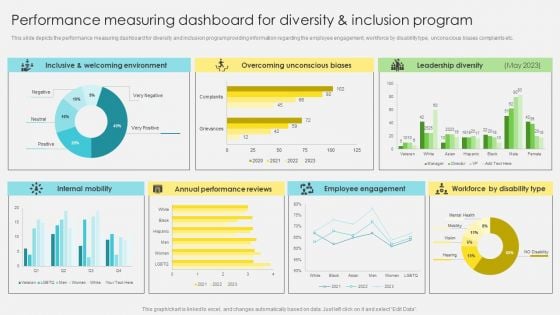
Performance Measuring Dashboard For Diversity And Inclusion Program Template PDF
This slide depicts the performance measuring dashboard for diversity and inclusion program providing information regarding the employee engagement, workforce by disability type, unconscious biases complaints etc. The Performance Measuring Dashboard For Diversity And Inclusion Program Template PDF is a compilation of the most recent design trends as a series of slides. It is suitable for any subject or industry presentation, containing attractive visuals and photo spots for businesses to clearly express their messages. This template contains a variety of slides for the user to input data, such as structures to contrast two elements, bullet points, and slides for written information. Slidegeeks is prepared to create an impression.
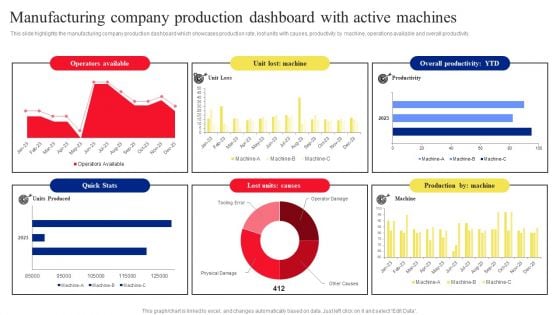
Manufacturing Company Production Dashboard With Active Machines Microsoft PDF
This slide highlights the manufacturing company production dashboard which showcases production rate, lost units with causes, productivity by machine, operations available and overall productivity. The Manufacturing Company Production Dashboard With Active Machines Microsoft PDF is a compilation of the most recent design trends as a series of slides. It is suitable for any subject or industry presentation, containing attractive visuals and photo spots for businesses to clearly express their messages. This template contains a variety of slides for the user to input data, such as structures to contrast two elements, bullet points, and slides for written information. Slidegeeks is prepared to create an impression.
Social Media Performance Tracking And Monitoring Dashboard Graphics PDF
The following slide showcases a dashboard to track and measure social media platforms performance. It includes key elements such as website traffic, social media referral rate, site revenue, social media site revenue, etc. The Social Media Performance Tracking And Monitoring Dashboard Graphics PDF is a compilation of the most recent design trends as a series of slides. It is suitable for any subject or industry presentation, containing attractive visuals and photo spots for businesses to clearly express their messages. This template contains a variety of slides for the user to input data, such as structures to contrast two elements, bullet points, and slides for written information. Slidegeeks is prepared to create an impression.
Facebook Ad Campaign Performance Tracking Dashboard Microsoft PDF
This slide represents the KPI dashboard to effectively measure and monitor performance of Facebook marketing campaign conducted by the organization to enhance customer engagement. It includes details related to KPIs such as ad impressions, ad reach etc. From laying roadmaps to briefing everything in detail, our templates are perfect for you. You can set the stage with your presentation slides. All you have to do is download these easy-to-edit and customizable templates. Facebook Ad Campaign Performance Tracking Dashboard Microsoft PDF will help you deliver an outstanding performance that everyone would remember and praise you for. Do download this presentation today.
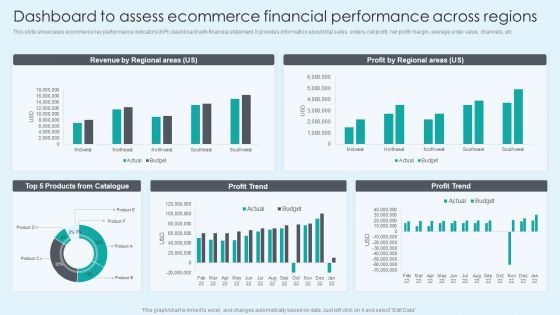
Dashboard To Assess Ecommerce Financial Performance Across Regions Themes PDF
This slide showcases ecommerce key performance indicators KPI dashboard with financial statement. It provides information about total sales, orders, net profit, net profit margin, average order value, channels, etc. Here you can discover an assortment of the finest PowerPoint and Google Slides templates. With these templates, you can create presentations for a variety of purposes while simultaneously providing your audience with an eye catching visual experience. Download Dashboard To Assess Ecommerce Financial Performance Across Regions Themes PDF to deliver an impeccable presentation. These templates will make your job of preparing presentations much quicker, yet still, maintain a high level of quality. Slidegeeks has experienced researchers who prepare these templates and write high quality content for you. Later on, you can personalize the content by editing the Dashboard To Assess Ecommerce Financial Performance Across Regions Themes PDF.
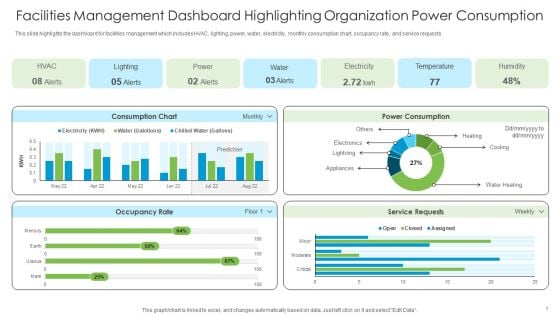
Facilities Management Dashboard Highlighting Organization Power Consumption Sample PDF
This slide highlights the dashboard for facilities management which includes HVAC, lighting, power, water, electricity, monthly consumption chart, occupancy rate, and service requests.From laying roadmaps to briefing everything in detail, our templates are perfect for you. You can set the stage with your presentation slides. All you have to do is download these easy-to-edit and customizable templates. Facilities Management Dashboard Highlighting Organization Power Consumption Sample PDF will help you deliver an outstanding performance that everyone would remember and praise you for. Do download this presentation today.
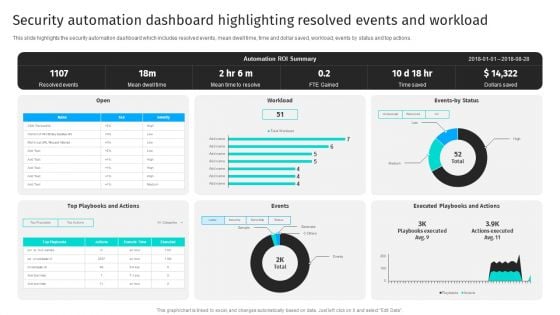
Security Automation Dashboard Highlighting Resolved Events And Workload Portrait PDF
This slide highlights the security automation dashboard which includes resolved events, mean dwell time, time and dollar saved, workload, events by status and top actions.From laying roadmaps to briefing everything in detail, our templates are perfect for you. You can set the stage with your presentation slides. All you have to do is download these easy-to-edit and customizable templates. Security Automation Dashboard Highlighting Resolved Events And Workload Portrait PDF will help you deliver an outstanding performance that everyone would remember and praise you for. Do download this presentation today.
Increasing Customer Kpi Dashboard For Tracking Customer Retention Download PDF
This slide covers the dashboard for analyzing customer loyalty with metrics such as NPS, loyal customer rate, premium users, CLV, customer churn, revenue churn, net retention, MRR growth, etc. From laying roadmaps to briefing everything in detail, our templates are perfect for you. You can set the stage with your presentation slides. All you have to do is download these easy-to-edit and customizable templates. Increasing Customer Kpi Dashboard For Tracking Customer Retention Download PDF will help you deliver an outstanding performance that everyone would remember and praise you for. Do download this presentation today.
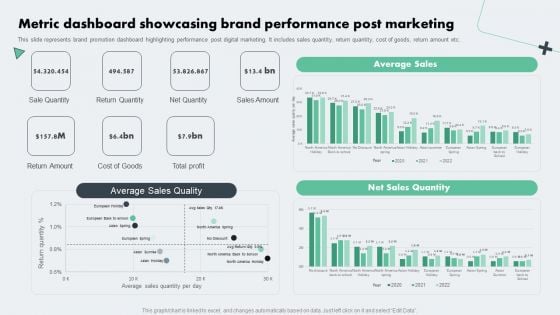
Deploying Online Marketing Metric Dashboard Showcasing Brand Performance Microsoft PDF
This slide represents brand promotion dashboard highlighting performance post digital marketing. It includes sales quantity, return quantity, cost of goods, return amount etc. From laying roadmaps to briefing everything in detail, our templates are perfect for you. You can set the stage with your presentation slides. All you have to do is download these easy-to-edit and customizable templates. Deploying Online Marketing Metric Dashboard Showcasing Brand Performance Microsoft PDF will help you deliver an outstanding performance that everyone would remember and praise you for. Do download this presentation today.
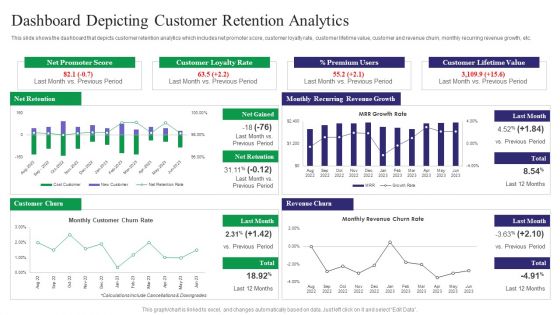
Reducing Customer Turnover Rates Dashboard Depicting Customer Retention Brochure PDF
This slide shows the dashboard that depicts customer retention analytics which includes net promoter score, customer loyalty rate, customer lifetime value, customer and revenue churn, monthly recurring revenue growth, etc. From laying roadmaps to briefing everything in detail, our templates are perfect for you. You can set the stage with your presentation slides. All you have to do is download these easy-to-edit and customizable templates. Reducing Customer Turnover Rates Dashboard Depicting Customer Retention Brochure PDF will help you deliver an outstanding performance that everyone would remember and praise you for. Do download this presentation today.
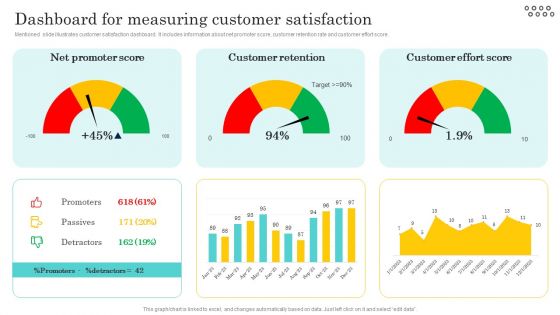
Optimizing And Managing Retail Dashboard For Measuring Customer Formats PDF
Mentioned slide illustrates customer satisfaction dashboard. It includes information about net promoter score, customer retention rate and customer effort score.. From laying roadmaps to briefing everything in detail, our templates are perfect for you. You can set the stage with your presentation slides. All you have to do is download these easy-to-edit and customizable templates. Optimizing And Managing Retail Dashboard For Measuring Customer Formats PDF will help you deliver an outstanding performance that everyone would remember and praise you for. Do download this presentation today.
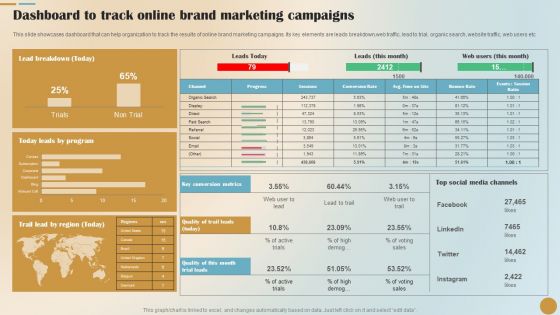
Dashboard To Track Online Brand Marketing Campaigns Guidelines PDF
This slide showcases dashboard that can help organization to track the results of online brand marketing campaigns. Its key elements are leads breakdown,web traffic, lead to trial, organic search, website traffic, web users etc. From laying roadmaps to briefing everything in detail, our templates are perfect for you. You can set the stage with your presentation slides. All you have to do is download these easy to edit and customizable templates. Dashboard To Track Online Brand Marketing Campaigns Guidelines PDF will help you deliver an outstanding performance that everyone would remember and praise you for. Do download this presentation today.
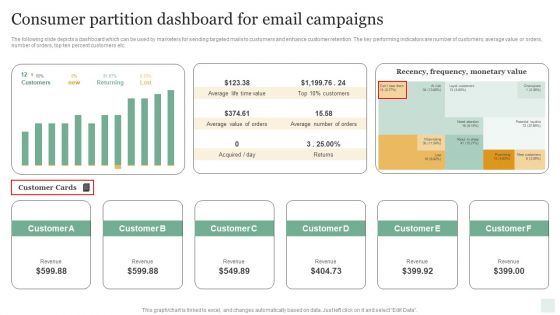
Consumer Partition Dashboard For Email Campaigns Infographics PDF
The following slide depicts a dashboard which can be used by marketers for sending targeted mails to customers and enhance customer retention. The key performing indicators are number of customers, average value or orders, number of orders, top ten percent customers etc. Showcasing this set of slides titled Consumer Partition Dashboard For Email Campaigns Infographics PDF. The topics addressed in these templates are Average Life Time Value, Average Value Of Orders, Returns, Average Number Of Orders. All the content presented in this PPT design is completely editable. Download it and make adjustments in color, background, font etc. as per your unique business setting.
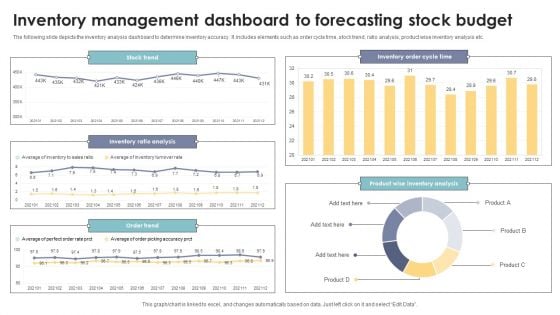
Inventory Management Dashboard To Forecasting Stock Budget Elements PDF
The following slide depicts the inventory analysis dashboard to determine inventory accuracy. It includes elements such as order cycle time, stock trend, ratio analysis, product wise inventory analysis etc. Pitch your topic with ease and precision using this Inventory Management Dashboard To Forecasting Stock Budget Elements PDF. This layout presents information on Inventory Ratio Analysis, Product Wise Inventory Analysis, Stock Trend. It is also available for immediate download and adjustment. So, changes can be made in the color, design, graphics or any other component to create a unique layout.
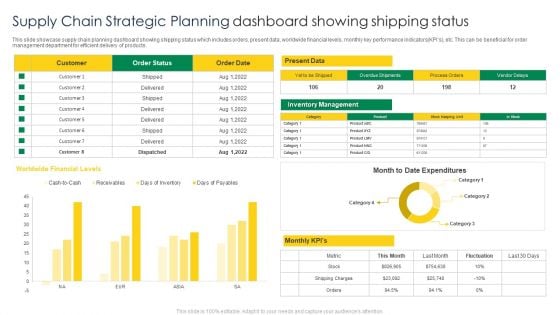
Supply Chain Strategic Planning Dashboard Showing Shipping Status Structure PDF
This slide showcase supply chain planning dashboard showing shipping status which includes orders, present data, worldwide financial levels, monthly key performance indicators KPIs, etc. This can be beneficial for order management department for efficient delivery of products. Showcasing this set of slides titled Supply Chain Strategic Planning Dashboard Showing Shipping Status Structure PDF. The topics addressed in these templates are Worldwide Financial Levels, Present Data, Customer. All the content presented in this PPT design is completely editable. Download it and make adjustments in color, background, font etc. as per your unique business setting.
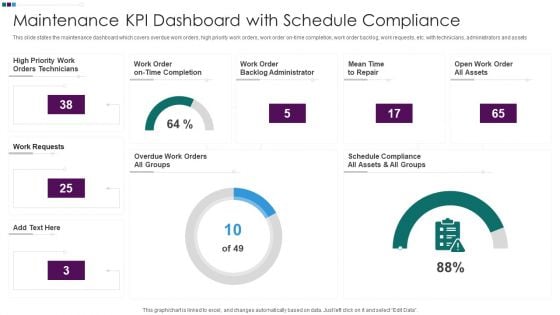
Maintenance KPI Dashboard With Schedule Compliance Ppt Styles Demonstration PDF
This slide states the maintenance dashboard which covers overdue work orders, high priority work orders, work order on-time completion, work order backlog, work requests, etc. with technicians, administrators and assets. Pitch your topic with ease and precision using this Maintenance KPI Dashboard With Schedule Compliance Ppt Styles Demonstration PDF. This layout presents information on High Priority Work, Work Order Backlog, Mean Time Repair, Open Work Order. It is also available for immediate download and adjustment. So, changes can be made in the color, design, graphics or any other component to create a unique layout.
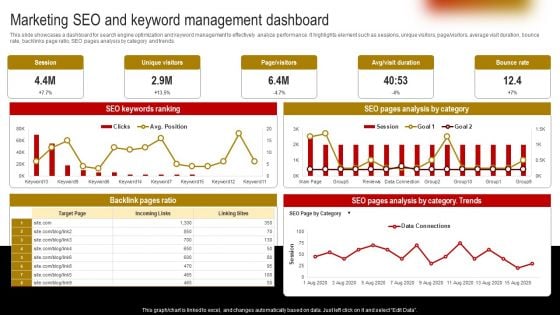
Marketing Seo And Keyword Management Dashboard Themes PDF
This slide showcases a dashboard for search engine optimization and keyword management to effectively analyze performance. It highlights element such as sessions, unique visitors, page or visitors, average visit duration, bounce rate, backlinks page ratio, SEO pages analysis by category and trends. Get a simple yet stunning designed Marketing Seo And Keyword Management Dashboard Themes PDF. It is the best one to establish the tone in your meetings. It is an excellent way to make your presentations highly effective. So, download this PPT today from Slidegeeks and see the positive impacts. Our easy to edit Marketing Seo And Keyword Management Dashboard Themes PDF can be your go to option for all upcoming conferences and meetings. So, what are you waiting for Grab this template today.
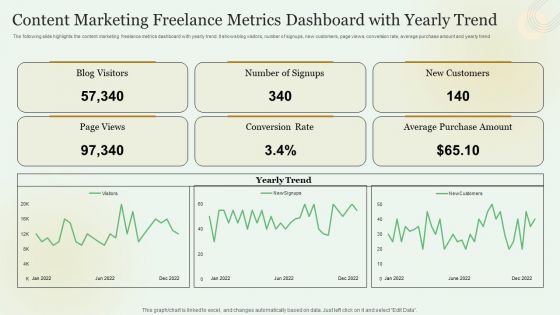
Content Marketing Freelance Metrics Dashboard With Yearly Trend Slides PDF
Showcasing this set of slides titled Content Marketing Freelance Metrics Dashboard With Yearly Trend Slides PDF. The topics addressed in these templates are New Customers, Average Purchase Amount, Conversion Rate. All the content presented in this PPT design is completely editable. Download it and make adjustments in color, background, font etc. as per your unique business setting.
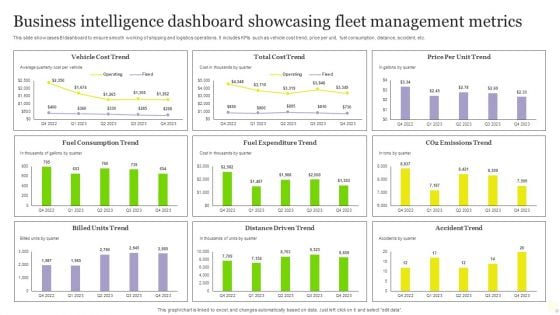
Business Intelligence Dashboard Showcasing Fleet Management Metrics Elements PDF
This slide showcases BI dashboard to ensure smooth working of shipping and logistics operations. It includes KPIs such as vehicle cost trend, price per unit, fuel consumption, distance, accident, etc. Showcasing this set of slides titled Business Intelligence Dashboard Showcasing Fleet Management Metrics Elements PDF. The topics addressed in these templates are Cost Trend, Price Per Unit Trend, Vehicle Cost Trend. All the content presented in this PPT design is completely editable. Download it and make adjustments in color, background, font etc. as per your unique business setting.
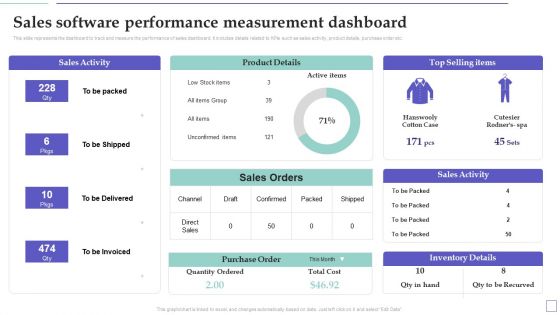
System Deployment Project Sales Software Performance Measurement Dashboard Summary PDF
This slide represents the dashboard to track and measure the performance of sales dashboard. It includes details related to KPIs such as sales activity, product details, purchase order etc. Welcome to our selection of the System Deployment Project Sales Software Performance Measurement Dashboard Summary PDF. These are designed to help you showcase your creativity and bring your sphere to life. Planning and Innovation are essential for any business that is just starting out. This collection contains the designs that you need for your everyday presentations. All of our PowerPoints are 100 percent editable, so you can customize them to suit your needs. This multi-purpose template can be used in various situations. Grab these presentation templates today.
Stock Inventory Acquisition Dashboard For Managing Warehouse Operations Icons PDF
This slide showcases dashboard that can help organization to manage and track the warehouse operations. Its key elements are order, volume, inventory, monthly KPIs and global financial performance. Explore a selection of the finest Stock Inventory Acquisition Dashboard For Managing Warehouse Operations Icons PDF here. With a plethora of professionally designed and pre-made slide templates, you can quickly and easily find the right one for your upcoming presentation. You can use our Stock Inventory Acquisition Dashboard For Managing Warehouse Operations Icons PDF to effectively convey your message to a wider audience. Slidegeeks has done a lot of research before preparing these presentation templates. The content can be personalized and the slides are highly editable. Grab templates today from Slidegeeks.
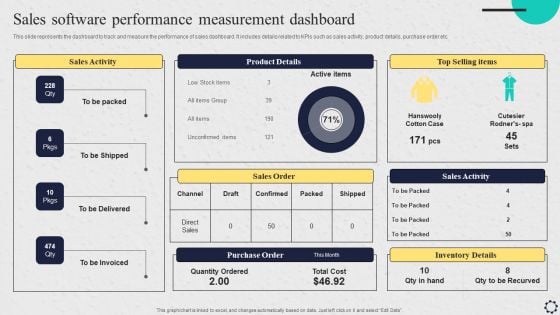
Software Implementation Strategy Sales Software Performance Measurement Dashboard Template PDF
This slide represents the dashboard to track and measure the performance of sales dashboard. It includes details related to KPIs such as sales activity, product details, purchase order etc. Coming up with a presentation necessitates that the majority of the effort goes into the content and the message you intend to convey. The visuals of a PowerPoint presentation can only be effective if it supplements and supports the story that is being told. Keeping this in mind our experts created Software Implementation Strategy Sales Software Performance Measurement Dashboard Template PDF to reduce the time that goes into designing the presentation. This way, you can concentrate on the message while our designers take care of providing you with the right template for the situation.
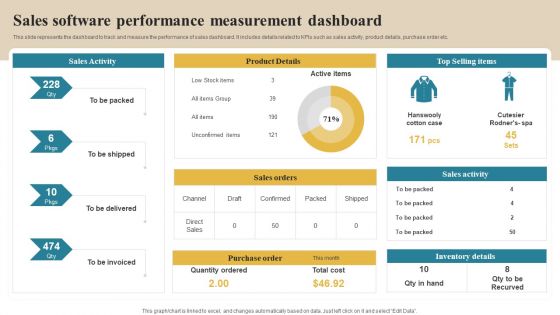
Software Implementation Technique Sales Software Performance Measurement Dashboard Slides PDF
This slide represents the dashboard to track and measure the performance of sales dashboard. It includes details related to KPIs such as sales activity, product details, purchase order etc. This modern and well arranged Software Implementation Technique Sales Software Performance Measurement Dashboard Slides PDF provides lots of creative possibilities. It is very simple to customize and edit with the Powerpoint Software. Just drag and drop your pictures into the shapes. All facets of this template can be edited with Powerpoint no extra software is necessary. Add your own material, put your images in the places assigned for them, adjust the colors, and then you can show your slides to the world, with an animated slide included.
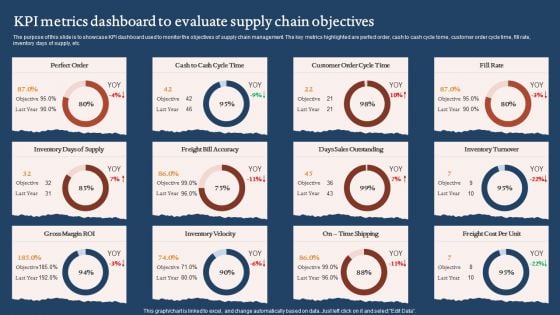
KPI Metrics Dashboard To Evaluate Supply Chain Objectives Graphics PDF
The purpose of this slide is to showcase KPI dashboard used to monitor the objectives of supply chain management. The key metrics highlighted are perfect order, cash to cash cycle tome, customer order cycle time, fill rate, inventory days of supply, etc. Pitch your topic with ease and precision using this KPI Metrics Dashboard To Evaluate Supply Chain Objectives Graphics PDF. This layout presents information on Days Sales Outstanding, Inventory Velocity, Gross Margin Roi. It is also available for immediate download and adjustment. So, changes can be made in the color, design, graphics or any other component to create a unique layout.

 Home
Home