Timeline Plan
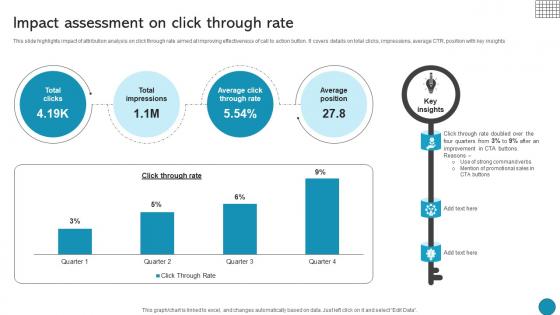
Impact Assessment On Click Through Rate Driving Business Success Integrating Product
This slide highlights impact of attribution analysis on click through rate aimed at improving effectiveness of call to action button. It covers details on total clicks, impressions, average CTR, position with key insights The Impact Assessment On Click Through Rate Driving Business Success Integrating Product is a compilation of the most recent design trends as a series of slides. It is suitable for any subject or industry presentation, containing attractive visuals and photo spots for businesses to clearly express their messages. This template contains a variety of slides for the user to input data, such as structures to contrast two elements, bullet points, and slides for written information. Slidegeeks is prepared to create an impression. This slide highlights impact of attribution analysis on click through rate aimed at improving effectiveness of call to action button. It covers details on total clicks, impressions, average CTR, position with key insights
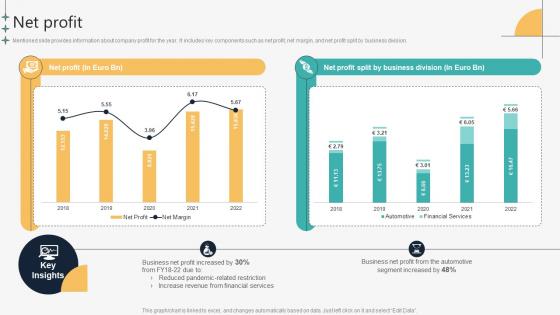
Net Profit Automotive Manufacturing Company Profile CP SS V
Mentioned slide provides information about company profit for the year. It includes key components such as net profit, net margin, and net profit split by business division.The Net Profit Automotive Manufacturing Company Profile CP SS V is a compilation of the most recent design trends as a series of slides. It is suitable for any subject or industry presentation, containing attractive visuals and photo spots for businesses to clearly express their messages. This template contains a variety of slides for the user to input data, such as structures to contrast two elements, bullet points, and slides for written information. Slidegeeks is prepared to create an impression. Mentioned slide provides information about company profit for the year. It includes key components such as net profit, net margin, and net profit split by business division.

Segment 4 Healthcare Multinational Conglomerate Company Profile CP SS V
This slide represents financial overview of 3Ms business unit healthcare. It covers details regarding sales, organic sales, operating margin, etc.The Segment 4 Healthcare Multinational Conglomerate Company Profile CP SS V is a compilation of the most recent design trends as a series of slides. It is suitable for any subject or industry presentation, containing attractive visuals and photo spots for businesses to clearly express their messages. This template contains a variety of slides for the user to input data, such as structures to contrast two elements, bullet points, and slides for written information. Slidegeeks is prepared to create an impression. This slide represents financial overview of 3Ms business unit healthcare. It covers details regarding sales, organic sales, operating margin, etc.
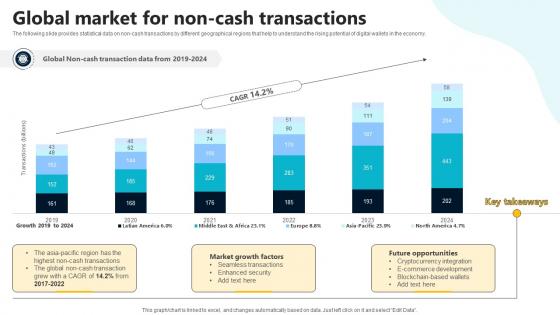
Global Market For Non Cash Transactions In Depth Guide To Digital Wallets Fin SS V
The following slide provides statistical data on non-cash transactions by different geographical regions that help to understand the rising potential of digital wallets in the economy. The Global Market For Non Cash Transactions In Depth Guide To Digital Wallets Fin SS V is a compilation of the most recent design trends as a series of slides. It is suitable for any subject or industry presentation, containing attractive visuals and photo spots for businesses to clearly express their messages. This template contains a variety of slides for the user to input data, such as structures to contrast two elements, bullet points, and slides for written information. Slidegeeks is prepared to create an impression. The following slide provides statistical data on non-cash transactions by different geographical regions that help to understand the rising potential of digital wallets in the economy.

Hr Recruitment Dashboard Showcasing Open Positions By Analysing Hr Data For Effective Decision Making
This slide showcases a dashboard that helps organizations track and monitor the hiring process. It includes total applicants, shortlisted candidates, hired candidates, rejected candidates, time to hire, cost to hire, etc. The Hr Recruitment Dashboard Showcasing Open Positions By Analysing Hr Data For Effective Decision Making is a compilation of the most recent design trends as a series of slides. It is suitable for any subject or industry presentation, containing attractive visuals and photo spots for businesses to clearly express their messages. This template contains a variety of slides for the user to input data, such as structures to contrast two elements, bullet points, and slides for written information. Slidegeeks is prepared to create an impression. This slide showcases a dashboard that helps organizations track and monitor the hiring process. It includes total applicants, shortlisted candidates, hired candidates, rejected candidates, time to hire, cost to hire, etc.

Empowering The Future Statistical Graph Showcasing Smart Meter Market Growth IoT SS V
This slide showcases information about the global market size of smart meters. It includes key reasons such as government initiatives to promote energy conversation, smart city initiatives, accurate billing process, etc. The Empowering The Future Statistical Graph Showcasing Smart Meter Market Growth IoT SS V is a compilation of the most recent design trends as a series of slides. It is suitable for any subject or industry presentation, containing attractive visuals and photo spots for businesses to clearly express their messages. This template contains a variety of slides for the user to input data, such as structures to contrast two elements, bullet points, and slides for written information. Slidegeeks is prepared to create an impression. This slide showcases information about the global market size of smart meters. It includes key reasons such as government initiatives to promote energy conversation, smart city initiatives, accurate billing process, etc.
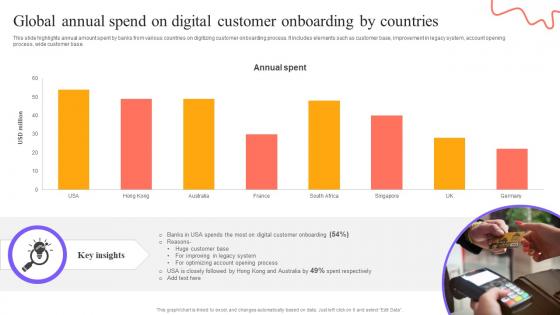
Digital Approach To Client Global Annual Spend On Digital Customer Onboarding
This slide highlights annual amount spent by banks from various countries on digitizing customer onboarding process. It includes elements such as customer base, improvement in legacy system, account opening process, wide customer base. The Digital Approach To Client Global Annual Spend On Digital Customer Onboarding is a compilation of the most recent design trends as a series of slides. It is suitable for any subject or industry presentation, containing attractive visuals and photo spots for businesses to clearly express their messages. This template contains a variety of slides for the user to input data, such as structures to contrast two elements, bullet points, and slides for written information. Slidegeeks is prepared to create an impression. This slide highlights annual amount spent by banks from various countries on digitizing customer onboarding process. It includes elements such as customer base, improvement in legacy system, account opening process, wide customer base.
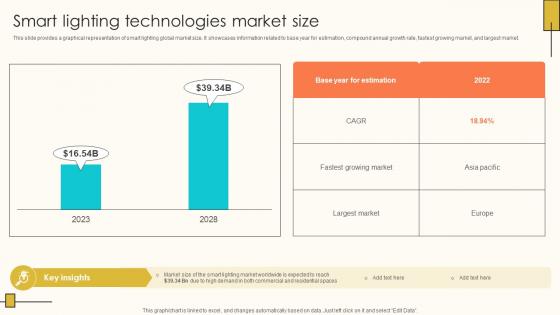
Smart Lighting Technologies Market Size Internet Of Things Solutions To Enhance Energy IoT SS V
This slide provides a graphical representation of smart lighting global market size. It showcases information related to base year for estimation, compound annual growth rate, fastest growing market, and largest market. The Smart Lighting Technologies Market Size Internet Of Things Solutions To Enhance Energy IoT SS V is a compilation of the most recent design trends as a series of slides. It is suitable for any subject or industry presentation, containing attractive visuals and photo spots for businesses to clearly express their messages. This template contains a variety of slides for the user to input data, such as structures to contrast two elements, bullet points, and slides for written information. Slidegeeks is prepared to create an impression. This slide provides a graphical representation of smart lighting global market size. It showcases information related to base year for estimation, compound annual growth rate, fastest growing market, and largest market.
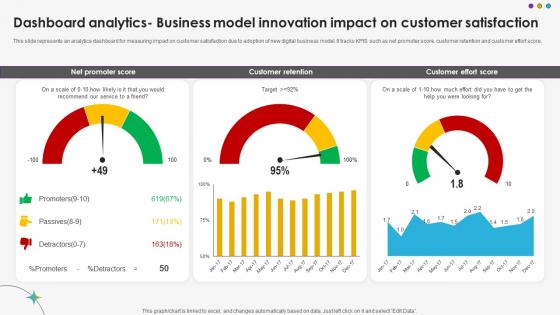
Dashboard Analytics Business Model Innovation Impact On Customer Satisfaction DT SS V
This slide represents an analytics dashboard for measuring impact on customer satisfaction due to adoption of new digital business model. It tracks KPIS such as net promoter score, customer retention and customer effort score.The Dashboard Analytics Business Model Innovation Impact On Customer Satisfaction DT SS V is a compilation of the most recent design trends as a series of slides. It is suitable for any subject or industry presentation, containing attractive visuals and photo spots for businesses to clearly express their messages. This template contains a variety of slides for the user to input data, such as structures to contrast two elements, bullet points, and slides for written information. Slidegeeks is prepared to create an impression. This slide represents an analytics dashboard for measuring impact on customer satisfaction due to adoption of new digital business model. It tracks KPIS such as net promoter score, customer retention and customer effort score.
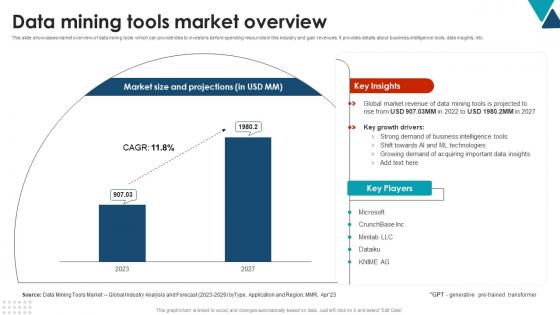
Data Mining Tools Market Overview Using Data Mining Tools To Optimize Processes AI SS V
This slide showcases market overview of data mining tools which can provide idea to investors before spending resources in this industry and gain revenues. It provides details about business intelligence tools, data insights, etc. The Data Mining Tools Market Overview Using Data Mining Tools To Optimize Processes AI SS V is a compilation of the most recent design trends as a series of slides. It is suitable for any subject or industry presentation, containing attractive visuals and photo spots for businesses to clearly express their messages. This template contains a variety of slides for the user to input data, such as structures to contrast two elements, bullet points, and slides for written information. Slidegeeks is prepared to create an impression. This slide showcases market overview of data mining tools which can provide idea to investors before spending resources in this industry and gain revenues. It provides details about business intelligence tools, data insights, etc.
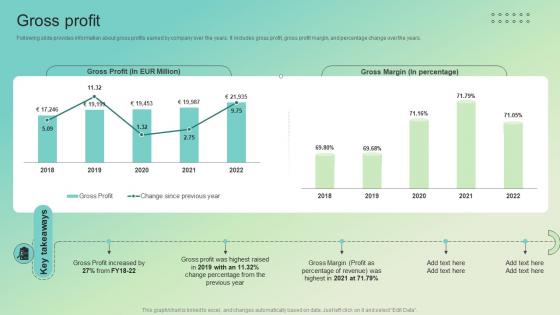
Gross Profit Enterprise Software Solution Providing Company Profile CP SS V
Following slide provides information about gross profits earned by company over the years. It includes gross profit, gross profit margin, and percentage change over the years.The Gross Profit Enterprise Software Solution Providing Company Profile CP SS V is a compilation of the most recent design trends as a series of slides. It is suitable for any subject or industry presentation, containing attractive visuals and photo spots for businesses to clearly express their messages. This template contains a variety of slides for the user to input data, such as structures to contrast two elements, bullet points, and slides for written information. Slidegeeks is prepared to create an impression. Following slide provides information about gross profits earned by company over the years. It includes gross profit, gross profit margin, and percentage change over the years.
Net Profit Automobile Development Company Profile CP SS V
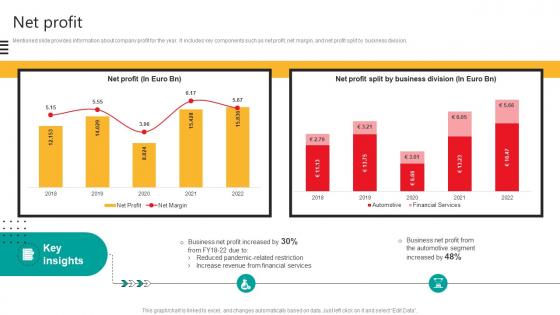
Mentioned slide provides information about company profit for the year. It includes key components such as net profit, net margin, and net profit split by business division.The Net Profit Automobile Development Company Profile CP SS V is a compilation of the most recent design trends as a series of slides. It is suitable for any subject or industry presentation, containing attractive visuals and photo spots for businesses to clearly express their messages. This template contains a variety of slides for the user to input data, such as structures to contrast two elements, bullet points, and slides for written information. Slidegeeks is prepared to create an impression. Mentioned slide provides information about company profit for the year. It includes key components such as net profit, net margin, and net profit split by business division.
Beginners Guide To Commercial Global Commercial Banking Market Size Fin SS V
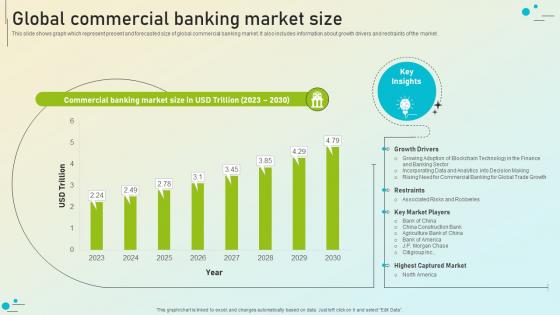
This slide shows graph which represent present and forecasted size of global commercial banking market. It also includes information about growth drivers and restraints of the market. The Beginners Guide To Commercial Global Commercial Banking Market Size Fin SS V is a compilation of the most recent design trends as a series of slides. It is suitable for any subject or industry presentation, containing attractive visuals and photo spots for businesses to clearly express their messages. This template contains a variety of slides for the user to input data, such as structures to contrast two elements, bullet points, and slides for written information. Slidegeeks is prepared to create an impression. This slide shows graph which represent present and forecasted size of global commercial banking market. It also includes information about growth drivers and restraints of the market.
GPT 4 Model Overview Features Focus Generative AI For Better Productivity AI SS V
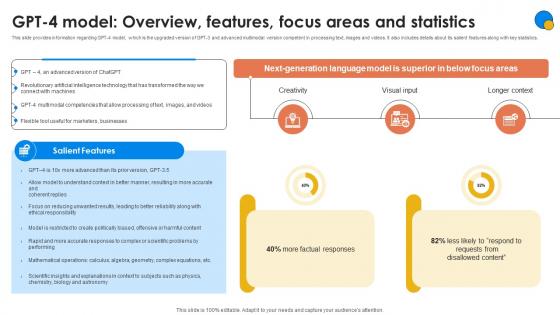
This slide provides information regarding GPT-4 model, which is the upgraded version of GPT-3 and advanced multimodal version competent in processing text, images and videos. It also includes details about its salient features along with key statistics. The GPT 4 Model Overview Features Focus Generative AI For Better Productivity AI SS V is a compilation of the most recent design trends as a series of slides. It is suitable for any subject or industry presentation, containing attractive visuals and photo spots for businesses to clearly express their messages. This template contains a variety of slides for the user to input data, such as structures to contrast two elements, bullet points, and slides for written information. Slidegeeks is prepared to create an impression. This slide provides information regarding GPT-4 model, which is the upgraded version of GPT-3 and advanced multimodal version competent in processing text, images and videos. It also includes details about its salient features along with key statistics.

Shareholders Equity Global Consulting And Technology Services Company Profile CP SS V
This slide represents on financial highlights of Accenture, which represents shareholders equity for last five years from 2018 to 2022.The Shareholders Equity Global Consulting And Technology Services Company Profile CP SS V is a compilation of the most recent design trends as a series of slides. It is suitable for any subject or industry presentation, containing attractive visuals and photo spots for businesses to clearly express their messages. This template contains a variety of slides for the user to input data, such as structures to contrast two elements, bullet points, and slides for written information. Slidegeeks is prepared to create an impression. This slide represents on financial highlights of Accenture, which represents shareholders equity for last five years from 2018 to 2022.
Global Unsecured Consumer Finance Market Overview Ppt Example CRP DK SS V
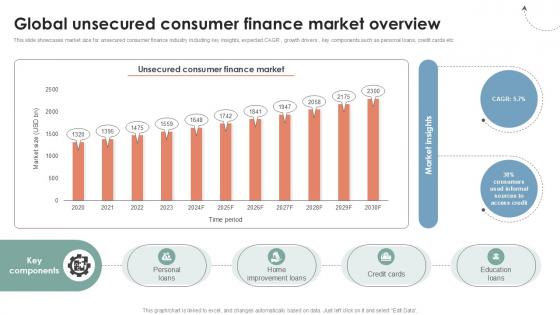
This slide showcases market size for unsecured consumer finance industry including key insights, expected CAGR , growth drivers , key components such as personal loans, credit cards etc. The Global Unsecured Consumer Finance Market Overview Ppt Example CRP DK SS V is a compilation of the most recent design trends as a series of slides. It is suitable for any subject or industry presentation, containing attractive visuals and photo spots for businesses to clearly express their messages. This template contains a variety of slides for the user to input data, such as structures to contrast two elements, bullet points, and slides for written information. Slidegeeks is prepared to create an impression. This slide showcases market size for unsecured consumer finance industry including key insights, expected CAGR , growth drivers , key components such as personal loans, credit cards etc.
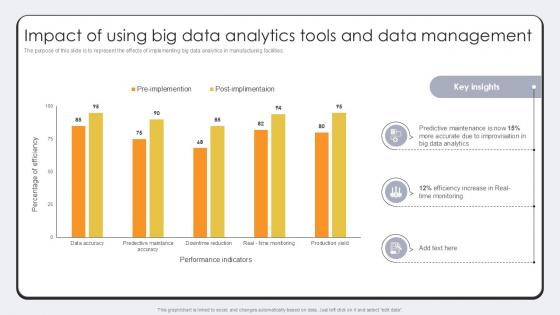
Impact Of Using Big Data Analytics Revolutionizing Production IoT Ppt Sample
The purpose of this slide is to represent the effects of implementing big data analytics in manufacturing facilities. The Impact Of Using Big Data Analytics Revolutionizing Production IoT Ppt Sample is a compilation of the most recent design trends as a series of slides. It is suitable for any subject or industry presentation, containing attractive visuals and photo spots for businesses to clearly express their messages. This template contains a variety of slides for the user to input data, such as structures to contrast two elements, bullet points, and slides for written information. Slidegeeks is prepared to create an impression. The purpose of this slide is to represent the effects of implementing big data analytics in manufacturing facilities.
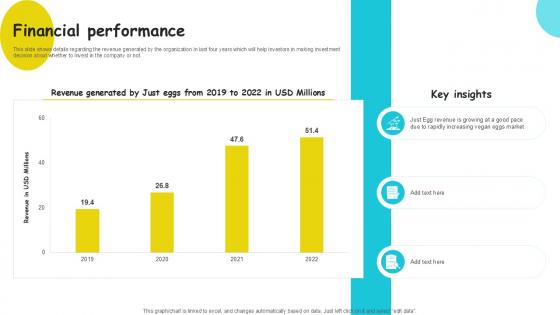
Financial Performance Plant Based Eggs Developing Company Investor PPT Slide
This slide shows details regarding the revenue generated by the organization in last four years which will help investors in making investment decision about whether to invest in the company or not. The Financial Performance Plant Based Eggs Developing Company Investor PPT Slide is a compilation of the most recent design trends as a series of slides. It is suitable for any subject or industry presentation, containing attractive visuals and photo spots for businesses to clearly express their messages. This template contains a variety of slides for the user to input data, such as structures to contrast two elements, bullet points, and slides for written information. Slidegeeks is prepared to create an impression. This slide shows details regarding the revenue generated by the organization in last four years which will help investors in making investment decision about whether to invest in the company or not.

Human Resource Monthly Employee Engagement Report PPT Example SS
This slide represents the employee engagement report prepared by the human resource team. It includes details related to response rate, highlights, factors, questions, factor and question summary etc. The Human Resource Monthly Employee Engagement Report PPT Example SS is a compilation of the most recent design trends as a series of slides. It is suitable for any subject or industry presentation, containing attractive visuals and photo spots for businesses to clearly express their messages. This template contains a variety of slides for the user to input data, such as structures to contrast two elements, bullet points, and slides for written information. Slidegeeks is prepared to create an impression. This slide represents the employee engagement report prepared by the human resource team. It includes details related to response rate, highlights, factors, questions, factor and question summary etc.
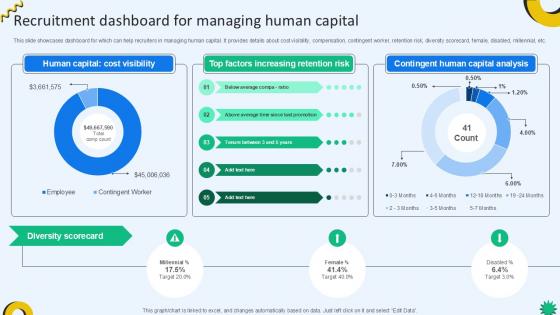
Recruitment Dashboard For Managing Cloud Recruiting Technologies PPT Example
This slide showcases dashboard for which can help recruiters in managing human capital. It provides details about cost visibility, compensation, contingent worker, retention risk, diversity scorecard, female, disabled, millennial, etc. The Recruitment Dashboard For Managing Cloud Recruiting Technologies PPT Example is a compilation of the most recent design trends as a series of slides. It is suitable for any subject or industry presentation, containing attractive visuals and photo spots for businesses to clearly express their messages. This template contains a variety of slides for the user to input data, such as structures to contrast two elements, bullet points, and slides for written information. Slidegeeks is prepared to create an impression. This slide showcases dashboard for which can help recruiters in managing human capital. It provides details about cost visibility, compensation, contingent worker, retention risk, diversity scorecard, female, disabled, millennial, etc.
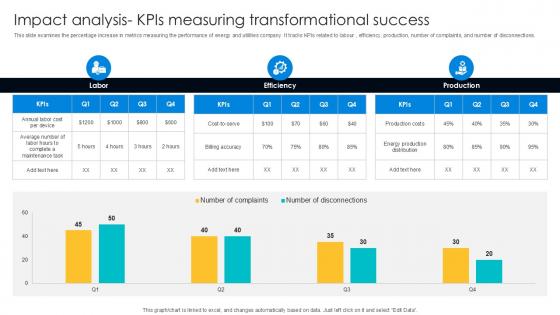
Impact Analysis KPIs Measuring Digital Transformation Journey PPT Presentation DT SS V
This slide examines the percentage increase in metrics measuring the performance of energy and utilities company. It tracks KPIs related to labour , efficiency, production, number of complaints, and number of disconnections. The Impact Analysis KPIs Measuring Digital Transformation Journey PPT Presentation DT SS V is a compilation of the most recent design trends as a series of slides. It is suitable for any subject or industry presentation, containing attractive visuals and photo spots for businesses to clearly express their messages. This template contains a variety of slides for the user to input data, such as structures to contrast two elements, bullet points, and slides for written information. Slidegeeks is prepared to create an impression. This slide examines the percentage increase in metrics measuring the performance of energy and utilities company. It tracks KPIs related to labour , efficiency, production, number of complaints, and number of disconnections.
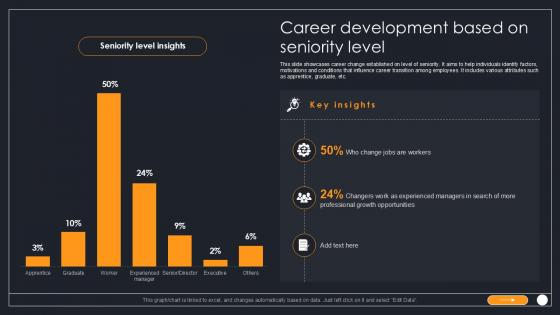
Career Development Based On Seniority Level PPT Presentation SS
This slide showcases career change established on level of seniority. It aims to help individuals identify factors, motivations and conditions that influence career transition among employees. It includes various attributes such as apprentice, graduate, etc. The Career Development Based On Seniority Level PPT Presentation SS is a compilation of the most recent design trends as a series of slides. It is suitable for any subject or industry presentation, containing attractive visuals and photo spots for businesses to clearly express their messages. This template contains a variety of slides for the user to input data, such as structures to contrast two elements, bullet points, and slides for written information. Slidegeeks is prepared to create an impression. This slide showcases career change established on level of seniority. It aims to help individuals identify factors, motivations and conditions that influence career transition among employees. It includes various attributes such as apprentice, graduate, etc.
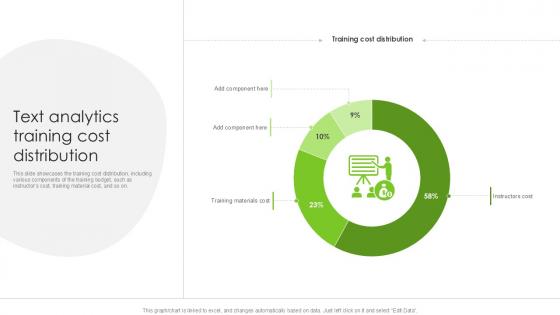
Text Analytics Training Cost Distribution PPT Sample SS
This slide showcases the training cost distribution, including various components of the training budget, such as instructors cost, training material cost, and so on. The Text Analytics Training Cost Distribution PPT Sample SS is a compilation of the most recent design trends as a series of slides. It is suitable for any subject or industry presentation, containing attractive visuals and photo spots for businesses to clearly express their messages. This template contains a variety of slides for the user to input data, such as structures to contrast two elements, bullet points, and slides for written information. Slidegeeks is prepared to create an impression. This slide showcases the training cost distribution, including various components of the training budget, such as instructors cost, training material cost, and so on.
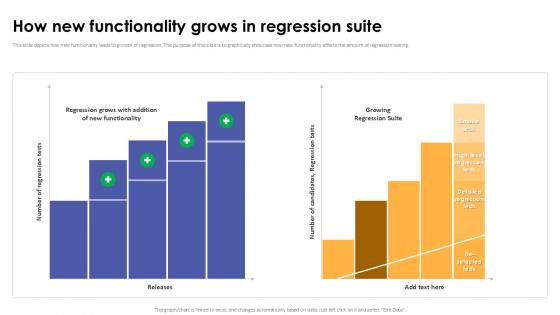
How New Functionality Grows In Regression Suite Corrective Regression Testing Ppt Sample
This slide depicts how new functionality leads to growth of regression. The purpose of this slide is to graphically showcase how new functionality effects the amount of regression testing. The How New Functionality Grows In Regression Suite Corrective Regression Testing Ppt Sample is a compilation of the most recent design trends as a series of slides. It is suitable for any subject or industry presentation, containing attractive visuals and photo spots for businesses to clearly express their messages. This template contains a variety of slides for the user to input data, such as structures to contrast two elements, bullet points, and slides for written information. Slidegeeks is prepared to create an impression. This slide depicts how new functionality leads to growth of regression. The purpose of this slide is to graphically showcase how new functionality effects the amount of regression testing.
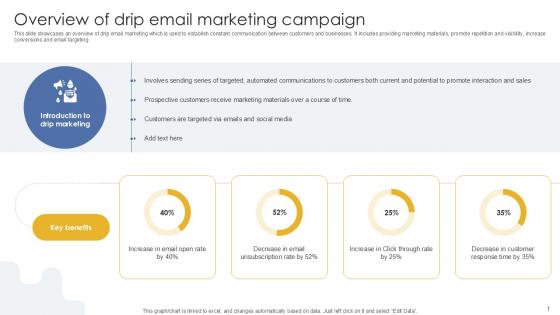
Overview Of Drip Email Marketing Campaign PPT Example MKT SS V
This slide showcases an overview of drip email marketing which is used to establish constant communication between customers and businesses. It includes providing marketing materials, promote repetition and visibility, increase conversions and email targeting. The Overview Of Drip Email Marketing Campaign PPT Example MKT SS V is a compilation of the most recent design trends as a series of slides. It is suitable for any subject or industry presentation, containing attractive visuals and photo spots for businesses to clearly express their messages. This template contains a variety of slides for the user to input data, such as structures to contrast two elements, bullet points, and slides for written information. Slidegeeks is prepared to create an impression. This slide showcases an overview of drip email marketing which is used to establish constant communication between customers and businesses. It includes providing marketing materials, promote repetition and visibility, increase conversions and email targeting.
Marine Port Market Insights Port Terminal Industry Ppt Sample
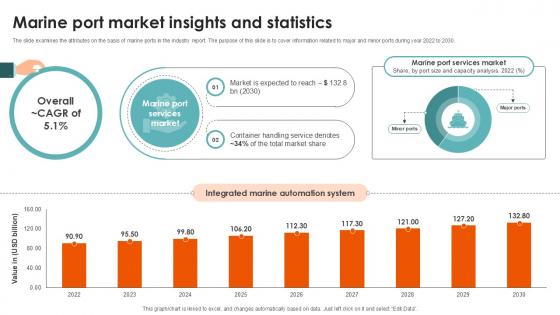
The slide examines the attributes on the basis of marine ports in the industry report. The purpose of this slide is to cover information related to major and minor ports during year 2022 to 2030. The Marine Port Market Insights Port Terminal Industry Ppt Sample is a compilation of the most recent design trends as a series of slides. It is suitable for any subject or industry presentation, containing attractive visuals and photo spots for businesses to clearly express their messages. This template contains a variety of slides for the user to input data, such as structures to contrast two elements, bullet points, and slides for written information. Slidegeeks is prepared to create an impression. The slide examines the attributes on the basis of marine ports in the industry report. The purpose of this slide is to cover information related to major and minor ports during year 2022 to 2030.
Recruitment Dashboard For Managing Human Capital PPT Example
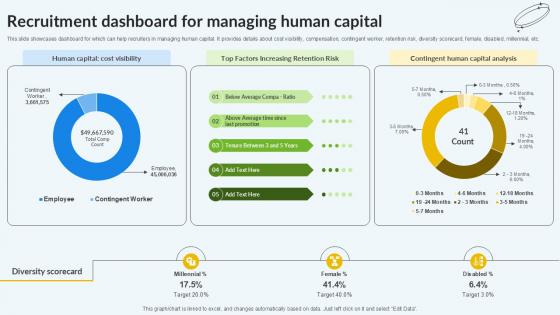
This slide showcases dashboard for which can help recruiters in managing human capital. It provides details about cost visibility, compensation, contingent worker, retention risk, diversity scorecard, female, disabled, millennial, etc. The Recruitment Dashboard For Managing Human Capital PPT Example is a compilation of the most recent design trends as a series of slides. It is suitable for any subject or industry presentation, containing attractive visuals and photo spots for businesses to clearly express their messages. This template contains a variety of slides for the user to input data, such as structures to contrast two elements, bullet points, and slides for written information. Slidegeeks is prepared to create an impression. This slide showcases dashboard for which can help recruiters in managing human capital. It provides details about cost visibility, compensation, contingent worker, retention risk, diversity scorecard, female, disabled, millennial, etc.
Global Market Analysis Of Infrastructure IAC Tools For Performance Analysis PPT Presentation
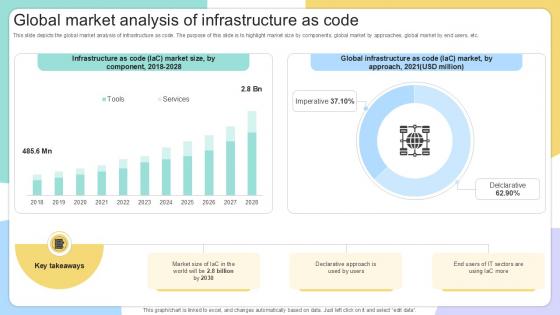
This slide depicts the global market analysis of infrastructure as code. The purpose of this slide is to highlight market size by components, global market by approaches, global market by end users, etc. The Global Market Analysis Of Infrastructure IAC Tools For Performance Analysis PPT Presentation is a compilation of the most recent design trends as a series of slides. It is suitable for any subject or industry presentation, containing attractive visuals and photo spots for businesses to clearly express their messages. This template contains a variety of slides for the user to input data, such as structures to contrast two elements, bullet points, and slides for written information. Slidegeeks is prepared to create an impression. This slide depicts the global market analysis of infrastructure as code. The purpose of this slide is to highlight market size by components, global market by approaches, global market by end users, etc.
Corporate Health And Wellness Corporate Program Operations With Impact Icons PDF
This slide showcase some of the activities which can be implemented by management in order to improve health and wellness of employees. It consist of activities such as yoga groups implementation, set up medical clinics, indoor activities and their impact on employees. Persuade your audience using this Corporate Health And Wellness Corporate Program Operations With Impact Icons PDF. This PPT design covers two stages, thus making it a great tool to use. It also caters to a variety of topics including Program Activities, Impact, Establish, Yoga And Meditation, Group. Download this PPT design now to present a convincing pitch that not only emphasizes the topic but also showcases your presentation skills.
Proposal For Employee Training Program Deliverables One Pager Sample Example Document
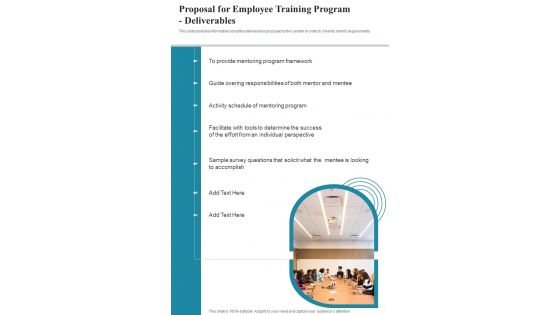
This slide provides information about the deliverables proposed by the sender in order to meet its clients requirements. Presenting you an exemplary Proposal For Employee Training Program Deliverables One Pager Sample Example Document. Our one-pager comprises all the must-have essentials of an inclusive document. You can edit it with ease, as its layout is completely editable. With such freedom, you can tweak its design and other elements to your requirements. Download this Proposal For Employee Training Program Deliverables One Pager Sample Example Document brilliant piece now.

Key Dimensions Of Business Excellence Intelligence Framework Rules PDF
This slide defines the seven dimensions of organizational intelligence an enterprise must be consistently improving in each of these seven crucial areas in order to be going in the direction of its highest potential.. It includes dimensions such as strategic vision, appetite for change, knowledge deployment, alignment and congruence, performance pressure, hearty and shared fate. Persuade your audience using this Key Dimensions Of Business Excellence Intelligence Framework Rules PDF. This PPT design covers seven stages, thus making it a great tool to use. It also caters to a variety of topics including Strategic Vision, Appetite For Change, Knowledge Deployment. Download this PPT design now to present a convincing pitch that not only emphasizes the topic but also showcases your presentation skills.
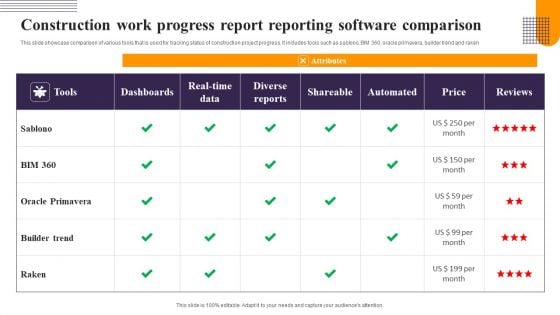
Construction Work Progress Report Reporting Software Comparison Professional PDF
This slide showcase comparison of various tools that is used for tracking status of construction project progress. It includes tools such as sablono, BIM 360, oracle primavera, builder trend and raken Showcasing this set of slides titled Construction Work Progress Report Reporting Software Comparison Professional PDF. The topics addressed in these templates are Tools, Dashboards, Attributes . All the content presented in this PPT design is completely editable. Download it and make adjustments in color, background, font etc. as per your unique business setting.
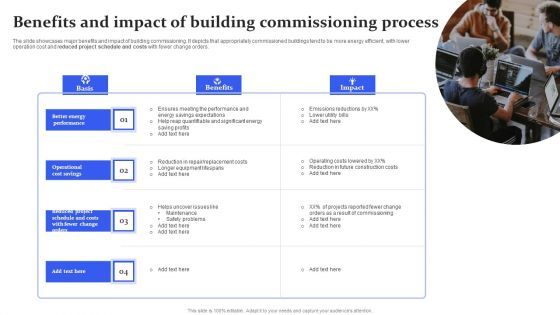
Benefits And Impact Of Building Commissioning Process Ppt File Backgrounds PDF
The slide showcases major benefits and impact of building commissioning. it depicts that appropriately commissioned buildings tend to be more energy efficient, with lower operation cost and reduced project schedule and costs with fewer change orders. Persuade your audience using this Benefits And Impact Of Building Commissioning Process Ppt File Backgrounds PDF. This PPT design covers four stages, thus making it a great tool to use. It also caters to a variety of topics including Better Energy Performance, Operational Cost Savings, Benefits. Download this PPT design now to present a convincing pitch that not only emphasizes the topic but also showcases your presentation skills.
Blue Data Space PowerPoint Icon C
Microsoft PowerPoint Template and Background with stock trend Project your views with our Blue Data Space PowerPoint Icon C. Download without worries with our money back guaranteee.
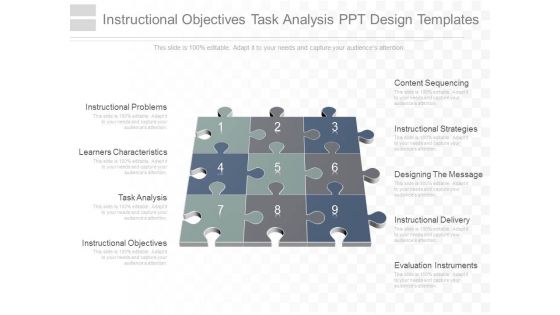
Instructional Objectives Task Analysis Ppt Design Templates
This is a instructional objectives task analysis ppt design templates. This is a nine stage process. The stages in this process are learners characteristics, instructional problems, task analysis, instructional objectives, content sequencing, instructional strategies, designing the message, instructional delivery, evaluation instruments.\n\n\n\n\n\n\n\n\n\n\n\n
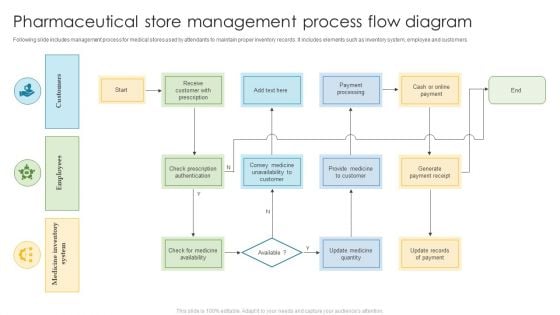
Pharmaceutical Store Management Process Flow Diagram Brochure PDF
Following slide includes management process for medical stores used by attendants to maintain proper inventory records. It includes elements such as inventory system, employee and customers.Persuade your audience using this Pharmaceutical Store Management Process Flow Diagram Brochure PDF. This PPT design covers one stage, thus making it a great tool to use. It also caters to a variety of topics including Conduct Product, Product Pictures, Manage Order Received. Download this PPT design now to present a convincing pitch that not only emphasizes the topic but also showcases your presentation skills.
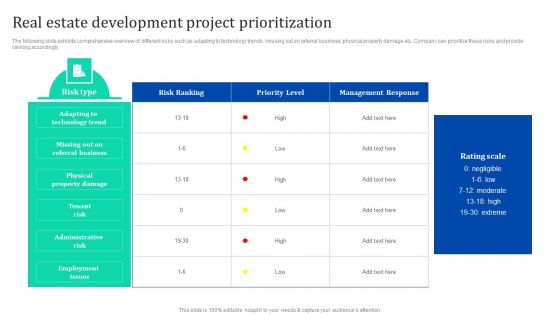
Real Estate Development Project Prioritization Enhancing Process Improvement By Regularly Background PDF
The following slide exhibits comprehensive overview of different risks such as adapting to technology trends, missing out on referral business, physical property damage etc. Company can prioritize these risks and provide ranking accordingly. Retrieve professionally designed Real Estate Development Project Prioritization Enhancing Process Improvement By Regularly Background PDF to effectively convey your message and captivate your listeners. Save time by selecting pre-made slideshows that are appropriate for various topics, from business to educational purposes. These themes come in many different styles, from creative to corporate, and all of them are easily adjustable and can be edited quickly. Access them as PowerPoint templates or as Google Slides themes. You do not have to go on a hunt for the perfect presentation because Slidegeeks got you covered from everywhere.
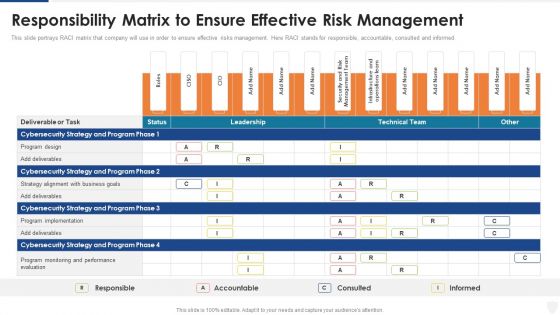
Responsibility Matrix To Ensure Effective Risk Management Ppt Summary Outfit PDF
This slide portrays RACI matrix that company will use in order to ensure effective risks management. Here RACI stands for responsible, accountable, consulted and informed. Deliver and pitch your topic in the best possible manner with this responsibility matrix to ensure effective risk management ppt summary outfit pdf. Use them to share invaluable insights on strategy, business goals, program design, evaluation and impress your audience. This template can be altered and modified as per your expectations. So, grab it now.
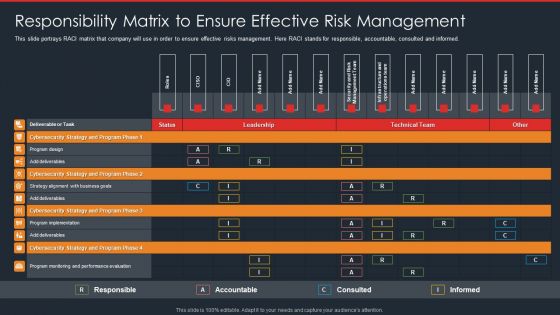
Data Safety Initiatives Responsibility Matrix To Ensure Effective Risk Management Summary PDF
This slide portrays RACI matrix that company will use in order to ensure effective risks management. Here RACI stands for responsible, accountable, consulted and informed. Deliver and pitch your topic in the best possible manner with this data safety initiatives responsibility matrix to ensure effective risk management summary pdf. Use them to share invaluable insights on cybersecurity strategy and program phase, technical team, leadership and impress your audience. This template can be altered and modified as per your expectations. So, grab it now.
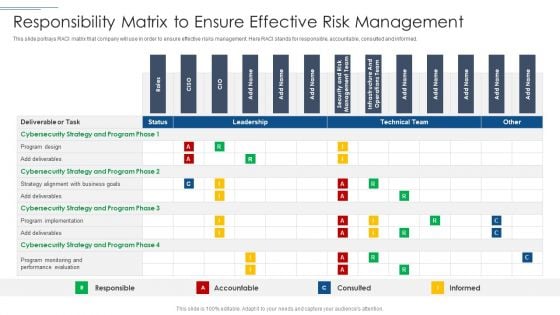
IT Security Risk Management Approach Introduction Responsibility Matrix To Ensure Effective Risk Management Mockup PDF
This slide portrays RACI matrix that company will use in order to ensure effective risks management. Here RACI stands for responsible, accountable, consulted and informed. Deliver an awe inspiring pitch with this creative IT Security Risk Management Approach Introduction Responsibility Matrix To Ensure Effective Risk Management Mockup PDF bundle. Topics like Program Design, Cybersecurity Strategy, Performance Evaluation can be discussed with this completely editable template. It is available for immediate download depending on the needs and requirements of the user.
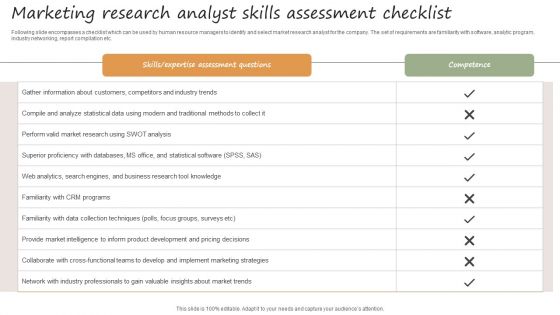
Marketing Research Analyst Skills Assessment Checklist Inspiration PDF
Following slide encompasses a checklist which can be used by human resource managers to identify and select market research analyst for the company. The set of requirements are familiarity with software, analytic program, industry networking, report compilation etc. Showcasing this set of slides titled Marketing Research Analyst Skills Assessment Checklist Inspiration PDF. The topics addressed in these templates are Gather Information Customers, Competitors Industry Trends, Statistical Data Using Modern. All the content presented in this PPT design is completely editable. Download it and make adjustments in color, background, font etc. as per your unique business setting.
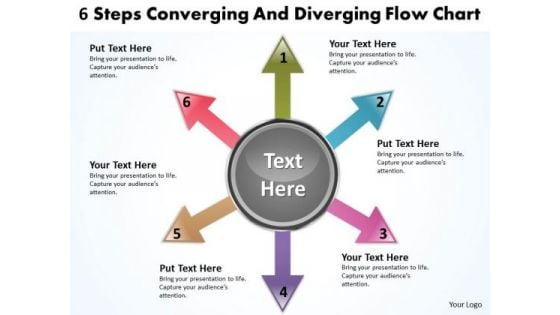
6 Steps Converging And Diverging Flow Chart Relative Cycle Arrow PowerPoint Slides
We present our 6 steps converging and diverging flow chart Relative Cycle Arrow PowerPoint Slides.Use our Arrows PowerPoint Templates because this diagram put it all together to form the complete picture and reach the goal. Use our Circle Charts PowerPoint Templates because this is An innovative slide design depicting driving home the relevance of a steady rhythm. Download and present our Shapes PowerPoint Templates because they will Amplify your basic corporate concept and forefront the benefits of overlapping processes to arrive at common goals. Present our Business PowerPoint Templates because the majestic tiger lord of all it surveys.It exudes power even when it is in repose. Present our Flow Charts PowerPoint Templates because you have good reasons to back up the strength of your belief.Use these PowerPoint slides for presentations relating to ahead, aim, aqua, arrow, back, backward, blue, circle, colorful, converge, converging, course, direction, diverge, diverging, green, header, illustration, left, move, movement, orange, orientation, point, red, right, ring, round, trend, vector, way, yellow. The prominent colors used in the PowerPoint template are Blue, Pink, Purple. Presenters tell us our 6 steps converging and diverging flow chart Relative Cycle Arrow PowerPoint Slides are Fashionable. You can be sure our colorful PowerPoint templates and PPT Slides are Elevated. Professionals tell us our 6 steps converging and diverging flow chart Relative Cycle Arrow PowerPoint Slides are Fancy. People tell us our circle PowerPoint templates and PPT Slides are Detailed. People tell us our 6 steps converging and diverging flow chart Relative Cycle Arrow PowerPoint Slides are Beautiful. Professionals tell us our back PowerPoint templates and PPT Slides are Breathtaking. Our 6 Steps Converging And Diverging Flow Chart Relative Cycle Arrow PowerPoint Slides will ensure your ideas are presented well. You will be glad you tried us out.
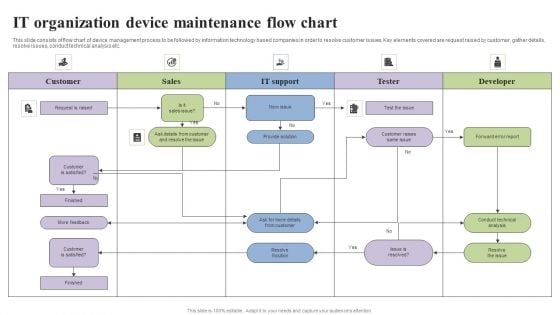
It Organization Device Maintenance Flow Chart Formats PDF
This slide consists of flow chart of device management process to be followed by information technology based companies in order to resolve customer issues. Key elements covered are request raised by customer, gather details, resolve issues, conduct technical analysis etc. Presenting It Organization Device Maintenance Flow Chart Formats PDF to dispense important information. This template comprises one stages. It also presents valuable insights into the topics including Customer, Sales, Tester. This is a completely customizable PowerPoint theme that can be put to use immediately. So, download it and address the topic impactfully.

3d Christmas Tree Celebrations PowerPoint Templates Ppt Backgrounds For Slides 1212
We present our 3d Christmas Tree Celebrations PowerPoint Templates PPT Backgrounds For Slides 1212.Download and present our Christmas PowerPoint Templates because the evergreen fir is the tree of choice in this season. Present our Festival PowerPoint Templates because this slide represents the tools of the trade. Download and present our Holidays PowerPoint Templates because you have a good idea of the roadmap to your desired destination. Present our Stars PowerPoint Templates because this template helps you to illustrate your method, piece by piece, and interlock the whole process in the minds of your audience. Download and present our New year PowerPoint Templates because you have the right attitude and great ideas to chart the way in the new year.Use these PowerPoint slides for presentations relating to Christmas tree celebrations, holidays, new year, christmas, stars, festival. The prominent colors used in the PowerPoint template are Green, Yellow, Red. Professionals tell us our 3d Christmas Tree Celebrations PowerPoint Templates PPT Backgrounds For Slides 1212 are Fashionable. We assure you our christmas PowerPoint templates and PPT Slides are Zippy. PowerPoint presentation experts tell us our 3d Christmas Tree Celebrations PowerPoint Templates PPT Backgrounds For Slides 1212 are Luxuriant. Presenters tell us our PowerPoint templates and PPT Slides are Ultra. The feedback we get is that our 3d Christmas Tree Celebrations PowerPoint Templates PPT Backgrounds For Slides 1212 are Adorable. You can be sure our festival PowerPoint templates and PPT Slides are No-nonsense. Make a grand entry with your ideas. Our 3d Christmas Tree Celebrations PowerPoint Templates Ppt Backgrounds For Slides 1212 will trumpet your words.
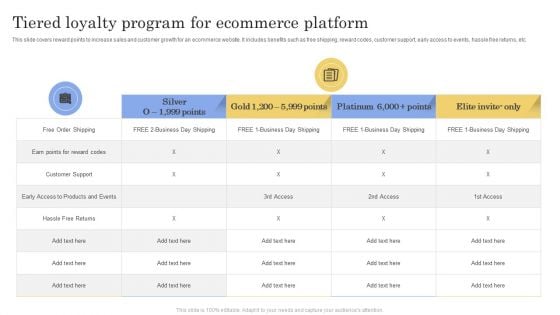
Tiered Loyalty Program For Ecommerce Platform Ppt Pictures Graphics Example PDF
This slide covers reward points to increase sales and customer growth for an ecommerce website. It includes benefits such as free shipping, reward codes, customer support, early access to events, hassle free returns, etc. Pitch your topic with ease and precision using this Tiered Loyalty Program For Ecommerce Platform Ppt Pictures Graphics Example PDF. This layout presents information on Free Order Shipping, Customer Support, Hassle Free Returns. It is also available for immediate download and adjustment. So, changes can be made in the color, design, graphics or any other component to create a unique layout.

Product Marketing And Awareness Programs Creating Demand And Increasing The Number Designs PDF
The slides shows major objectives of the company in terms of product performance. Also, it shows the key initiatives that the company needs to take in order to achieve its set targets. If your project calls for a presentation, then Slidegeeks is your go-to partner because we have professionally designed, easy-to-edit templates that are perfect for any presentation. After downloading, you can easily edit Product Marketing And Awareness Programs Creating Demand And Increasing The Number Designs PDF and make the changes accordingly. You can rearrange slides or fill them with different images. Check out all the handy templates.
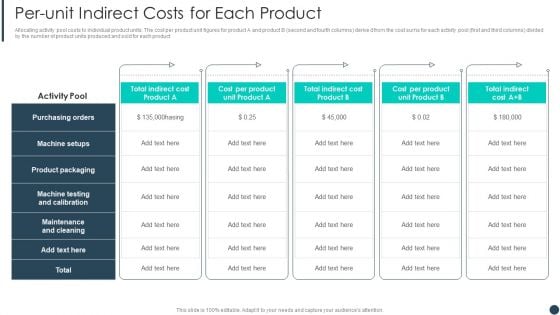
Cost Allotment Technique Per-Unit Indirect Costs For Each Product Pictures PDF
Deliver an awe inspiring pitch with this creative Cost Allotment Technique Per-Unit Indirect Costs For Each Product Pictures PDF bundle. Topics like Product Packaging, Maintenance Cleaning, Purchasing Orders can be discussed with this completely editable template. It is available for immediate download depending on the needs and requirements of the user.
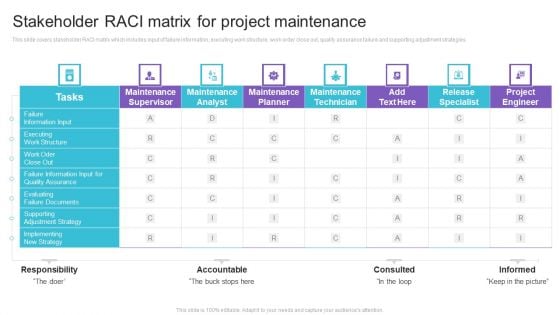
Stakeholder RACI Matrix For Project Maintenance Diagrams PDF
This slide covers stakeholder RACI matrix which includes input of failure information, executing work structure, work order close out, quality assurance failure and supporting adjustment strategies. Pitch your topic with ease and precision using this Stakeholder RACI Matrix For Project Maintenance Diagrams PDF. This layout presents information on Maintenance Supervisor, Maintenance Analyst, Maintenance Planner. It is also available for immediate download and adjustment. So, changes can be made in the color, design, graphics or any other component to create a unique layout.
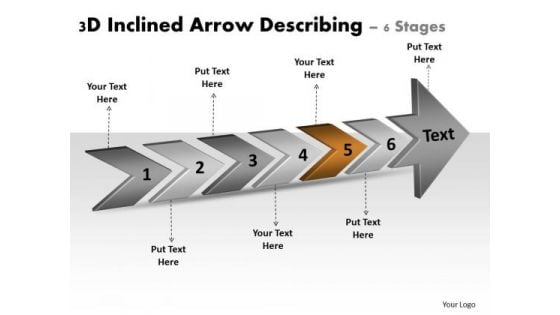
3d Inclined Arrow Describing 6 Stages Basic Process Flow Chart PowerPoint Templates
We present our 3d inclined arrow describing 6 stages basic process flow chart PowerPoint templates.Use our Finance PowerPoint Templates because,Let this slide illustrates others piggyback on you to see well over the horizon Use our Process and Flows PowerPoint Templates because, You are the star of your enlightened team. Use our Arrows PowerPoint Templates because,This Slide offers an excellent background to build up the various stages of your business process. Use our Shapes PowerPoint Templates because,You can Churn the wheels of the brains of your colleagues. Use our Business PowerPoint Templates because, It illustrates the city with a lasting tryst with resilience. You epitomise the qualities that give your city its fameUse these PowerPoint slides for presentations relating to Advertising, arrow, background, banner, bookmark, card, choice, concept, creative, design, direction, flow, idea, illustration, infographic, instruction, label, layout, manual, marketing, modern, next, number, offer, options, order, paper, process, product, promotion, sequence, simple, step, symbol, template, triangle, tutorial, vector, version, web. The prominent colors used in the PowerPoint template are Brown, Gray, Black Go get 'em with our 3d Inclined Arrow Describing 6 Stages Basic Process Flow Chart PowerPoint Templates.Be sure there will be no false bravado.
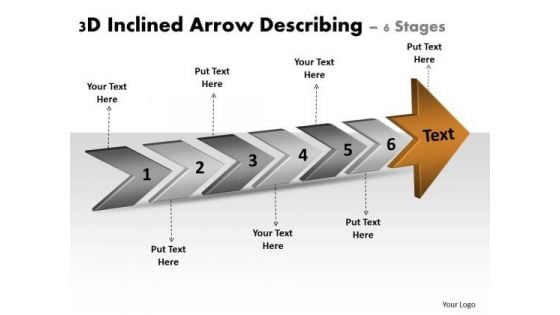
3d Inclined Arrow Describing 6 Stages Flow Chart Creator Online PowerPoint Templates
We present our 3d inclined arrow describing 6 stages flow chart creator online PowerPoint templates.Use our Finance PowerPoint Templates because,It shows how one can contribute to the overall feeling of well-being. Use our Process and Flows PowerPoint Templates because,This Slide offers an excellent background to build up the various stages of your business process. Use our Arrows PowerPoint Templates because,This diagram helps in examine each brilliant thought in thorough detail highlighting all the pros and cons as minutely as possible. Use our Shapes PowerPoint Templates because,you have the ability to judge Which out of late have been proving to be a hassle. Use our Business PowerPoint Templates because,You have selected your team man for manUse these PowerPoint slides for presentations relating to Advertising, arrow, background, banner, bookmark, card, choice, concept, creative, design, direction, flow, idea, illustration, infographic, instruction, label, layout, manual, marketing, modern, next, number, offer, options, order, paper, process, product, promotion, sequence, simple, step, symbol, template, triangle, tutorial, vector, version, web. The prominent colors used in the PowerPoint template are Brown, Gray, Black Build on your dreams with our 3d Inclined Arrow Describing 6 Stages Flow Chart Creator Online PowerPoint Templates. They provide a cementing factor.
Bar Chart Showing Quarterly Business Sales Ppt PowerPoint Presentation Model Icon
Presenting this set of slides with name bar chart showing quarterly business sales ppt powerpoint presentation model icon. The topics discussed in these slides are revenue trend, bar chart, financial. This is a completely editable PowerPoint presentation and is available for immediate download. Download now and impress your audience.
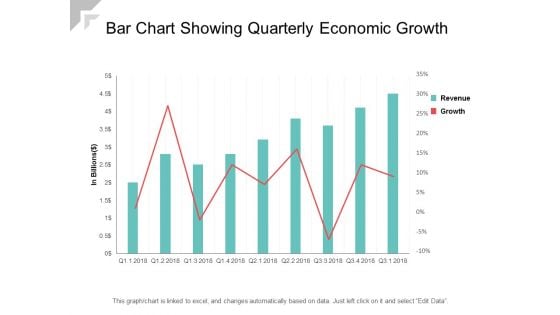
Bar Chart Showing Quarterly Economic Growth Ppt PowerPoint Presentation Infographic Template Slideshow
Presenting this set of slides with name bar chart showing quarterly economic growth ppt powerpoint presentation infographic template slideshow. The topics discussed in these slides are revenue trend, bar chart, financial. This is a completely editable PowerPoint presentation and is available for immediate download. Download now and impress your audience.
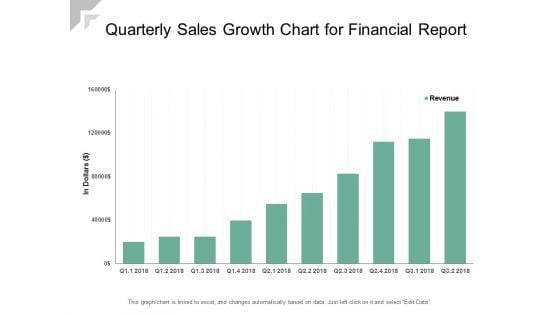
Quarterly Sales Growth Chart For Financial Report Ppt PowerPoint Presentation Ideas Infographics
Presenting this set of slides with name quarterly sales growth chart for financial report ppt powerpoint presentation ideas infographics. The topics discussed in these slides are revenue trend, bar chart, financial. This is a completely editable PowerPoint presentation and is available for immediate download. Download now and impress your audience.
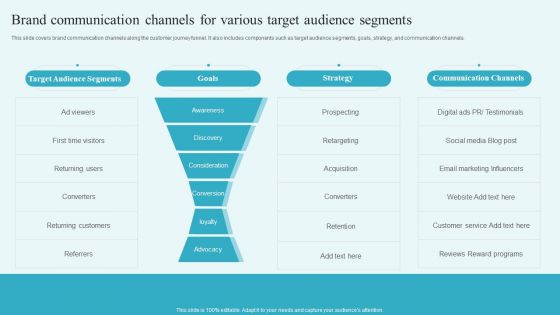
Brand Communication Channels For Various Target Audience Segments Building A Comprehensive Brand Ideas PDF
This slide covers brand communication channels along the customer journey funnel. It also includes components such as target audience segments, goals, strategy, and communication channels. Retrieve professionally designed Brand Communication Channels For Various Target Audience Segments Building A Comprehensive Brand Ideas PDF to effectively convey your message and captivate your listeners. Save time by selecting pre-made slideshows that are appropriate for various topics, from business to educational purposes. These themes come in many different styles, from creative to corporate, and all of them are easily adjustable and can be edited quickly. Access them as PowerPoint templates or as Google Slides themes. You do not have to go on a hunt for the perfect presentation because Slidegeeks got you covered from everywhere.
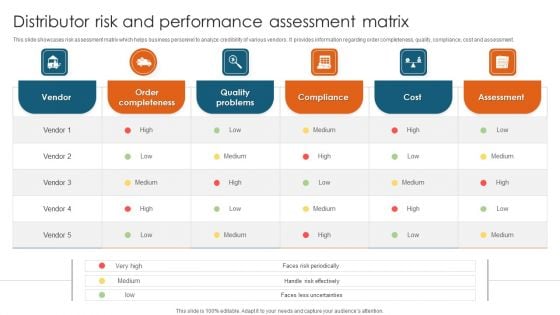
Distributor Risk And Performance Assessment Matrix Diagrams PDF
This slide showcases risk assessment matrix which helps business personnel to analyze credibility of various vendors. It provides information regarding order completeness, quality, compliance, cost and assessment.Showcasing this set of slides titled Distributor Risk And Performance Assessment Matrix Diagrams PDF. The topics addressed in these templates are Order Completeness, Quality Problems, Assessment. All the content presented in this PPT design is completely editable. Download it and make adjustments in color, background, font etc. as per your unique business setting.
Various Solutions To Overcome The Challenges Of Business Process Automation Icons PDF
The following slide outlines the multiple solutions which will assist the organization to overcome challenges in adoption of business process automation BPA. The key solutions are defining the evaluation criteria, creating a training program, comparing the cost of service providers, etc. The Various Solutions To Overcome The Challenges Of Business Process Automation Icons PDF is a compilation of the most recent design trends as a series of slides. It is suitable for any subject or industry presentation, containing attractive visuals and photo spots for businesses to clearly express their messages. This template contains a variety of slides for the user to input data, such as structures to contrast two elements, bullet points, and slides for written information. Slidegeeks is prepared to create an impression.
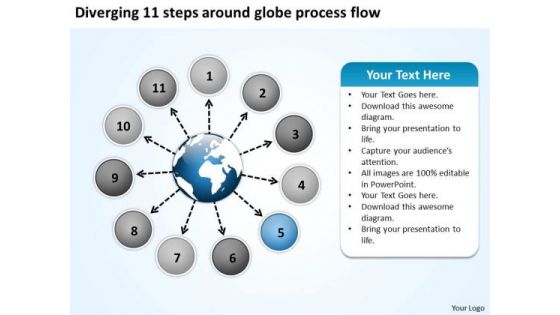
11 Steps Around Globe Process Flow Circular Motion Diagram PowerPoint Templates
We present our 11 steps around globe process flow Circular Motion Diagram PowerPoint templates.Present our Process and flows PowerPoint Templates because if making a mark is your obsession, then let others get Obsessed with you. Use our Flow charts PowerPoint Templates because you have the ability to judge Which out of late have been proving to be a hassle. Download our Circle Charts PowerPoint Templates because it depicts Rolling along while gathering profits along the way is the aim. Use our Ring Charts PowerPoint Templates because retrace your steps with your team and have a relook at the basic aspects of your work. Download our Business PowerPoint Templates because you have had a great year or so business wise. It is time to celebrate the efforts of your team.Use these PowerPoint slides for presentations relating to Arrows, business, central, centralized, chart, circle, circular, circulation, concept, conceptual, converging, design, diagram, executive, icon, idea, illustration, management, mapping, model, numbers, organization, outwards, pointing, procedure, process, radial, radiating, relationship, resource, sequence, sequential, square. The prominent colors used in the PowerPoint template are Blue, Black, Gray. You can be sure our 11 steps around globe process flow Circular Motion Diagram PowerPoint templates are Pretty. Presenters tell us our circulation PowerPoint templates and PPT Slides are incredible easy to use. We assure you our 11 steps around globe process flow Circular Motion Diagram PowerPoint templates are Fun. Customers tell us our centralized PowerPoint templates and PPT Slides are Swanky. Presenters tell us our 11 steps around globe process flow Circular Motion Diagram PowerPoint templates are Magical. You can be sure our concept PowerPoint templates and PPT Slides effectively help you save your valuable time. Educate your team with a winning presentation with our 11 Steps Around Globe Process Flow Circular Motion Diagram PowerPoint Templates. You will come out on top.
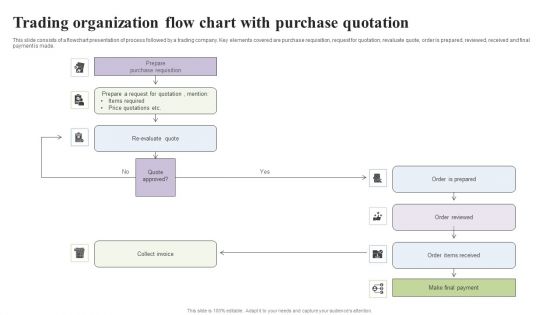
Trading Organization Flow Chart With Purchase Quotation Graphics PDF
This slide consists of a flowchart presentation of process followed by a trading company. Key elements covered are purchase requisition, request for quotation, revaluate quote, order is prepared, reviewed, received and final payment is made. Presenting Trading Organization Flow Chart With Purchase Quotation Graphics PDF to dispense important information. This template comprises one stages. It also presents valuable insights into the topics including Prepare Purchase Requisition, Re Evaluate Quote, Quote Approved. This is a completely customizable PowerPoint theme that can be put to use immediately. So, download it and address the topic impactfully.
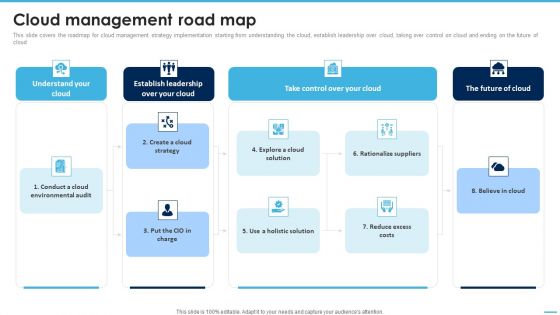
Cloud Management Road Map Managing Complexity Of Multiple Cloud Platforms Topics PDF
This slide covers the roadmap for cloud management strategy implementation starting from understanding the cloud, establish leadership over cloud, taking over control on cloud and ending on the future of cloud .Retrieve professionally designed Cloud Management Road Map Managing Complexity Of Multiple Cloud Platforms Topics PDF to effectively convey your message and captivate your listeners. Save time by selecting pre-made slideshows that are appropriate for various topics, from business to educational purposes. These themes come in many different styles, from creative to corporate, and all of them are easily adjustable and can be edited quickly. Access them as PowerPoint templates or as Google Slides themes. You do not have to go on a hunt for the perfect presentation because Slidegeeks got you covered from everywhere.
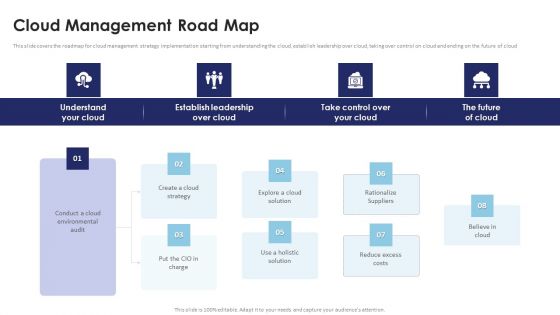
Multi Cloud Infrastructure Management Cloud Management Road Map Themes PDF
This slide covers the roadmap for cloud management strategy implementation starting from understanding the cloud, establish leadership over cloud, taking over control on cloud and ending on the future of cloud. Do you have to make sure that everyone on your team knows about any specific topic I yes, then you should give Multi Cloud Infrastructure Management Cloud Management Road Map Themes PDF a try. Our experts have put a lot of knowledge and effort into creating this impeccable Multi Cloud Infrastructure Management Cloud Management Road Map Themes PDF. You can use this template for your upcoming presentations, as the slides are perfect to represent even the tiniest detail. You can download these templates from the Slidegeeks website and these are easy to edit. So grab these today.


 Continue with Email

 Home
Home


