Tool Icon
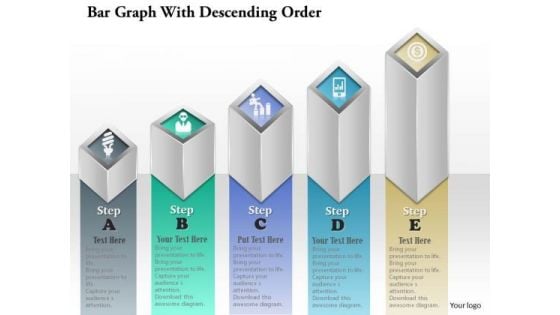
Business Diagram Bar Graph With Ascending Order Presentation Template
Our above diagram displays bar graph in ascending order. It contains bar graph with business icons. Use this amazing diagram for business communication or to present business reports. Download this diagram as a tool for business presentations.
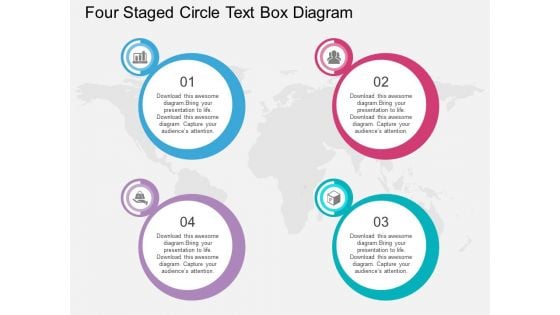
Four Staged Circle Text Box Diagram Powerpoint Template
Our professionally designed business diagram is as an effective tool for communicating business ideas and strategies for corporate planning. It contains graphics of four staged gear diagram with icons. Above slide is suitable to display business processes.
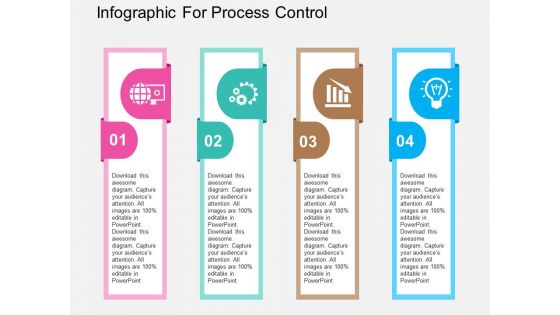
Infographic For Process Control Powerpoint Templates
Our professionally designed business diagram is as an effective tool for communicating concepts of global technology and process control. It contains graphics of banners with icons. Above slide is suitable to display your ideas.
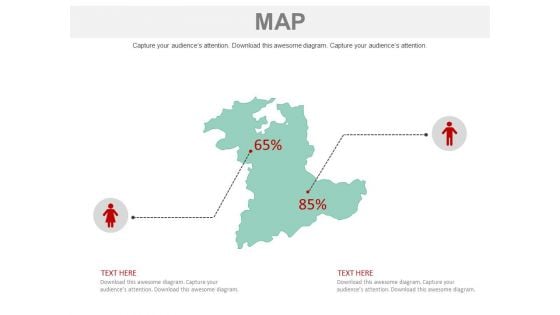
Map With Male Female Population Comparison Powerpoint Slides
This PowerPoint template has been designed with graphics of male, female icons. Our professionally designed business diagram is as an effective tool to display male female population comparison. Above slide provide ideal backdrop to make impressive presentations.
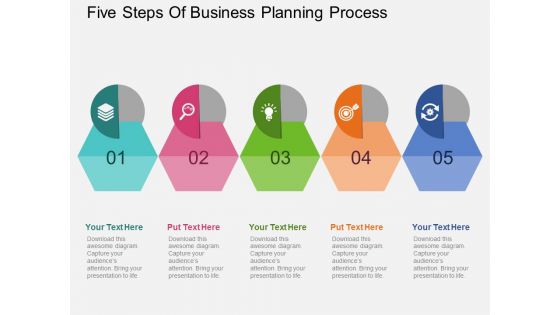
Five Steps Of Business Planning Process Powerpoint Template
This PowerPoint template contains colorful design of five steps with icons. Our professionally designed business diagram is as an effective tool for communicating steps for marketing research and management. Above slide provide ideal backdrop to make business presentations.
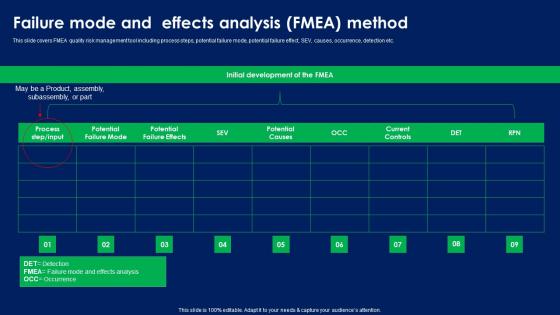
Failure Mode And Effects Analysis Fmea Method Quality Risk Assessment Introduction PDF
This slide covers FMEA quality risk management tool including process steps, potential failure mode, potential failure effect, SEV, causes, occurrence, detection etc. There are so many reasons you need a Consequences Table For Probability And Impact Quality Risk Assessment Icons PDF The first reason is you can not spend time making everything from scratch, Thus, Slidegeeks has made presentation templates for you too. You can easily download these templates from our website easily. This slide covers FMEA quality risk management tool including process steps, potential failure mode, potential failure effect, SEV, causes, occurrence, detection etc.
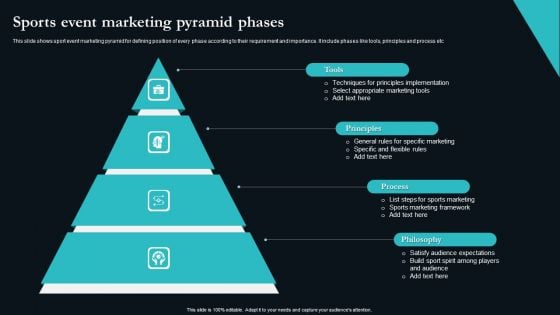
Sports Event Marketing Pyramid Phases Pictures PDF
This slide shows sport event marketing pyramid for defining position of every phase according to their requirement and importance. It include phases like tools, principles and process etc. Persuade your audience using this Sports Event Marketing Pyramid Phases Pictures PDF. This PPT design covers four stages, thus making it a great tool to use. It also caters to a variety of topics including Tools, Principles, Process, Philosophy. Download this PPT design now to present a convincing pitch that not only emphasizes the topic but also showcases your presentation skills.
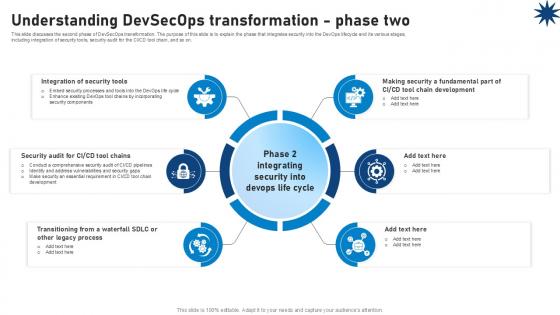
Understanding Devsecops Transformation Phase Two Role Of Devsecops Ppt Powerpoint
This slide discusses the second phase of DevSecOps transformation. The purpose of this slide is to explain the phase that integrates security into the DevOps lifecycle and its various stages, including integration of security tools, security audit for the CICD tool chain, and so on. If your project calls for a presentation, then Slidegeeks is your go-to partner because we have professionally designed, easy-to-edit templates that are perfect for any presentation. After downloading, you can easily edit Understanding Devsecops Transformation Phase Two Role Of Devsecops Ppt Powerpoint and make the changes accordingly. You can rearrange slides or fill them with different images. Check out all the handy templates This slide discusses the second phase of DevSecOps transformation. The purpose of this slide is to explain the phase that integrates security into the DevOps lifecycle and its various stages, including integration of security tools, security audit for the CICD tool chain, and so on.
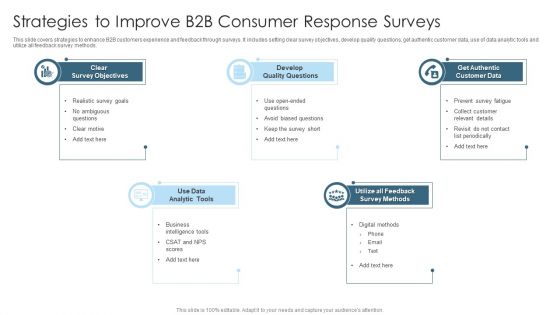
Strategies To Improve B2b Consumer Response Surveys Themes PDF
This slide covers strategies to enhance B2B customers experience and feedback through surveys. It includes setting clear survey objectives, develop quality questions, get authentic customer data, use of data analytic tools and utilize all feedback survey methods. Persuade your audience using this Strategies To Improve B2b Consumer Response Surveys Themes PDF. This PPT design covers five stages, thus making it a great tool to use. It also caters to a variety of topics including Use Data Analytic Tools, Develop Quality Questions, Clear Survey Objectives. Download this PPT design now to present a convincing pitch that not only emphasizes the topic but also showcases your presentation skills.
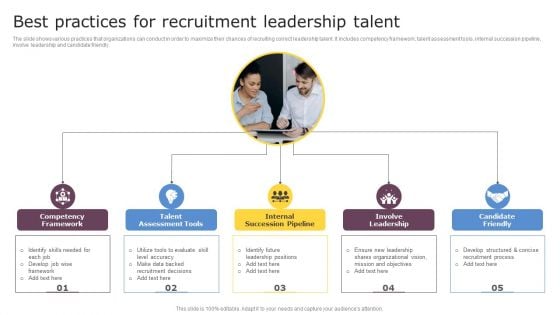
Best Practices For Recruitment Leadership Talent Themes PDF
The slide shows various practices that organizations can conduct in order to maximize their chances of recruiting correct leadership talent. It includes competency framework, talent assessment tools, internal succession pipeline, involve leadership and candidate friendly. Persuade your audience using this Best Practices For Recruitment Leadership Talent Themes PDF. This PPT design covers Five stages, thus making it a great tool to use. It also caters to a variety of topics including Competency Framework, Internal Succession Pipeline, Talent Assessment Tool. Download this PPT design now to present a convincing pitch that not only emphasizes the topic but also showcases your presentation skills.
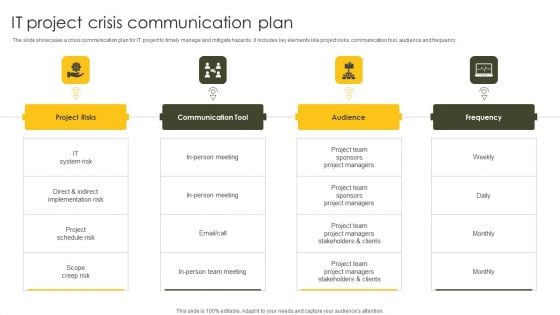
IT Project Crisis Communication Plan Diagrams PDF
The slide showcases a crisis communication plan for IT project to timely manage and mitigate hazards. It includes key elements like project risks, communication tool, audience and frequency. Persuade your audience using this IT Project Crisis Communication Plan Diagrams PDF. This PPT design covers four stages, thus making it a great tool to use. It also caters to a variety of topics including Communication Tool, Implementation Risk, Project Team. Download this PPT design now to present a convincing pitch that not only emphasizes the topic but also showcases your presentation skills.
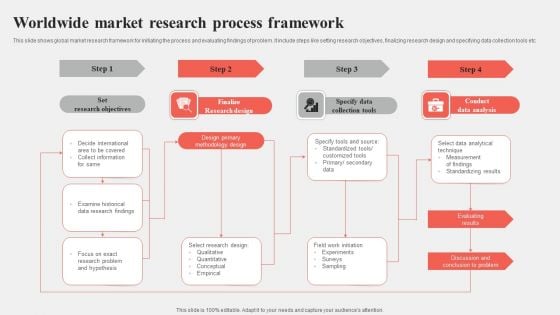
Worldwide Market Research Process Framework Diagrams PDF
This slide shows global market research framework for initiating the process and evaluating findings of problem. It include steps like setting research objectives, finalizing research design and specifying data collection tools etc Persuade your audience using this Worldwide Market Research Process Framework Diagrams PDF. This PPT design covers four stages, thus making it a great tool to use. It also caters to a variety of topics including Research Design, Collection Tools, Data Analysis. Download this PPT design now to present a convincing pitch that not only emphasizes the topic but also showcases your presentation skills.
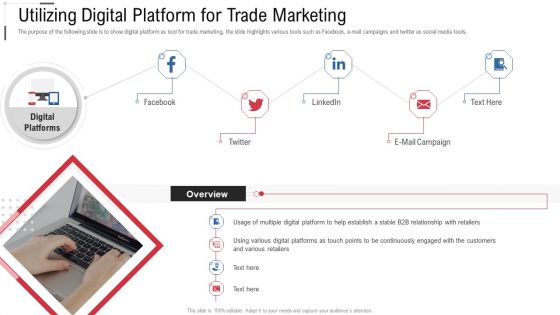
Utilizing Digital Platform For Trade Marketing Online Trade Marketing And Promotion Themes PDF
The purpose of the following slide is to show digital platform as tool for trade marketing, the slide highlights various tools such as Facebook, e-mail campaigns and twitter as social media tools. Presenting utilizing digital platform for trade marketing online trade marketing and promotion themes pdf to provide visual cues and insights. Share and navigate important information on five stages that need your due attention. This template can be used to pitch topics like utilizing digital platform for trade marketing. In addtion, this PPT design contains high resolution images, graphics, etc, that are easily editable and available for immediate download.
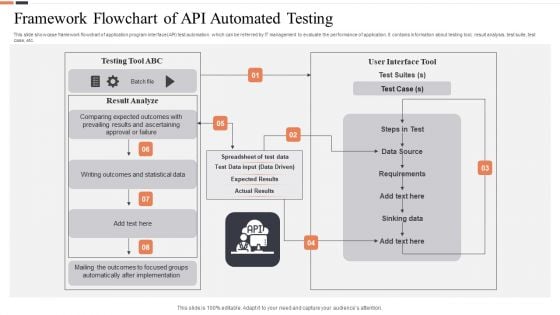
Framework Flowchart Of API Automated Testing Ppt Portfolio Influencers PDF
This slide showcase framework flowchart of application program interface API test automation which can be referred by IT management to evaluate the performance of application. It contains information about testing tool, result analysis, test suite, test case, etc. Presenting Framework Flowchart Of API Automated Testing Ppt Portfolio Influencers PDF to dispense important information. This template comprises eigt stages. It also presents valuable insights into the topics including Testing Tool ABC, User Interface Tool, Data Source, Requirements. This is a completely customizable PowerPoint theme that can be put to use immediately. So, download it and address the topic impactfully.
3d Text Net Internet PowerPoint Templates And PowerPoint Themes 1012
Deliver amazing Presentations with our above template which contains an image of 3d net icon used for internet purposes. It is a useful captivating tool concieved to enable you to define your message in your Business and Communication PPT presentations. Our PPT images are so perfectly designed that it reveals the very basis of our PPT template to make your clients understand. Unmathed quality and quantity. Stay ahead of the game with our 3d Text Net Internet PowerPoint Templates And PowerPoint Themes 1012. You'll always stay ahead of the game.
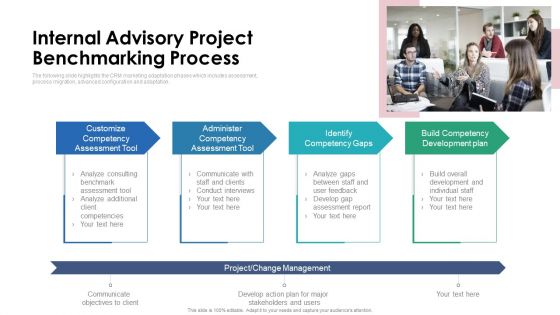
Internal Advisory Project Benchmarking Process Ppt PowerPoint Presentation File Files PDF
The following slide highlights the CRM marketing adaptation phases which includes assessment, process migration, advanced configuration and adaptation. Persuade your audience using this internal advisory project benchmarking process ppt powerpoint presentation file files pdf. This PPT design covers one stages, thus making it a great tool to use. It also caters to a variety of topics including customize competency assessment tool, administer competency assessment tool, identify competency gaps, build competency development plan. Download this PPT design now to present a convincing pitch that not only emphasizes the topic but also showcases your presentation skills.
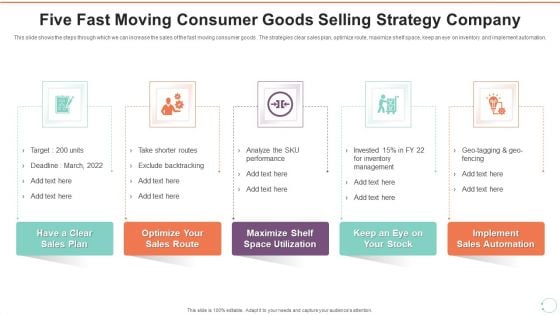
Five Fast Moving Consumer Goods Selling Strategy Company Graphics PDF
This slide shows the steps through which we can increase the sales of the fast moving consumer goods . The strategies clear sales plan, optimize route, maximize shelf space, keep an eye on inventory and implement automation. Persuade your audience using this Five Fast Moving Consumer Goods Selling Strategy Company Graphics PDF This PPT design covers five stages, thus making it a great tool to use. It also caters to a variety of topics including Fast Moving, Consumer Goods Selling, Strategy Planning Icon Download this PPT design now to present a convincing pitch that not only emphasizes the topic but also showcases your presentation skills.
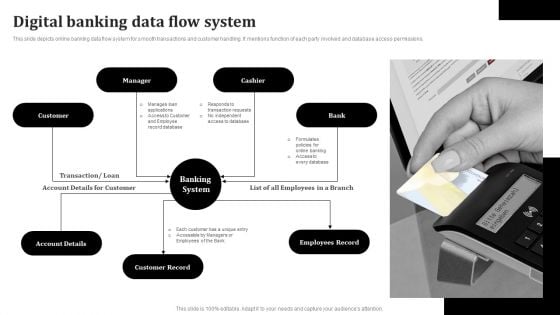
Digital Banking Data Flow System Template PDF
This slide depicts online banking data flow system for smooth transactions and customer handling. It mentions function of each party involved and database access permissions. Persuade your audience using this Digital Banking For Financial Management Icon Information PDF. This PPT design covers Seven stages, thus making it a great tool to use. It also caters to a variety of topics including Manager, Cashier, Banking System, Employees Record. Download this PPT design now to present a convincing pitch that not only emphasizes the topic but also showcases your presentation skills.
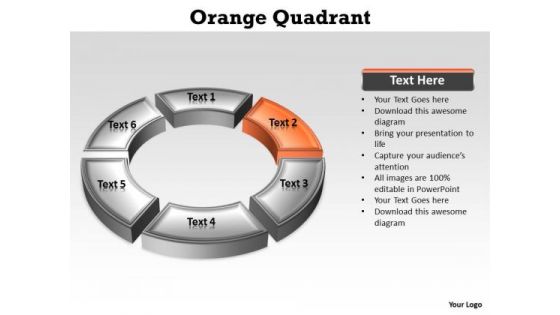
Ppt Orange Stage Through PowerPoint Presentation Circular Diagram Templates
PPT orange stage through powerpoint presentation circular diagram Templates-Create visually stunning and define your PPT Presentations in a unique and inspiring manner using our above Diagram which contains a graphic of of a Circular process. This correlative six stages diagram is a tool that can help your team work productively and successfully. Our colorful image makes your presentations inviting, friendly, simpler, professional showing that you care about even the smallest details. You can change color, size and orientation of any icon to your liking.-PPT orange stage through powerpoint presentation circular diagram Templates-abstract, accuracy, arrow, blue, chronometer, circle, clock, elegance, glass, glossy, graphic, icon, illustration, measure, asurement, mechanism, metal, point, quartz, round, shape, sign, single, slow, stylish, symbol, technology, timepiece, timer, vector, Our Ppt Orange Stage Through PowerPoint Presentation Circular Diagram Templates are really captivating. The audience will not take their eyes off you.
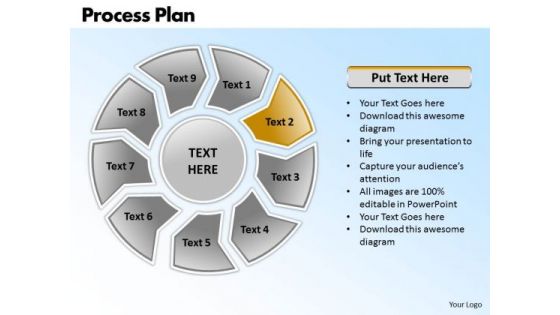
Ppt Circular Diamond Mining Process PowerPoint Presentation Plan Templates
PPT circular diamond mining process powerpoint presentation plan Templates-Use this graphical approach to represent global business issues such as financial data, stock market Exchange, increase in sales, corporate presentations and more. It Signifies the concept of common, comprehensive, extensive, global, international, multinational, omnipresent, planetary, ubiquitous, universal etc. It is a powerful tool conceived to enable you to define your message in your Business PPT presentations. Create captivating presentations to deliver comparative and weighted arguments. You can change color, size and orientation of any icon to your liking.-PPT circular diamond mining process powerpoint presentation plan Templates-Arrow, Art, Blue, Business, Button, Circular, Clip, Design, Diagram, Drop, Element, Glowing, Graph, Graphic, Icon, Illustration, Isolated, Process, Round, Set, Shadow, Sphere, Symbol Count on our Ppt Circular Diamond Mining Process PowerPoint Presentation Plan Templates to carry the can. They will never belie your faith.
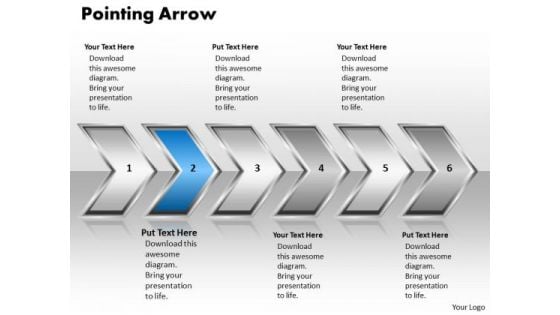
Ppt Pointing Arrow Communication Process PowerPoint Presentation 6 Stages Templates
PPT pointing arrow communication process powerpoint presentation 6 stages Templates-Use this PowerPoint Diagram to represent the layers of Linear Process model Graphically. It shows the Second stage in an animated manner through an Arrow. It is a useful captivating tool enables you to define your message in your Marketing PPT presentations. You can change color, size and orientation of any icon to your liking.-PPT pointing arrow communication process powerpoint presentation 6 stages Templates-Aim, Arrow, Arrowheads, Badge, Border, Click, Connection, Curve, Design, Direction, Download, Element, Fuchsia, Icon, Illustration, Indicator, Internet, Magenta, Mark, Object, Orientation, Pointer, Shadow, Shape, Sign Our graphice have been selected by professionals. Use them in your presentations with our Ppt Pointing Arrow Communication Process PowerPoint Presentation 6 Stages Templates. You'll always stay ahead of the game.
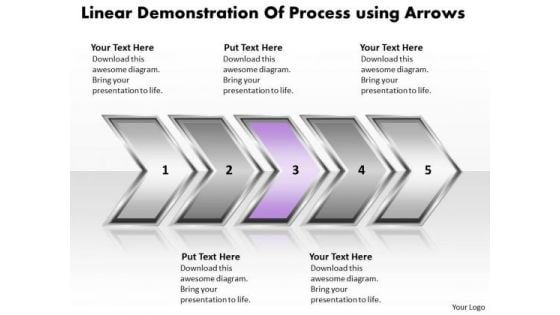
Ppt Linear Demonstration Of Business Forging Process PowerPoint Slides Templates
PPT linear demonstration of business forging process powerpoint slides Templates-Use this PowerPoint Diagram to represent the layers of Linear Process model Graphically. It shows the third stage in an animated manner through an Arrow. It is a useful captivating tool enables you to define your message in your Marketing PPT presentations. You can change color, size and orientation of any icon to your liking.-PPT linear demonstration of business forging process powerpoint slides Templates-Aim, Arrow, Arrowheads, Badge, Border, Click, Connection, Curve, Design, Direction, Download, Element, Fuchsia, Icon, Illustration, Indicator, Internet, Magenta, Mark, Object, Orientation, Pointer, Shadow, Shape, Sign Break throughthe fence with our Ppt Linear Demonstration Of Business Forging Process PowerPoint Slides Templates. Your ideas will bring down all barriers.
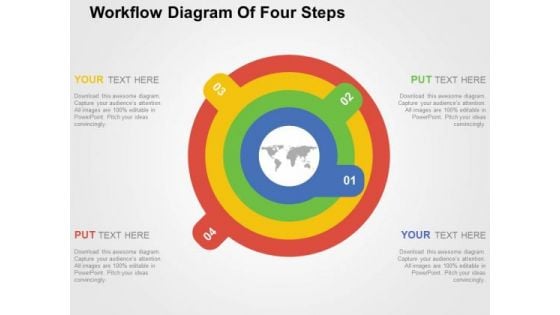
Workflow Diagram Of Four Steps PowerPoint Template
This business diagram contains graphics of circular diagram. Our professionally designed business diagram is as an effective tool for communicating business workflow. Enlighten your audience with your breathtaking ideas.
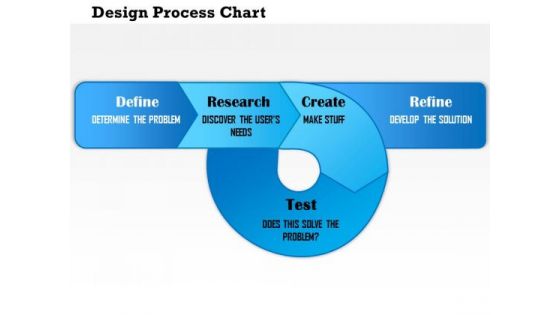
Business Diagram Design Process Chart PowerPoint Ppt Presentation
This diagram shows design of process chart. It contains five steps diagram. These steps are define, research, create, refine and test. Download this process chart as a tool for business presentations.
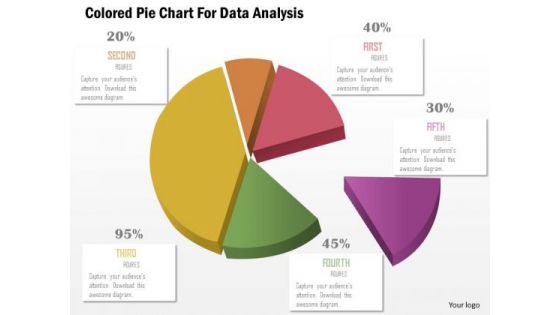
Business Diagram Colored Pie Chart For Data Analysis Presentation Template
This business slide displays pie chart. This diagram is a data visualization tool that gives you a simple way to present statistical information. This slide helps your audience examine and interpret the data you present.
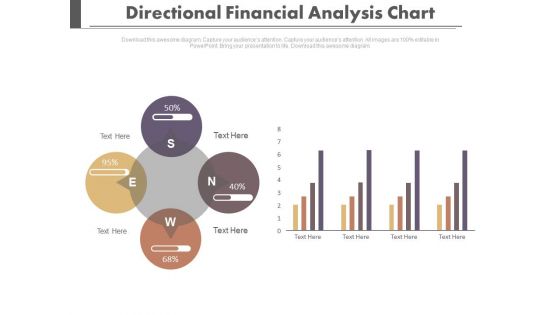
Four Directions Circular Analysis Chart Powerpoint Slides
Our professionally designed business diagram is as an effective tool for communicating business strategy. It contains four directional circular charts. Above slide is also suitable to display financial planning and strategy.
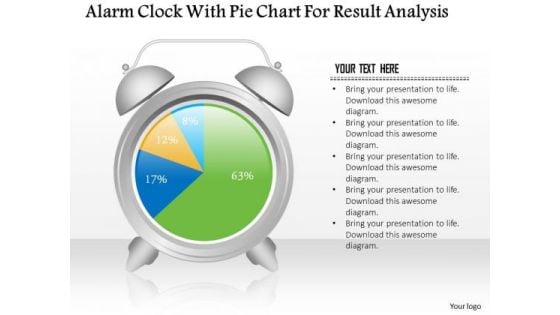
Business Diagram Alarm Clock With Pie Chart For Result Analysis PowerPoint Slide
This business slide displays alarm clock with pie chart. This diagram is a data visualization tool that gives you a simple way to present statistical information. This slide helps your audience examine and interpret the data you present.
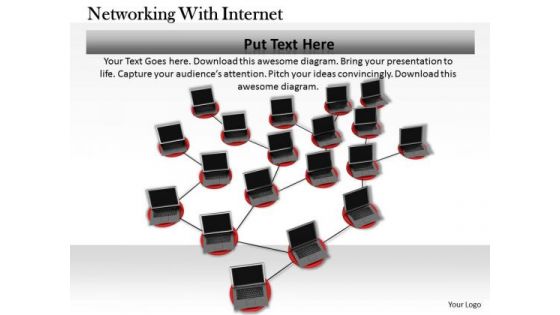
Stock Photo Network Laptops PowerPoint Slide
Develop competitive advantage with our image which contains network of laptops. This image can be used for network and communication related topics. This image is an excellent tool to give an ideal presentation.
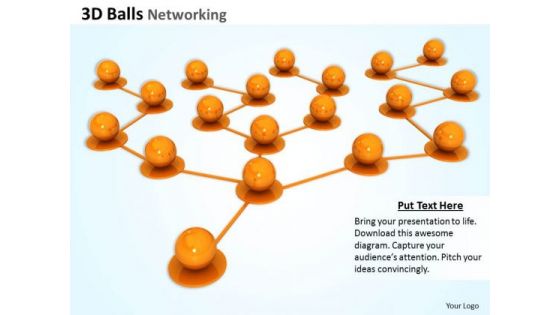
Stock Photo Networking Concept 3d Balls PowerPoint Slide
Develop competitive advantage with our image which contains network of 3d balls. This image can be used for network and communication related topics. This image is an excellent tool to give an ideal presentation.

Business Diagram Data Driven Pie Chart Inside The Magnifier PowerPoint Slide
This business slide displays 3d colorful pie graph with magnifier. This diagram is a data visualization tool that gives you a simple way to present statistical information. This slide helps your audience examine and interpret the data you present.
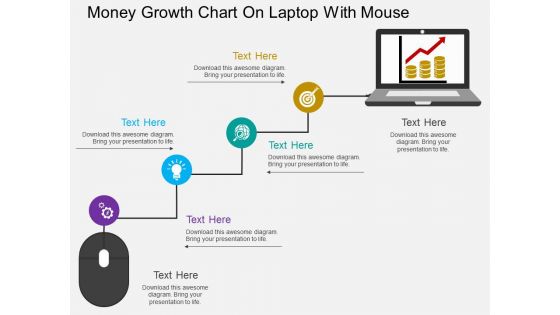
Money Growth Chart On Laptop With Mouse Powerpoint Template
This business slide displays money growth chart on laptop with mouse. This diagram is a data visualization tool that gives you a simple way to present statistical information. This slide helps your audience examine and interpret the data you present.
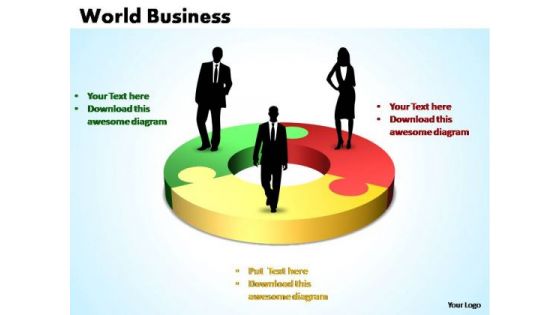
PowerPoint Templates Teamwork Business Ppt Themes
This diagram is an amazing tool to ensure that strategic planning sessions contribute to teambuilding. Our PowerPoint Templates Teamwork Business Ppt Themes will work in your favour. Acquire the advantage of their ability.
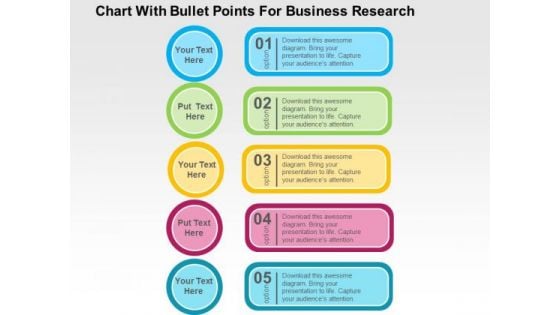
Chart With Bullet Points For Business Research PowerPoint Template
This professionally designed business diagram is as an effective tool for communicating business ideas and strategies for corporate planning. You can also use this to bullet points your ideas. Above slide is suitable for business research.
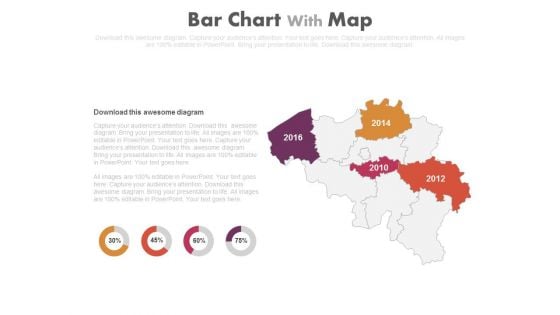
Map With Years And Percentage Charts Powerpoint Slides
This PowerPoint template displays map with years and percentage values. Our professionally designed map diagram is as an effective tool to display economic progress survey of particular areas. Above slide provide ideal backdrop to make business presentations.
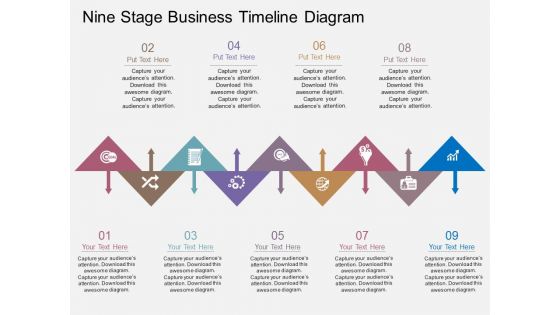
Nine Stage Business Timeline Diagram Powerpoint Template
Our professionally designed business diagram is as an effective tool for communicating business ideas and strategies for corporate planning. This PPT slide contains nine stage business timeline diagram. Download this template to build interactive presentation.
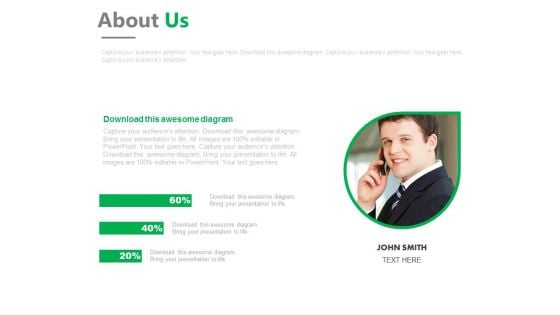
Business Employee Profile Growth Chart Powerpoint Slides
This PowerPoint template has been designed with graphics of business man with growth chart. This PowerPoint slide is an excellent tool to showcase employee growth and performance. Make impressive presentation using this slide.
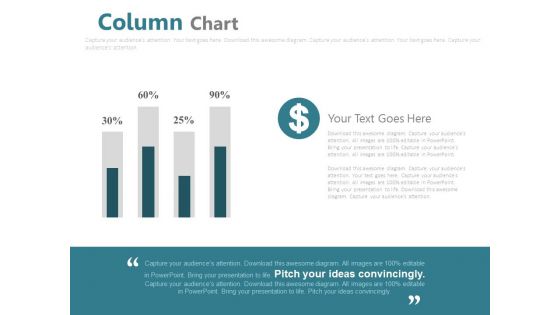
Column Chart For Financial Analysis Powerpoint Slides
This PowerPoint template has been designed with graphics of column chart with percentage values. You may use this business slide design for topics like financial analysis and planning. This PPT slide is powerful tool to describe your ideas.
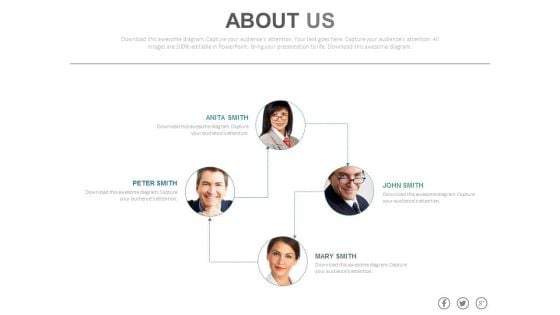
About Us Team Hierarchy Chart Powerpoint Slides
On this template you can see team of four persons. This PowerPoint slide is an excellent tool to display team hierarchy. Give a detailed introduction of your team with complete profile information.
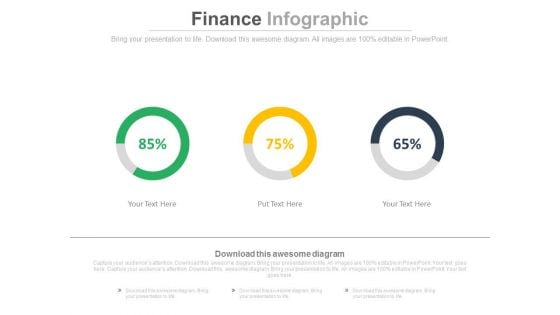
Linear Circles Percentage Analysis Charts Powerpoint Slides
This PowerPoint template has been designed with graphics of three circles and percentage ratios. You may use this dashboard slide design for topics like profit growth and financial planning. This PPT slide is powerful tool to describe your ideas.

1 Global Communication With Interconnected Devices Surrounding The Earth Globe Ppt Slides
This diagram contains unique graphics of interconnected devices surrounding the earth. You may download this diagram for presentations related to internet, technology and global communication. This diagram is an excellent tool to give an ideal presentation.
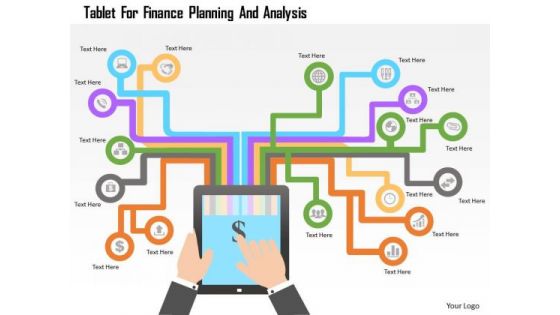
Tablet For Finance Planning And Analysis PowerPoint Template
Our professionally designed business diagram is as an effective tool for communicating ideas and planning. It contains graphics of tablet with various symbols. Convey your views with this diagram slide. It will amplify the strength of your logic.
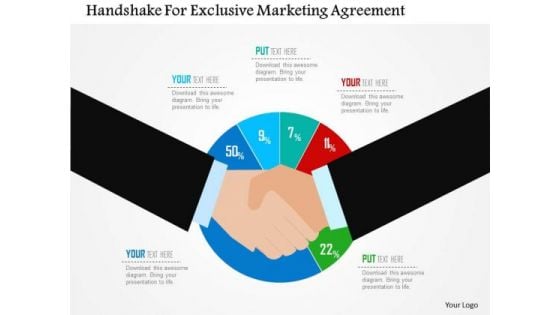
Business Diagram Handshake For Exclusive Marketing Agreement Presentation Template
This business diagram contains handshake graphics with pie chart in background. Our professionally designed business diagram is as an effective tool for communicating business ideas and strategies for corporate planning. Above slide is suitable to display business deals.

Business Diagram Business Bar Graph For Data Analysis Presentation Template
This business slide displays pie charts with percentage ratios. This diagram is a data visualization tool that gives you a simple way to present statistical information. This slide helps your audience examines and interprets the data you present.
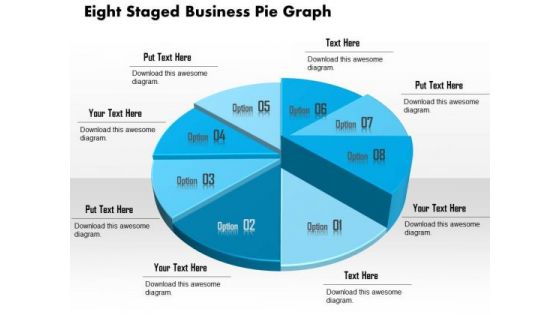
Business Diagram Eight Staged Business Pie Graph Presentation Template
This business slide displays eight staged pie chart. This diagram is a data visualization tool that gives you a simple way to present statistical information. This slide helps your audience examine and interpret the data you present.
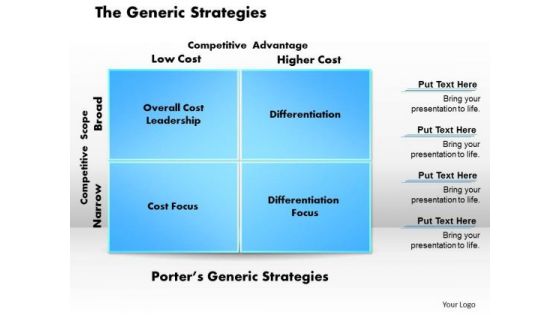
Business Framework The Generic Strategies PowerPoint Presentation
This slide depicts framework of generic strategies. It contains diagram of porters generic strategies depicting competitive advantage and competitive scope. Download this diagram as a tool for business presentations.
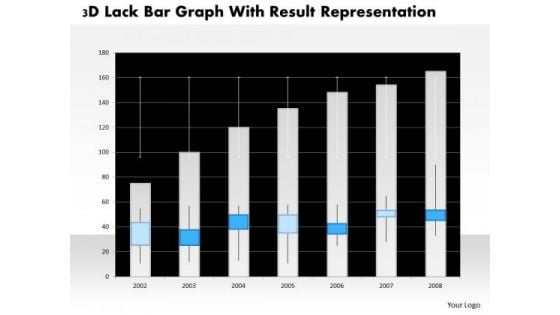
Business Diagram 3d Lack Bar Graph With Result Representation PowerPoint Slide
This business diagram has graphic of 3d lack bar graph. This diagram is a data visualization tool that gives you a simple way to present statistical information. This slide helps your audience examine and interpret the data you present.
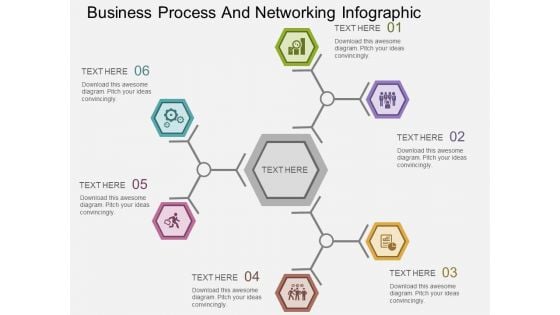
Business Process And Networking Infographic Powerpoint Templates
Our professionally designed PPT diagram is as an effective tool for communicating business process. You can also use this to display link of ideas. Above slide is suitable for business and marketing related topics.
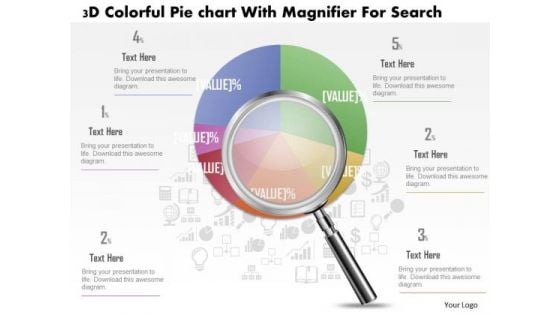
Business Diagram 3d Colorful Pie Graph With Magnifier Data Search PowerPoint Slide
This business slide displays 3d colorful pie graph with magnifier. This diagram is a data visualization tool that gives you a simple way to present statistical information. This slide helps your audience examine and interpret the data you present.
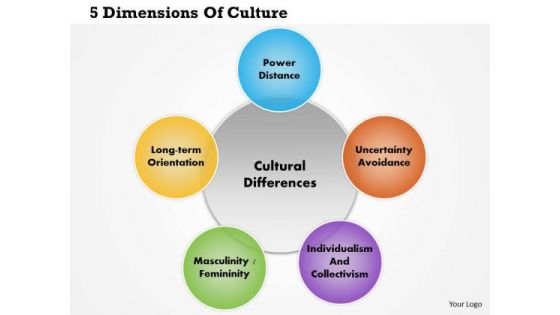
Business Framework 5 Dimensions Of Culture PowerPoint Presentation
This business diagram provides framework for 5 dimensions of culture. Use this business diagram to earn good impressions from the audience. Download this diagram as a tool for business presentations.
Business Framework Agenda Slide With Text Boxes PowerPoint Presentation
This agenda slide diagram is useful to define business agenda. Decorate your presentation with this professional diagram. This helpful and interactive diagram is a wonderful tool to serve your purpose.
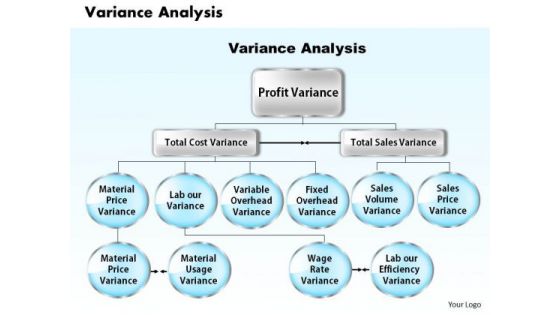
Business Framework Variance Analysis PowerPoint Presentation
This diagram shows framework of variance analysis. It contains flow diagram of profit variance, total cost variance and total sales variance. Download this diagram as a tool for business presentations.
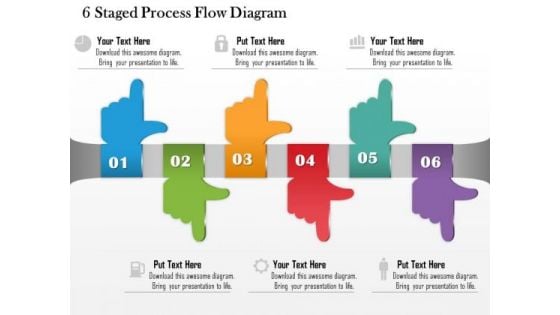
Business Diagram 6 Staged Process Flow Diagram Presentation Template
This business consulting diagram helps to describe the ordered set of steps required to complete a task. This process flow diagram is very effective tool to pass on information in a visual manner.
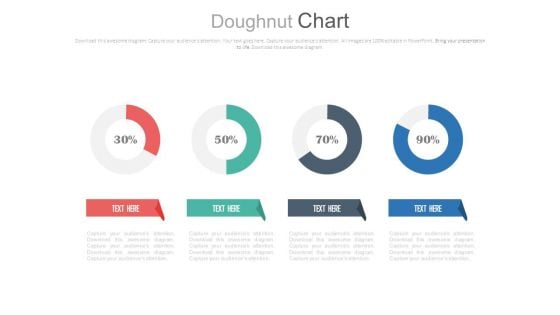
Four Circle Chart With Percentage Ratios Powerpoint Slides
This PowerPoint template has been designed with graphics of four circles and percentage ratios. You may use this dashboard slide design for topics like profit growth and financial planning. This PPT slide is powerful tool to describe your ideas.
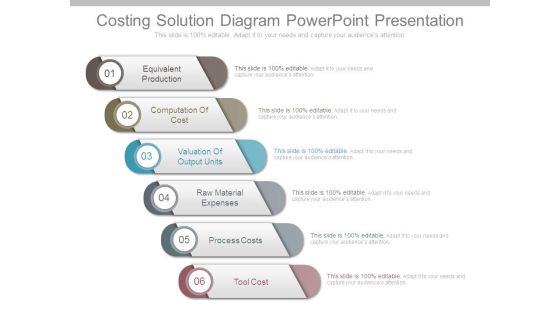
Costing Solution Diagram Powerpoint Presentation
This is a costing solution diagram powerpoint presentation. This is a six stage process. The stages in this process are equivalent production, computation of cost, valuation of output units, raw material expenses, process costs, tool cost.
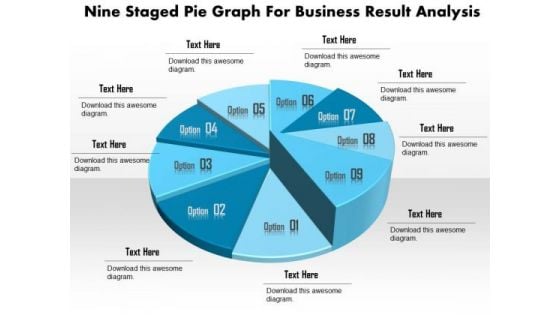
Business Diagram Nine Staged Pie Graph For Business Result Analysis Presentation Template
This business slide displays nine staged pie chart. This diagram is a data visualization tool that gives you a simple way to present statistical information. This slide helps your audience examine and interpret the data you present.
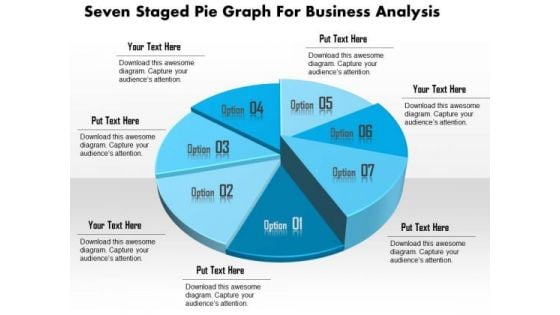
Business Diagram Seven Staged Pie Graph For Business Analysis Presentation Template
This business slide displays seven staged pie chart. This diagram is a data visualization tool that gives you a simple way to present statistical information. This slide helps your audience examine and interpret the data you present.
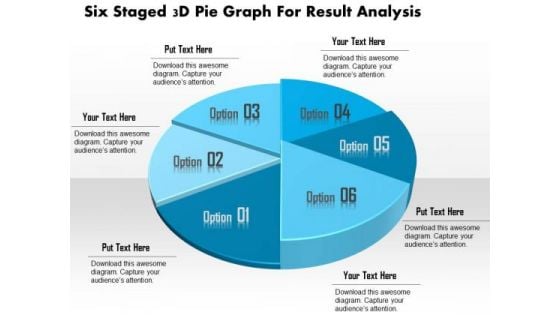
Business Diagram Six Staged 3d Pie Graph For Result Analysis Presentation Template
This business slide displays six staged pie chart. This diagram is a data visualization tool that gives you a simple way to present statistical information. This slide helps your audience examine and interpret the data you present.
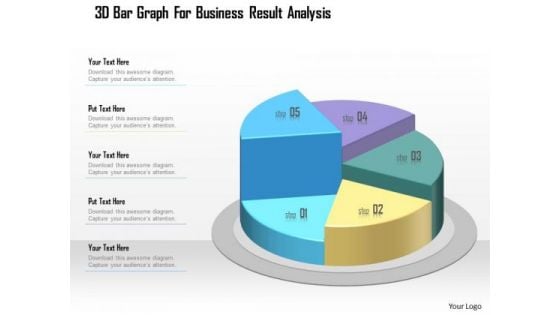
Business Diagram 3d Bar Graph For Business Result Analysis Presentation Template
This business slide displays five staged pie chart. This diagram is a data visualization tool that gives you a simple way to present statistical information. This slide helps your audience examine and interpret the data you present.

Handshake Construction PowerPoint Themes And PowerPoint Slides 0411
Microsoft PowerPoint Theme and Slide with business people handshaking over helmets documents worker tool No matter how far flung your clientele is. Connect with them all through our Handshake Construction PowerPoint Themes And PowerPoint Slides 0411.
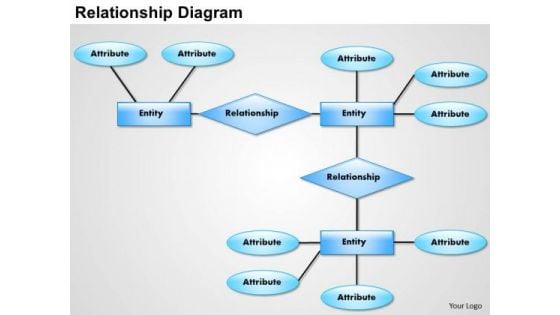
Business Framework Relationship Diagram PowerPoint Presentation
This diagram is an effective tool to convey processes, relationships and connections. Use this diagram to present a clear visual structure to your audience so that you can highlight important points. This diagram will help you catch your audiences attention.

 Home
Home