Total Cost
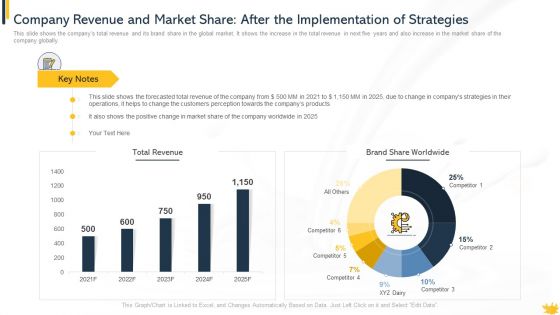
Company Revenue And Market Share After The Implementation Of Strategies Mockup PDF
This slide shows the companys total revenue and its brand share in the global market. It shows the increase in the total revenue in next five years and also increase in the market share of the company globally.Deliver an awe inspiring pitch with this creative company revenue and market share after the implementation of strategies mockup pdf bundle. Topics like company revenue and market share after the implementation of strategies can be discussed with this completely editable template. It is available for immediate download depending on the needs and requirements of the user.
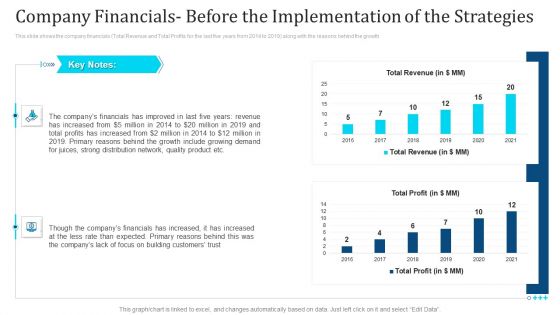
Company Financials Before The Implementation Of The Strategies Ppt Summary Visual Aids PDF
This slide shows the company financials Total Revenue and Total Profits for the last five years from 2014 to 2019 along with the reasons behind the growth Deliver and pitch your topic in the best possible manner with this company financials before the implementation of the strategies ppt summary visual aids pdf. Use them to share invaluable insights on company financials before the implementation of the strategies and impress your audience. This template can be altered and modified as per your expectations. So, grab it now.
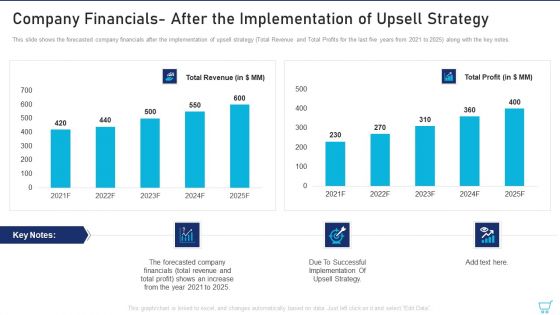
Company Financials After The Implementation Of Upsell Strategy Ppt Infographics Slide Portrait PDF
This slide shows the forecasted company financials after the implementation of upsell strategy Total Revenue and Total Profits for the last five years from 2021 to 2025 along with the key notes. Deliver an awe inspiring pitch with this creative company financials after the implementation of upsell strategy ppt infographics slide portrait pdf bundle. Topics like company financials after the implementation of upsell strategy can be discussed with this completely editable template. It is available for immediate download depending on the needs and requirements of the user.
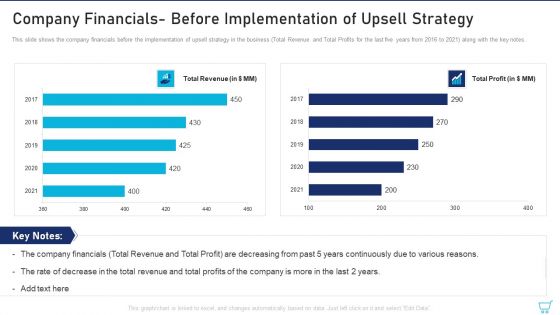
Company Financials Before Implementation Of Upsell Strategy Ppt Pictures Smartart PDF
This slide shows the company financials before the implementation of upsell strategy in the business Total Revenue and Total Profits for the last five years from 2016 to 2021 along with the key notes. Deliver and pitch your topic in the best possible manner with this company financials before implementation of upsell strategy ppt pictures smartart pdf. Use them to share invaluable insights on revenue, profit and impress your audience. This template can be altered and modified as per your expectations. So, grab it now.
Buzz Marketing Strategies For Brand Promotion Dashboard For Tracking Essential Marketing Slides PDF
This slide covers information regarding the dashboard for tracking essential marketing activities in terms of total leads, email sent, sales ready leads, new customers and revenues, etc. Deliver and pitch your topic in the best possible manner with this buzz marketing strategies for brand promotion dashboard for tracking essential marketing slides pdf. Use them to share invaluable insights on total leads, sales ready leads, new customers, new revenue and impress your audience. This template can be altered and modified as per your expectations. So, grab it now.
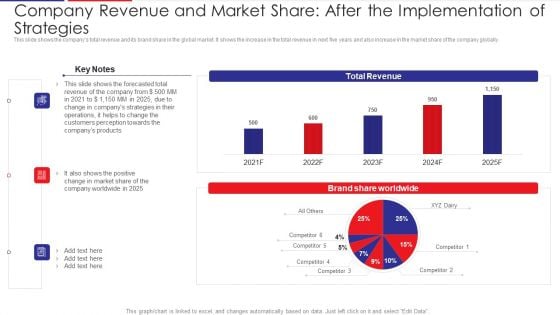
Company Revenue And Market Share After The Implementation Of Strategies Download PDF
This slide shows the companys total revenue and its brand share in the global market. It shows the increase in the total revenue in next five years and also increase in the market share of the company globally. Deliver an awe inspiring pitch with this creative company revenue and market share after the implementation of strategies download pdf bundle. Topics like revenue, strategies, market share can be discussed with this completely editable template. It is available for immediate download depending on the needs and requirements of the user.
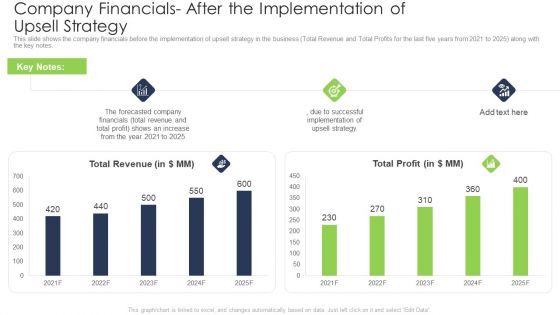
Company Financials After The Implementation Of Upsell Strategy Themes PDF
This slide shows the company financials before the implementation of upsell strategy in the business Total Revenue and Total Profits for the last five years from 2021 to 2025 along with the key notes. Deliver and pitch your topic in the best possible manner with this company financials after the implementation of upsell strategy themes pdf. Use them to share invaluable insights on revenue, financials, profit, strategy, implementation and impress your audience. This template can be altered and modified as per your expectations. So, grab it now.
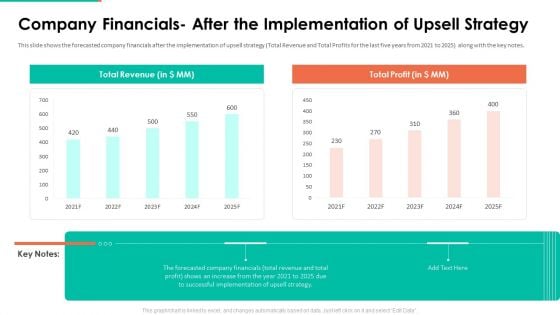
Upselling Technique Additional Product Company Financials After Implementation Strategy Demonstration PDF
This slide shows the forecasted company financials after the implementation of upsell strategy Total Revenue and Total Profits for the last five years from 2021 to 2025 along with the key notes. Deliver and pitch your topic in the best possible manner with this upselling technique additional product company financials after implementation strategy demonstration pdf. Use them to share invaluable insights on company financials after the implementation of upsell strategy and impress your audience. This template can be altered and modified as per your expectations. So, grab it now.
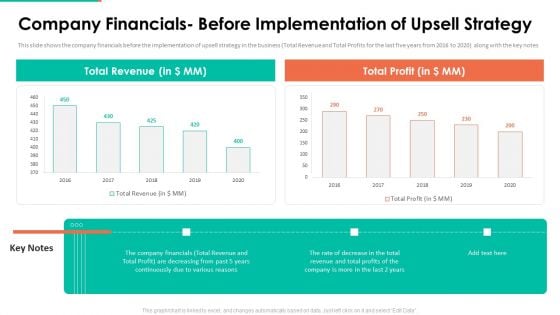
Upselling Technique Additional Product Company Financials Before Implementation Strategy Information PDF
This slide shows the company financials before the implementation of upsell strategy in the business Total Revenue and Total Profits for the last five years from 2016 to 2020 along with the key notes Deliver an awe inspiring pitch with this creative upselling technique additional product company financials before implementation strategy information pdf bundle. Topics like company financials before implementation of upsell strategy can be discussed with this completely editable template. It is available for immediate download depending on the needs and requirements of the user.

Company Revenue And Market Share After The Implementation Of Strategies Ideas PDF
This slide shows the companys total revenue and its brand share in the global market. It shows the increase in the total revenue in next five years and also increase in the market share of the company globally. Deliver and pitch your topic in the best possible manner with this company revenue and market share after the implementation of strategies ideas pdf. Use them to share invaluable insights on strategies, products, market share and impress your audience. This template can be altered and modified as per your expectations. So, grab it now.
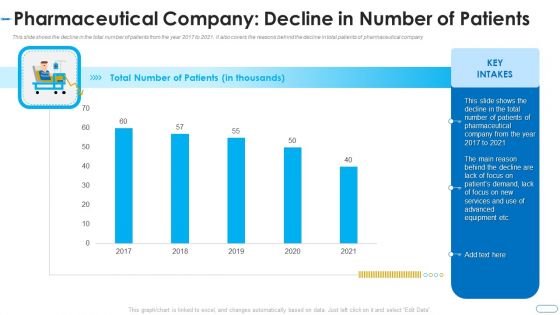
Initiatives Atmosphere Operation Problems Pharmaceutical Firm Pharmaceutical Company Decline Microsoft PDF
This slide shows the decline in the total number of patients from the year 2017 to 2021. It also covers the reasons behind the decline in total patients of pharmaceutical company Deliver and pitch your topic in the best possible manner with this initiatives atmosphere operation problems pharmaceutical firm pharmaceutical company decline microsoft pdf. Use them to share invaluable insights on focus, services, equipment, demand and impress your audience. This template can be altered and modified as per your expectations. So, grab it now.
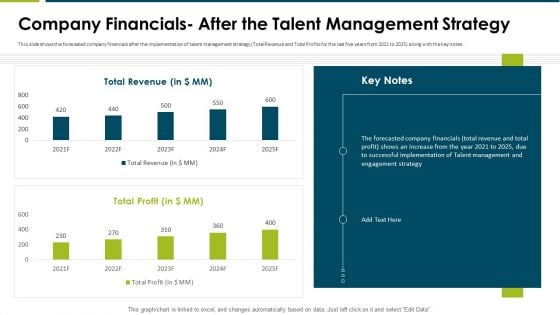
Impact Employee Engagement Strategies Organization Company Financials Strategies Microsoft PDF
This slide shows the forecasted company financials after the implementation of talent management strategy Total Revenue and Total Profits for the last five years from 2021 to 2025 along with the key notes. Deliver an awe inspiring pitch with this creative impact employee engagement strategies organization company financials strategies microsoft pdf bundle. Topics like company financials after the talent management strategy can be discussed with this completely editable template. It is available for immediate download depending on the needs and requirements of the user.
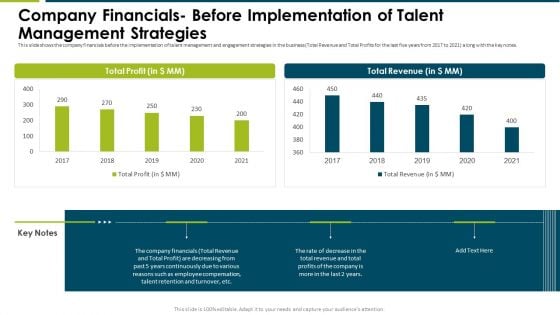
Impact Employee Engagement Strategies Organization Company Financials Demonstration PDF
This slide shows the company financials before the implementation of talent management and engagement strategies in the business Total Revenue and Total Profits for the last five years from 2017 to 2021 along with the key notes. Deliver and pitch your topic in the best possible manner with this impact employee engagement strategies organization company financials demonstration pdf. Use them to share invaluable insights on company financials before implementation of talent management strategies and impress your audience. This template can be altered and modified as per your expectations. So, grab it now.
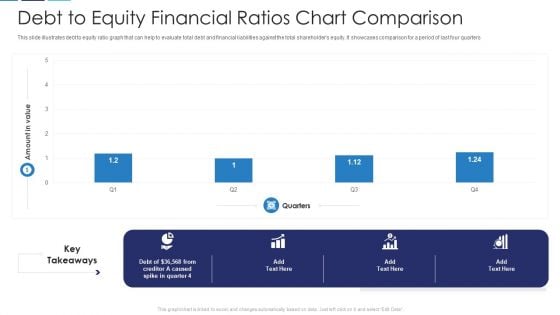
Debt To Equity Financial Ratios Chart Comparison Download PDF
This slide illustrates debt to equity ratio graph that can help to evaluate total debt and financial liabilities against the total shareholders equity. It showcases comparison for a period of last four quarters Pitch your topic with ease and precision using this debt to equity financial ratios chart comparison download pdf. This layout presents information on debt to equity financial ratios chart comparison. It is also available for immediate download and adjustment. So, changes can be made in the color, design, graphics or any other component to create a unique layout.
Factor Influencing User Experience Dairy Industry Company Revenue And Market Share Icons PDF
This slide shows the companys total revenue and its brand share in the global market. It shows the increase in the total revenue in next five years and also increase in the market share of the company globally. Deliver and pitch your topic in the best possible manner with this factor influencing user experience dairy industry company revenue and market share icons pdf . Use them to share invaluable insights on company revenue and market share after the implementation of strategies and impress your audience. This template can be altered and modified as per your expectations. So, grab it now.
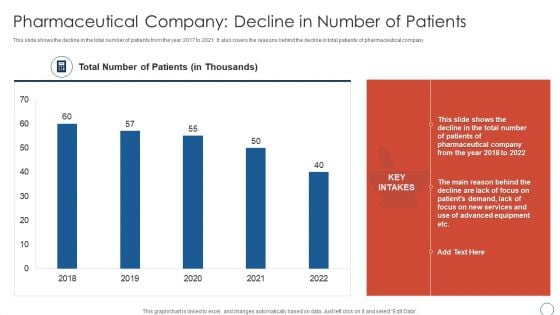
Pharmaceutical Company Decline Obtaining Sustainability Growing Pharmaceutical Organization Graphics PDF
This slide shows the decline in the total number of patients from the year 2017 to 2021. It also covers the reasons behind the decline in total patients of pharmaceutical company Deliver and pitch your topic in the best possible manner with this pharmaceutical company decline obtaining sustainability growing pharmaceutical organization graphics pdf. Use them to share invaluable insights on pharmaceutical company decline in number of patients and impress your audience. This template can be altered and modified as per your expectations. So, grab it now.

Professional Scrum Master Certification Number Of Risks Encountered And Resolved Inspiration PDF
This slide shows the status of total risk encountered and resolved by the team post agile methodology adoption. It includes metrics such as total risks, open, improvising closed and mitigated. Deliver an awe inspiring pitch with this creative professional scrum master certification number of risks encountered and resolved inspiration pdf bundle. Topics like risk mitigation phases, organization encountered, high, medium, low can be discussed with this completely editable template. It is available for immediate download depending on the needs and requirements of the user.
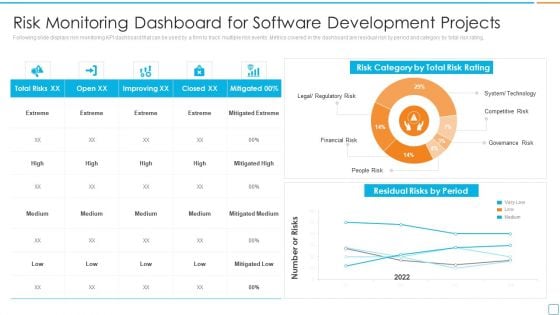
Professional Scrum Master Certification Risk Monitoring Dashboard For Software Development Portrait PDF
Following slide displays risk monitoring KPI dashboard that can be used by a firm to track multiple risk events. Metrics covered in the dashboard are residual risk by period and category by total risk rating. Deliver an awe inspiring pitch with this creative professional scrum master certification risk monitoring dashboard for software development portrait pdf bundle. Topics like residual risks by period, risk category, total risk rating can be discussed with this completely editable template. It is available for immediate download depending on the needs and requirements of the user.
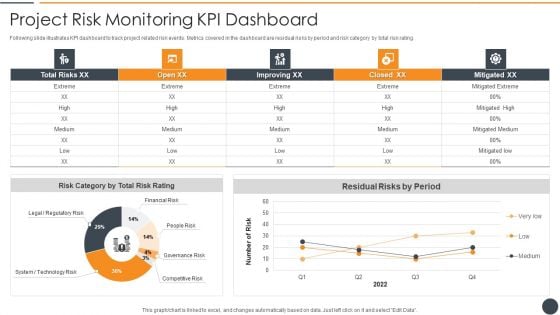
Effective Initiation Of Information Technology Project Project Risk Monitoring Kpi Dashboard Microsoft PDF
Following slide illustrates KPI dashboard to track project related risk events. Metrics covered in the dashboard are residual risks by period and risk category by total risk rating. Deliver and pitch your topic in the best possible manner with this effective initiation of information technology project project risk monitoring kpi dashboard microsoft pdf. Use them to share invaluable insights on mitigated extreme, residual risks by period, risk category by total risk rating and impress your audience. This template can be altered and modified as per your expectations. So, grab it now.
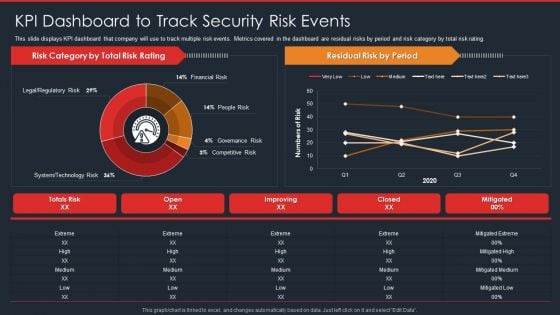
Data Safety Initiatives KPI Dashboard To Track Security Risk Events Portrait PDF
This slide displays KPI dashboard that company will use to track multiple risk events. Metrics covered in the dashboard are residual risks by period and risk category by total risk rating. Deliver and pitch your topic in the best possible manner with this data safety initiatives kpi dashboard to track security risk events portrait pdf. Use them to share invaluable insights on risk category, total risk rating, residual risk by period, technology risk and impress your audience. This template can be altered and modified as per your expectations. So, grab it now.
Email Marketing Dashboard Illustrating Campaign Performance Results Ppt PowerPoint Presentation File Icon PDF
Mentioned slide displays email campaign dashboard which can be used by marketers to track performance of their marketing campaigns. Marketers can track metrics such as total subscribers growth, overall bounce rate, unsubscribe rate, open rate, click rate etc. Showcasing this set of slides titled email marketing dashboard illustrating campaign performance results ppt powerpoint presentation file icon pdf. The topics addressed in these templates are marketing, list health, total subscribers, percentage. All the content presented in this PPT design is completely editable. Download it and make adjustments in color, background, font etc. as per your unique business setting.
Dashboard For Tracking Essential Marketing Activities Positive Marketing For Corporate Topics PDF
This slide covers information regarding the dashboard for tracking essential marketing activities in terms of total leads, email sent, sales ready leads, new customers and revenues, etc. Deliver and pitch your topic in the best possible manner with this dashboard for tracking essential marketing activities positive marketing for corporate topics pdf. Use them to share invaluable insights on total leads, sales ready leads, new customers, new revenue and impress your audience. This template can be altered and modified as per your expectations. So, grab it now.
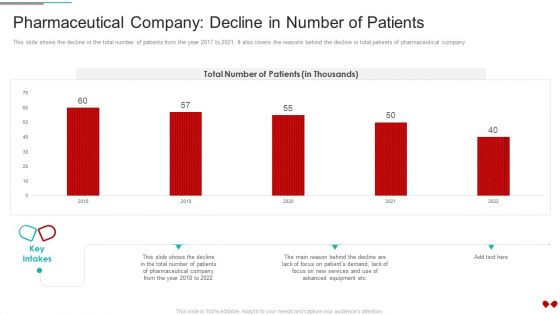
Environmental Impact Analysis For A Pharmaceutical Pharmaceutical Company Decline In Number Of Patients Pictures PDF
This slide shows the decline in the total number of patients from the year 2017 to 2021. It also covers the reasons behind the decline in total patients of pharmaceutical company.Deliver an awe inspiring pitch with this creative Environmental Impact Analysis For A Pharmaceutical Pharmaceutical Company Decline In Number Of Patients Pictures PDF bundle. Topics like Pharmaceutical Company Decline In Number Of Patients can be discussed with this completely editable template. It is available for immediate download depending on the needs and requirements of the user.
Dashboard For Tracking Essential Marketing Activities Actively Influencing Customers Formats PDF
This slide covers information regarding the dashboard for tracking essential marketing activities in terms of total leads, email sent, sales ready leads, new customers and revenues, etc. Deliver and pitch your topic in the best possible manner with this Dashboard For Tracking Essential Marketing Activities Actively Influencing Customers Formats PDF. Use them to share invaluable insights on Total Leads, Sales Ready Leads, New Customers, New Revenue and impress your audience. This template can be altered and modified as per your expectations. So, grab it now.
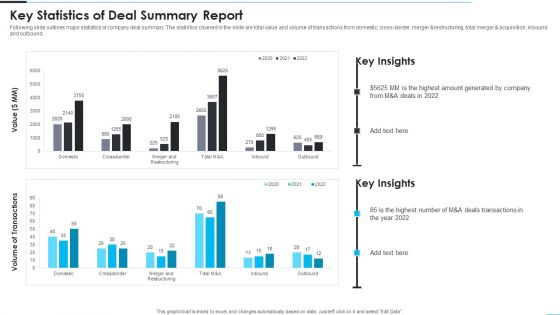
Key Statistics Of Deal Summary Report Formats PDF
Following slide outlines major statistics of company deal summary. The statistics covered in the slide are total value and volume of transactions from domestic, cross-border, merger and restructuring, total merger and acquisition, inbound and outbound. Pitch your topic with ease and precision using this Key Statistics Of Deal Summary Report Formats PDF. This layout presents information on Key Statistics Of Deal Summary Report. It is also available for immediate download and adjustment. So, changes can be made in the color, design, graphics or any other component to create a unique layout.
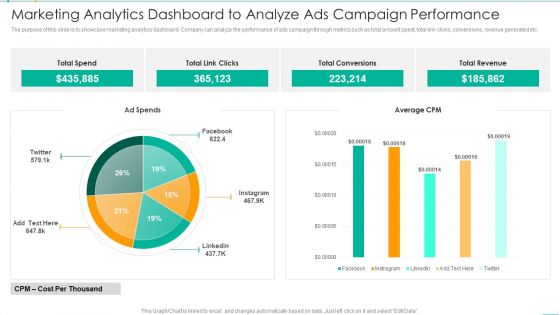
Marketing Analytics Dashboard To Analyze Ads Campaign Performance Microsoft PDF
The purpose of this slide is to showcase marketing analytics dashboard. Company can analyze the performance of ads campaign through metrics such as total amount spent, total link clicks, conversions, revenue generated etc. Showcasing this set of slides titled Marketing Analytics Dashboard To Analyze Ads Campaign Performance Microsoft PDF. The topics addressed in these templates are Marketing Analytics Dashboard To Analyze Ads Campaign Performance. All the content presented in this PPT design is completely editable. Download it and make adjustments in color, background, font etc. as per your unique business setting.
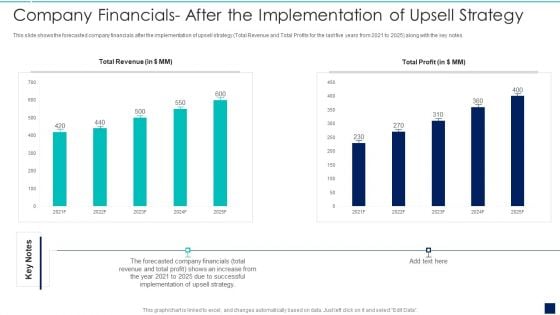
Influence Buyers To Purchase Additional High Company Financials After The Implementation Diagrams PDF
This slide shows the forecasted company financials after the implementation of upsell strategy total Revenue and Total Profits for the last five years from 2021 to 2025 along with the key notes.Deliver an awe inspiring pitch with this creative Influence Buyers To Purchase Additional High Company Financials After The Implementation Diagrams PDF bundle. Topics like Company Financials After The Implementation Of Upsell Strategy can be discussed with this completely editable template. It is available for immediate download depending on the needs and requirements of the user.
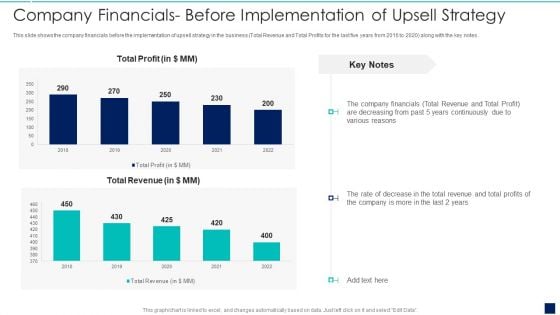
Influence Buyers To Purchase Additional High Company Financials Before Implementation Slides PDF
This slide shows the company financials before the implementation of upsell strategy in the business Total Revenue and Total Profits for the last five years from 2016 to 2020 along with the key notes.Deliver and pitch your topic in the best possible manner with this Influence Buyers To Purchase Additional High Company Financials Before Implementation Slides PDF Use them to share invaluable insights on Company Financials- Before Implementation Of Upsell Strategy and impress your audience. This template can be altered and modified as per your expectations. So, grab it now.
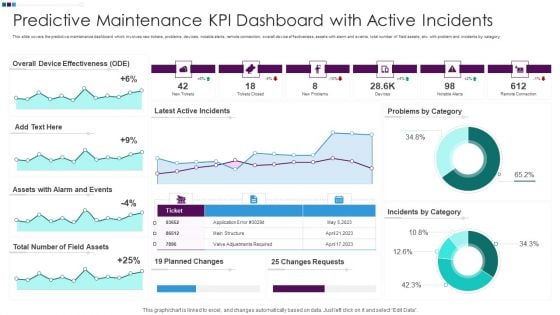
Predictive Maintenance KPI Dashboard With Active Incidents Ppt Slides Backgrounds PDF
This slide covers the predictive maintenance dashboard which involves new tickets, problems, devices, notable alerts, remote connection, overall device effectiveness, assets with alarm and events, total number of field assets, etc. with problem and incidents by category. Showcasing this set of slides titled Predictive Maintenance KPI Dashboard With Active Incidents Ppt Slides Backgrounds PDF. The topics addressed in these templates are Overall Device Effectiveness, Assets Alarm Events, Total Number Field. All the content presented in this PPT design is completely editable. Download it and make adjustments in color, background, font etc. as per your unique business setting.
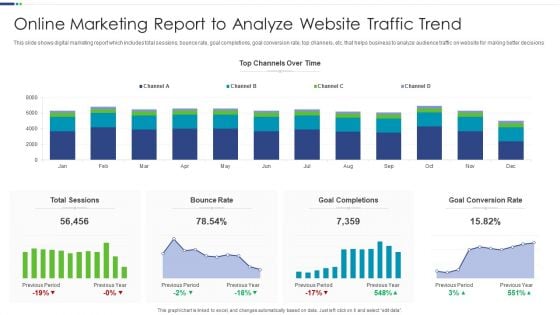
Online Marketing Report To Analyze Website Traffic Trend Introduction PDF
This slide shows digital marketing report which includes total sessions, bounce rate, goal completions, goal conversion rate, top channels, etc. that helps business to analyze audience traffic on website for making better decisions.Pitch your topic with ease and precision using this Online Marketing Report To Analyze Website Traffic Trend Introduction PDF This layout presents information on Goal Completions, Goal Conversion, Total Sessions It is also available for immediate download and adjustment. So, changes can be made in the color, design, graphics or any other component to create a unique layout.
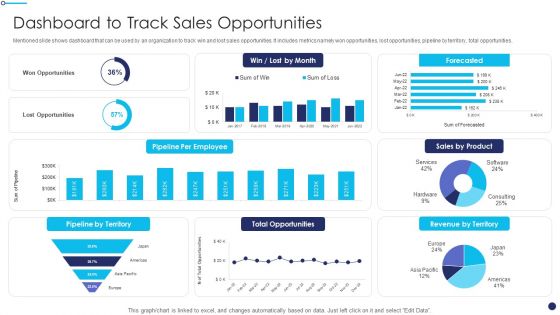
Effective Sales Technique For New Product Launch Dashboard To Track Sales Opportunities Introduction PDF
Mentioned slide shows dashboard that can be used by an organization to track win and lost sales opportunities. It includes metrics namely won opportunities, lost opportunities, pipeline by territory, total opportunities.Deliver an awe inspiring pitch with this creative Effective Sales Technique For New Product Launch Dashboard To Track Sales Opportunities Introduction PDF bundle. Topics like Lost Opportunities, Total Opportunities, Revenue Territory can be discussed with this completely editable template. It is available for immediate download depending on the needs and requirements of the user.
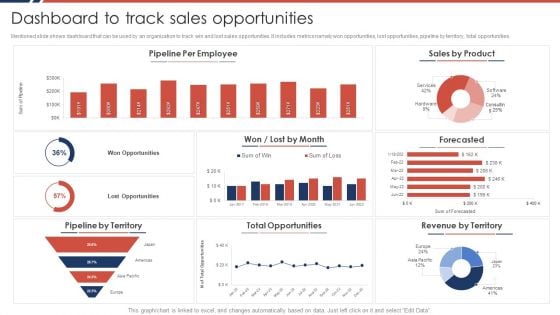
Effective Sales Plan For New Product Introduction In Market Dashboard To Track Sales Opportunities Formats PDF
Mentioned slide shows dashboard that can be used by an organization to track win and lost sales opportunities. It includes metrics namely won opportunities, lost opportunities, pipeline by territory, total opportunities.Deliver an awe inspiring pitch with this creative Effective Sales Plan For New Product Introduction In Market Dashboard To Track Sales Opportunities Formats PDF bundle. Topics like Pipeline Employee, Total Opportunities, Revenue Territory can be discussed with this completely editable template. It is available for immediate download depending on the needs and requirements of the user.
Automating Supply Chain Procurement Automation Strategy End To End Process Tracking Portrait PDF
This slide covers tool for analysing end to end procurement process. It includes features such as tracking real- time overall business health, checking quotation to order conversion, automated notifications and payments reminders, etc. Deliver an awe inspiring pitch with this creative Automating Supply Chain Procurement Automation Strategy End To End Process Tracking Portrait PDF bundle. Topics like Total Sales, Total Purchase, Amount Receivable can be discussed with this completely editable template. It is available for immediate download depending on the needs and requirements of the user.
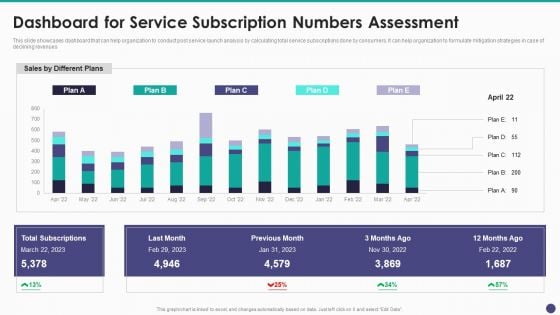
New Service Launch And Development Strategy To Gain Market Share Dashboard For Service Subscription Summary PDF
This slide showcases dashboard that can help organization to conduct post service launch analysis by calculating total service subscriptions done by consumers. It can help organization to formulate mitigation strategies in case of declining revenues.Deliver and pitch your topic in the best possible manner with this New Service Launch And Development Strategy To Gain Market Share Dashboard For Service Subscription Summary PDF Use them to share invaluable insights on Total Subscriptions, Previous Month, Different Plans and impress your audience. This template can be altered and modified as per your expectations. So, grab it now.

Marketing And Operations Dashboard To Drive Effective Productivity Background PDF
This slide covers sales and operations dashboard to drive effective productivity. It involves details such as number of account assigned, working accounts, engaged accounts and total account activity. Pitch your topic with ease and precision using this Marketing And Operations Dashboard To Drive Effective Productivity Background PDF. This layout presents information on Total Account Activity, Number Of Working Account, Engaged Account. It is also available for immediate download and adjustment. So, changes can be made in the color, design, graphics or any other component to create a unique layout.
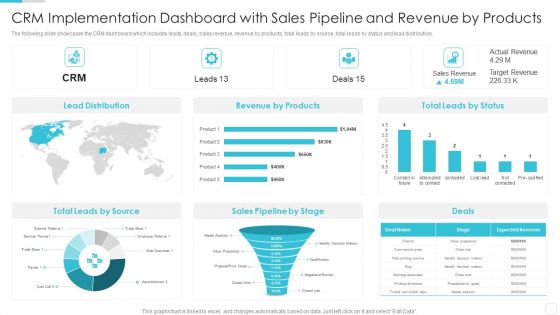
Sales CRM Cloud Solutions Deployment CRM Implementation Dashboard With Sales Template PDF
The following slide showcases the CRM dashboard which includes leads, deals, sales revenue, revenue by products, total leads by source, total leads by status and lead distribution.Deliver and pitch your topic in the best possible manner with this Sales CRM Cloud Solutions Deployment CRM Implementation Dashboard With Sales Template PDF. Use them to share invaluable insights on Lead Distribution, Revenue By Products, Leads By Source and impress your audience. This template can be altered and modified as per your expectations. So, grab it now.
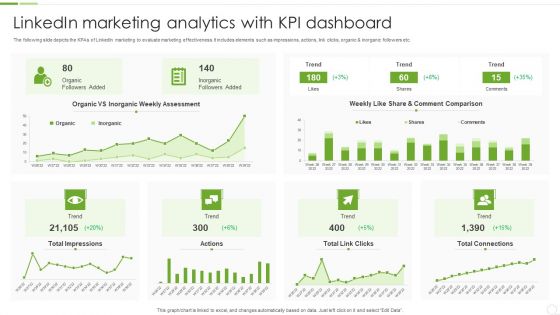
Linkedin Marketing Analytics With KPI Dashboard Ppt PowerPoint Presentation File Inspiration PDF
The following slide depicts the KPAs of LinkedIn marketing to evaluate marketing effectiveness. It includes elements such as impressions, actions, link clicks, organic and inorganic followers etc. Showcasing this set of slides titled Linkedin Marketing Analytics With KPI Dashboard Ppt PowerPoint Presentation File Inspiration PDF. The topics addressed in these templates are Total Impressions, Total Connections, Inorganic Followers Added. All the content presented in this PPT design is completely editable. Download it and make adjustments in color, background, font etc. as per your unique business setting.
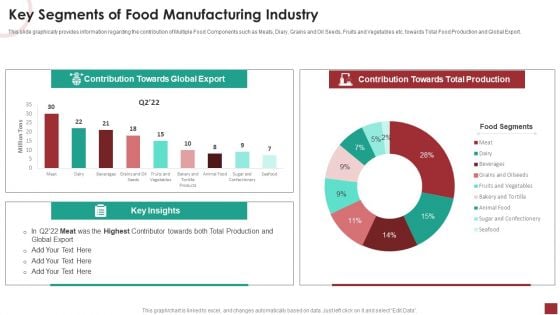
Industry Analysis For Food Manufacturing Market Key Segments Of Food Manufacturing Industry Slide Pictures PDF
This slide graphically provides information regarding the contribution of Multiple Food Components such as Meats, Diary, Grains and Oil Seeds, Fruits and Vegetables etc. towards Total Food Production and Global Export.Deliver and pitch your topic in the best possible manner with this Industry Analysis For Food Manufacturing Market Key Segments Of Food Manufacturing Industry Slide Pictures PDF. Use them to share invaluable insights on Contribution Towards, Total Production, Food Segments and impress your audience. This template can be altered and modified as per your expectations. So, grab it now.
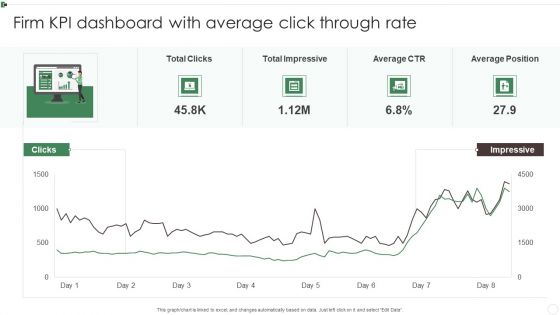
Firm KPI Dashboard With Average Click Through Rate Ppt Inspiration Sample PDF
This graph or chart is linked to excel, and changes automatically based on data. Just left click on it and select Edit Data. Pitch your topic with ease and precision using this Firm KPI Dashboard With Average Click Through Rate Ppt Inspiration Sample PDF. This layout presents information on Total Clicks, Total Impressive, Average CTR, Average Position. It is also available for immediate download and adjustment. So, changes can be made in the color, design, graphics or any other component to create a unique layout.
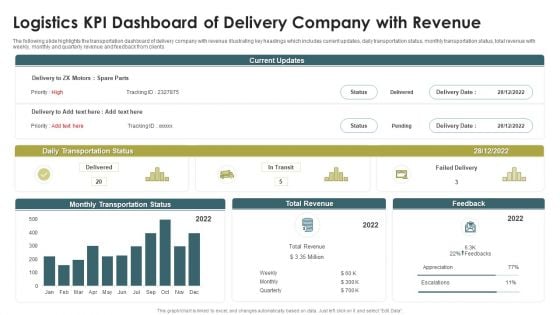
Logistics KPI Dashboard Of Delivery Company With Revenue Ppt Show PDF
The following slide highlights the transportation dashboard of delivery company with revenue illustrating key headings which includes current updates, daily transportation status, monthly transportation status, total revenue with weekly, monthly and quarterly revenue and feedback from clients. Showcasing this set of slides titled Logistics KPI Dashboard Of Delivery Company With Revenue Ppt Show PDF. The topics addressed in these templates are Daily Transportation Status, Monthly Transportation Status, Total Revenue. All the content presented in this PPT design is completely editable. Download it and make adjustments in color, background, font etc. as per your unique business setting.
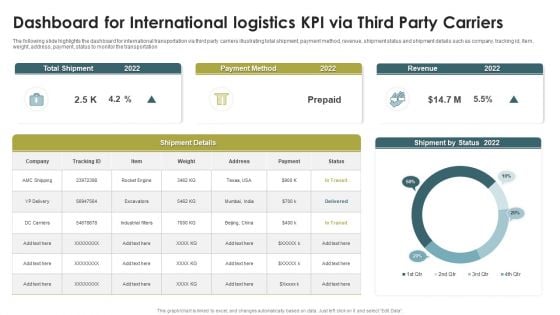
Dashboard For International Logistics KPI Via Third Party Carriers Rules PDF
The following slide highlights the dashboard for international transportation via third party carriers illustrating total shipment, payment method, revenue, shipment status and shipment details such as company, tracking id, Item, weight, address, payment, status to monitor the transportation. Showcasing this set of slides titled Dashboard For International Logistics KPI Via Third Party Carriers Rules PDF. The topics addressed in these templates are Total Shipment, Payment Method, Revenue, 20. All the content presented in this PPT design is completely editable. Download it and make adjustments in color, background, font etc. as per your unique business setting.
Metaverse Technology IT Dashboard For Tracking Metaverse Environment Ppt Outline Elements PDF
This slide represents the dashboard for tracking the metaverse environment. It covers the details of daily revenue, the total number of users, the number of new users, and total sales. Deliver and pitch your topic in the best possible manner with this Metaverse Technology IT Dashboard For Tracking Metaverse Environment Ppt Outline Elements PDF. Use them to share invaluable insights on Digital Spot, Satisfaction Rate, All Metaverses, Transaction Details and impress your audience. This template can be altered and modified as per your expectations. So, grab it now.
Sustainable Energy Dashboard For Our Green Energy Projects Ppt PowerPoint Presentation Show Icons PDF
This slide depicts the dashboard for our green energy projects by covering details of total projects, projects by sector, energy sources, the contribution of green energy projects in households, industry, etc.Deliver and pitch your topic in the best possible manner with this Sustainable Energy Dashboard For Our Green Energy Projects Ppt PowerPoint Presentation Show Icons PDF. Use them to share invaluable insights on Production Coasts, Total Sales, Under Construction and impress your audience. This template can be altered and modified as per your expectations. So, grab it now.
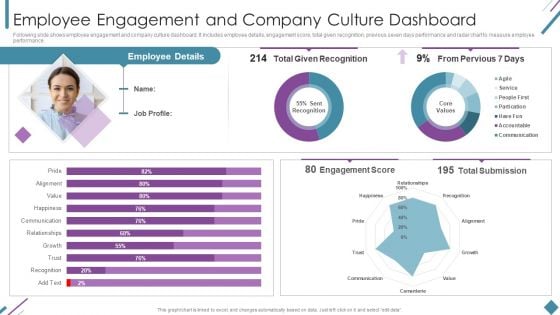
Metrics To Measure Business Performance Employee Engagement And Company Culture Demonstration PDF
Following slide shows employee engagement and company culture dashboard. It includes employee details, engagement score, total given recognition, previous seven days performance and radar chart to measure employee performance. Deliver and pitch your topic in the best possible manner with this Metrics To Measure Business Performance Employee Engagement And Company Culture Demonstration PDF. Use them to share invaluable insights on Employee Details, Total Given Recognition, Engagement Score and impress your audience. This template can be altered and modified as per your expectations. So, grab it now.
Education Metrics Dashboard For Tracking Student Ethnicity And Specially Abled Characteristics Brochure PDF
This slide covers the education key performance indicator tracker. It include metrics such as total applications, conversion rate, offers year to date, applications by ethnicity and disabilities, etc. Showcasing this set of slides titled Education Metrics Dashboard For Tracking Student Ethnicity And Specially Abled Characteristics Brochure PDF. The topics addressed in these templates are Total Applications, Conversion Rate 2022, Ethnicity. All the content presented in this PPT design is completely editable. Download it and make adjustments in color, background, font etc. as per your unique business setting.
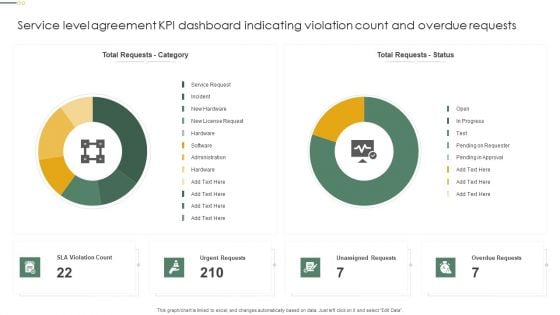
Service Level Agreement KPI Dashboard Indicating Violation Count And Overdue Requests Diagrams PDF
This graph or chart is linked to excel, and changes automatically based on data. Just left click on it and select Edit Data. Showcasing this set of slides titled Service Level Agreement KPI Dashboard Indicating Violation Count And Overdue Requests Diagrams PDF. The topics addressed in these templates are Total Requests Category, Total Requests Status, Urgent Requests. All the content presented in this PPT design is completely editable. Download it and make adjustments in color, background, font etc. as per your unique business setting.
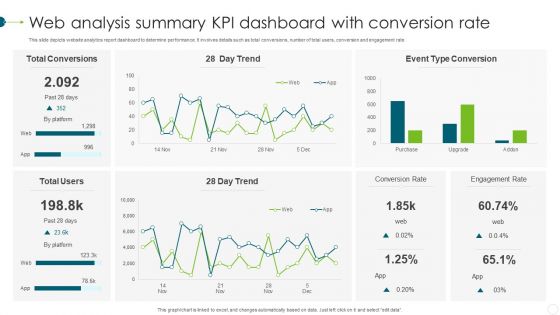
Web Analysis Summary KPI Dashboard With Conversion Rate Themes PDF
This slide depicts website analytics report dashboard to determine performance. It involves details such as total conversions, number of total users, conversion and engagement rate. Pitch your topic with ease and precision using this Web Analysis Summary KPI Dashboard With Conversion Rate Themes PDF. This layout presents information on Web Analysis Summary, KPI Dashboard, Conversion Rate. It is also available for immediate download and adjustment. So, changes can be made in the color, design, graphics or any other component to create a unique layout.
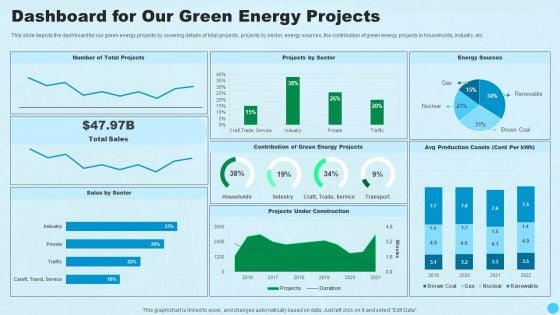
Dashboard For Our Green Energy Projects Clean And Renewable Energy Ppt PowerPoint Presentation Styles Designs Download PDF
This slide depicts the dashboard for our green energy projects by covering details of total projects, projects by sector, energy sources, the contribution of green energy projects in households, industry, etc.Deliver an awe inspiring pitch with this creative Dashboard For Our Green Energy Projects Clean And Renewable Energy Ppt PowerPoint Presentation Styles Designs Download PDF bundle. Topics like Energy Sources, Production Coasts, Total Sales can be discussed with this completely editable template. It is available for immediate download depending on the needs and requirements of the user.
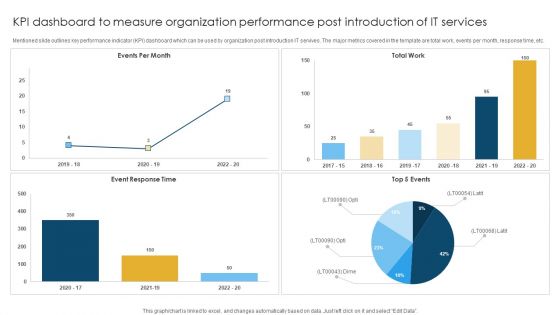
KPI Dashboard To Measure Organization Performance Post Introduction Of IT Services Rules PDF
Mentioned slide outlines key performance indicator KPI dashboard which can be used by organization post introduction IT servives. The major metrics covered in the template are total work, events per month, response time, etc. Showcasing this set of slides titled KPI Dashboard To Measure Organization Performance Post Introduction Of IT Services Rules PDF. The topics addressed in these templates are Event Response, Total Work, Events Per. All the content presented in this PPT design is completely editable. Download it and make adjustments in color, background, font etc. as per your unique business setting.
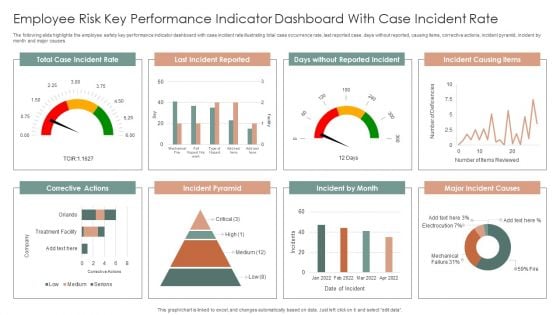
Employee Risk Key Performance Indicator Dashboard With Case Incident Rate Ppt Professional Information PDF
The following slide highlights the employee safety key performance indicator dashboard with case incident rate illustrating total case occurrence rate, last reported case, days without reported, causing items, corrective actions, incident pyramid, incident by month and major causes. Pitch your topic with ease and precision using this Employee Risk Key Performance Indicator Dashboard With Case Incident Rate Ppt Professional Information PDF. This layout presents information on Total Case, Incident Rate, Last Incident Reported, Incident Causing Items. It is also available for immediate download and adjustment. So, changes can be made in the color, design, graphics or any other component to create a unique layout.
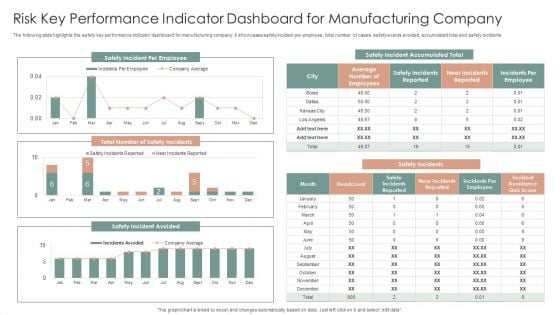
Risk Key Performance Indicator Dashboard For Manufacturing Company Ppt Gallery Graphics Design PDF
The following slide highlights the safety key performance indicator dashboard for manufacturing company. It showcases safety incident per employee, total number of cases, safety events avoided, accumulated total and safety incidents. Pitch your topic with ease and precision using this Risk Key Performance Indicator Dashboard For Manufacturing Company Ppt Gallery Graphics Design PDF. This layout presents information on Safety Incidents, Safety Incident Avoided, Safety Incident Accumulated. It is also available for immediate download and adjustment. So, changes can be made in the color, design, graphics or any other component to create a unique layout.
Product Sales Kpis With Website Traffic Ppt Icon Smartart
This slide showcase different strategies through which product is marketize to increase the product reach to the consumer and increase the market share. It includes total product revenue, sales comparison of online and in store sales, marketing campaigning and website traffic. Showcasing this set of slides titled Product Sales Kpis With Website Traffic Ppt Icon Smartart. The topics addressed in these templates are Website Traffic, Product Sales Increment, Total Product Revenue. All the content presented in this PPT design is completely editable. Download it and make adjustments in color, background, font etc. as per your unique business setting.
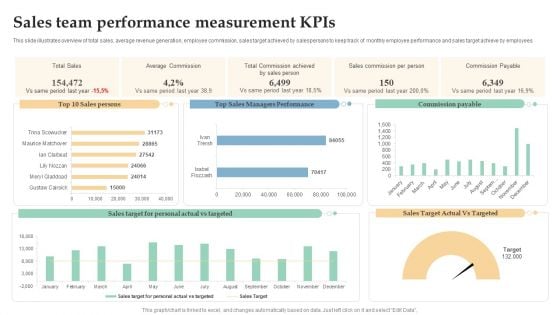
Sales Team Performance Measurement Kpis Ppt Professional Templates PDF
This slide illustrates overview of total sales, average revenue generation, employee commission, sales target achieved by salespersons to keep track of monthly employee performance and sales target achieve by employees. Showcasing this set of slides titled Sales Team Performance Measurement Kpis Ppt Professional Templates PDF. The topics addressed in these templates are Total Sales, Average Commission, Sales Commission, Per Person. All the content presented in this PPT design is completely editable. Download it and make adjustments in color, background, font etc. as per your unique business setting.
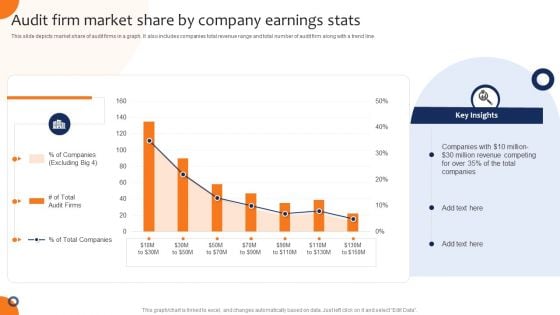
Audit Firm Market Share By Company Earnings Stats Formats PDF
This slide depicts market share of audit firms in a graph. It also includes companies total revenue range and total number of audit firm along with a trend line. Showcasing this set of slides titled Audit Firm Market Share By Company Earnings Stats Formats PDF. The topics addressed in these templates are Company Earnings Stats, Audit Firm Market Share. All the content presented in this PPT design is completely editable. Download it and make adjustments in color, background, font etc. as per your unique business setting.
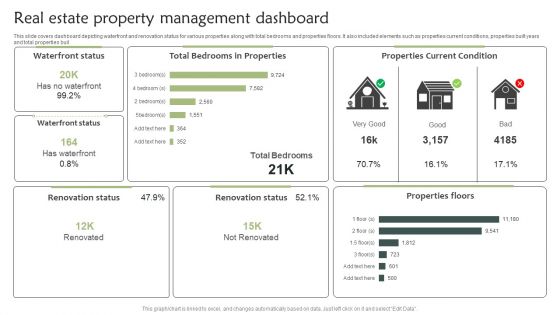
Real Estate Property Management Dashboard Introduction PDF
This slide covers dashboard depicting waterfront and renovation status for various properties along with total bedrooms and properties floors. It also included elements such as properties current conditions, properties built years and total properties buil. Pitch your topic with ease and precision using this Real Estate Property Management Dashboard Introduction PDF. This layout presents information on Real Estate Property, Management Dashboard. It is also available for immediate download and adjustment. So, changes can be made in the color, design, graphics or any other component to create a unique layout.
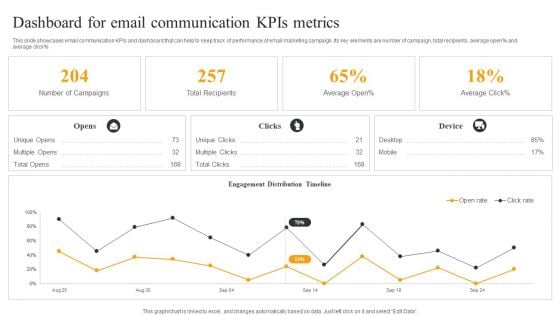
Dashboard For Email Communication Kpis Metrics Topics PDF
This slide showcases email communication KPIs and dashboard that can help to keep track of performance of email marketing campaign. Its key elements are number of campaign, total recipients, average open percent and average click percent. Showcasing this set of slides titled Dashboard For Email Communication Kpis Metrics Topics PDF. The topics addressed in these templates are Number Campaigns, Total Recipients, Engagement Distribution. All the content presented in this PPT design is completely editable. Download it and make adjustments in color, background, font etc. as per your unique business setting.
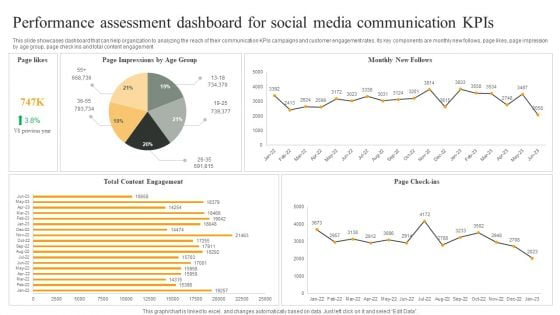
Performance Assessment Dashboard For Social Media Communication Kpis Graphics PDF
This slide showcases dashboard that can help organization to analyzing the reach of their communication KPIs campaigns and customer engagement rates. Its key components are monthly new follows, page likes, page impression by age group, page check ins and total content engagement. Pitch your topic with ease and precision using this Performance Assessment Dashboard For Social Media Communication Kpis Graphics PDF. This layout presents information on Monthly New Follows, Page Check ins, Total Content Engagement. It is also available for immediate download and adjustment. So, changes can be made in the color, design, graphics or any other component to create a unique layout.
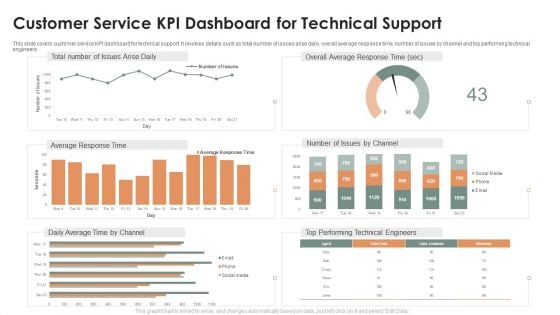
Customer Service KPI Dashboard For Technical Support Ppt Model Vector PDF
This slide covers customer service KPI dashboard for technical support. It involves details such as total number of issues arise daily, overall average response time, number of issues by channel and top performing technical engineers. Pitch your topic with ease and precision using this Customer Service KPI Dashboard For Technical Support Ppt Model Vector PDF. This layout presents information on Overall Average, Response Time, Total Number, Issues Arise Daily. It is also available for immediate download and adjustment. So, changes can be made in the color, design, graphics or any other component to create a unique layout.
Centralized Repository Data Lake Reporting Dashboard Icons PDF
This slide represents the data lake reporting dashboard by covering the total number of users, total lake size, trusted zone size, conversion rate, and retention. Find a pre designed and impeccable Centralized Repository Data Lake Reporting Dashboard Icons PDF. The templates can ace your presentation without additional effort. You can download these easy to edit presentation templates to make your presentation stand out from others. So, what are you waiting for Download the template from Slidegeeks today and give a unique touch to your presentation.
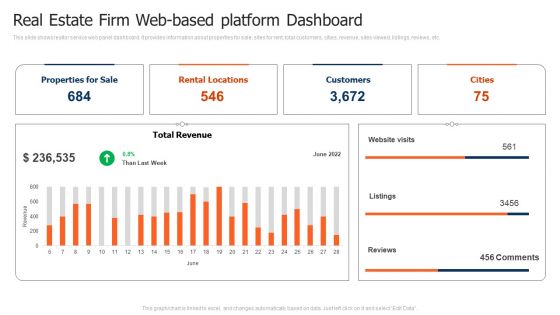
Real Estate Firm Web Based Platform Dashboard Background PDF
This slide shows realtor service web panel dashboard. It provides information about properties for sale, sites for rent, total customers, cities, revenue, sites viewed, listings, reviews, etc. Pitch your topic with ease and precision using this Real Estate Firm Web Based Platform Dashboard Background PDF. This layout presents information on Total Revenue, Rental Locations, Properties For Sale. It is also available for immediate download and adjustment. So, changes can be made in the color, design, graphics or any other component to create a unique layout.


 Continue with Email

 Home
Home


