Trade Finance
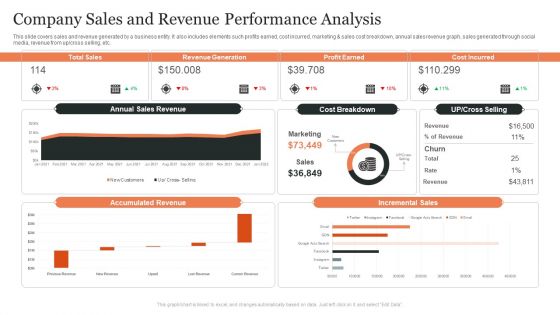
Company Sales And Revenue Performance Analysis Ppt Ideas Format PDF
This slide covers sales and revenue generated by a business entity. It also includes elements such profits earned, cost incurred, marketing and sales cost breakdown, annual sales revenue graph, sales generated through social media, revenue from up OR cross selling, etc. Pitch your topic with ease and precision using this Company Sales And Revenue Performance Analysis Ppt Ideas Format PDF. This layout presents information on Total Sales, Revenue Generation, Profit Earned, Cost Incurred. It is also available for immediate download and adjustment. So, changes can be made in the color, design, graphics or any other component to create a unique layout.
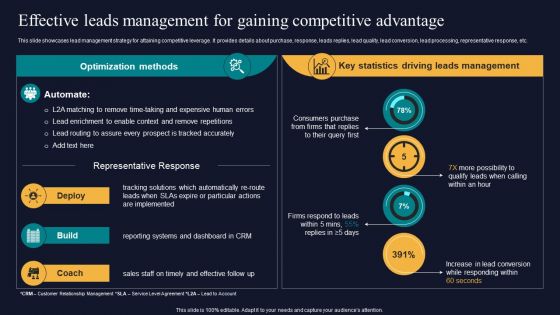
Effective Leads Management For Gaining Competitive Advantage Tactics To Gain Sustainable Template PDF
This slide showcases lead management strategy for attaining competitive leverage. It provides details about purchase, response, leads replies, lead quality, lead conversion, lead processing, representative response, etc. Boost your pitch with our creative Effective Leads Management For Gaining Competitive Advantage Tactics To Gain Sustainable Template PDF. Deliver an awe-inspiring pitch that will mesmerize everyone. Using these presentation templates you will surely catch everyones attention. You can browse the ppts collection on our website. We have researchers who are experts at creating the right content for the templates. So you do not have to invest time in any additional work. Just grab the template now and use them.
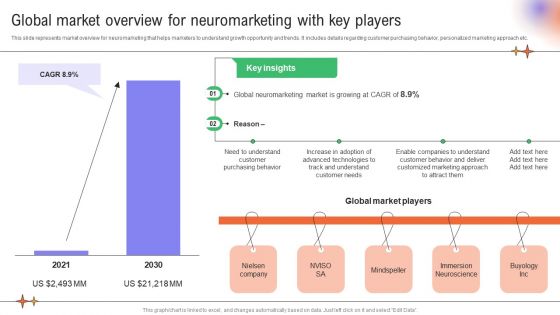
Global Market Overview For Neuromarketing With Utilizing Neuromarketing Technique Themes PDF
This slide represents market overview for neuromarketing that helps marketers to understand growth opportunity and trends. It includes details regarding customer purchasing behavior, personalized marketing approach etc. Boost your pitch with our creative Global Market Overview For Neuromarketing With Utilizing Neuromarketing Technique Themes PDF. Deliver an awe-inspiring pitch that will mesmerize everyone. Using these presentation templates you will surely catch everyones attention. You can browse the ppts collection on our website. We have researchers who are experts at creating the right content for the templates. So you dont have to invest time in any additional work. Just grab the template now and use them.
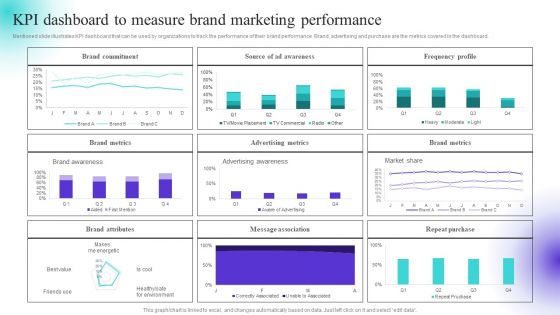
KPI Dashboard To Measure Brand Marketing Performance Inspiration PDF
Mentioned slide illustrates KPI dashboard that can be used by organizations to track the performance of their brand performance. Brand, advertising and purchase are the metrics covered in the dashboard. Boost your pitch with our creative KPI Dashboard To Measure Brand Marketing Performance Inspiration PDF. Deliver an awe inspiring pitch that will mesmerize everyone. Using these presentation templates you will surely catch everyones attention. You can browse the ppts collection on our website. We have researchers who are experts at creating the right content for the templates. So you do not have to invest time in any additional work. Just grab the template now and use them.
Monthly Sales Performance Tracking And Monitoring Dashboard Diagrams PDF
This slide showcases a dashboard presenting various metrics to measure and analyze sales performance for revenue growth. It includes key components such as number of sales, revenue, profit, cost, sales revenue, sales increment, cost analysis and cross sell. Make sure to capture your audiences attention in your business displays with our gratis customizable Monthly Sales Performance Tracking And Monitoring Dashboard Diagrams PDF. These are great for business strategies, office conferences, capital raising or task suggestions. If you desire to acquire more customers for your tech business and ensure they stay satisfied, create your own sales presentation with these plain slides.
Monthly Sales Performance Tracking And Monitoring Dashboard Designs PDF
This slide showcases a dashboard presenting various metrics to measure and analyze sales performance for revenue growth. It includes key components such as number of sales, revenue, profit, cost, sales revenue, sales increment, cost analysis and cross sell. Make sure to capture your audiences attention in your business displays with our gratis customizable Monthly Sales Performance Tracking And Monitoring Dashboard Designs PDF. These are great for business strategies, office conferences, capital raising or task suggestions. If you desire to acquire more customers for your tech business and ensure they stay satisfied, create your own sales presentation with these plain slides.
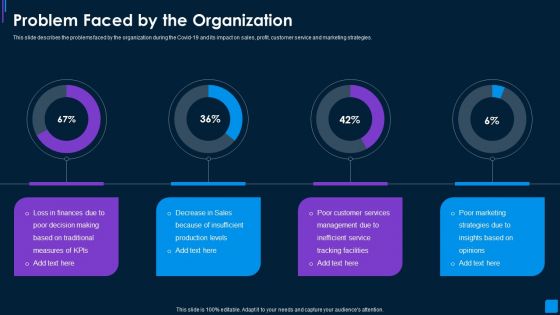
Advance IT Service Delivery Problem Faced By The Organization Themes PDF
This slide describes the problems faced by the organization during the Covid-19 and its impact on sales, profit, customer service and marketing strategies. Deliver an awe inspiring pitch with this creative advance it service delivery problem faced by the organization themes pdf bundle. Topics like loss finances, poor decision, measures kpis, poor customer services can be discussed with this completely editable template. It is available for immediate download depending on the needs and requirements of the user.
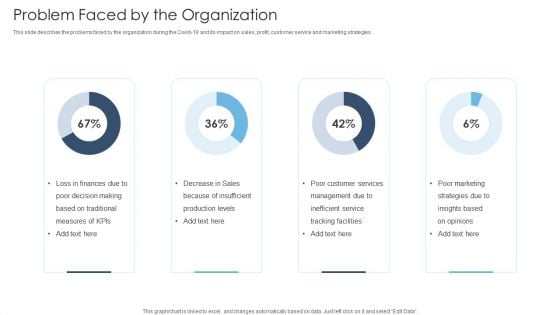
Achieving Proactive From Reactive Problem Faced By The Organization Demonstration PDF
This slide describes the problems faced by the organization during the Covid-19 and its impact on sales, profit, customer service and marketing strategies. Deliver and pitch your topic in the best possible manner with this Achieving Proactive From Reactive Problem Faced By The Organization Demonstration PDF. Use them to share invaluable insights on Finances, Poor Decision Making, Measures KPIs and impress your audience. This template can be altered and modified as per your expectations. So, grab it now.
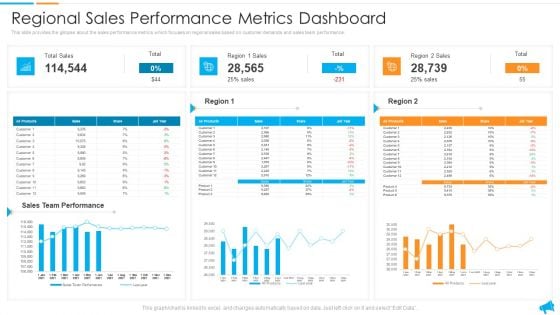
Strategy For Regional Economic Progress Outlining Regional Sales Performance Metrics Dashboard Designs PDF
This slide provides the glimpse about the sales performance metrics which focuses on regional sales based on customer demands and sales team performance. Deliver and pitch your topic in the best possible manner with this strategy for regional economic progress outlining regional sales performance metrics dashboard designs pdf. Use them to share invaluable insights on sales team performance, regional sales performance metrics dashboard and impress your audience. This template can be altered and modified as per your expectations. So, grab it now.

Commercial Marketing KPI With Accumulated Sales And Profit Portrait PDF
This slide template covers about key performing indicators like number of sales with revenue and profit generated in comparison with cost input and breakdown.Showcasing this set of slides titled Commercial Marketing KPI With Accumulated Sales And Profit Portrait PDF. The topics addressed in these templates are Cost Breakdown, Accumulated Revenue, Incremental Sales. All the content presented in this PPT design is completely editable. Download it and make adjustments in color, background, font etc. as per your unique business setting.
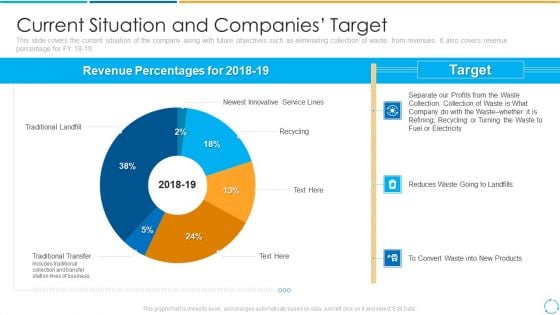
Current Situation And Companies Target Ppt PowerPoint Presentation File Picture PDF
This slide covers the current situation of the company along with future objectives such as eliminating collection of waste from revenues. It also covers revenue percentage for FY 18 19. Deliver an awe inspiring pitch with this creative current situation and companies target ppt powerpoint presentation file picture pdf bundle. Topics like innovative, service, traditional transfer, target, revenue percentages can be discussed with this completely editable template. It is available for immediate download depending on the needs and requirements of the user.
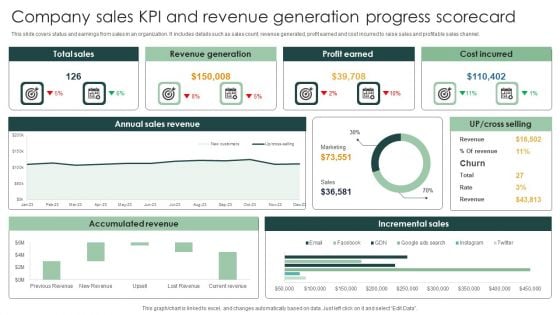
Company Sales KPI And Revenue Generation Progress Scorecard Formats PDF
This slide covers status and earnings from sales in an organization. It includes details such as sales count, revenue generated, profit earned and cost incurred to raise sales and profitable sales channel.Showcasing this set of slides titled Company Sales KPI And Revenue Generation Progress Scorecard Formats PDF. The topics addressed in these templates are Accumulated Revenue, Annual Sales Revenue, Incremental Sales. All the content presented in this PPT design is completely editable. Download it and make adjustments in color, background, font etc. as per your unique business setting.
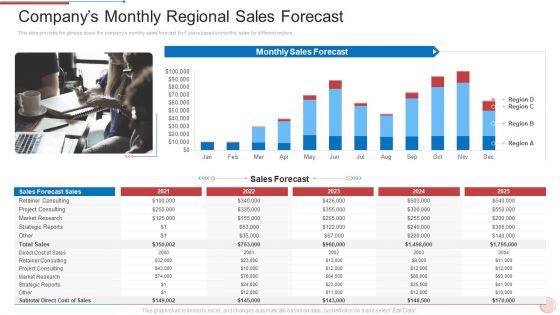
Regional Marketing Strategies Companys Monthly Regional Sales Forecast Graphics PDF
This slide provides the glimpse about the companys monthly sales forecast for 5 years based on monthly sales for different regions. Deliver and pitch your topic in the best possible manner with this regional marketing strategies companys monthly regional sales forecast graphics pdf. Use them to share invaluable insights on strategic, sales, cost and impress your audience. This template can be altered and modified as per your expectations. So, grab it now.
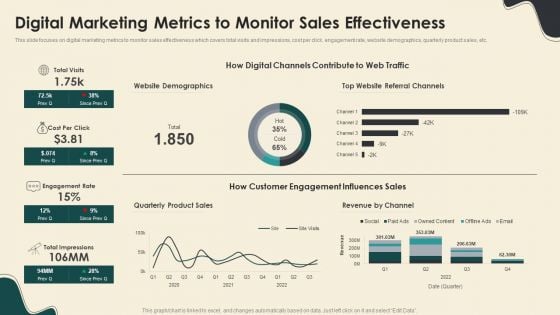
Digital Marketing Metrics To Monitor Sales Effectiveness Graphics PDF
This slide focuses on digital marketing metrics to monitor sales effectiveness which covers total visits and impressions, cost per click, engagement rate, website demographics, quarterly product sales, etc. Deliver an awe inspiring pitch with this creative Digital Marketing Metrics To Monitor Sales Effectiveness Graphics PDF bundle. Topics like Website Demographics, Quarterly Product Sales, Revenue By Channel can be discussed with this completely editable template. It is available for immediate download depending on the needs and requirements of the user.
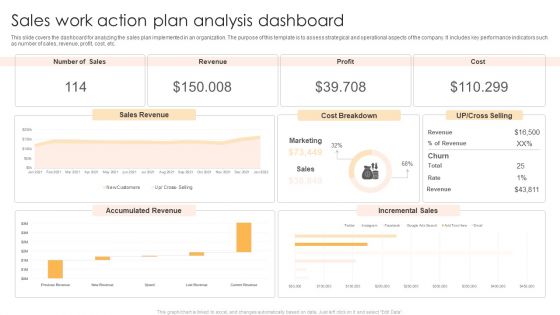
Sales Work Action Plan Analysis Dashboard Brochure PDF
This slide covers the dashboard for analyzing the sales plan implemented in an organization. The purpose of this template is to assess strategical and operational aspects of the company. It includes key performance indicators such as number of sales, revenue, profit, cost, etc. Showcasing this set of slides titled Sales Work Action Plan Analysis Dashboard Brochure PDF. The topics addressed in these templates are Sales Revenue, Cost Breakdown, Accumulated Revenue. All the content presented in this PPT design is completely editable. Download it and make adjustments in color, background, font etc. as per your unique business setting.

Weekly Sales Performance KPI Dashboard For Revenue Generation Brochure PDF
The following slide exhibits dashboard to maintain revenue and management under control. It presents information related to profits, cross selling, costs, etc. Pitch your topic with ease and precision using this Weekly Sales Performance KPI Dashboard For Revenue Generation Brochure PDF. This layout presents information on Total Sales, Revenue, Profit, Cost. It is also available for immediate download and adjustment. So, changes can be made in the color, design, graphics or any other component to create a unique layout.
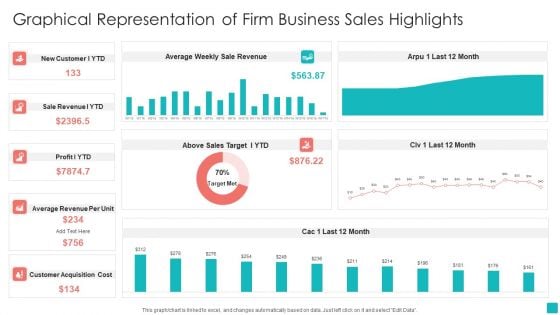
Graphical Representation Of Firm Business Sales Highlights Pictures PDF
Showcasing this set of slides titled Graphical Representation Of Firm Business Sales Highlights Pictures PDF. The topics addressed in these templates are Average Revenue Per Unit, Customer Acquisition Cost, Sale Revenue. All the content presented in this PPT design is completely editable. Download it and make adjustments in color, background, font etc. as per your unique business setting.
Monthly Sales Performance Tracking And Monitoring Dashboard Sample PDF
This slide showcases a dashboard presenting various metrics to measure and analyze sales performance for revenue growth. It includes key components such as number of sales, revenue, profit, cost, sales revenue, sales increment, cost analysis and cross sell. Do you have to make sure that everyone on your team knows about any specific topic I yes, then you should give Monthly Sales Performance Tracking And Monitoring Dashboard Sample PDF a try. Our experts have put a lot of knowledge and effort into creating this impeccable Monthly Sales Performance Tracking And Monitoring Dashboard Sample PDF. You can use this template for your upcoming presentations, as the slides are perfect to represent even the tiniest detail. You can download these templates from the Slidegeeks website and these are easy to edit. So grab these today.
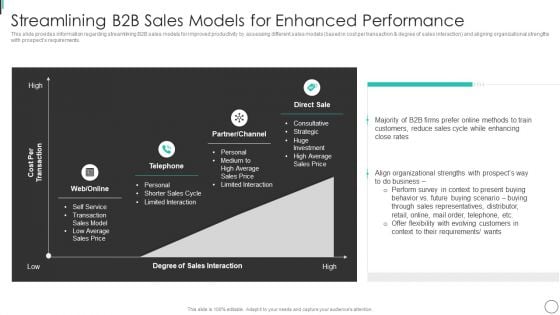
Streamlining B2B Sales Models For Enhanced Performance Portrait PDF
This slide provides information regarding streamlining B2B sales models for improved productivity by assessing different sales models based in cost per transaction degree of sales interaction and aligning organizational strengths with prospects requirements. Deliver and pitch your topic in the best possible manner with this Streamlining B2B Sales Models For Enhanced Performance Portrait PDF. Use them to share invaluable insights on Limited Interaction, Sales Interaction, Align Organizational and impress your audience. This template can be altered and modified as per your expectations. So, grab it now.
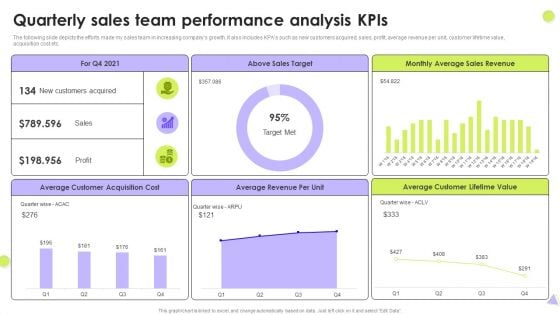
Quarterly Sales Team Performance Analysis Kpis Slides PDF
The following slide depicts the efforts made my sales team in increasing companys growth. It also includes KPAs such as new customers acquired, sales, profit, average revenue per unit, customer lifetime value, acquisition cost etc. Showcasing this set of slides titled Quarterly Sales Team Performance Analysis Kpis Slides PDF. The topics addressed in these templates are Above Sales Target, Average Sales Revenue, Average Customer. All the content presented in this PPT design is completely editable. Download it and make adjustments in color, background, font etc. as per your unique business setting.
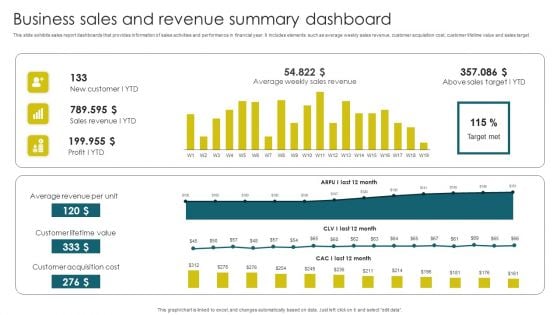
Business Sales And Revenue Summary Dashboard Brochure PDF
This slide exhibits sales report dashboards that provides information of sales activities and performance in financial year. It includes elements such as average weekly sales revenue, customer acquisition cost, customer lifetime value and sales target. Pitch your topic with ease and precision using this Business Sales And Revenue Summary Dashboard Brochure PDF. This layout presents information on Average Revenue, Customer Lifetime, Customer Acquisition. It is also available for immediate download and adjustment. So, changes can be made in the color, design, graphics or any other component to create a unique layout.
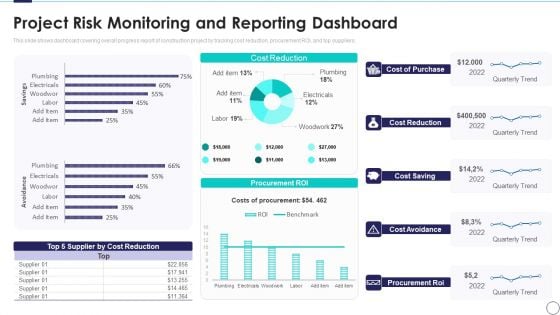
Risk Assessment And Mitigation Plan Project Risk Monitoring And Reporting Dashboard Ppt Inspiration PDF
This slide shows dashboard covering overall progress report of construction project by tracking cost reduction, procurement ROI, and top suppliers. Deliver an awe inspiring pitch with this creative risk assessment and mitigation plan project risk monitoring and reporting dashboard ppt inspiration pdf bundle. Topics like cost reduction, cost saving, cost avoidance, procurement roi can be discussed with this completely editable template. It is available for immediate download depending on the needs and requirements of the user.
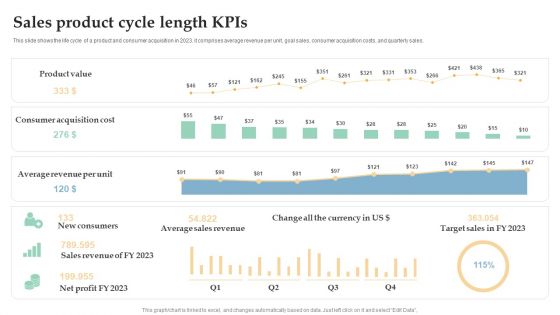
Sales Product Cycle Length Kpis Ppt Pictures Aids PDF
This slide shows the life cycle of a product and consumer acquisition in 2023. it comprises average revenue per unit, goal sales, consumer acquisition costs, and quarterly sales. Showcasing this set of slides titled Sales Product Cycle Length Kpis Ppt Pictures Aids PDF. The topics addressed in these templates are Product Value, Consumer Acquisition Cost, Average Revenue, Per Unit. All the content presented in this PPT design is completely editable. Download it and make adjustments in color, background, font etc. as per your unique business setting.
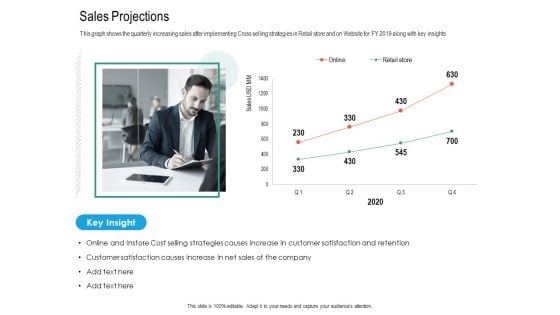
Upselling Strategies For Business Sales Projections Template PDF
This graph shows the quarterly increasing sales after implementing Cross selling strategies in Retail store and on Website for FY 2019 along with key insights. Deliver an awe inspiring pitch with this creative upselling strategies for business sales projections template pdf bundle. Topics like cost selling, strategies, retention, sales can be discussed with this completely editable template. It is available for immediate download depending on the needs and requirements of the user.
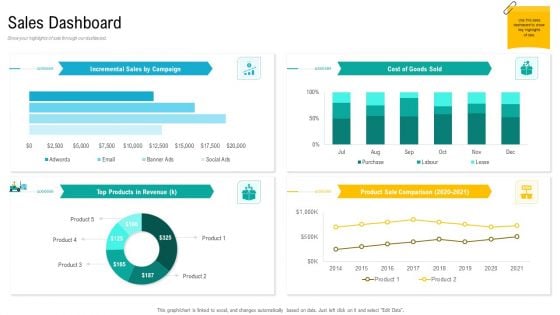
Product USP Sales Dashboard Ppt Inspiration Background Designs PDF
Show your highlights of sale through our dashboard. Deliver and pitch your topic in the best possible manner with this product usp sales dashboard ppt inspiration background designs pdf. Use them to share invaluable insights on product sale comparison, products in revenue, cost of goods sold and impress your audience. This template can be altered and modified as per your expectations. So, grab it now.
Monthly Sales Performance Tracking And Monitoring Dashboard Inspiration PDF
This slide showcases a dashboard presenting various metrics to measure and analyze sales performance for revenue growth. It includes key components such as number of sales, revenue, profit, cost, sales revenue, sales increment, cost analysis and cross sell. Coming up with a presentation necessitates that the majority of the effort goes into the content and the message you intend to convey. The visuals of a PowerPoint presentation can only be effective if it supplements and supports the story that is being told. Keeping this in mind our experts created Monthly Sales Performance Tracking And Monitoring Dashboard Inspiration PDF to reduce the time that goes into designing the presentation. This way, you can concentrate on the message while our designers take care of providing you with the right template for the situation.
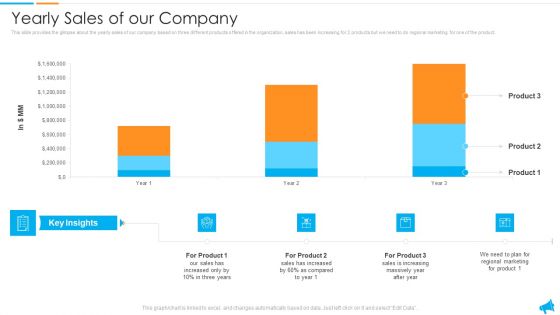
Strategy For Regional Economic Progress Outlining Yearly Sales Of Our Company Infographics PDF
This slide provides the glimpse about the yearly sales of our company based on three different products offered in the organization, sales has been increasing for 2 products but we need to do regional marketing for one of the product. Deliver and pitch your topic in the best possible manner with this strategy for regional economic progress outlining yearly sales of our company infographics pdf. Use them to share invaluable insights on yearly sales of our company and impress your audience. This template can be altered and modified as per your expectations. So, grab it now.
Market Penetration Dashboard With Sales Metrics Ppt Icon Examples PDF
This slide shows market penetration dashboard for sales team. It provides information about regions, emerging markets, planned sales, actual sales, revenue, gender wise sales, etc. Pitch your topic with ease and precision using this Market Penetration Dashboard With Sales Metrics Ppt Icon Examples PDF. This layout presents information on Emerging Markets, Sales Gender, Actual Sales. It is also available for immediate download and adjustment. So, changes can be made in the color, design, graphics or any other component to create a unique layout.
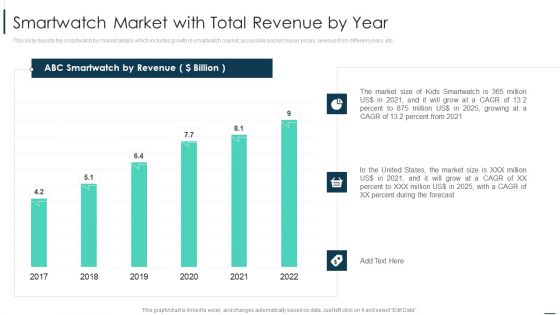
Merchandise Sales Investor Funding Smartwatch Market With Total Revenue By Year Designs PDF
This slide depicts the smartwatch toy market details which includes growth in smartwatch market, accessible pocket money prices, revenue from different years, etc. Deliver and pitch your topic in the best possible manner with this merchandise sales investor funding smartwatch market with total revenue by year designs pdf. Use them to share invaluable insights on smartwatch market with total revenue by year and impress your audience. This template can be altered and modified as per your expectations. So, grab it now.
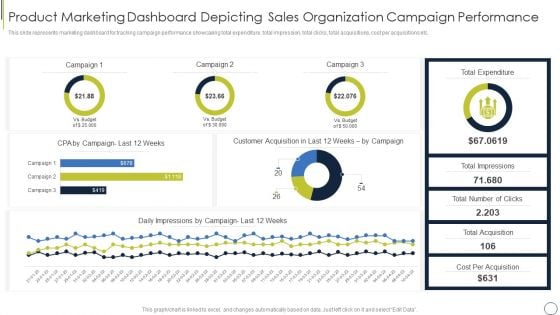
Product Marketing Dashboard Depicting Sales Organization Campaign Performance Themes PDF
This slide represents marketing dashboard for tracking campaign performance showcasing total expenditure, total impression, total clicks, total acquisitions, cost per acquisitions etc. Pitch your topic with ease and precision using this product marketing dashboard depicting sales organization campaign performance themes pdf. This layout presents information on product marketing dashboard depicting sales organization campaign performance. It is also available for immediate download and adjustment. So, changes can be made in the color, design, graphics or any other component to create a unique layout.
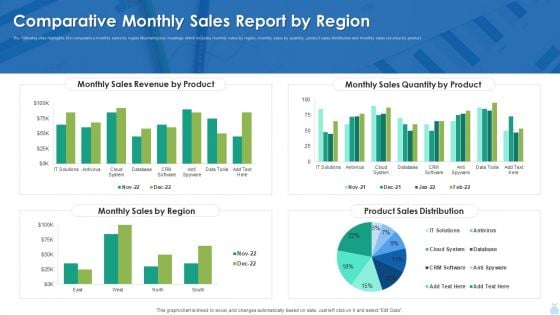
Comparative Monthly Sales Report By Region Graphics PDF
The following slide highlights the comparative monthly sales by region illustrating key headings which includes monthly sales by region, monthly sales by quantity, product sales distribution and monthly sales revenue by product. Showcasing this set of slides titled Comparative Monthly Sales Report By Region Graphics PDF. The topics addressed in these templates are Sales Revenue, Monthly Sales Quantity, Product Sales Distribution. All the content presented in this PPT design is completely editable. Download it and make adjustments in color, background, font etc. as per your unique business setting.
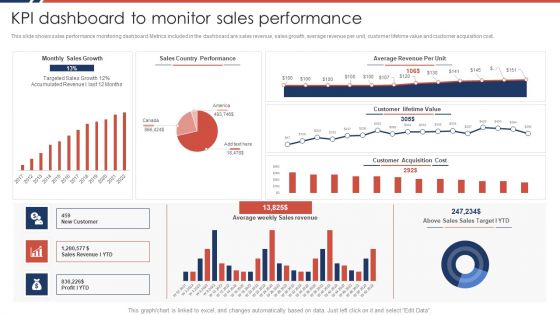
Effective Sales Plan For New Product Introduction In Market KPI Dashboard To Monitor Sales Performance Portrait PDF
This slide shows sales performance monitoring dashboard. Metrics included in the dashboard are sales revenue, sales growth, average revenue per unit, customer lifetime value and customer acquisition cost.Deliver an awe inspiring pitch with this creative Effective Sales Plan For New Product Introduction In Market KPI Dashboard To Monitor Sales Performance Portrait PDF bundle. Topics like Average Revenue, Country Performance, Customer Lifetime can be discussed with this completely editable template. It is available for immediate download depending on the needs and requirements of the user.
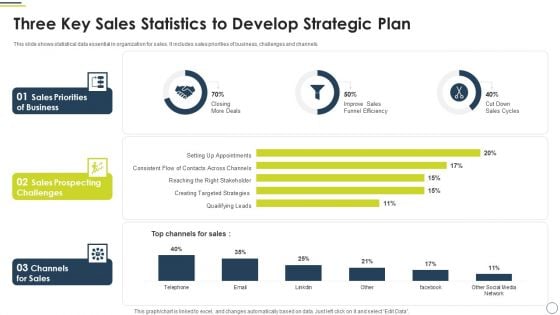
Three Key Sales Statistics To Develop Strategic Plan Microsoft PDF
This slide shows statistical data essential in organization for sales. It includes sales priorities of business, challenges and channels. Pitch your topic with ease and precision using this Three Key Sales Statistics To Develop Strategic Plan Microsoft PDF. This layout presents information on Sales Priorities Business, Sales Prospecting Challenges, Channels For Sales. It is also available for immediate download and adjustment. So, changes can be made in the color, design, graphics or any other component to create a unique layout.
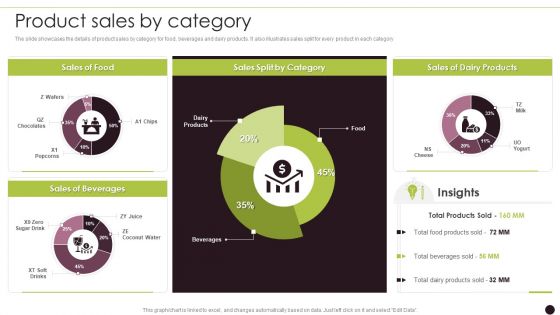
Canned Food Company Profile Product Sales By Category Infographics PDF
The slide showcases the details of product sales by category for food, beverages and dairy products. It also illustrates sales split for every product in each category Deliver and pitch your topic in the best possible manner with this Canned Food Company Profile Product Sales By Category Infographics PDF Use them to share invaluable insights on Sales Of Food, Sales Beverages, Sales Split and impress your audience. This template can be altered and modified as per your expectations. So, grab it now.
Determine Pipeline By Individual Sales Representative Performance Icons PDF
This slide provides information regarding monitoring of different sales representatives performance by determine sales duration at various pipeline stages. Deliver an awe inspiring pitch with this creative Determine Pipeline By Individual Sales Representative Performance Icons PDF bundle. Topics like Sales Representative, Sales Department, Shorter Sales Cycle can be discussed with this completely editable template. It is available for immediate download depending on the needs and requirements of the user.
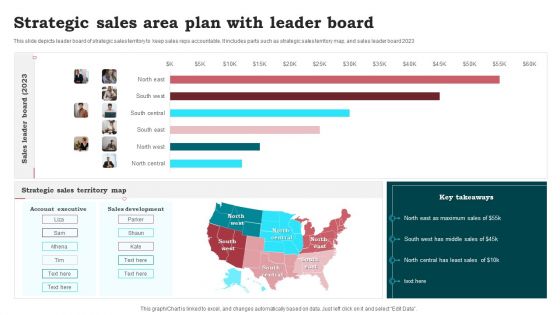
Strategic Sales Area Plan With Leader Board Inspiration PDF
This slide depicts leader board of strategic sales territory to keep sales reps accountable. It includes parts such as strategic sales territory map, and sales leader board 2023. Showcasing this set of slides titled Strategic Sales Area Plan With Leader Board Inspiration PDF. The topics addressed in these templates are Strategic Sales Area, Plan Leader Board. All the content presented in this PPT design is completely editable. Download it and make adjustments in color, background, font etc. as per your unique business setting.
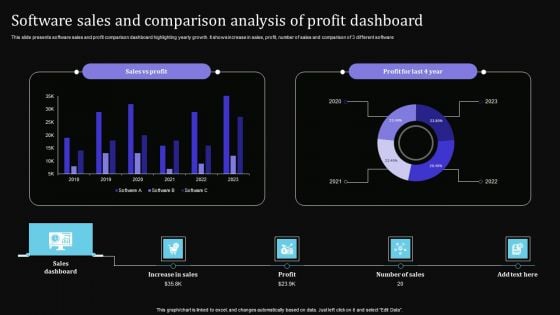
Software Sales And Comparison Analysis Of Profit Dashboard Sample PDF
This slide presents software sales and profit comparison dashboard highlighting yearly growth. It shows increase in sales, profit, number of sales and comparison of 3 different software. Showcasing this set of slides titled Software Sales And Comparison Analysis Of Profit Dashboard Sample PDF. The topics addressed in these templates are Increase Sales, Profit, Sales Dashboard. All the content presented in this PPT design is completely editable. Download it and make adjustments in color, background, font etc. as per your unique business setting.
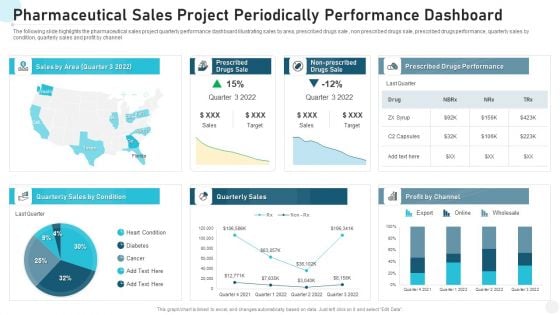
Pharmaceutical Sales Project Periodically Performance Dashboard Brochure PDF
The following slide highlights the pharmaceutical sales project quarterly performance dashboard illustrating sales by area, prescribed drugs sale , non prescribed drugs sale, prescribed drugs performance, quarterly sales by condition, quarterly sales and profit by channel Showcasing this set of slides titled pharmaceutical sales project periodically performance dashboard brochure pdf. The topics addressed in these templates are pharmaceutical sales project periodically performance dashboard. All the content presented in this PPT design is completely editable. Download it and make adjustments in color, background, font etc. as per your unique business setting.
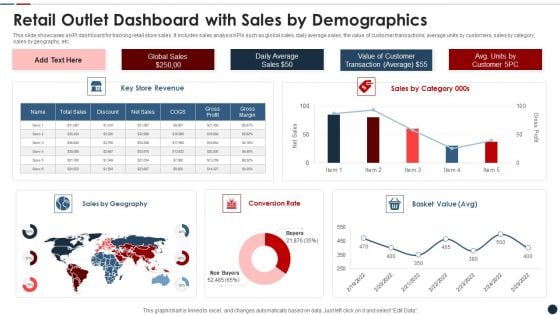
Retail Outlet Dashboard With Sales By Demographics Slides PDF
This slide showcases a KPI dashboard for tracking retail store sales. It includes sales analysis KPIs such as global sales, daily average sales, the value of customer transactions, average units by customers, sales by category, sales by geography, etc. Showcasing this set of slides titled retail outlet dashboard with sales by demographics slides pdf The topics addressed in these templates are Retail outlet dashboard with sales by demographics All the content presented in this PPT design is completely editable. Download it and make adjustments in color, background, font etc. as per your unique business setting.
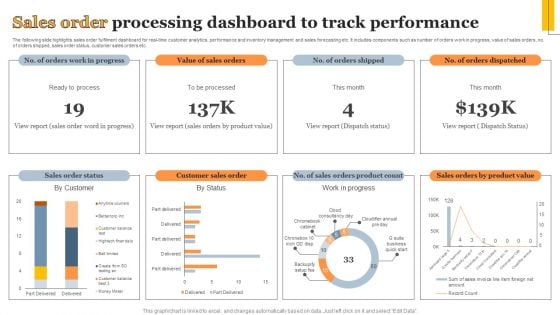
Sales Order Processing Dashboard To Track Performance Information PDF
The following slide highlights sales order fulfilment dashboard for real-time customer analytics, performance and inventory management and sales forecasting etc. It includes components such as number of orders work in progress, value of sales orders, no. of orders shipped, sales order status, customer sales orders etc. Showcasing this set of slides titled Sales Order Processing Dashboard To Track Performance Information PDF. The topics addressed in these templates are Sales Order Status, Customer Sales Order, Work Progress. All the content presented in this PPT design is completely editable. Download it and make adjustments in color, background, font etc. as per your unique business setting.
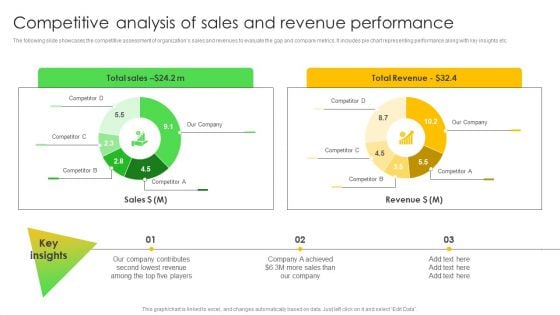
Competitive Analysis Of Sales And Revenue Performance Information PDF
The following slide showcases the competitive assessment of organizations sales and revenues to evaluate the gap and compare metrics. It includes pie chart representing performance along with key insights etc. Slidegeeks is one of the best resources for PowerPoint templates. You can download easily and regulate Competitive Analysis Of Sales And Revenue Performance Information PDF for your personal presentations from our wonderful collection. A few clicks is all it takes to discover and get the most relevant and appropriate templates. Use our Templates to add a unique zing and appeal to your presentation and meetings. All the slides are easy to edit and you can use them even for advertisement purposes.
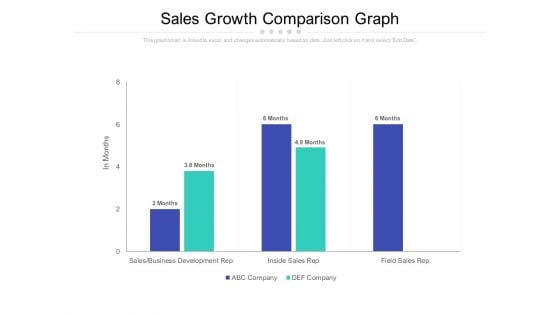
Sales Growth Comparison Graph Ppt PowerPoint Presentation Outline Demonstration
Presenting this set of slides with name sales growth comparison graph ppt powerpoint presentation outline demonstration. The topics discussed in these slides are sales, business development rep, inside sales rep, field sales rep. This is a completely editable PowerPoint presentation and is available for immediate download. Download now and impress your audience.
Dashboard For Tracking Sales Target Metrics Introduction PDF
This slide presents KPI dashboard for tracking Sales Target Metrics achievement monthly and region wise helpful in adjusting activities as per ongoing performance. It includes average weekly sales revenue, average sales target, annual sales growth, regional sales performance and average revenue per unit that should be regularly tracked. Showcasing this set of slides titled Dashboard For Tracking Sales Target Metrics Introduction PDF. The topics addressed in these templates are Average Revenue, Per Unit, Average Weekly, Sales Revenue. All the content presented in this PPT design is completely editable. Download it and make adjustments in color, background, font etc. as per your unique business setting.
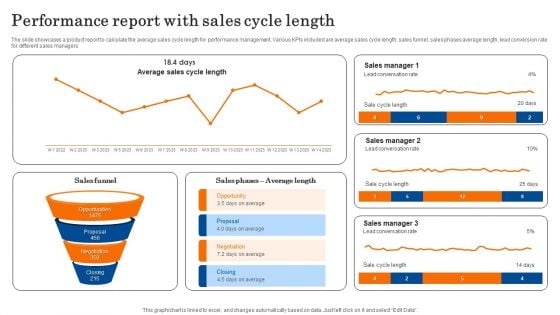
Performance Report With Sales Cycle Length Template PDF
The slide showcases a product report to calculate the average sales cycle length for performance management. Various KPIs included are average sales cycle length, sales funnel, sales phases average length, lead conversion rate for different sales managers. sPitch your topic with ease and precision using this Performance Report With Sales Cycle Length Template PDF. This layout presents information on Sales Manager, Conversation Rate, Opportunity. It is also available for immediate download and adjustment. So, changes can be made in the color, design, graphics or any other component to create a unique layout.
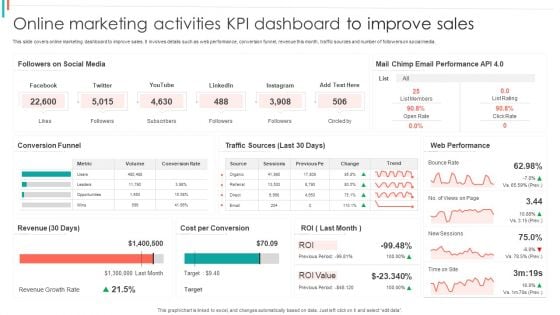
Online Marketing Activities KPI Dashboard To Improve Sales Ideas PDF
This slide covers online marketing dashboard to improve sales. It involves details such as web performance, conversion funnel, revenue this month, traffic sources and number of followers on social media.Pitch your topic with ease and precision using this Online Marketing Activities KPI Dashboard To Improve Sales Ideas PDF. This layout presents information on Email Performance, Web Performance, Cost Conversion. It is also available for immediate download and adjustment. So, changes can be made in the color, design, graphics or any other component to create a unique layout.
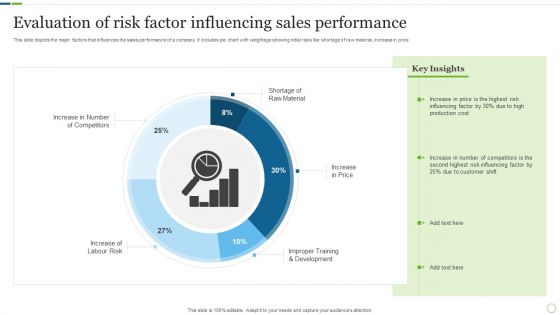
Evaluation Of Risk Factor Influencing Sales Performance Inspiration PDF
This slide depicts the major factors that influences the sales performance of a company. It includes pie chart with weightage showing initial risks like shortage of raw material, increase in price. Pitch your topic with ease and precision using this Evaluation Of Risk Factor Influencing Sales Performance Inspiration PDF. This layout presents information on Production Cost, Customer Shift, Risk Influencing. It is also available for immediate download and adjustment. So, changes can be made in the color, design, graphics or any other component to create a unique layout.
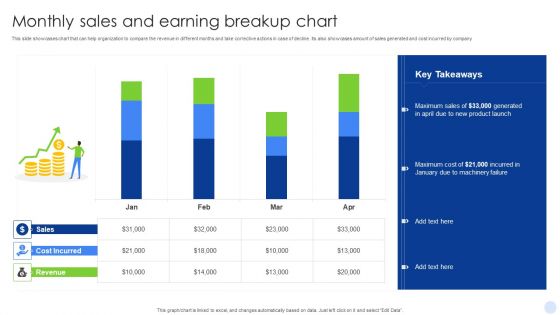
Monthly Sales And Earning Breakup Chart Clipart PDF
This slide showcases chart that can help organization to compare the revenue in different months and take corrective actions in case of decline. Its also showcases amount of sales generated and cost incurred by company. Showcasing this set of slides titled Monthly Sales And Earning Breakup Chart Clipart PDF. The topics addressed in these templates are New Product Launch, Machinery Failure. All the content presented in this PPT design is completely editable. Download it and make adjustments in color, background, font etc. as per your unique business setting.
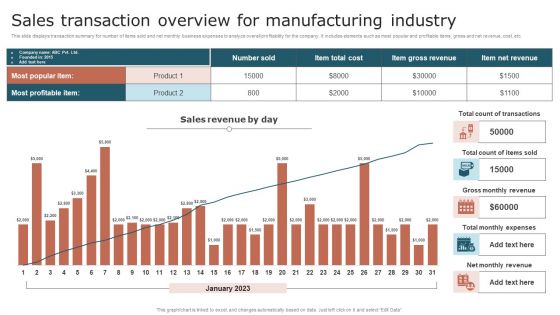
Sales Transaction Overview For Manufacturing Industry Elements PDF
This slide displays transaction summary for number of items sold and net monthly business expenses to analyze overall profitability for the company. It includes elements such as most popular and profitable items, gross and net revenue, cost, etc. Pitch your topic with ease and precision using this Sales Transaction Overview For Manufacturing Industry Elements PDF. This layout presents information on Product, Sales Revenue, Transactions. It is also available for immediate download and adjustment. So, changes can be made in the color, design, graphics or any other component to create a unique layout.
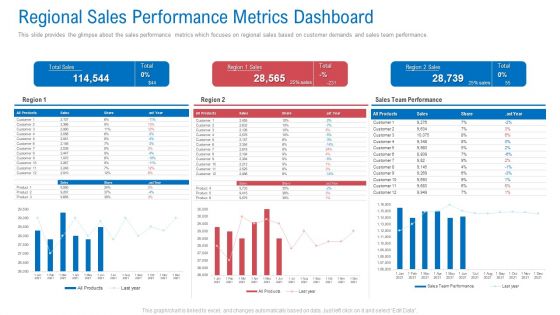
Regional Marketing Planning Regional Sales Performance Metrics Dashboard Information PDF
This slide provides the glimpse about the sales performance metrics which focuses on regional sales based on customer demands and sales team performance. Deliver an awe inspiring pitch with this creative regional marketing planning regional sales performance metrics dashboard information pdf bundle. Topics like regional sales performance metrics dashboard can be discussed with this completely editable template. It is available for immediate download depending on the needs and requirements of the user.

Market Area Analysis Regional Sales Performance Metrics Dashboard Designs PDF
This slide provides the glimpse about the sales performance metrics which focuses on regional sales based on customer demands and sales team performance. Deliver and pitch your topic in the best possible manner with this market area analysis regional sales performance metrics dashboard designs pdf. Use them to share invaluable insights on regional sales performance metrics dashboard and impress your audience. This template can be altered and modified as per your expectations. So, grab it now.

Regional Marketing Strategies Regional Sales Performance Metrics Dashboard Infographics PDF
This slide provides the glimpse about the sales performance metrics which focuses on regional sales based on customer demands and sales team performance. Deliver and pitch your topic in the best possible manner with this regional marketing strategies regional sales performance metrics dashboard infographics pdf. Use them to share invaluable insights on regional sales performance metrics dashboard and impress your audience. This template can be altered and modified as per your expectations. So, grab it now.
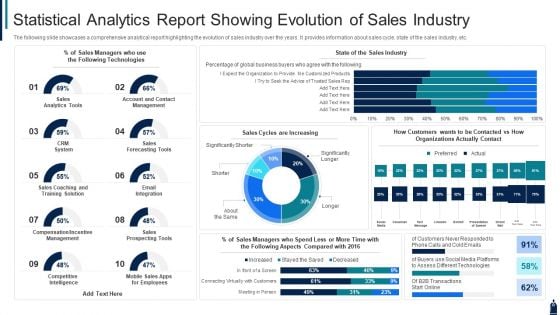
Statistical Analytics Report Showing Evolution Of Sales Industry Diagrams PDF
The following slide showcases a comprehensive analytical report highlighting the evolution of sales industry over the years. It provides information about sales cycle, state of the sales industry, etc. Showcasing this set of slides titled statistical analytics report showing evolution of sales industry diagrams pdf. The topics addressed in these templates are sales, technologies, system. All the content presented in this PPT design is completely editable. Download it and make adjustments in color, background, font etc. as per your unique business setting.
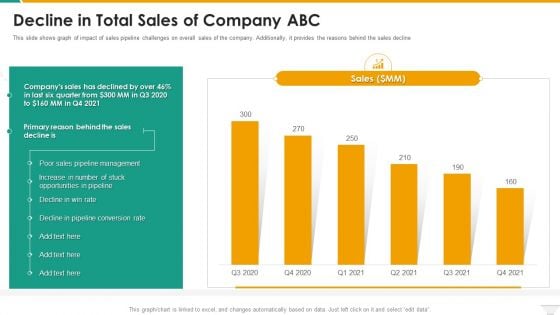
Decline In Total Sales Of Company Abc Slides PDF
This slide shows graph of impact of sales pipeline challenges on overall sales of the company. Additionally, it provides the reasons behind the sales decline Deliver and pitch your topic in the best possible manner with this Decline In Total Sales Of Company Abc Slides PDF. Use them to share invaluable insights on Management, Sales, Opportunities and impress your audience. This template can be altered and modified as per your expectations. So, grab it now.
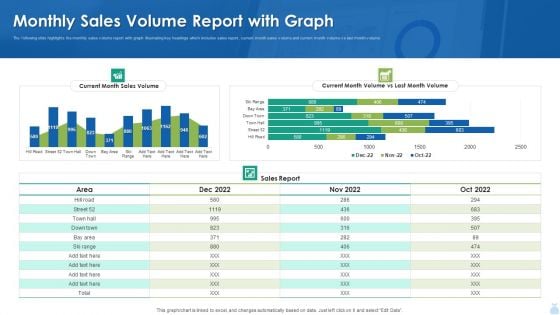
Monthly Sales Volume Report With Graph Demonstration PDF
The following slide highlights the monthly sales volume report with graph illustrating key headings which includes sales report, current month sales volume and current month volume vs last month volume. Showcasing this set of slides titled Monthly Sales Volume Report With Graph Demonstration PDF. The topics addressed in these templates are Monthly Sales, Volume Report, Graph. All the content presented in this PPT design is completely editable. Download it and make adjustments in color, background, font etc. as per your unique business setting.
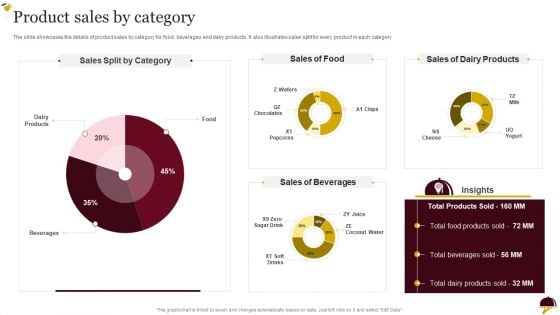
Food Company Overview Product Sales By Category Structure PDF
The slide showcases the details of product sales by category for food, beverages and dairy products. It also illustrates sales split for every product in each category.Deliver an awe inspiring pitch with this creative Food Company Overview Product Sales By Category Structure PDF bundle. Topics like Dairy Products, Sales Of Beverages, Sales Of Food can be discussed with this completely editable template. It is available for immediate download depending on the needs and requirements of the user.
Tracking Customer Sales Funnel Dashboard Improving Distribution Channel Mockup PDF
This slide covers information regarding the customer sales funnel tracking with sales volume and total market. Deliver and pitch your topic in the best possible manner with this Tracking Customer Sales Funnel Dashboard Improving Distribution Channel Mockup PDF. Use them to share invaluable insights on Tracking Customer, Sales Funnel, Sales Volume and impress your audience. This template can be altered and modified as per your expectations. So, grab it now.
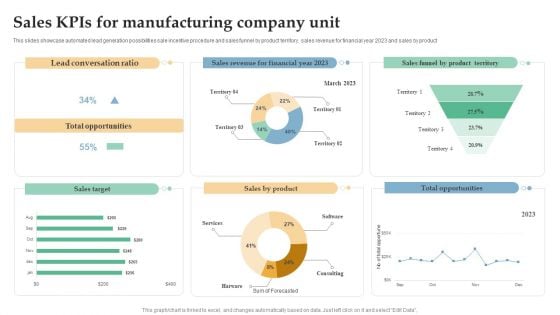
Sales Kpis For Manufacturing Company Unit Ppt Pictures Images PDF
This slides showcase automated lead generation possibilities sale incentive procedure and sales funnel by product territory, sales revenue for financial year 2023 and sales by product. Showcasing this set of slides titled Sales Kpis For Manufacturing Company Unit Ppt Pictures Images PDF. The topics addressed in these templates are Lead Conversation Ratio, Total Opportunities, Total Opportunities. All the content presented in this PPT design is completely editable. Download it and make adjustments in color, background, font etc. as per your unique business setting.
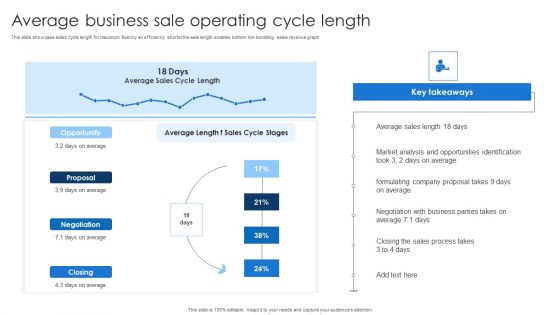
Average Business Sale Operating Cycle Length Ideas PDF
This slide showcase sales cycle length for maximum fluency an efficiency shorter the sale length enables bottom line boosting sales revenue graph.Showcasing this set of slides titled Average Business Sale Operating Cycle Length Ideas PDF. The topics addressed in these templates are Average Sales, Opportunities Identification, Negotiation Business. All the content presented in this PPT design is completely editable. Download it and make adjustments in color, background, font etc. as per your unique business setting.
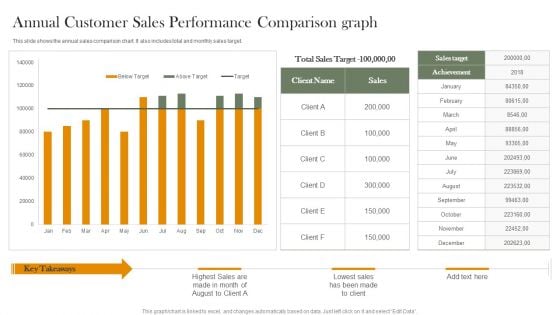
Annual Customer Sales Performance Comparison Graph Portrait PDF
This slide shows the annual sales comparison chart. It also includes total and monthly sales target. Pitch your topic with ease and precision using this Annual Customer Sales Performance Comparison Graph Portrait PDF. This layout presents information on Total Sales Target, Sales Target, Achievement. It is also available for immediate download and adjustment. So, changes can be made in the color, design, graphics or any other component to create a unique layout.
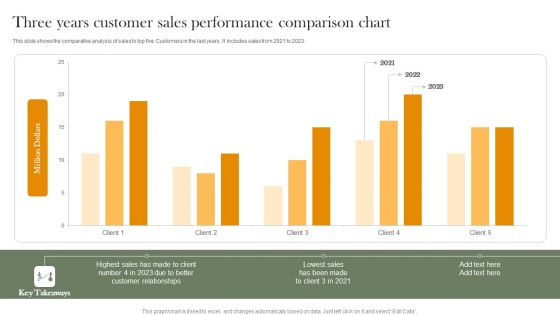
Three Years Customer Sales Performance Comparison Chart Professional PDF
This slide shows the comparative analysis of sales to top five Customers in the last years. It includes sales from 2021 to 2023. Pitch your topic with ease and precision using this Three Years Customer Sales Performance Comparison Chart Professional PDF. This layout presents information on Highest Sales, Customer Relationships, Lowest Sales. It is also available for immediate download and adjustment. So, changes can be made in the color, design, graphics or any other component to create a unique layout.


 Continue with Email

 Home
Home


