Transformation Plan
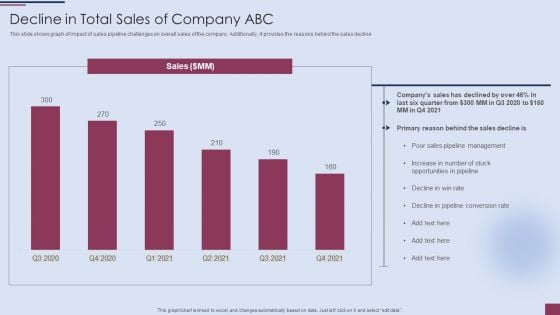
Sales Process Management To Boost Business Effectiveness Decline In Total Sales Of Company ABC Template PDF
This slide shows graph of impact of sales pipeline challenges on overall sales of the company. Additionally, it provides the reasons behind the sales decline.Deliver and pitch your topic in the best possible manner with this Sales Process Management To Boost Business Effectiveness Decline In Total Sales Of Company ABC Template PDF. Use them to share invaluable insights on Pipeline Management, Opportunities In Pipeline, Decline In Pipeline and impress your audience. This template can be altered and modified as per your expectations. So, grab it now.
Sales Process Management To Boost Business Effectiveness Sales Pipeline Tracking And Reporting Introduction PDF
This slide shows dashboard to track the performance of sales pipeline. Major points covered under this are number of opportunities, conversion rate, win rate, opportunity status etc. Deliver and pitch your topic in the best possible manner with this Sales Process Management To Boost Business Effectiveness Sales Pipeline Tracking And Reporting Introduction PDF. Use them to share invaluable insights on Return On Investment, Investment Review, Average Length and impress your audience. This template can be altered and modified as per your expectations. So, grab it now.
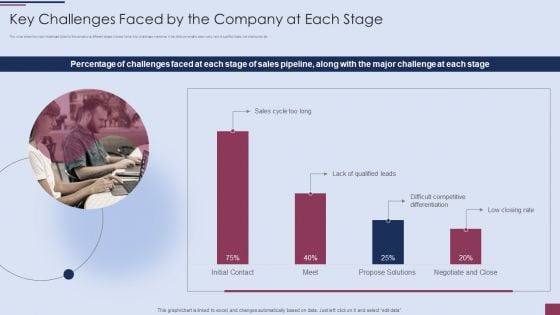
Sales Process Management To Boost Key Challenges Faced By The Company At Each Stage Graphics PDF
This slide shows the major challenges faced by the company at different stages of sales funnel. Key challenges mentioned in the slide are lengthy sales cycle, lack of qualified leads, low closing rate etc.Deliver and pitch your topic in the best possible manner with this Sales Process Management To Boost Key Challenges Faced By The Company At Each Stage Graphics PDF. Use them to share invaluable insights on Qualified Leads, Competitive Differentiation, Negotiate And Close and impress your audience. This template can be altered and modified as per your expectations. So, grab it now.
Sustainable Energy Dashboard For Our Green Energy Projects Ppt PowerPoint Presentation Show Icons PDF
This slide depicts the dashboard for our green energy projects by covering details of total projects, projects by sector, energy sources, the contribution of green energy projects in households, industry, etc.Deliver and pitch your topic in the best possible manner with this Sustainable Energy Dashboard For Our Green Energy Projects Ppt PowerPoint Presentation Show Icons PDF. Use them to share invaluable insights on Production Coasts, Total Sales, Under Construction and impress your audience. This template can be altered and modified as per your expectations. So, grab it now.

Personal Care Company Profile Annual Revenue 2018 To 2022 Graphics PDF
This slide highlights the annual revenue of our company in last five years with CAGR from 2018 to 2022 which shows increasing trend due to improved product sales. Deliver and pitch your topic in the best possible manner with this Personal Care Company Profile Annual Revenue 2018 To 2022 Graphics PDF. Use them to share invaluable insights on Annual Revenue, Key Insights, Annual Revenue, 2018 To 2022 and impress your audience. This template can be altered and modified as per your expectations. So, grab it now.
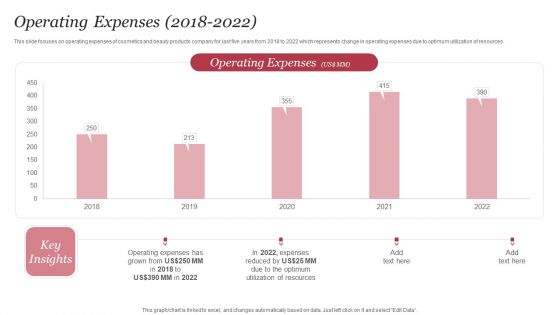
Personal Care Company Profile Operating Expenses 2018 To 2022 Guidelines PDF
This slide focuses on operating expenses of cosmetics and beauty products company for last five years from 2018 to 2022 which represents change in operating expenses due to optimum utilization of resources. Deliver and pitch your topic in the best possible manner with this Personal Care Company Profile Operating Expenses 2018 To 2022 Guidelines PDF. Use them to share invaluable insights on Operating Expenses, 2018 To 2022, Expenses Reduced and impress your audience. This template can be altered and modified as per your expectations. So, grab it now.
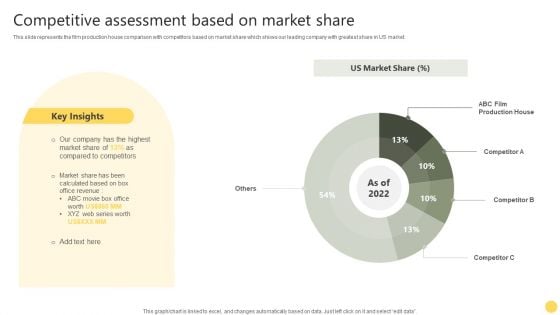
Film Making Firm Profile Competitive Assessment Based On Market Share Ppt PowerPoint Presentation Gallery Files PDF
This slide represents the film production house comparison with competitors based on market share which shows our leading company with greatest share in US market. Deliver and pitch your topic in the best possible manner with this Film Making Firm Profile Competitive Assessment Based On Market Share Ppt PowerPoint Presentation Gallery Files PDF. Use them to share invaluable insights on Key Insights, US Market Share, Market Share and impress your audience. This template can be altered and modified as per your expectations. So, grab it now.
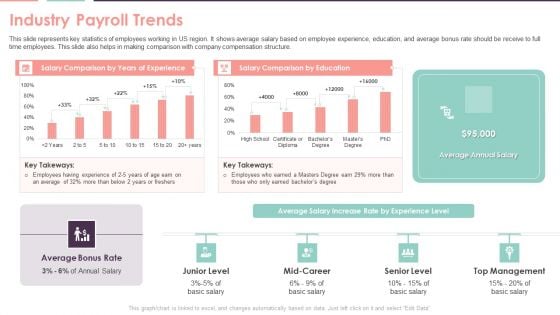
Compensation Survey Sheet Industry Payroll Trends Summary PDF
This slide represents key statistics of employees working in US region. It shows average salary based on employee experience, education, and average bonus rate should be receive to full time employees. This slide also helps in making comparison with company compensation structure. Deliver and pitch your topic in the best possible manner with this Compensation Survey Sheet Industry Payroll Trends Summary PDF. Use them to share invaluable insights on Average Bonus Rate, Top Management, Average Annual Salary and impress your audience. This template can be altered and modified as per your expectations. So, grab it now.
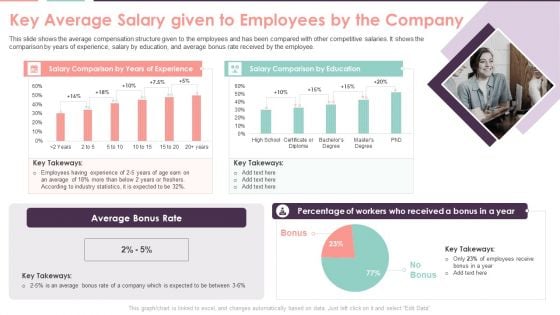
Compensation Survey Sheet Key Average Salary Given To Employees By The Company Information PDF
This slide shows the average compensation structure given to the employees and has been compared with other competitive salaries. It shows the comparison by years of experience, salary by education, and average bonus rate received by the employee. Deliver and pitch your topic in the best possible manner with this Compensation Survey Sheet Key Average Salary Given To Employees By The Company Information PDF. Use them to share invaluable insights on Average Bonus, Industry Statistics and impress your audience. This template can be altered and modified as per your expectations. So, grab it now.
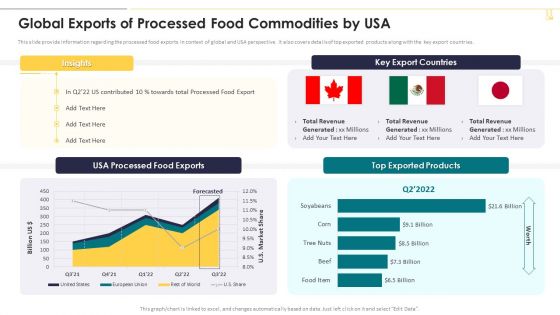
Global Exports Of Processed Food Commodities By Usa Graphics PDF
This slide provide information regarding the processed food exports in context of global and USA perspective. It also covers details of top exported products along with the key export countries. Deliver and pitch your topic in the best possible manner with this Global Exports Of Processed Food Commodities By Usa Graphics PDF. Use them to share invaluable insights on Top Exported Products, Key Export Countries, Total Revenue and impress your audience. This template can be altered and modified as per your expectations. So, grab it now.
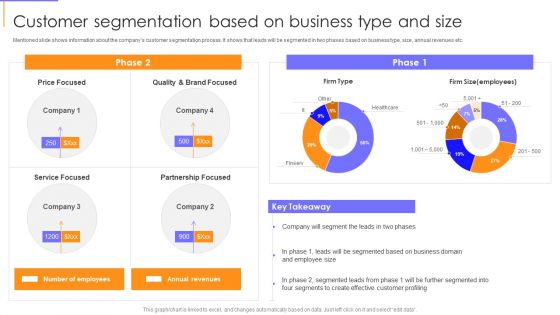
Guide To Client Success Customer Segmentation Based On Business Type And Size Guidelines PDF
Mentioned slide shows information about the companys customer segmentation process. It shows that leads will be segmented in two phases based on business type, size, annual revenues etc. Deliver and pitch your topic in the best possible manner with this Guide To Client Success Customer Segmentation Based On Business Type And Size Guidelines PDF. Use them to share invaluable insights on Quality, Service Focused, Annual Revenues and impress your audience. This template can be altered and modified as per your expectations. So, grab it now.
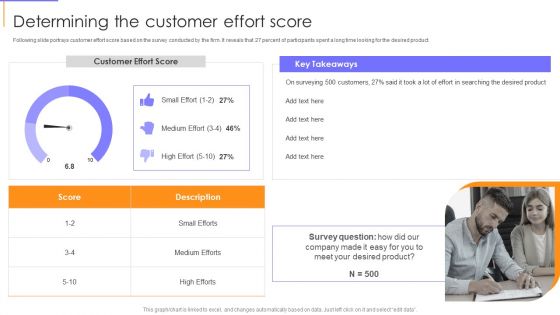
Guide To Client Success Determining The Customer Effort Score Microsoft PDF
Following slide portrays customer effort score based on the survey conducted by the firm. It reveals that 27 percent of participants spent a long time looking for the desired product. Deliver and pitch your topic in the best possible manner with this Guide To Client Success Determining The Customer Effort Score Microsoft PDF. Use them to share invaluable insights on Survey Question, Desired Product, Customer Effort Score and impress your audience. This template can be altered and modified as per your expectations. So, grab it now.
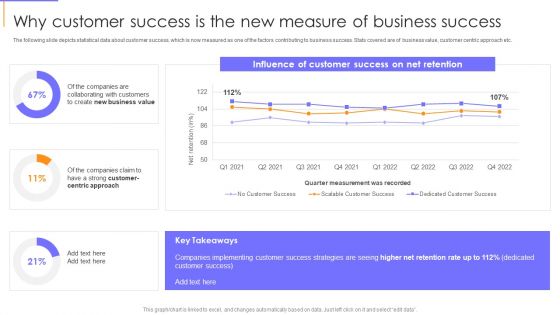
Guide To Client Success Why Customer Success Is The New Measure Of Business Success Slides PDF
The following slide depicts statistical data about customer success, which is now measured as one of the factors contributing to business success. Stats covered are of business value, customer centric approach etc. Deliver and pitch your topic in the best possible manner with this Guide To Client Success Why Customer Success Is The New Measure Of Business Success Slides PDF. Use them to share invaluable insights on Customers, Business Value, Net Retention Rate and impress your audience. This template can be altered and modified as per your expectations. So, grab it now.
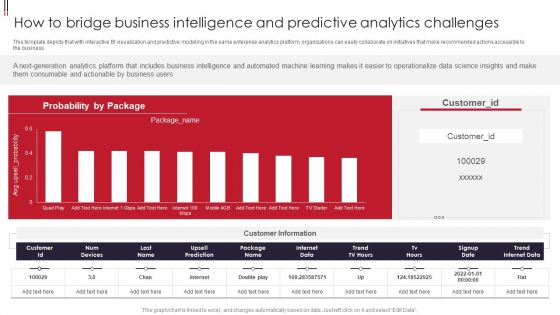
Information Visualizations Playbook How To Bridge Business Intelligence And Predictive Analytics Challenges Themes PDF
This template depicts that with interactive BI visualization and predictive modeling in the same enterprise analytics platform, organizations can easily collaborate on initiatives that make recommended actions accessible to the business. Deliver and pitch your topic in the best possible manner with this Information Visualizations Playbook How To Bridge Business Intelligence And Predictive Analytics Challenges Themes PDF. Use them to share invaluable insights on Business Users, Operationalize Data Science, Num Devices and impress your audience. This template can be altered and modified as per your expectations. So, grab it now.
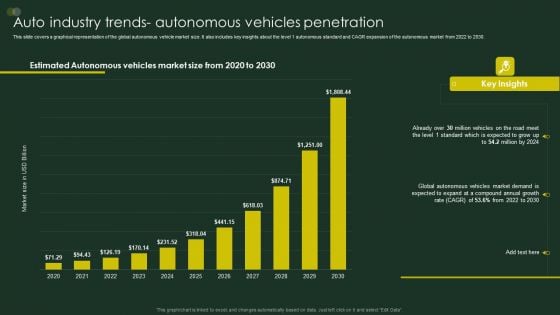
Global Automobile Sector Overview Auto Industry Trends Autonomous Vehicles Penetration Structure PDF
This slide covers a graphical representation of the global autonomous vehicle market size. It also includes key insights about the level 1 autonomous standard and CAGR expansion of the autonomous market from 2022 to 2030. Deliver and pitch your topic in the best possible manner with this Global Automobile Sector Overview Auto Industry Trends Autonomous Vehicles Penetration Structure PDF. Use them to share invaluable insights on Estimated Autonomous, Vehicles Market, Global Autonomes and impress your audience. This template can be altered and modified as per your expectations. So, grab it now.
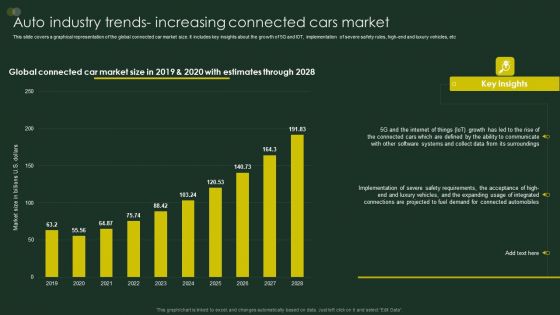
Global Automobile Sector Overview Auto Industry Trends Increasing Connected Cars Market Professional PDF
This slide covers a graphical representation of the global connected car market size. It includes key insights about the growth of 5G and IOT, implementation of severe safety rules, high-end and luxury vehicles, etc.Deliver and pitch your topic in the best possible manner with this Global Automobile Sector Overview Auto Industry Trends Increasing Connected Cars Market Professional PDF. Use them to share invaluable insights on Global Connected, Estimates Through, Demand Connected and impress your audience. This template can be altered and modified as per your expectations. So, grab it now.
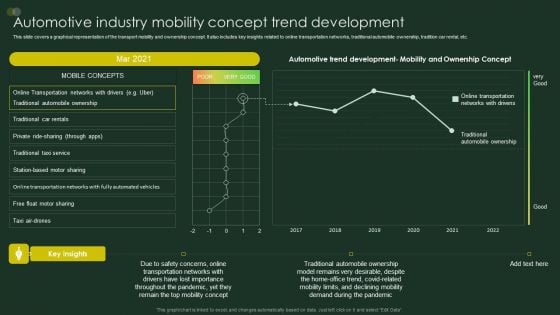
Global Automobile Sector Overview Automotive Industry Mobility Concept Trend Development Elements PDF
This slide covers a graphical representation of the transport mobility and ownership concept. It also includes key insights related to online transportation networks, traditional automobile ownership, tradition car rental, etc. Deliver and pitch your topic in the best possible manner with this Global Automobile Sector Overview Automotive Industry Mobility Concept Trend Development Elements PDF. Use them to share invaluable insights on Transportation Networks, Throughout Pandemic, Traditional Automobile and impress your audience. This template can be altered and modified as per your expectations. So, grab it now.
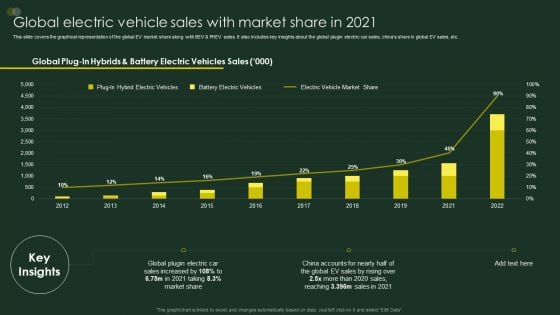
Global Automobile Sector Overview Global Electric Vehicle Sales With Market Share In 2021 Designs PDF
This slide covers the graphical representation of the global EV market share along with BEV and PHEV sales. It also includes key insights about the global plugin electric car sales, chinas share in global EV sales, etc. Deliver and pitch your topic in the best possible manner with this Global Automobile Sector Overview Global Electric Vehicle Sales With Market Share In 2021 Designs PDF. Use them to share invaluable insights on Electric Vehicles, Battery Electric, Electric Vehicle and impress your audience. This template can be altered and modified as per your expectations. So, grab it now.
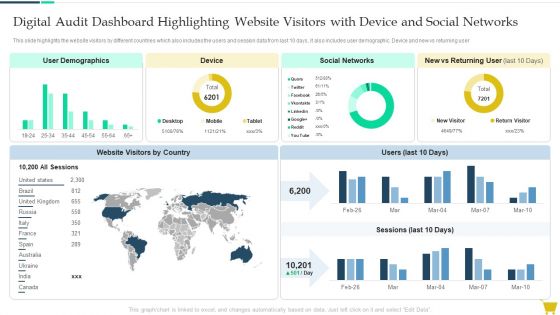
Digital Audit Dashboard Highlighting Website Visitors With Device And Social Networks Guidelines PDF
This slide highlights the website visitors by different countries which also includes the users and session data from last 10 days, it also includes user demographic. Device and new vs returning user. Deliver and pitch your topic in the best possible manner with this Digital Audit Dashboard Highlighting Website Visitors With Device And Social Networks Guidelines PDF. Use them to share invaluable insights on Device, Social Networks, User Demographics and impress your audience. This template can be altered and modified as per your expectations. So, grab it now.
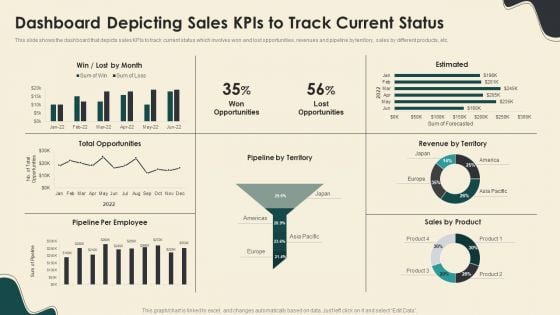
Dashboard Depicting Sales Kpis To Track Current Status Structure PDF
This slide shows the dashboard that depicts sales KPIs to track current status which involves won and lost opportunities, revenues and pipeline by territory, sales by different products, etc. Deliver and pitch your topic in the best possible manner with this Dashboard Depicting Sales Kpis To Track Current Status Structure PDF. Use them to share invaluable insights on Total Opportunities, Revenue By Territory, Sales By Product and impress your audience. This template can be altered and modified as per your expectations. So, grab it now.
Customer Relationship Management Software CRM Dashboard For Tracking Sales Pipeline Background PDF
This slide covers the CRM KPI dashboard for monitoring lead status in the sales funnel. It includes metrics such as open pipeline value, open pipeline by product package, pipeline value forecast, etc. Deliver and pitch your topic in the best possible manner with this Customer Relationship Management Software CRM Dashboard For Tracking Sales Pipeline Background PDF. Use them to share invaluable insights on Product Package, Pipeline Value, Value Forecast and impress your audience. This template can be altered and modified as per your expectations. So, grab it now.
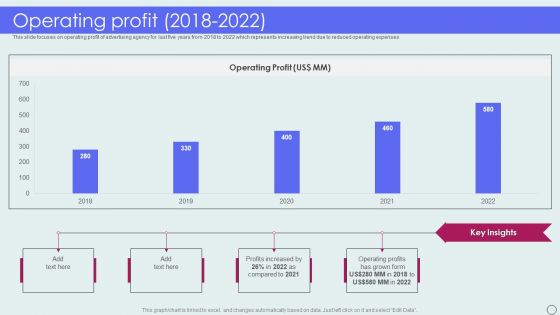
Advertising Solutions Company Details Operating Profit 2018 To 2022 Ppt PowerPoint Presentation Gallery Themes PDF
This slide focuses on operating profit of advertising agency for last five years from 2018 to 2022 which represents increasing trend due to reduced operating expenses. Deliver and pitch your topic in the best possible manner with this Advertising Solutions Company Details Operating Profit 2018 To 2022 Ppt PowerPoint Presentation Gallery Themes PDF. Use them to share invaluable insights on Operating Profit, 2018 To 2022, Profits Increased and impress your audience. This template can be altered and modified as per your expectations. So, grab it now.
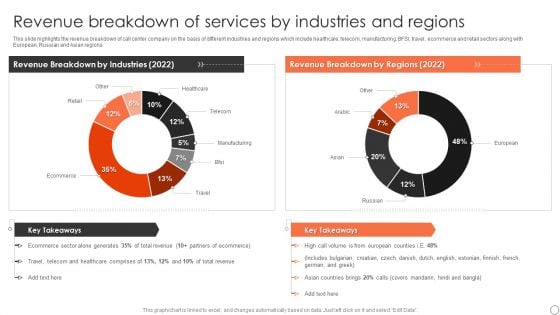
Customer Support Services Company Profile Revenue Breakdown Of Services By Industries Elements PDF
This slide highlights the revenue breakdown of call center company on the basis of different industries and regions which include healthcare, telecom, manufacturing, BFSI, travel, ecommerce and retail sectors along with European, Russian and Asian regions. Deliver and pitch your topic in the best possible manner with this Customer Support Services Company Profile Revenue Breakdown Of Services By Industries Elements PDF. Use them to share invaluable insights on Revenue Breakdown Industries, Revenue Breakdown Regions, Healthcare and impress your audience. This template can be altered and modified as per your expectations. So, grab it now.
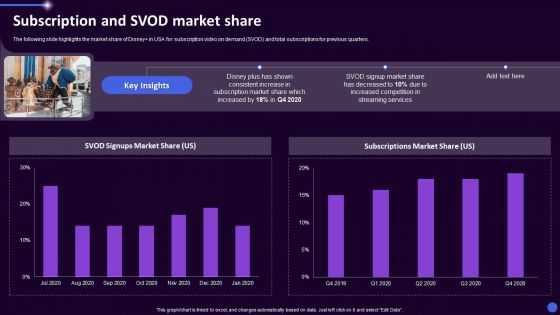
Disney Plus OTT Platform Company Summary Subscription And Svod Market Share Portrait PDF
The following slide highlights the market share of Disney in USA for subscription video on demand SVOD and total subscriptions for previous quarters. Deliver and pitch your topic in the best possible manner with this Disney Plus OTT Platform Company Summary Subscription And Svod Market Share Portrait PDF. Use them to share invaluable insights on SVOD Signups Market Share, Subscriptions Market Share, 2019 To 2022 and impress your audience. This template can be altered and modified as per your expectations. So, grab it now.
Evaluating Hedge Funds For Greater ROI Hedge Fund Performance Over Time Icons PDF
This slide highlights the hedge fund performance which includes the HFRI equity hedge, event driven hedge, relative value hedge, HFRI macro and US crop fixed income with return rate. Deliver and pitch your topic in the best possible manner with this Evaluating Hedge Funds For Greater ROI Hedge Fund Performance Over Time Icons PDF. Use them to share invaluable insights on Different Funds Performance, Hedge Funds, Goals, Organization and impress your audience. This template can be altered and modified as per your expectations. So, grab it now.
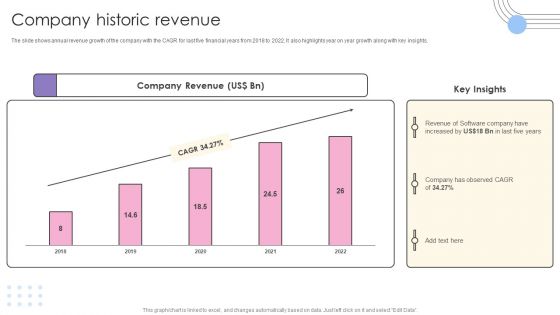
Software Products And Solutions Firm Details Company Historic Revenue Portrait PDF
The slide shows annual revenue growth of the company with the CAGR for last five financial years from 2018 to 2022. It also highlights year on year growth along with key insights. Deliver and pitch your topic in the best possible manner with this Software Products And Solutions Firm Details Company Historic Revenue Portrait PDF. Use them to share invaluable insights on Company Revenue, Observed CAGR, 2018 To 2022 and impress your audience. This template can be altered and modified as per your expectations. So, grab it now.
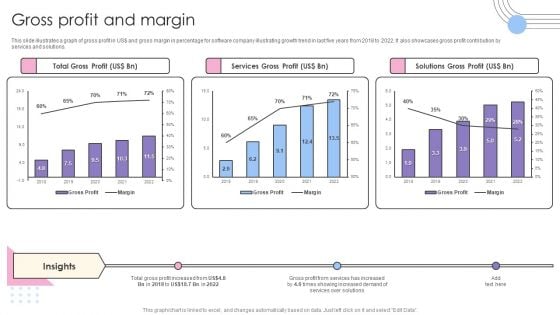
Software Products And Solutions Firm Details Gross Profit And Margin Pictures PDF
This slide illustrates a graph of gross profit in US dollar and gross margin in percentage for software company illustrating growth trend in last five years from 2018 to 2022. It also showcases gross profit contribution by services and solutions. Deliver and pitch your topic in the best possible manner with this Software Products And Solutions Firm Details Gross Profit And Margin Pictures PDF. Use them to share invaluable insights on Total Gross Profit, Services Gross Profit, Solutions Gross Profit and impress your audience. This template can be altered and modified as per your expectations. So, grab it now.
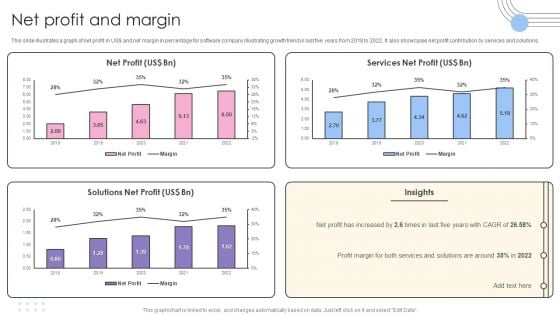
Software Products And Solutions Firm Details Net Profit And Margin Information PDF
This slide illustrates a graph of net profit in US dollar and net margin in percentage for software company illustrating growth trend in last five years from 2018 to 2022. It also showcases net profit contribution by services and solutions. Deliver and pitch your topic in the best possible manner with this Software Products And Solutions Firm Details Net Profit And Margin Information PDF. Use them to share invaluable insights on Net Profit, Services Net Profit, Solutions Net Profit and impress your audience. This template can be altered and modified as per your expectations. So, grab it now.
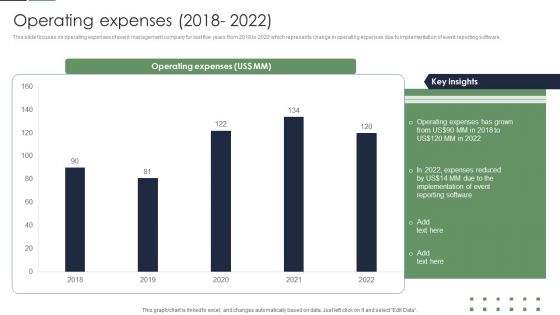
Event Planner Company Profile Operating Expenses 2018 To 2022 Professional PDF
This slide focuses on operating expenses of event management company for last five years from 2018 to 2022 which represents change in operating expenses due to implementation of event reporting software. Deliver and pitch your topic in the best possible manner with this Event Planner Company Profile Operating Expenses 2018 To 2022 Professional PDF. Use them to share invaluable insights on Operating Expenses, Implementation, Expenses Reduced and impress your audience. This template can be altered and modified as per your expectations. So, grab it now.
CRM System Implementation Stages CRM Dashboard For Tracking Sales Pipeline Background PDF
This slide covers the CRM KPI dashboard for monitoring lead status in the sales funnel. It includes metrics such as open pipeline value, open pipeline by product package, pipeline value forecast, etc. Deliver and pitch your topic in the best possible manner with this CRM System Implementation Stages CRM Dashboard For Tracking Sales Pipeline Background PDF. Use them to share invaluable insights on Pipeline Value, Value Forecast, Sales Opportunities and impress your audience. This template can be altered and modified as per your expectations. So, grab it now.
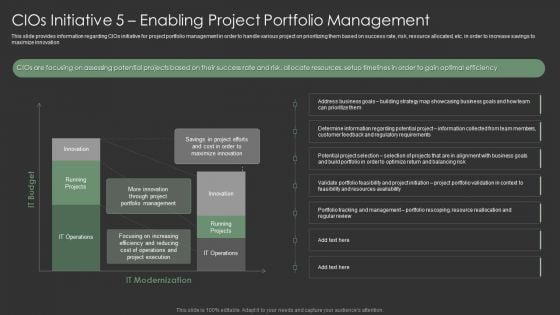
Cios Initiative 5 Enabling Project Portfolio Management Microsoft PDF
This slide provides information regarding CIOs initiative for project portfolio management in order to handle various project on prioritizing them based on success rate, risk, resource allocated, etc. in order to increase savings to maximize innovation. Deliver and pitch your topic in the best possible manner with this Cios Initiative 5 Enabling Project Portfolio Management Microsoft PDF. Use them to share invaluable insights on Maximize Innovation, Portfolio Tracking, Resources and impress your audience. This template can be altered and modified as per your expectations. So, grab it now.
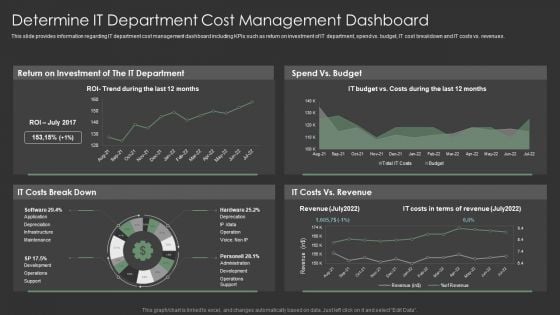
IT Spend Management Priorities By Cios Determine IT Department Cost Management Dashboard Pictures PDF
This slide provides information regarding IT department cost management dashboard including KPIs such as return on investment of IT department, spend vs. budget, IT cost breakdown and IT costs vs. revenues. Deliver and pitch your topic in the best possible manner with this IT Spend Management Priorities By Cios Determine IT Department Cost Management Dashboard Pictures PDF. Use them to share invaluable insights on Revenue, Costs, Budget and impress your audience. This template can be altered and modified as per your expectations. So, grab it now.
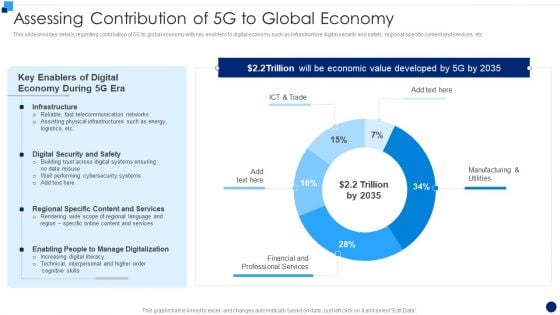
Developing 5G Wireless Cellular Network Assessing Contribution Of 5G To Global Economy Rules PDF
This slide provides details regarding contribution of 5G to global economy with key enablers to digital economy such as infrastructure digital security and safety, regional specific content and services, etc. Deliver and pitch your topic in the best possible manner with this Developing 5G Wireless Cellular Network Assessing Contribution Of 5G To Global Economy Rules PDF. Use them to share invaluable insights on Telecommunication Networks, Cybersecurity Systems, Content And Services and impress your audience. This template can be altered and modified as per your expectations. So, grab it now.
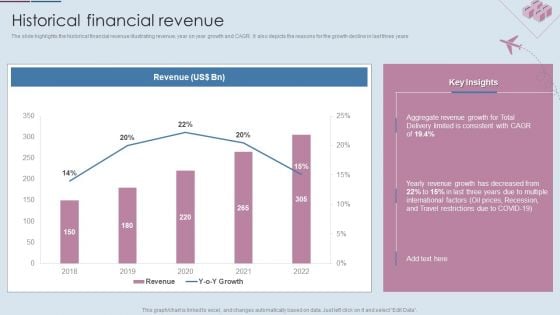
Logistics Shipment Company Profile Historical Financial Revenue Ppt Gallery Templates PDF
The slide highlights the historical financial revenue illustrating revenue, year on year growth and CAGR. It also depicts the reasons for the growth decline in last three years. Deliver and pitch your topic in the best possible manner with this Logistics Shipment Company Profile Historical Financial Revenue Ppt Gallery Templates PDF. Use them to share invaluable insights on Revenue, 2018 To 2022, Aggregate Revenue Growth and impress your audience. This template can be altered and modified as per your expectations. So, grab it now.

Logistics Shipment Company Profile Net Profit And Margin Ppt Show Model PDF
The slide showcases the net profit and margin for transport company. It depicts change in net profit and profit margin for last five financial years form 2018 to 2022. Deliver and pitch your topic in the best possible manner with this Logistics Shipment Company Profile Net Profit And Margin Ppt Show Model PDF. Use them to share invaluable insights on Net Profit, Profit Margin, 2018 To 2022 and impress your audience. This template can be altered and modified as per your expectations. So, grab it now.
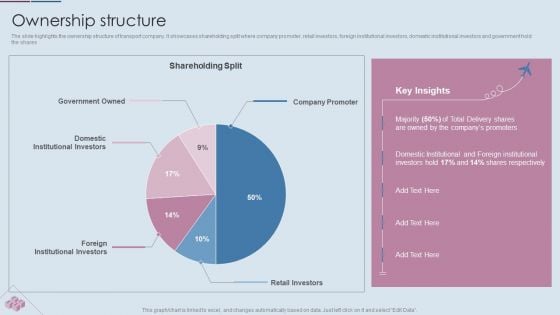
Logistics Shipment Company Profile Ownership Structure Ppt Pictures Show PDF
The slide highlights the ownership structure of transport company. It showcases shareholding split where company promoter, retail investors, foreign institutional investors, domestic institutional investors and government hold the shares. Deliver and pitch your topic in the best possible manner with this Logistics Shipment Company Profile Ownership Structure Ppt Pictures Show PDF. Use them to share invaluable insights on Shareholding Split, Company Promoter, Government Owned, Retail Investors and impress your audience. This template can be altered and modified as per your expectations. So, grab it now.
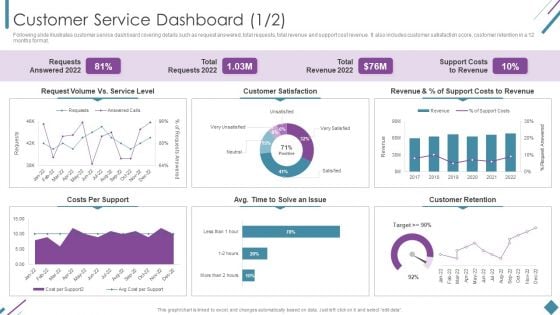
Metrics To Measure Business Performance Customer Service Dashboard Sample PDF
Following slide illustrates customer service dashboard covering details such as request answered, total requests, total revenue and support cost revenue. It also includes customer satisfaction score, customer retention in a 12 months format. Deliver and pitch your topic in the best possible manner with this Metrics To Measure Business Performance Customer Service Dashboard Sample PDF. Use them to share invaluable insights on Requests Answered 2022, Total Requests 2022, Total Revenue 2022 and impress your audience. This template can be altered and modified as per your expectations. So, grab it now.
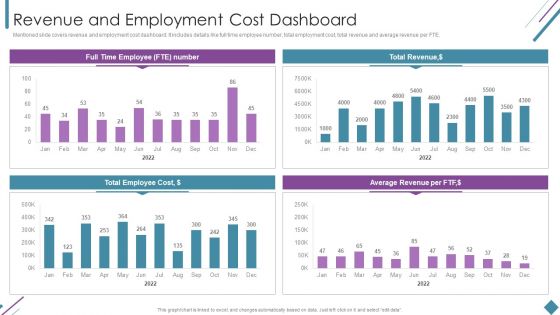
Metrics To Measure Business Performance Revenue And Employment Cost Dashboard Clipart PDF
Mentioned slide covers revenue and employment cost dashboard. It includes details like full time employee number, total employment cost, total revenue and average revenue per FTE. Deliver and pitch your topic in the best possible manner with this Metrics To Measure Business Performance Revenue And Employment Cost Dashboard Clipart PDF. Use them to share invaluable insights on Total Revenue, Average Revenue Per, Total Employee Cost and impress your audience. This template can be altered and modified as per your expectations. So, grab it now.
Box Office Collection In Last Five Years Film Media Company Profile Ppt PowerPoint Presentation Icon Show PDF
This slide represents the box office collection of our film production house in last five years from 2018 to 2022 which shows maximum collection in 2021.Deliver and pitch your topic in the best possible manner with this Box Office Collection In Last Five Years Film Media Company Profile Ppt PowerPoint Presentation Icon Show PDF. Use them to share invaluable insights on Collection Increased, Released, Office Collection and impress your audience. This template can be altered and modified as per your expectations. So, grab it now.
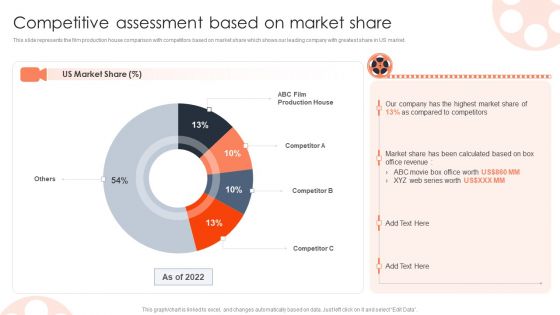
Competitive Assessment Based On Market Share Film Media Company Profile Ppt PowerPoint Presentation File Design Inspiration PDF
This slide represents the film production house comparison with competitors based on market share which shows our leading company with greatest share in US market.Deliver and pitch your topic in the best possible manner with this Competitive Assessment Based On Market Share Film Media Company Profile Ppt PowerPoint Presentation File Design Inspiration PDF. Use them to share invaluable insights on Compared Competitors, Calculated Based, Office Revenue and impress your audience. This template can be altered and modified as per your expectations. So, grab it now.
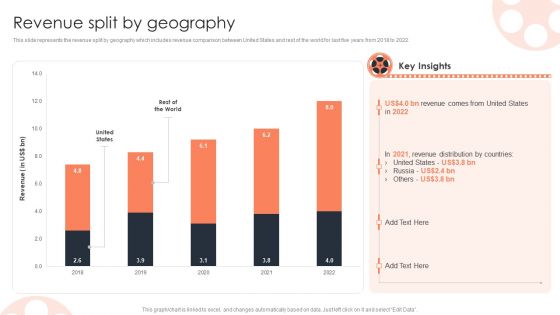
Revenue Split By Geography Film Media Company Profile Ppt PowerPoint Presentation Infographics Infographics PDF
This slide represents the financial highlights of our film production house which includes revenue and net profits for last five years from 2018 to 2022 that shows highest revenue in 2022.Deliver and pitch your topic in the best possible manner with this Revenue Split By Geography Film Media Company Profile Ppt PowerPoint Presentation Infographics Infographics PDF. Use them to share invaluable insights on United States, Revenue Distribution, Key Insights and impress your audience. This template can be altered and modified as per your expectations. So, grab it now.
Transportation Company Profile CSR Support For Sustainable Growth Ppt PowerPoint Presentation Icon Outfit PDF
The slide highlights the CSR support for society and spend distribution for current year. It depicts poverty support, quench hunger, health support, quality education, clean drinking water, gender equality, others, clean energy, global warming and clean ocean drive.Deliver and pitch your topic in the best possible manner with this Transportation Company Profile CSR Support For Sustainable Growth Ppt PowerPoint Presentation Icon Outfit PDF. Use them to share invaluable insights on Quench Hunger, Quality Education, Health Support and impress your audience. This template can be altered and modified as per your expectations. So, grab it now.
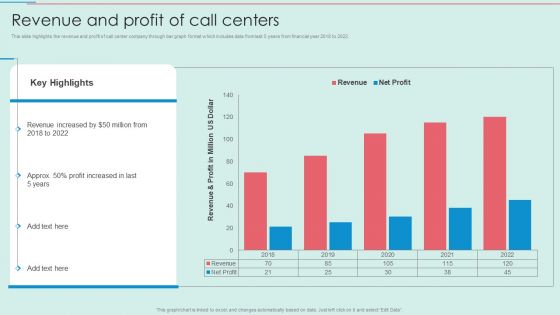
BPO Call Center Company Profile Revenue And Profit Of Call Centers Template PDF
This slide highlights the revenue and profit of call center company through bar graph format which includes data from last 5 years from financial year 2018 to 2022.Deliver and pitch your topic in the best possible manner with this BPO Call Center Company Profile Revenue And Profit Of Call Centers Template PDF. Use them to share invaluable insights on Revenue Increased, Profit Increased, Profit Million and impress your audience. This template can be altered and modified as per your expectations. So, grab it now.
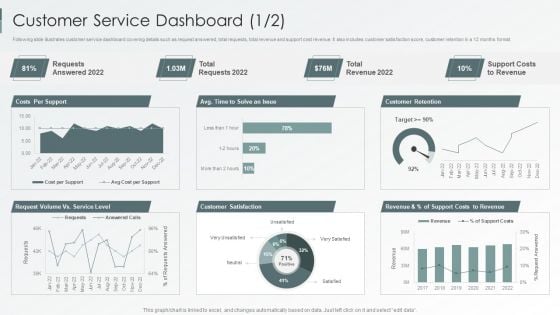
Enterprise Sustainability Performance Metrics Customer Service Dashboard Professional PDF
Following slide illustrates customer service dashboard covering details such as request answered, total requests, total revenue and support cost revenue. It also includes customer satisfaction score, customer retention in a 12 months format.Deliver and pitch your topic in the best possible manner with this Enterprise Sustainability Performance Metrics Customer Service Dashboard Professional PDF. Use them to share invaluable insights on Customer Satisfaction, Customer Retention, Support Revenue and impress your audience. This template can be altered and modified as per your expectations. So, grab it now.
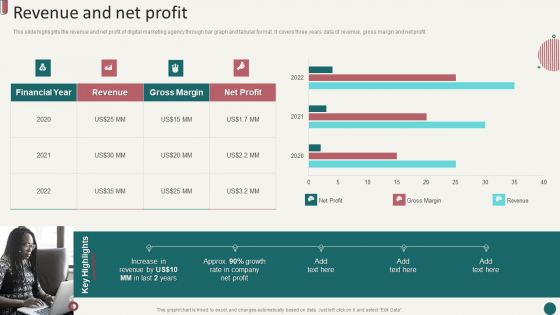
Social Media Marketing Company Profile Revenue And Net Profit Ppt Summary Gallery PDF
This slide highlights the revenue and net profit of digital marketing agency through bar graph and tabular format. It covers three years data of revenue, gross margin and net profit. Deliver and pitch your topic in the best possible manner with this Social Media Marketing Company Profile Revenue And Net Profit Ppt Summary Gallery PDF. Use them to share invaluable insights on Financial Year, Revenue, Gross Margin and impress your audience. This template can be altered and modified as per your expectations. So, grab it now.
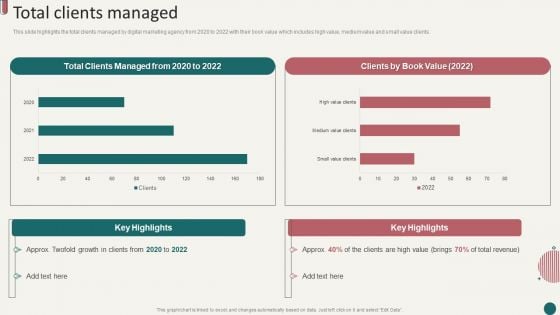
Social Media Marketing Company Profile Total Clients Managed Ppt Layouts Show PDF
This slide highlights the total clients managed by digital marketing agency from 2020 to 2022 with their book value which includes high value, medium value and small value clients. Deliver and pitch your topic in the best possible manner with this Social Media Marketing Company Profile Total Clients Managed Ppt Layouts Show PDF. Use them to share invaluable insights on Total Clients Managed, 2020 To 2022, Medium Value Clients and impress your audience. This template can be altered and modified as per your expectations. So, grab it now.
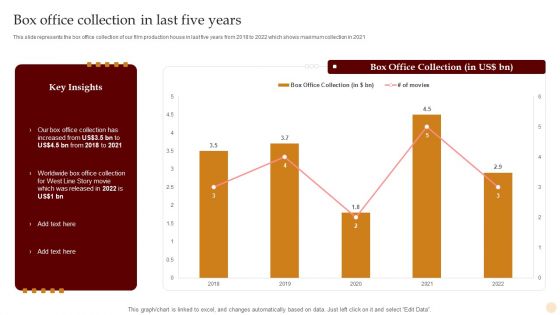
Motion Pictures Production Company Profile Box Office Collection In Last Five Years Diagrams PDF
This slide represents the box office collection of our film production house in last five years from 2018 to 2022 which shows maximum collection in 2021. Deliver and pitch your topic in the best possible manner with this Motion Pictures Production Company Profile Box Office Collection In Last Five Years Diagrams PDF. Use them to share invaluable insights on Box Office Collection, 2018 To 2022 and impress your audience. This template can be altered and modified as per your expectations. So, grab it now.
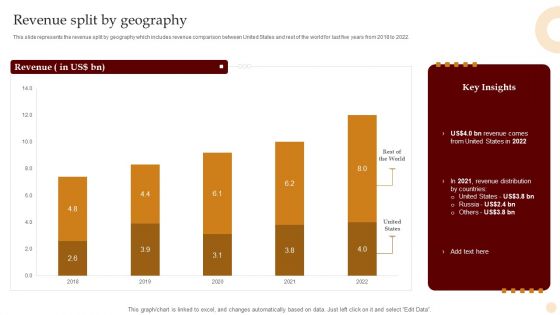
Motion Pictures Production Company Profile Revenue Split By Geography Brochure PDF
This slide represents the revenue split by geography which includes revenue comparison between United States and rest of the world for last five years from 2018 to 2022. Deliver and pitch your topic in the best possible manner with this Motion Pictures Production Company Profile Revenue Split By Geography Brochure PDF. Use them to share invaluable insights on Rest World, United States, 2018 To 2022 and impress your audience. This template can be altered and modified as per your expectations. So, grab it now.
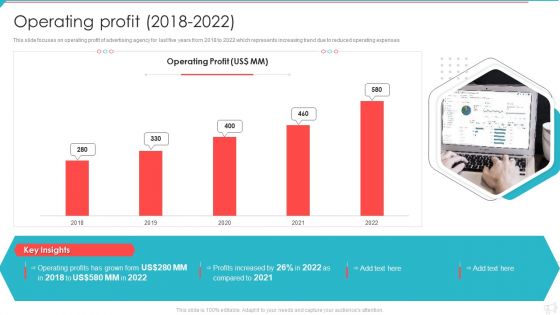
Advertisement And Marketing Agency Company Profile Operating Profit 2018 To 2022 Infographics PDF
This slide focuses on operating profit of advertising agency for last five years from 2018 to 2022 which represents increasing trend due to reduced operating expenses. Deliver and pitch your topic in the best possible manner with this Advertisement And Marketing Agency Company Profile Operating Profit 2018 To 2022 Infographics PDF. Use them to share invaluable insights on Operating Profit, Profits Increased, 2018 To 2022 and impress your audience. This template can be altered and modified as per your expectations. So, grab it now.
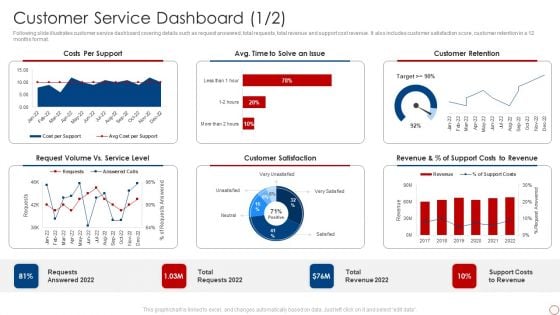
Kpis For Evaluating Business Sustainability Customer Service Dashboard Designs PDF
Following slide illustrates customer service dashboard covering details such as request answered, total requests, total revenue and support cost revenue. It also includes customer satisfaction score, customer retention in a 12 months format. Deliver and pitch your topic in the best possible manner with this Kpis For Evaluating Business Sustainability Customer Service Dashboard Designs PDF. Use them to share invaluable insights on Costs Per Support, Customer Retention, Customer Satisfaction and impress your audience. This template can be altered and modified as per your expectations. So, grab it now.
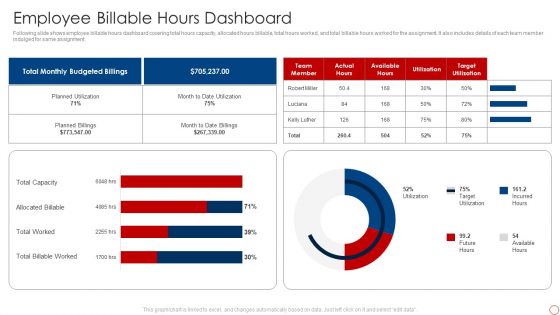
Kpis For Evaluating Business Sustainability Employee Billable Hours Dashboard Professional PDF
Following slide shows employee billable hours dashboard covering total hours capacity, allocated hours billable, total hours worked, and total billable hours worked for the assignment. It also includes details of each team member indulged for same assignment. Deliver and pitch your topic in the best possible manner with this Kpis For Evaluating Business Sustainability Employee Billable Hours Dashboard Professional PDF. Use them to share invaluable insights on Total Billable Worked, Total Worked, Allocated Billable, Total Capacity and impress your audience. This template can be altered and modified as per your expectations. So, grab it now.
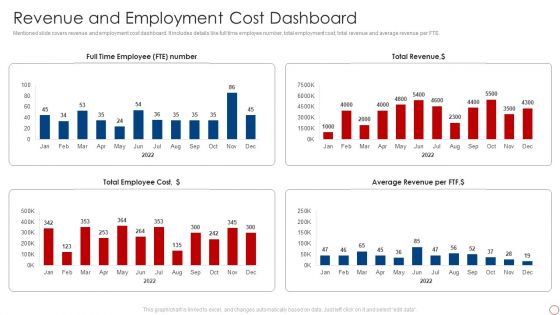
Kpis For Evaluating Business Sustainability Revenue And Employment Cost Themes PDF
Mentioned slide covers revenue and employment cost dashboard. It includes details like full time employee number, total employment cost, total revenue and average revenue per FTE. Deliver and pitch your topic in the best possible manner with this Kpis For Evaluating Business Sustainability Revenue And Employment Cost Themes PDF. Use them to share invaluable insights on Total Revenue, Average Revenue, Per FTF, Total Employee Cost and impress your audience. This template can be altered and modified as per your expectations. So, grab it now.
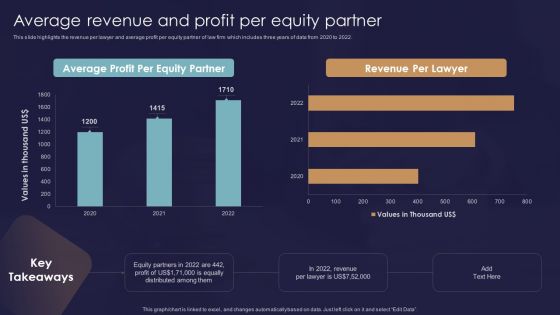
Legal And Law Assistance LLP Business Average Revenue And Profit Per Equity Brochure PDF
This slide highlights the revenue per lawyer and average profit per equity partner of law firm which includes three years of data from 2020 to 2022. Deliver and pitch your topic in the best possible manner with this Legal And Law Assistance LLP Business Average Revenue And Profit Per Equity Brochure PDF. Use them to share invaluable insights on Average Profit, Per Equity Partner, Revenue Per Lawyer and impress your audience. This template can be altered and modified as per your expectations. So, grab it now.
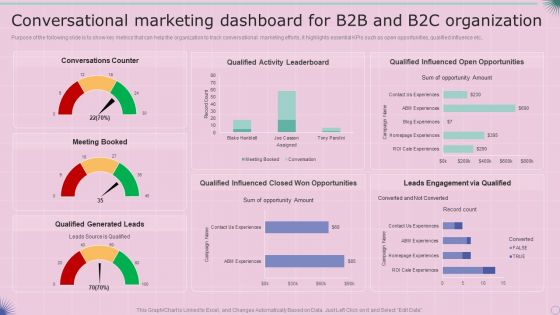
Conversational Marketing Dashboard For B2B And B2C Organization Sample PDF
Purpose of the following slide is to show key metrics that can help the organization to track conversational marketing efforts, it highlights essential KPIs such as open opportunities, qualified influence etc. Deliver and pitch your topic in the best possible manner with this Conversational Marketing Dashboard For B2B And B2C Organization Sample PDF. Use them to share invaluable insights on Conversational Marketing Dashboard, B2c Organization and impress your audience. This template can be altered and modified as per your expectations. So, grab it now.
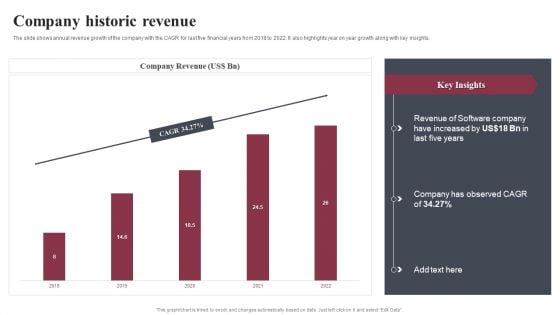
Business Software Development Company Profile Company Historic Revenue Graphics PDF
The slide shows annual revenue growth of the company with the CAGR for last five financial years from 2018 to 2022. It also highlights year on year growth along with key insights. Deliver and pitch your topic in the best possible manner with this Business Software Development Company Profile Company Historic Revenue Graphics PDF. Use them to share invaluable insights on Company Revenue, Observed CAGR, 2018 To 2022 and impress your audience. This template can be altered and modified as per your expectations. So, grab it now.
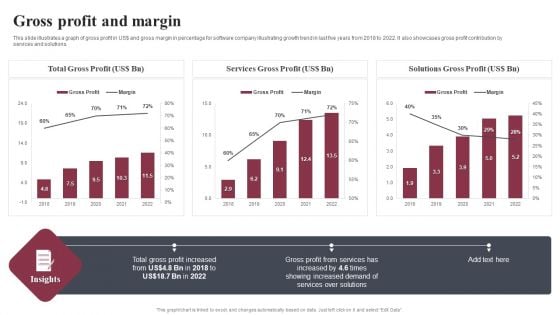
Business Software Development Company Profile Gross Profit And Margin Microsoft PDF
This slide illustrates a graph of gross profit in US dollar and gross margin in percentage for software company illustrating growth trend in last five years from 2018 to 2022. It also showcases gross profit contribution by services and solutions. Deliver and pitch your topic in the best possible manner with this Business Software Development Company Profile Gross Profit And Margin Microsoft PDF. Use them to share invaluable insights on Total Gross Profit, Services Gross Profit, Solutions Gross Profit and impress your audience. This template can be altered and modified as per your expectations. So, grab it now.
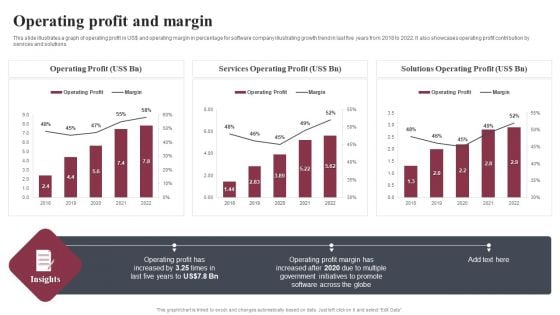
Business Software Development Company Profile Operating Profit And Margin Summary PDF
This slide illustrates a graph of operating profit in US dollar and operating margin in percentage for software company illustrating growth trend in last five years from 2018 to 2022. It also showcases operating profit contribution by services and solutions. Deliver and pitch your topic in the best possible manner with this Business Software Development Company Profile Operating Profit And Margin Summary PDF. Use them to share invaluable insights on Operating Profit, Services Operating Profit, Solutions Operating Profit and impress your audience. This template can be altered and modified as per your expectations. So, grab it now.
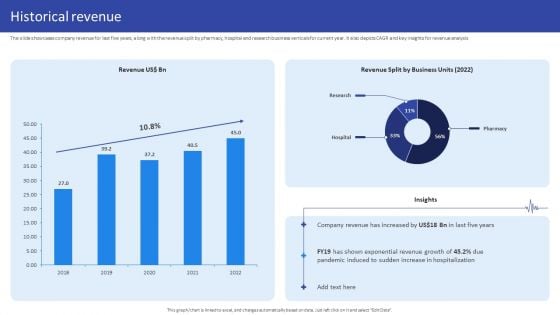
Hospital Medical Research Company Profile Historical Revenue Structure PDF
The slide showcases company revenue for last five years, along with the revenue split by pharmacy, hospital and research business verticals for current year. It also depicts CAGR and key insights for revenue analysis. Deliver and pitch your topic in the best possible manner with this Hospital Medical Research Company Profile Historical Revenue Structure PDF. Use them to share invaluable insights on Revenue US, Revenue Split, Business Units, 2018 To 2022 and impress your audience. This template can be altered and modified as per your expectations. So, grab it now.
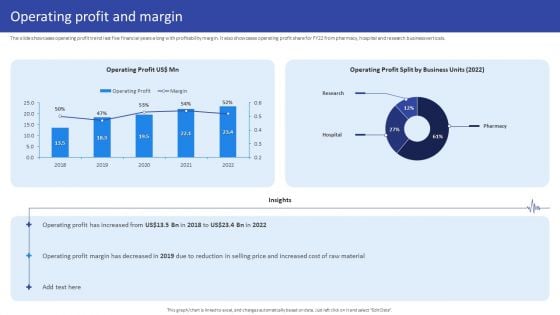
Hospital Medical Research Company Profile Operating Profit And Margin Sample PDF
The slide showcases operating profit trend last five financial years along with profitability margin. It also showcases operating profit share for FY22 from pharmacy, hospital and research business verticals. Deliver and pitch your topic in the best possible manner with this Hospital Medical Research Company Profile Operating Profit And Margin Sample PDF. Use them to share invaluable insights on Operating Profit, Operating Profit Split, Business Units 2022 and impress your audience. This template can be altered and modified as per your expectations. So, grab it now.
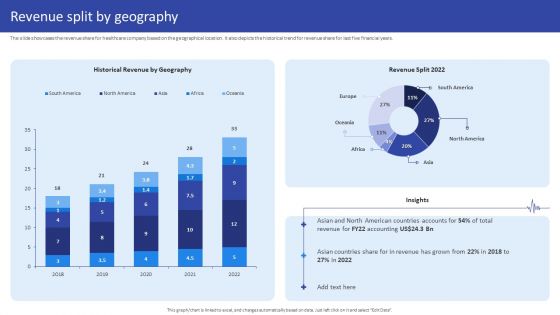
Hospital Medical Research Company Profile Revenue Split By Geography Portrait PDF
The slide showcases the revenue share for healthcare company based on the geographical location. It also depicts the historical trend for revenue share for last five financial years. Deliver and pitch your topic in the best possible manner with this Hospital Medical Research Company Profile Revenue Split By Geography Portrait PDF. Use them to share invaluable insights on Historical Revenue Geography, Revenue Split 2022, 2018 To 2022 and impress your audience. This template can be altered and modified as per your expectations. So, grab it now.


 Continue with Email

 Home
Home


