Transportation Dashboard
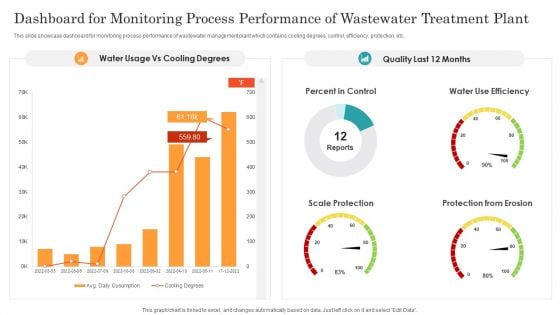
Dashboard For Monitoring Process Performance Of Wastewater Treatment Plant Ppt Infographic Template Demonstration PDF
This slide showcase dashboard for monitoring process performance of wastewater management plant which contains cooling degrees, control, efficiency, protection, etc. Showcasing this set of slides titled Dashboard For Monitoring Process Performance Of Wastewater Treatment Plant Ppt Infographic Template Demonstration PDF. The topics addressed in these templates are Percent Control, Water Use Efficiency, Scale Protection, Protection From Erosion. All the content presented in this PPT design is completely editable. Download it and make adjustments in color, background, font etc. as per your unique business setting.
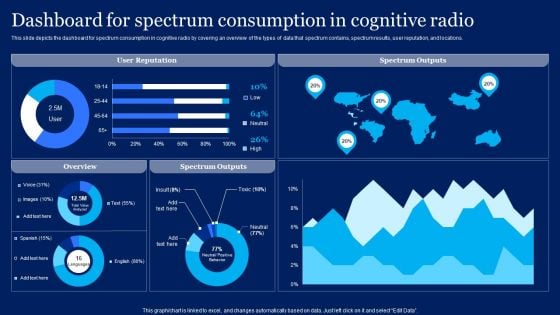
Cognitive Sensor Network Dashboard For Spectrum Consumption In Cognitive Radio Introduction PDF
This slide depicts the dashboard for spectrum consumption in cognitive radio by covering an overview of the types of data that spectrum contains, spectrum results, user reputation, and locations. Find a pre designed and impeccable Cognitive Sensor Network Dashboard For Spectrum Consumption In Cognitive Radio Introduction PDF. The templates can ace your presentation without additional effort. You can download these easy to edit presentation templates to make your presentation stand out from others. So, what are you waiting for Download the template from Slidegeeks today and give a unique touch to your presentation.
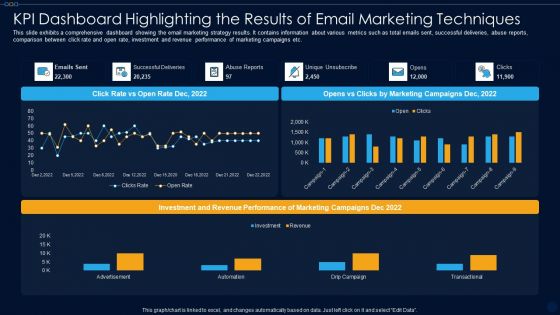
KPI Dashboard Highlighting The Results Of Email Marketing Techniques Ppt PowerPoint Presentation File Format PDF
This slide exhibits a comprehensive dashboard showing the email marketing strategy results. It contains information about various metrics such as total emails sent, successful deliveries, abuse reports, comparison between click rate and open rate, investment and revenue performance of marketing campaigns etc. Showcasing this set of slides titled kpi dashboard highlighting the results of email marketing techniques ppt powerpoint presentation file format pdf. The topics addressed in these templates are advertisement, automation, drip campaign, transactional. All the content presented in this PPT design is completely editable. Download it and make adjustments in color, background, font etc. as per your unique business setting.
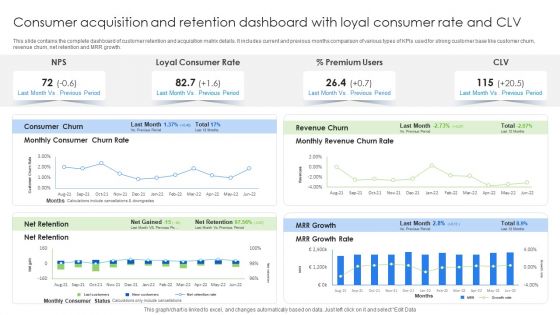
Consumer Acquisition And Retention Dashboard With Loyal Consumer Rate And CLV Brochure PDF
This slide contains the complete dashboard of customer retention and acquisition matrix details. It includes current and previous months comparison of various types of KPIs used for strong customer base like customer churn, revenue churn, net retention and MRR growth. Showcasing this set of slides titled Consumer Acquisition And Retention Dashboard With Loyal Consumer Rate And CLV Brochure PDF. The topics addressed in these templates are Consumer Churn, Revenue Churn, Premium Users. All the content presented in this PPT design is completely editable. Download it and make adjustments in color, background, font etc. as per your unique business setting.
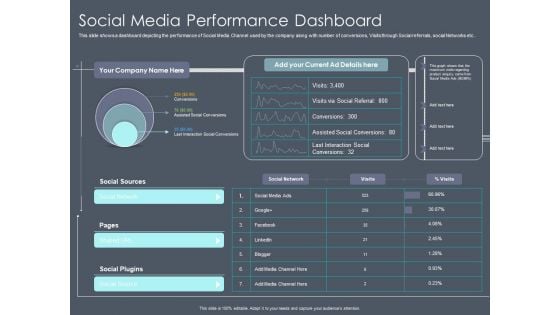
Private Equity Fund Pitch Deck To Raise Series C Funding Social Media Performance Dashboard Topics PDF
This slide shows a dashboard depicting the performance of Social Media Channel used by the company along with number of conversions, Visits through Social referrals, social Networks etc. This is a private equity fund pitch deck to raise series c funding social media performance dashboard topics pdf template with various stages. Focus and dispense information on three stages using this creative set, that comes with editable features. It contains large content boxes to add your information on topics like social sources, social plugins, social source, shared url. You can also showcase facts, figures, and other relevant content using this PPT layout. Grab it now.
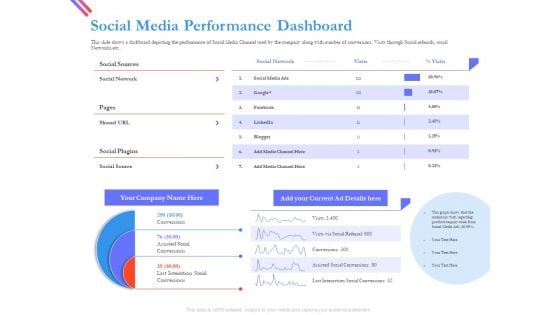
Pitch Deck For Fund Raising From Series C Funding Social Media Performance Dashboard Ideas PDF
This slide shows a dashboard depicting the performance of Social Media Channel used by the company along with number of conversions, Visits through Social referrals, social Networks etc. Presenting pitch deck for fund raising from series c funding social media performance dashboard ideas pdf to provide visual cues and insights. Share and navigate important information on three stages that need your due attention. This template can be used to pitch topics like social sources, social media. In addtion, this PPT design contains high resolution images, graphics, etc, that are easily editable and available for immediate download.
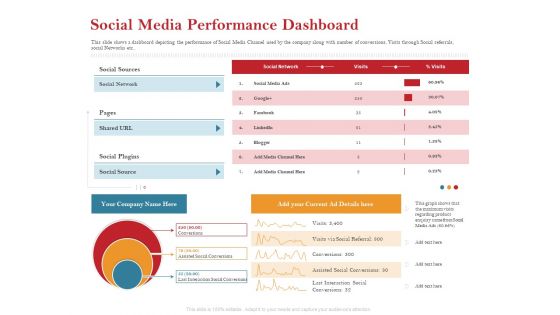
Pitch Deck For Raising Capital For Inorganic Growth Social Media Performance Dashboard Mockup PDF
This slide shows a dashboard depicting the performance of Social Media Channel used by the company along with number of conversions, Visits through Social referrals, social Networks etc. Presenting pitch deck for raising capital for inorganic growth social media performance dashboard mockup pdf to provide visual cues and insights. Share and navigate important information on three stages that need your due attention. This template can be used to pitch topics like social sources, social media. In addtion, this PPT design contains high resolution images, graphics, etc, that are easily editable and available for immediate download.
Operations Of Commercial Bank Dashboard Tracking Customer Activities And Revenue Generated Inspiration PDF
This slide contains dashboard that will allow bank to track the customer activities in terms of new customer acquired, customer acquisition cost and overall revenue generated. Deliver and pitch your topic in the best possible manner with this operations of commercial bank dashboard tracking customer activities and revenue generated inspiration pdf. Use them to share invaluable insights on avg revenue per customer, customers acquisition cost, compared to previous year and impress your audience. This template can be altered and modified as per your expectations. So, grab it now.
Operations Of Commercial Bank Dashboard Tracking Customer Retention Rate Time Summary PDF
This slide contains dashboard that will allow bank to track the retention rate of customer within span of 6 months. Number of accounts that are successfully retained by the bank. It will also bank in tracking accounts that are cancelled. Deliver an awe-inspiring pitch with this creative operations of commercial bank dashboard tracking customer retention rate time summary pdf bundle. Topics like contraction, expansion, partner can be discussed with this completely editable template. It is available for immediate download depending on the needs and requirements of the user.
Operations Of Commercial Bank Dashboard Tracking Customer Retention Rate Icons PDF
This slide contains dashboard that will allow bank to track the retention rate of customer within span of 6 months. Number of accounts that are successfully retained by the bank. It will also bank in tracking accounts that are cancelled. Deliver and pitch your topic in the best possible manner with this operations of commercial bank dashboard tracking customer retention rate icons pdf. Use them to share invaluable insights on road runners, contraction, expansion and impress your audience. This template can be altered and modified as per your expectations. So, grab it now.
Operations Of Commercial Bank Dashboard Tracking Online Banking Activities Topics PDF
This slide contains dashboard that will allow bank to track the online customer activities in terms of new customer connected with bank on online platform, fraud prevention. It will also help the bank in tracking the numbers of employees that are connected to bank through mobile access. Deliver and pitch your topic in the best possible manner with this operations of commercial bank dashboard tracking online banking activities topics pdf. Use them to share invaluable insights on express invoicing, account management, fraud prevention, payroll service and impress your audience. This template can be altered and modified as per your expectations. So, grab it now.
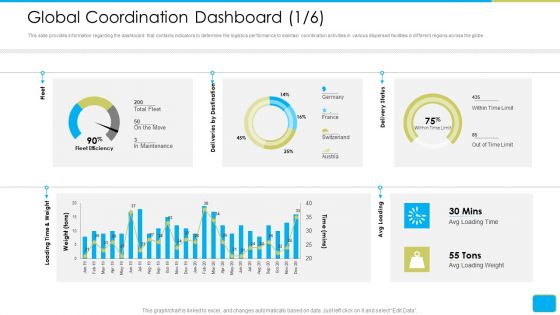
Cross Border Integration In Multinational Corporation Global Coordination Dashboard Download PDF
This slide provides information regarding the dashboard that contains indicators to determine the logistics performance to maintain coordination activities in various dispersed facilities in different regions across the globe. Deliver an awe-inspiring pitch with this creative cross border integration in multinational corporation global coordination dashboard download pdf bundle. Topics like loading time and weight, delivery status, avg loading, avg loading time, avg loading weight, time limit can be discussed with this completely editable template. It is available for immediate download depending on the needs and requirements of the user.
Executing Online Solution In Banking Dashboard Tracking Customer Activities And Revenue Generated Information PDF
This slide contains dashboard that will allow bank to track the customer activities in terms of new customer acquired, customer acquisition cost and overall revenue generated. Deliver and pitch your topic in the best possible manner with this executing online solution in banking dashboard tracking customer activities and revenue generated information pdf. Use them to share invaluable insights on compared to previous year, target achievement, customers acquisition, actual revenue and impress your audience. This template can be altered and modified as per your expectations. So, grab it now.
Executing Online Solution In Banking Dashboard Tracking Customer Retention Rate Seats Sample PDF
This slide contains dashboard that will allow bank to track the retention rate of customer within span of 6 months. Number of accounts that are successfully retained by the bank. It will also bank in tracking accounts that are cancelled. Deliver an awe inspiring pitch with this creative executing online solution in banking dashboard tracking customer retention rate seats sample pdf bundle. Topics like road runners, sleeping beautiful, aladdin rugs can be discussed with this completely editable template. It is available for immediate download depending on the needs and requirements of the user.
Executing Online Solution In Banking Dashboard Tracking Customer Retention Rate Time Topics PDF
This slide contains dashboard that will allow bank to track the retention rate of customer within span of 6 months. Number of accounts that are successfully retained by the bank. It will also bank in tracking accounts that are cancelled. Deliver and pitch your topic in the best possible manner with this executing online solution in banking dashboard tracking customer retention rate time topics pdf. Use them to share invaluable insights on account retention, retention components over time, expansion, contraction and impress your audience. This template can be altered and modified as per your expectations. So, grab it now.
Executing Online Solution In Banking Dashboard Tracking Online Banking Activities Structure PDF
This slide contains dashboard that will allow bank to track the online customer activities in terms of new customer connected with bank on online platform, fraud prevention. It will also help the bank in tracking the numbers of employees that are connected to bank through mobile access. Deliver and pitch your topic in the best possible manner with this executing online solution in banking dashboard tracking online banking activities structure pdf. Use them to share invaluable insights on payroll service, express invoicing, account management, fraud prevention and impress your audience. This template can be altered and modified as per your expectations. So, grab it now.
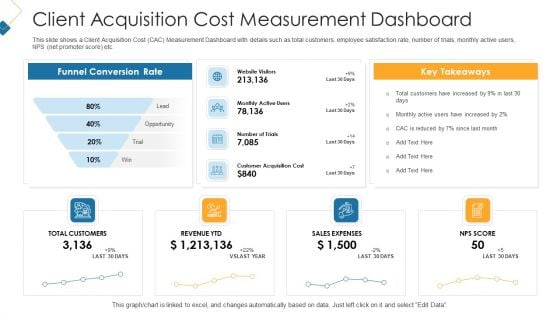
Customer Attainment Price To Gain New Clients Client Acquisition Cost Measurement Dashboard Microsoft PDF
This slide shows a Client Acquisition Cost CAC Measurement Dashboard with details such as total customers, employee satisfaction rate, number of trials, monthly active users, NPS net promoter score etc. This is a customer attainment price to gain new clients client acquisition cost measurement dashboard microsoft pdf template with various stages. Focus and dispense information on four stages using this creative set, that comes with editable features. It contains large content boxes to add your information on topics like website visitors, monthly active users, number of trials, customer acquisition cost. You can also showcase facts, figures, and other relevant content using this PPT layout. Grab it now.
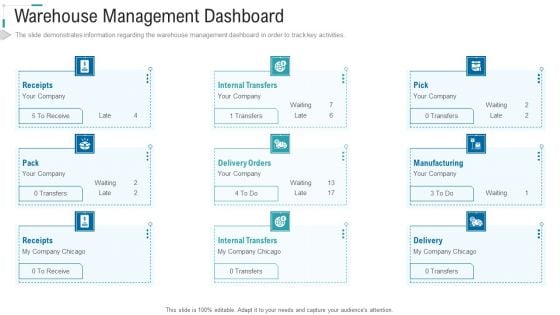
Inventory Stock Control Warehouse Management Dashboard Receipts Ppt Layouts Format Ideas PDF
The slide demonstrates information regarding the warehouse management dashboard in order to track key activities. This is a inventory stock control warehouse management dashboard receipts ppt layouts format ideas pdf template with various stages. Focus and dispense information on nine stages using this creative set, that comes with editable features. It contains large content boxes to add your information on topics like receipts, internal transfers, manufacturing, delivery, internal transfers. You can also showcase facts, figures, and other relevant content using this PPT layout. Grab it now.
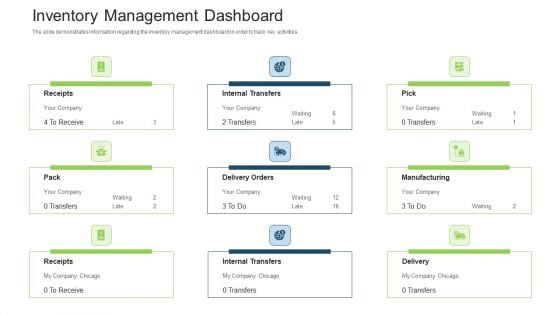
Stock Control System Inventory Management Dashboard Ppt Infographic Template Influencers PDF
The slide demonstrates information regarding the inventory management dashboard in order to track key activities. Presenting stock control system inventory management dashboard ppt infographic template influencers pdf to provide visual cues and insights. Share and navigate important information on nine stages that need your due attention. This template can be used to pitch topics like receipts, delivery orders, manufacturing, internal transfers, delivery, internal transfers. In addtion, this PPT design contains high resolution images, graphics, etc, that are easily editable and available for immediate download.
Developing Firm Security Strategy Plan Security Incidents Tracking Dashboard Alerts Graphics PDF
This slide portrays information regarding the dashboard that firm will track various incidents detected. These incidents will be managed in order to avoid security risks. Presenting developing firm security strategy plan security incidents tracking dashboard alerts graphics pdf to provide visual cues and insights. Share and navigate important information on eight stages that need your due attention. This template can be used to pitch topics like application whitelisting, patch applications, patch operating systems, restrict admin privileges. In addtion, this PPT design contains high resolution images, graphics, etc, that are easily editable and available for immediate download.
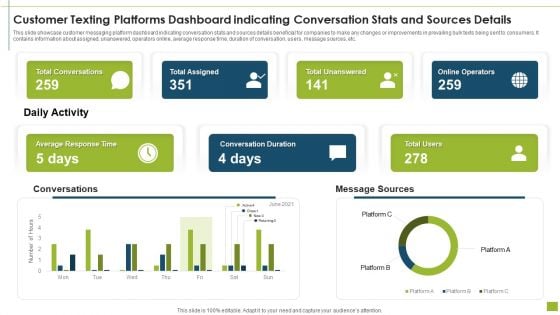
Customer Texting Platforms Dashboard Indicating Conversation Stats And Sources Details Ideas PDF
This slide showcase customer messaging platform dashboard indicating conversation stats and sources details beneficial for companies to make any changes or improvements in prevailing bulk texts being sent to consumers. It contains information about assigned, unanswered, operators online, average response time, duration of conversation, users, message sources, etc.Showcasing this set of slides titled customer texting platforms dashboard indicating conversation stats and sources details ideas pdf The topics addressed in these templates are total conversations, total assigned, total unanswered All the content presented in this PPT design is completely editable. Download it and make adjustments in color, background, font etc. as per your unique business setting.
B2B Marketing Content Administration Playbook Sales Management Activities Tracking Dashboard Brochure PDF
This slide provides information regarding sales meeting plan playing vital role in sales operation effectiveness, motivating sales team and improve overall productivity.Presenting b2b marketing content administration playbook sales management activities tracking dashboard brochure pdf to provide visual cues and insights. Share and navigate important information on three stages that need your due attention. This template can be used to pitch topics like sales management activities tracking dashboard In addtion, this PPT design contains high resolution images, graphics, etc, that are easily editable and available for immediate download.
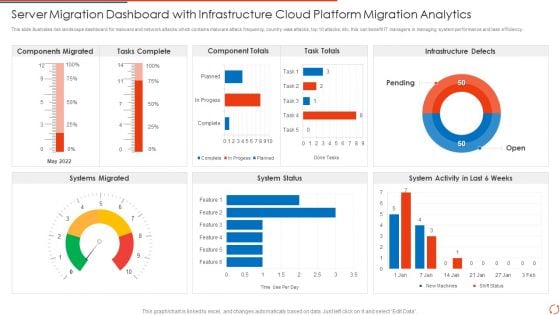
Server Migration Dashboard With Infrastructure Cloud Platform Migration Analytics Elements PDF Portrait PDF
This slide illustrates risk landscape dashboard for malware and network attacks which contains malware attack frequency, country wise attacks, top 10 attacks, etc. this can benefit IT managers in managing system performance and task efficiency Pitch your topic with ease and precision using this Server Migration Dashboard With Infrastructure Cloud Platform Migration Analytics Elements PDF Portrait PDF. This layout presents information on Tasks Complete, Component Totals, Task Totals. It is also available for immediate download and adjustment. So, changes can be made in the color, design, graphics or any other component to create a unique layout.
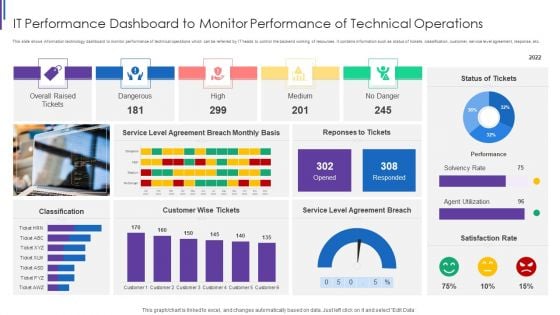
IT Performance Dashboard To Monitor Performance Of Technical Operations Download PDF
This slide shows information technology dashboard to monitor performance of technical operations which can be referred by IT heads to control the backend working of resources. It contains information such as status of tickets, classification, customer, service level agreement, response, etc. Showcasing this set of slides titled IT Performance Dashboard To Monitor Performance Of Technical Operations Download PDF. The topics addressed in these templates are Overall Raised Tickets, Dangerous High Medium, Service Level Agreement, Customer Wise Tickets. All the content presented in this PPT design is completely editable. Download it and make adjustments in color, background, font etc. as per your unique business setting.
Mobile User Interface Issue Tracker Dashboard In Information Technology Ideas PDF
This slide shows mobile user interface issue tracker dashboard in information technology which can be referred by software engineers to rectify smartphone issues. It contains information about project, component, generated vs. completed issues, issue by status, issue count by project and component and incomplete issues. Pitch your topic with ease and precision using this Mobile User Interface Issue Tracker Dashboard In Information Technology Ideas PDF. This layout presents information on Issues Count By, Project And Components, Incomplete Issues By, Priority And Project. It is also available for immediate download and adjustment. So, changes can be made in the color, design, graphics or any other component to create a unique layout.
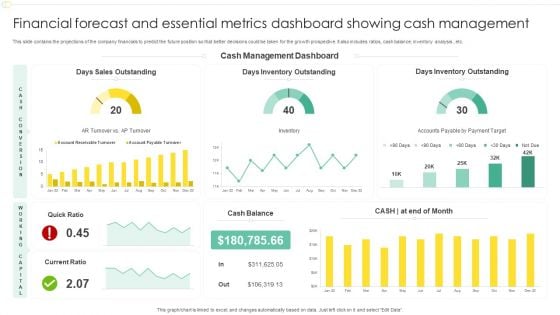
Financial Forecast And Essential Metrics Dashboard Showing Cash Management Designs PDF
This slide contains the projections of the company financials to predict the future position so that better decisions could be taken for the growth prospective. It also includes ratios, cash balance, inventory analysis , etc. Showcasing this set of slides titled Financial Forecast And Essential Metrics Dashboard Showing Cash Management Designs PDF. The topics addressed in these templates are Days Sales Outstanding, Cash Management Dashboard, Days Inventory Outstanding. All the content presented in this PPT design is completely editable. Download it and make adjustments in color, background, font etc. as per your unique business setting.
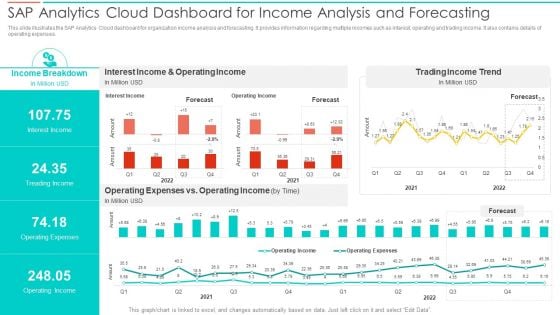
SAC Planning And Implementation SAP Analytics Cloud Dashboard For Income Analysis Summary PDF
This slide illustrates the SAP Analytics Cloud dashboard for organization income analysis and forecasting. It provides information regarding multiple incomes such as interest, operating and trading income. It also contains details of operating expenses. Deliver an awe inspiring pitch with this creative SAC Planning And Implementation SAP Analytics Cloud Dashboard For Income Analysis Summary PDF bundle. Topics like Income Breakdown, Interest Income, Operating Income, Trading Income Trend can be discussed with this completely editable template. It is available for immediate download depending on the needs and requirements of the user.
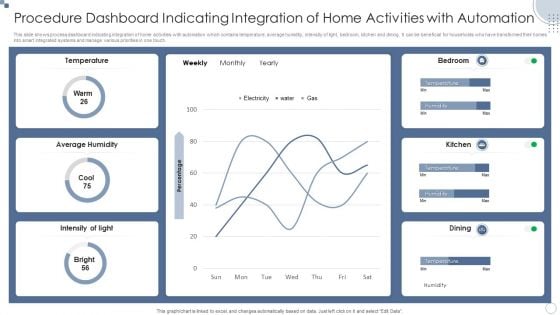
Procedure Dashboard Indicating Integration Of Home Activities With Automation Ppt PowerPoint Presentation File Files PDF
This slide shows process dashboard indicating integration of home activities with automation which contains temperature, average humidity, intensity of light, bedroom, kitchen and dining. It can be beneficial for households who have transformed their homes into smart integrated systems and manage various priorities in one touch.Showcasing this set of slides titled Procedure Dashboard Indicating Integration Of Home Activities With Automation Ppt PowerPoint Presentation File Files PDF. The topics addressed in these templates are Average Humidity, Temperature, Intensity Light. All the content presented in this PPT design is completely editable. Download it and make adjustments in color, background, font etc. as per your unique business setting.
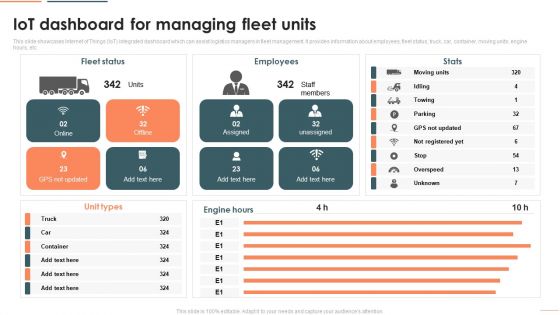
Deploying Iot In Logistics And Supply Chain Iot Dashboard For Managing Fleet Units Download PDF
This slide showcases Internet of Things IoT integrated dashboard which can assist logistics managers in fleet management. It provides information about employees, fleet status, truck, car, container, moving units, engine hours, etc. Deliver and pitch your topic in the best possible manner with this Deploying Iot In Logistics And Supply Chain Iot Dashboard For Managing Fleet Units Download PDF. Use them to share invaluable insights on Fleet Status, Employees, Unit Types and impress your audience. This template can be altered and modified as per your expectations. So, grab it now.
Customer Deal Tracking In Sales Pipeline Dashboard Improving Distribution Channel Ideas PDF
This slide covers information regarding dashboard for tracking various customer deals in sales pipeline. This is a Customer Deal Tracking In Sales Pipeline Dashboard Improving Distribution Channel Ideas PDF template with various stages. Focus and dispense information on three stages using this creative set, that comes with editable features. It contains large content boxes to add your information on topics like Proposal Sent, Terms Accepted, Customer Conversion. You can also showcase facts, figures, and other relevant content using this PPT layout. Grab it now.
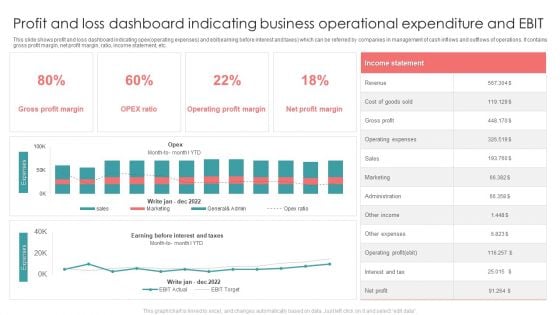
Profit And Loss Dashboard Indicating Business Operational Expenditure And EBIT Formats PDF
This slide shows profit and loss dashboard indicating opex operating expenses and ebit earning before interest and taxes which can be referred by companies in management of cash inflows and outflows of operations. It contains gross profit margin, net profit margin, ratio, income statement, etc. Showcasing this set of slides titled Profit And Loss Dashboard Indicating Business Operational Expenditure And EBIT Formats PDF. The topics addressed in these templates are Revenue, Gross Profit, Sales. All the content presented in this PPT design is completely editable. Download it and make adjustments in color, background, font etc. as per your unique business setting.
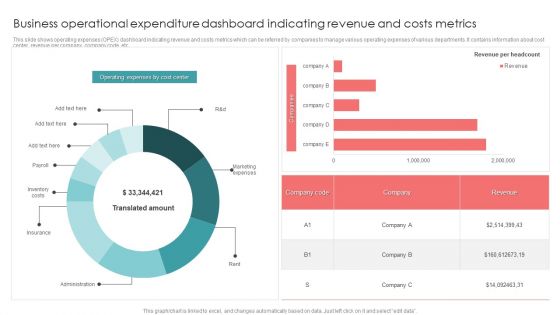
Business Operational Expenditure Dashboard Indicating Revenue And Costs Metrics Pictures PDF
This slide shows operating expenses OPEX dashboard indicating revenue and costs metrics which can be referred by companies to manage various operating expenses of various departments. It contains information about cost center, revenue per company, company code, etc. Pitch your topic with ease and precision using this Business Operational Expenditure Dashboard Indicating Revenue And Costs Metrics Pictures PDF. This layout presents information on Business Operational, Costs Metrics, Revenue. It is also available for immediate download and adjustment. So, changes can be made in the color, design, graphics or any other component to create a unique layout.
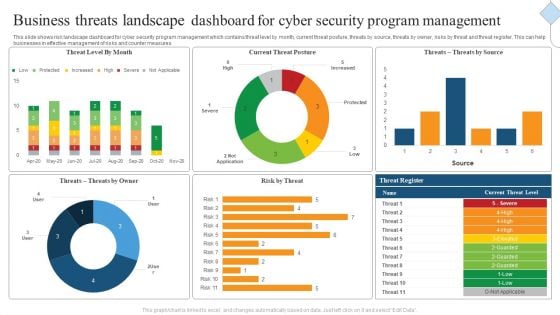
Business Threats Landscape Dashboard For Cyber Security Program Management Ppt Gallery Images PDF
This slide shows risk landscape dashboard for cyber security program management which contains threat level by month, current threat posture, threats by source, threats by owner, risks by threat and threat register. This can help businesses in effective management of risks and counter measures. Showcasing this set of slides titled Business Threats Landscape Dashboard For Cyber Security Program Management Ppt Gallery Images PDF. The topics addressed in these templates are Current Threat Posture, Threat Register, Source. All the content presented in this PPT design is completely editable. Download it and make adjustments in color, background, font etc. as per your unique business setting.
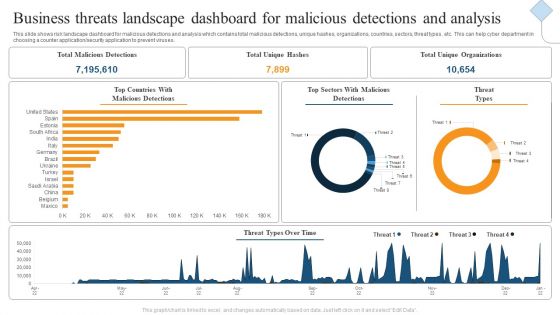
Business Threats Landscape Dashboard For Malicious Detections And Analysis Ppt Gallery Show PDF
This slide shows risk landscape dashboard for malicious detections and analysis which contains total malicious detections, unique hashes, organizations, countries, sectors, threat types, etc. This can help cyber department in choosing a counter application or security application to prevent viruses. Showcasing this set of slides titled Business Threats Landscape Dashboard For Malicious Detections And Analysis Ppt Gallery Show PDF. The topics addressed in these templates are Total Malicious Detections, Total Unique Hashes, Total Unique Organizations. All the content presented in this PPT design is completely editable. Download it and make adjustments in color, background, font etc. as per your unique business setting.
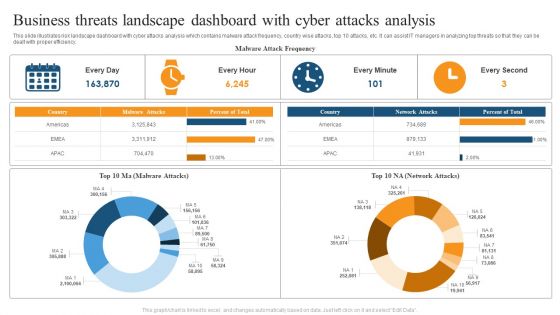
Business Threats Landscape Dashboard With Cyber Attacks Analysis Ppt Summary Brochure PDF
This slide illustrates risk landscape dashboard with cyber attacks analysis which contains malware attack frequency, country wise attacks, top 10 attacks, etc. It can assist IT managers in analyzing top threats so that they can be dealt with proper efficiency. Pitch your topic with ease and precision using this Business Threats Landscape Dashboard With Cyber Attacks Analysis Ppt Summary Brochure PDF. This layout presents information on Malware Attack Frequency, Every Minute, Every Second. It is also available for immediate download and adjustment. So, changes can be made in the color, design, graphics or any other component to create a unique layout.
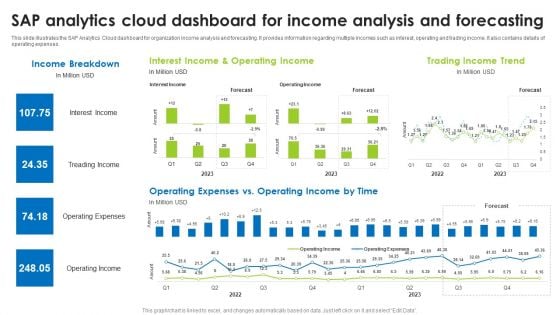
Sap Analytics Cloud Dashboard For Income Analysis And Forecasting Formats PDF
This slide illustrates the SAP Analytics Cloud dashboard for organization income analysis and forecasting. It provides information regarding multiple incomes such as interest, operating and trading income. It also contains details of operating expenses. The best PPT templates are a great way to save time, energy, and resources. Slidegeeks have 100 percent editable powerpoint slides making them incredibly versatile. With these quality presentation templates, you can create a captivating and memorable presentation by combining visually appealing slides and effectively communicating your message. Download Sap Analytics Cloud Dashboard To Asses Digital Marketing Campaigns Performance Ideas PDF from Slidegeeks and deliver a wonderful presentation.
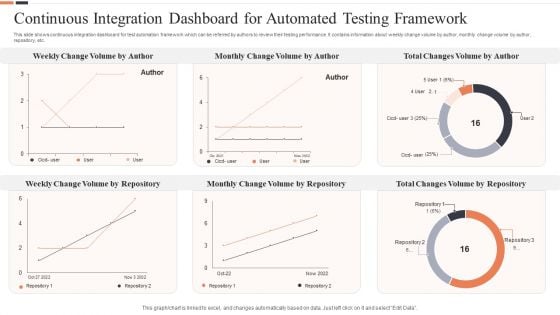
Continuous Integration Dashboard For Automated Testing Framework Ppt Layouts Layout Ideas PDF
This slide shows continuous integration dashboard for test automation framework which can be referred by authors to review their testing performance. It contains information about weekly change volume by author, monthly change volume by author, repository, etc. Pitch your topic with ease and precision using this Continuous Integration Dashboard For Automated Testing Framework Ppt Layouts Layout Ideas PDF. This layout presents information on Total Changes Volume, Monthly Change Volume, Weekly Change Volume. It is also available for immediate download and adjustment. So, changes can be made in the color, design, graphics or any other component to create a unique layout.
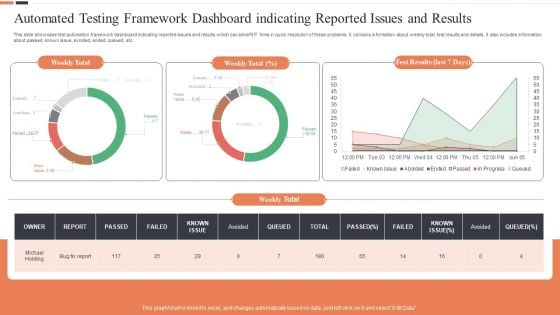
Automated Testing Framework Dashboard Indicating Reported Issues And Results Ideas PDF
This slide showcase test automation framework dashboard indicating reported issues and results which can benefit IT firms in quick resolution of these problems. It contains information about weekly total, test results and details. It also includes information about passed, known issue, avoided, ended, queued, etc. Showcasing this set of slides titled Automated Testing Framework Dashboard Indicating Reported Issues And Results Ideas PDF. The topics addressed in these templates are Weekly Total, Test Results, Last 7 Days. All the content presented in this PPT design is completely editable. Download it and make adjustments in color, background, font etc. as per your unique business setting.
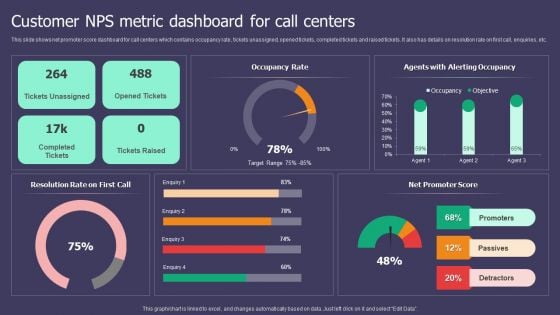
Customer NPS Metric Dashboard For Call Centers Ppt Inspiration Smartart PDF
This slide shows net promoter score dashboard for call centers which contains occupancy rate, tickets unassigned, opened tickets, completed tickets and raised tickets. It also has details on resolution rate on first call, enquiries, etc. Pitch your topic with ease and precision using this Customer NPS Metric Dashboard For Call Centers Ppt Inspiration Smartart PDF. This layout presents information on Occupancy Rate, Resolution Rate, Net Promoter Score. It is also available for immediate download and adjustment. So, changes can be made in the color, design, graphics or any other component to create a unique layout.
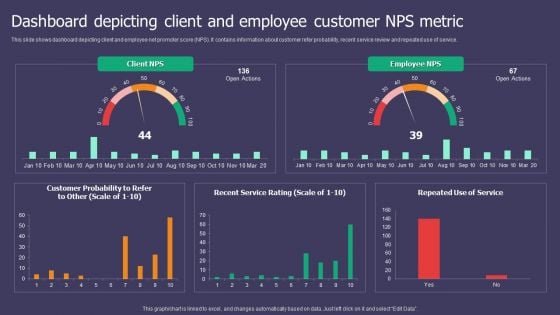
Dashboard Depicting Client And Employee Customer NPS Metric Ppt Gallery Deck PDF
This slide shows dashboard depicting client and employee net promoter score NPS. It contains information about customer refer probability, recent service review and repeated use of service. Showcasing this set of slides titled Dashboard Depicting Client And Employee Customer NPS Metric Ppt Gallery Deck PDF. The topics addressed in these templates are Client NPS, Employee NPS, Customer Probability. All the content presented in this PPT design is completely editable. Download it and make adjustments in color, background, font etc. as per your unique business setting.
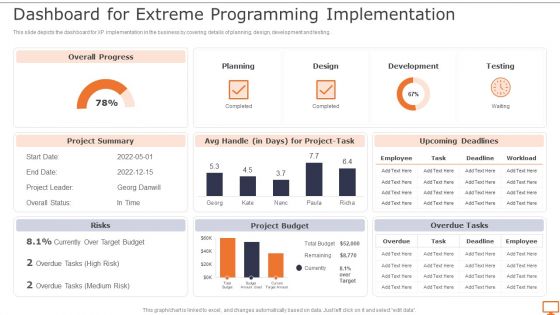
Deploying XP Practices To Enhance Operational Efficiency Dashboard For Extreme Programming Infographics PDF
This slide depicts the dashboard for XP implementation in the business by covering details of planning, design, development and testing. Welcome to our selection of theDeploying XP Practices To Enhance Operational Efficiency Dashboard For Extreme Programming Infographics PDF. These are designed to help you showcase your creativity and bring your sphere to life. Planning and Innovation are essential for any business that is just starting out. This collection contains the designs that you need for your everyday presentations. All of our PowerPoints are 100 Precent editable, so you can customize them to suit your needs. This multi-purpose template can be used in various situations. Grab these presentation templates today.
Dashboard To Monitor Department Wise Budget Allocation And Usage Icons PDF
This slide highlights the dashboard to monitor the department wise budget allocation and usage. It provides information regarding the total budget allocated and actual amount spent by multiple organization silos such as marketing, finance, HR. It also contains details of each departments average employee spending, Make sure to capture your audiences attention in your business displays with our gratis customizable Dashboard To Monitor Department Wise Budget Allocation And Usage Icons PDF. These are great for business strategies, office conferences, capital raising or task suggestions. If you desire to acquire more customers for your tech business and ensure they stay satisfied, create your own sales presentation with these plain slides.
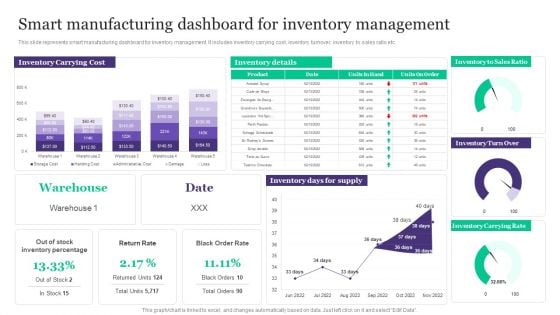
Deployment Of Automated Production Technology Smart Manufacturing Dashboard For Inventory Management Brochure PDF
This slide represents smart manufacturing dashboard for inventory management. It includes inventory carrying cost, inventory turnover, inventory to sales ratio etc.Welcome to our selection of the Deployment Of Automated Production Technology Smart Manufacturing Dashboard For Inventory Management Brochure PDF. These are designed to help you showcase your creativity and bring your sphere to life. Planning and Innovation are essential for any business that is just starting out. This collection contains the designs that you need for your everyday presentations. All of our PowerPoints are 100 precent editable, so you can customize them to suit your needs. This multi-purpose template can be used in various situations. Grab these presentation templates today.
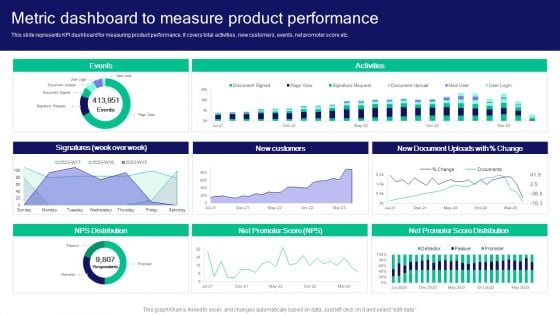
Strategies For Effective Product Metric Dashboard To Measure Product Performance Download PDF
This slide represents KPI dashboard for measuring product performance. It covers total activities, new customers, events, net promoter score etc. Welcome to our selection of the Strategies For Effective Product Metric Dashboard To Measure Product Performance Download PDF. These are designed to help you showcase your creativity and bring your sphere to life. Planning and Innovation are essential for any business that is just starting out. This collection contains the designs that you need for your everyday presentations. All of our PowerPoints are 100 percent editable, so you can customize them to suit your needs. This multi-purpose template can be used in various situations. Grab these presentation templates today.
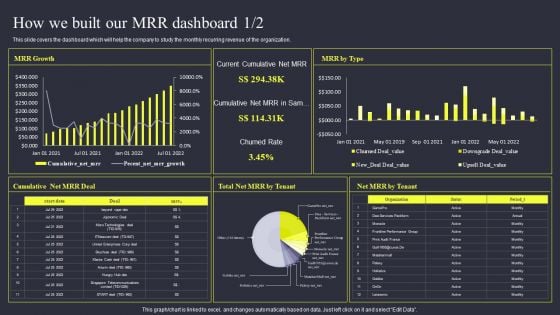
Strategies To Enhance Managed Service Business How We Built Our MRR Dashboard Introduction PDF
This slide covers the dashboard which will help the company to study the monthly recurring revenue of the organization. Welcome to our selection of the Strategies To Enhance Managed Service Business How We Built Our MRR Dashboard Introduction PDF. These are designed to help you showcase your creativity and bring your sphere to life. Planning and Innovation are essential for any business that is just starting out. This collection contains the designs that you need for your everyday presentations. All of our PowerPoints are 100 percent editable, so you can customize them to suit your needs. This multi purpose template can be used in various situations. Grab these presentation templates today.
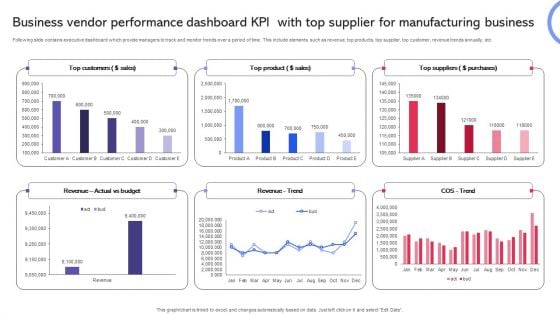
Business Vendor Performance Dashboard KPI With Top Supplier For Manufacturing Business Information PDF
Following slide contains executive dashboard which provide managers to track and monitor trends over a period of time. This include elements such as revenue, top products, top supplier, top customer, revenue trends annually, etc. Showcasing this set of slides titled Business Vendor Performance Dashboard KPI With Top Supplier For Manufacturing Business Information PDF. The topics addressed in these templates are Customers, Product, Sales. All the content presented in this PPT design is completely editable. Download it and make adjustments in color, background, font etc. as per your unique business setting.
Icons Slide For Net Promoter Score Dashboard Ppt Gallery Objects PDF
Presenting our innovatively-structured icons slide for net promoter score dashboard ppt gallery objects pdf set of slides. The slides contain a hundred percent editable icons. You can replace these icons without any inconvenience. Therefore, pick this set of slides and create a striking presentation.
Net Promoter Score Dashboard Post It Notes Ppt Inspiration Show PDF
Presenting net promoter score dashboard post it notes ppt inspiration show pdf to provide visual cues and insights. Share and navigate important information three stages that need your due attention. This template can be used to pitch topics like post it notes. In addtion, this PPT design contains high-resolution images, graphics, etc, that are easily editable and available for immediate download.

Development And Operations KPI Dashboard IT Post It Notes Inspiration PDF
Presenting development and operations kpi dashboard it post it notes inspiration pdf to provide visual cues and insights. Share and navigate important information on four stages that need your due attention. This template can be used to pitch topics like post it notes. In addtion, this PPT design contains high resolution images, graphics, etc, that are easily editable and available for immediate download.

Strategy To Enhance Supply Chain Operations Dashboard To Analyze Impact Of Warehouse Management Topics PDF
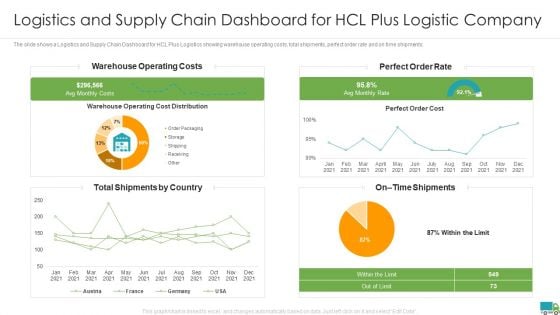
Generating Logistics Value Business Logistics And Supply Chain Dashboard For Hcl Plus Logistic Company Microsoft PDF
The slide shows a Logistics and Supply Chain Dashboard for HCL Plus Logistics showing warehouse operating costs, total shipments, perfect order rate and on time shipments. Deliver an awe inspiring pitch with this creative generating logistics value business latest logistic technologies that can form unique valuable proposition pictures pdf bundle. Topics like warehouse operating costs, perfect order rate, total shipments by country can be discussed with this completely editable template. It is available for immediate download depending on the needs and requirements of the user.
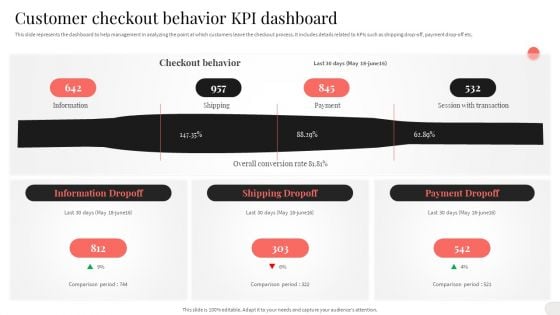
Analyzing And Implementing Effective CMS Customer Checkout Behavior KPI Dashboard Inspiration PDF
This slide represents the dashboard to help management in analyzing the point at which customers leave the checkout process. It includes details related to KPIs such as shipping drop off, payment drop off etc. Coming up with a presentation necessitates that the majority of the effort goes into the content and the message you intend to convey. The visuals of a PowerPoint presentation can only be effective if it supplements and supports the story that is being told. Keeping this in mind our experts created Analyzing And Implementing Effective CMS Customer Checkout Behavior KPI Dashboard Inspiration PDF to reduce the time that goes into designing the presentation. This way, you can concentrate on the message while our designers take care of providing you with the right template for the situation.
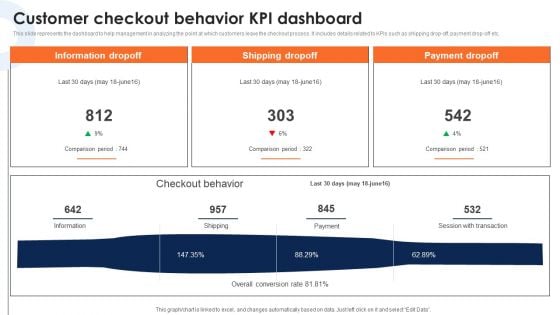
Customer Checkout Behavior Kpi Dashboard Deploying Ecommerce Order Management Software Demonstration PDF
This slide represents the dashboard to help management in analyzing the point at which customers leave the checkout process. It includes details related to KPIs such as shipping drop-off, payment drop-off etc.Present like a pro with Customer Checkout Behavior Kpi Dashboard Deploying Ecommerce Order Management Software Demonstration PDF Create beautiful presentations together with your team, using our easy-to-use presentation slides. Share your ideas in real-time and make changes on the fly by downloading our templates. So whether you are in the office, on the go, or in a remote location, you can stay in sync with your team and present your ideas with confidence. With Slidegeeks presentation got a whole lot easier. Grab these presentations today.
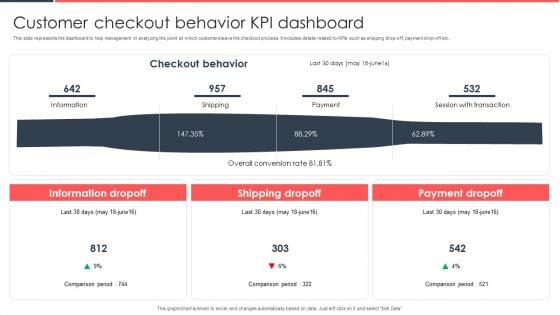
Implementing Management System To Enhance Ecommerce Processes Customer Checkout Behavior KPI Dashboard Clipart PDF
This slide represents the dashboard to help management in analyzing the point at which customers leave the checkout process. It includes details related to KPIs such as shipping drop-off, payment drop-off etc. This modern and well arranged Implementing Management System To Enhance Ecommerce Processes Customer Checkout Behavior KPI Dashboard Clipart PDF provides lots of creative possibilities. It is very simple to customize and edit with the Powerpoint Software. Just drag and drop your pictures into the shapes. All facets of this template can be edited with Powerpoint no extra software is necessary. Add your own material, put your images in the places assigned for them, adjust the colors, and then you can show your slides to the world, with an animated slide included.
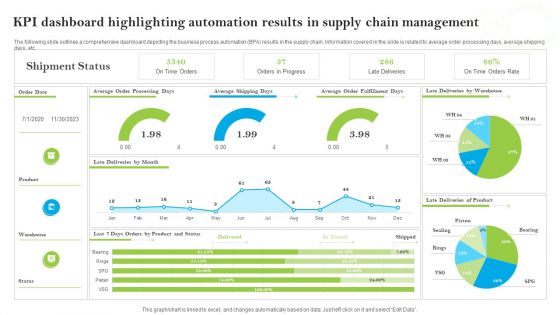
Introducing AI Tools KPI Dashboard Highlighting Automation Results In Supply Chain Portrait PDF
The following slide outlines a comprehensive dashboard depicting the business process automation BPA results in the supply chain. Information covered in the slide is related to average order processing days, average shipping days, etc. Coming up with a presentation necessitates that the majority of the effort goes into the content and the message you intend to convey. The visuals of a PowerPoint presentation can only be effective if it supplements and supports the story that is being told. Keeping this in mind our experts created Introducing AI Tools KPI Dashboard Highlighting Automation Results In Supply Chain Portrait PDF to reduce the time that goes into designing the presentation. This way, you can concentrate on the message while our designers take care of providing you with the right template for the situation.
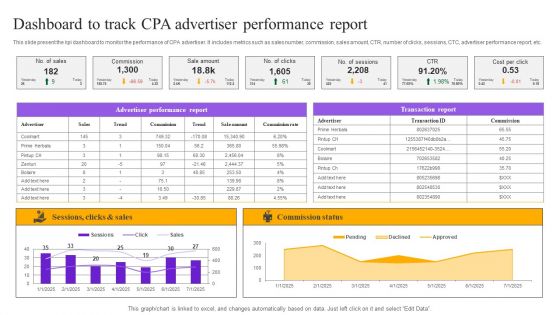
Strategies For Implementing CPA Marketing Dashboard To Track CPA Advertiser Performance Report Inspiration PDF
This slide present the kpi dashboard to monitor the performance of CPA advertiser. It includes metrics such as sales number, commission, sales amount, CTR, number of clicks, sessions, CTC, advertiser performance report, etc. The Strategies For Implementing CPA Marketing Dashboard To Track CPA Advertiser Performance Report Inspiration PDF is a compilation of the most recent design trends as a series of slides. It is suitable for any subject or industry presentation, containing attractive visuals and photo spots for businesses to clearly express their messages. This template contains a variety of slides for the user to input data, such as structures to contrast two elements, bullet points, and slides for written information. Slidegeeks is prepared to create an impression.
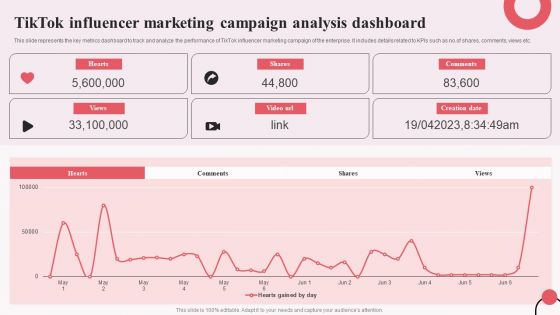
Tiktok Digital Marketing Campaign Tiktok Influencer Marketing Campaign Analysis Dashboard Brochure PDF
This slide represents the key metrics dashboard to track and analyze the performance of TikTok influencer marketing campaign of the enterprise. It includes details related to KPIs such as no.of shares, comments, views etc. The Tiktok Digital Marketing Campaign Tiktok Influencer Marketing Campaign Analysis Dashboard Brochure PDF is a compilation of the most recent design trends as a series of slides. It is suitable for any subject or industry presentation, containing attractive visuals and photo spots for businesses to clearly express their messages. This template contains a variety of slides for the user to input data, such as structures to contrast two elements, bullet points, and slides for written information. Slidegeeks is prepared to create an impression.
Predictive Analytics Model Performance Tracking Dashboard Forward Looking Analysis IT Introduction PDF
This slide represents the predictive analytics model performance tracking dashboard, and it covers the details of total visitors, total buyers, total products added to the cart, filters by date and category, visitors to clients conversion rate, and so on.The Predictive Analytics Model Performance Tracking Dashboard Forward Looking Analysis IT Introduction PDF is a compilation of the most recent design trends as a series of slides. It is suitable for any subject or industry presentation, containing attractive visuals and photo spots for businesses to clearly express their messages. This template contains a variety of slides for the user to input data, such as structures to contrast two elements, bullet points, and slides for written information. Slidegeeks is prepared to create an impression.
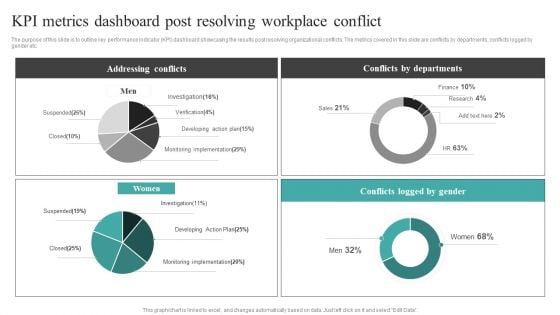
Common Conflict Situations Kpi Metrics Dashboard Post Resolving Workplace Information PDF
The purpose of this slide is to outline key performance indicator KPI dashboard showcasing the results post resolving organizational conflicts. The metrics covered in this slide are conflicts by departments, conflicts logged by gender etc. The Common Conflict Situations Kpi Metrics Dashboard Post Resolving Workplace Information PDF is a compilation of the most recent design trends as a series of slides. It is suitable for any subject or industry presentation, containing attractive visuals and photo spots for businesses to clearly express their messages. This template contains a variety of slides for the user to input data, such as structures to contrast two elements, bullet points, and slides for written information. Slidegeeks is prepared to create an impression.

Real Time Content Marketing Result Dashboard Ppt Infographic Template Example PDF
The following slide depicts real time content marketing KPI dashboard to monitor traffic flow and manage promotional efforts. It includes elements such as visitors by channel, conversion rate, search, direct, sessions, average time engaged etc. The Real Time Content Marketing Result Dashboard Ppt Infographic Template Example PDF is a compilation of the most recent design trends as a series of slides. It is suitable for any subject or industry presentation, containing attractive visuals and photo spots for businesses to clearly express their messages. This template contains a variety of slides for the user to input data, such as structures to contrast two elements, bullet points, and slides for written information. Slidegeeks is prepared to create an impression.


 Continue with Email

 Home
Home


