Turnover Dashboard
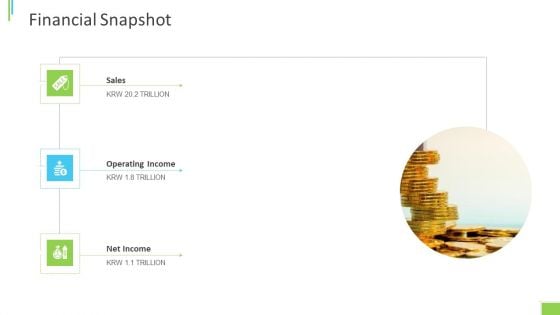
Business Overview PPT Slides Financial Snapshot Ppt Background PDF
Presenting business overview ppt slides financial snapshot ppt background pdf to provide visual cues and insights. Share and navigate important information on three stages that need your due attention. This template can be used to pitch topics like sales, operating income, net income. In addtion, this PPT design contains high resolution images, graphics, etc, that are easily editable and available for immediate download.
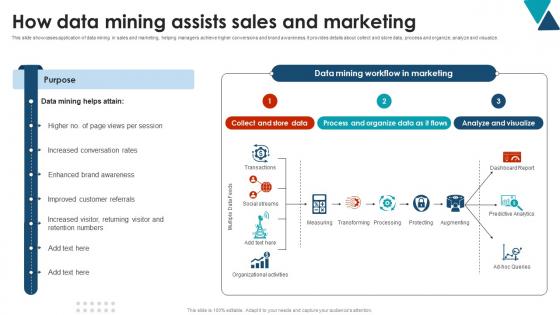
How Data Mining Assists Sales And Marketing Using Data Mining Tools To Optimize Processes AI SS V
This slide showcases application of data mining in sales and marketing, helping managers achieve higher conversions and brand awareness. It provides details about collect and store data, process and organize, analyze and visualize. This How Data Mining Assists Sales And Marketing Using Data Mining Tools To Optimize Processes AI SS V from Slidegeeks makes it easy to present information on your topic with precision. It provides customization options, so you can make changes to the colors, design, graphics, or any other component to create a unique layout. It is also available for immediate download, so you can begin using it right away. Slidegeeks has done good research to ensure that you have everything you need to make your presentation stand out. Make a name out there for a brilliant performance. This slide showcases application of data mining in sales and marketing, helping managers achieve higher conversions and brand awareness. It provides details about collect and store data, process and organize, analyze and visualize.
Magnifying Glass Ppt PowerPoint Presentation Outline Graphic Tips
This is a magnifying glass ppt powerpoint presentation outline graphic tips. This is a six stage process. The stages in this process are sales, magnifying glass, business, marketing, technology.
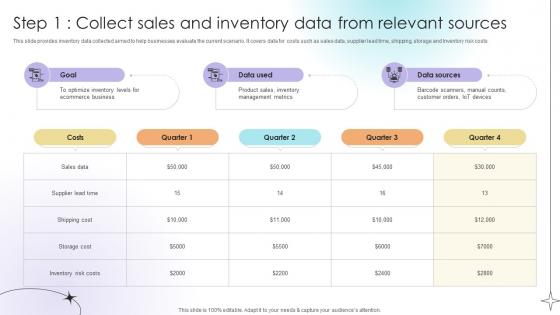
Step 1 Collect Sales And Inventory Data From Relevant Sources Data Analytics SS V
This slide provides inventory data collected aimed to help businesses evaluate the current scenario. It covers data for costs such as sales data, supplier lead time, shipping, storage and Inventory risk costs.Are you in need of a template that can accommodate all of your creative concepts This one is crafted professionally and can be altered to fit any style. Use it with Google Slides or PowerPoint. Include striking photographs, symbols, depictions, and other visuals. Fill, move around, or remove text boxes as desired. Test out color palettes and font mixtures. Edit and save your work, or work with colleagues. Download Step 1 Collect Sales And Inventory Data From Relevant Sources Data Analytics SS V and observe how to make your presentation outstanding. Give an impeccable presentation to your group and make your presentation unforgettable. This slide provides inventory data collected aimed to help businesses evaluate the current scenario. It covers data for costs such as sales data, supplier lead time, shipping, storage and Inventory risk costs.
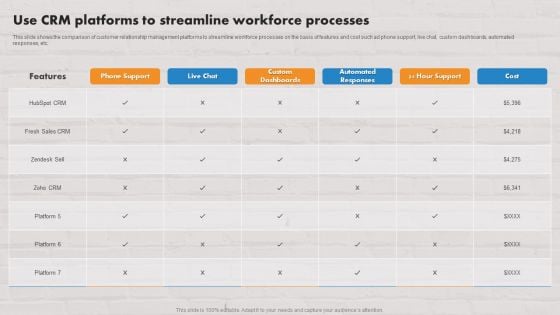
Customer Service Plan To Improve Sales Use Crm Platforms To Streamline Workforce Processes Template PDF
This slide shows the comparison of customer relationship management platforms to streamline workforce processes on the basis of features and cost such ad phone support, live chat, custom dashboards, automated responses, etc. The Customer Service Plan To Improve Sales Use Crm Platforms To Streamline Workforce Processes Template PDF is a compilation of the most recent design trends as a series of slides. It is suitable for any subject or industry presentation, containing attractive visuals and photo spots for businesses to clearly express their messages. This template contains a variety of slides for the user to input data, such as structures to contrast two elements, bullet points, and slides for written information. Slidegeeks is prepared to create an impression.

Sales Strategy Template 1 Ppt PowerPoint Presentation Example
This is a sales strategy template 1 ppt powerpoint presentation example. This is a one stage process. The stages in this process are business, sales, strategy, marketing, success.
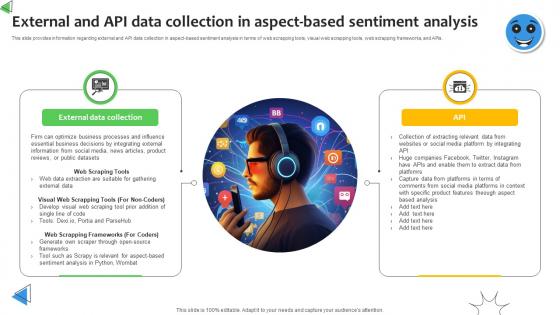
External And API Data Collection In Aspect Sentiment Analysis Demystified Understanding AI SS V
This slide provides information regarding external and API data collection in aspect-based sentiment analysis in terms of web scrapping tools, visual web scrapping tools, web scrapping frameworks, and APIs. Make sure to capture your audiences attention in your business displays with our gratis customizable External And API Data Collection In Aspect Sentiment Analysis Demystified Understanding AI SS V. These are great for business strategies, office conferences, capital raising or task suggestions. If you desire to acquire more customers for your tech business and ensure they stay satisfied, create your own sales presentation with these plain slides. This slide provides information regarding external and API data collection in aspect-based sentiment analysis in terms of web scrapping tools, visual web scrapping tools, web scrapping frameworks, and APIs.
Sales Department Management To Enhance Performance Tracking And Management Process Formats PDF
This slide represents the process to secure more sales and exceed the organizations revenue goals. It includes five steps to track sales team performance such as set goals and expectations, measure short term and long term goals, develop visual dashboard, work smarter and not harder and follow up team.Persuade your audience using this Sales Department Management To Enhance Performance Tracking And Management Process Formats PDF. This PPT design covers five stages, thus making it a great tool to use. It also caters to a variety of topics including Goals Expectations, Develop Visual, Gathered Insights. Download this PPT design now to present a convincing pitch that not only emphasizes the topic but also showcases your presentation skills.
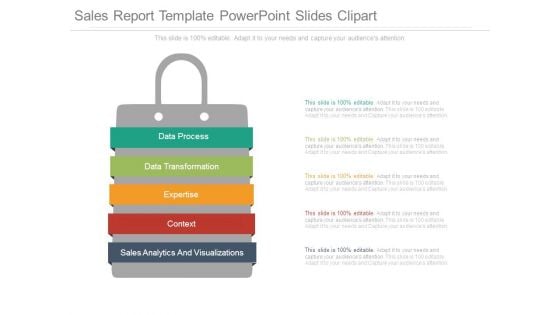
Sales Report Template Powerpoint Slides Clipart
This is a sales report template powerpoint slides clipart. This is a five stage process. The stages in this process are data process, data transformation, expertise, context, sales analytics and visualizations.

Benefits Of Using Big Data Analytics In Developing Strategic Insights Using Big Data Analytics SS V
This slide showcases impact of using big data analytics software for enhancing logistics operations and improving overall business performance. It provides information regarding key focus areas such as sales, operations planning, sourcing, production, warehousing, transportation etc. Get a simple yet stunning designed Benefits Of Using Big Data Analytics In Developing Strategic Insights Using Big Data Analytics SS V. It is the best one to establish the tone in your meetings. It is an excellent way to make your presentations highly effective. So, download this PPT today from Slidegeeks and see the positive impacts. Our easy-to-edit Benefits Of Using Big Data Analytics In Developing Strategic Insights Using Big Data Analytics SS V can be your go-to option for all upcoming conferences and meetings. So, what are you waiting for Grab this template today. This slide showcases impact of using big data analytics software for enhancing logistics operations and improving overall business performance. It provides information regarding key focus areas such as sales, operations planning, sourcing, production, warehousing, transportation etc.
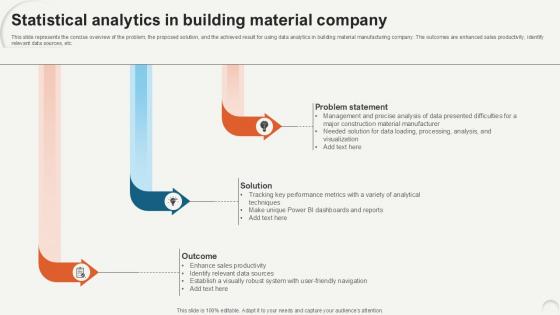
Statistical Analytics In Building Data Analytics For Informed Decision Ppt PowerPoint
This slide represents the concise overview of the problem, the proposed solution, and the achieved result for using data analytics in building material manufacturing company. The outcomes are enhanced sales productivity, identify relevant data sources, etc. Do you know about Slidesgeeks Statistical Analytics In Building Data Analytics For Informed Decision Ppt PowerPoint These are perfect for delivering any kind od presentation. Using it, create PowerPoint presentations that communicate your ideas and engage audiences. Save time and effort by using our pre-designed presentation templates that are perfect for a wide range of topic. Our vast selection of designs covers a range of styles, from creative to business, and are all highly customizable and easy to edit. Download as a PowerPoint template or use them as Google Slides themes. This slide represents the concise overview of the problem, the proposed solution, and the achieved result for using data analytics in building material manufacturing company. The outcomes are enhanced sales productivity, identify relevant data sources, etc.
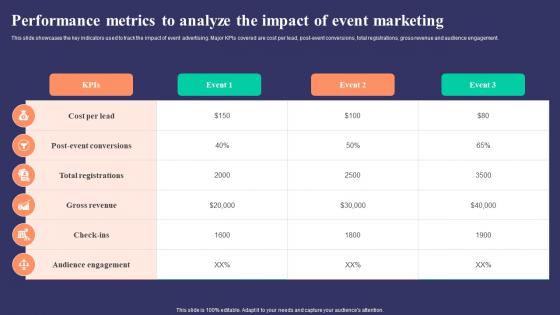
Performance Metrics To Analyze The Impact Strategies To Develop Successful Clipart Pdf
This slide showcases the key indicators used to track the impact of event advertising. Major KPIs covered are cost per lead, post event conversions, total registrations, gross revenue and audience engagement.Make sure to capture your audiences attention in your business displays with our gratis customizable Performance Metrics To Analyze The Impact Strategies To Develop Successful Clipart Pdf. These are great for business strategies, office conferences, capital raising or task suggestions. If you desire to acquire more customers for your tech business and ensure they stay satisfied, create your own sales presentation with these plain slides. This slide showcases the key indicators used to track the impact of event advertising. Major KPIs covered are cost per lead, post event conversions, total registrations, gross revenue and audience engagement.
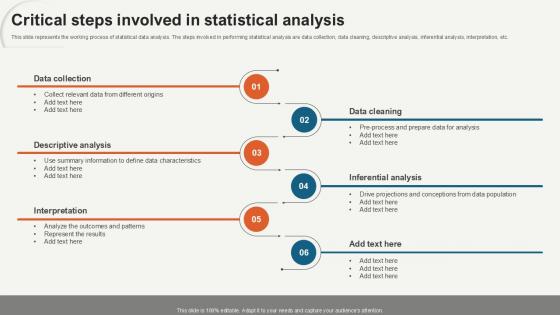
Critical Steps Involved In Statistical Data Analytics For Informed Decision Ppt Presentation
This slide represents the working process of statistical data analysis. The steps involved in performing statistical analysis are data collection, data cleaning, descriptive analysis, inferential analysis, interpretation, etc. Slidegeeks is here to make your presentations a breeze with Critical Steps Involved In Statistical Data Analytics For Informed Decision Ppt Presentation With our easy-to-use and customizable templates, you can focus on delivering your ideas rather than worrying about formatting. With a variety of designs to choose from, you are sure to find one that suits your needs. And with animations and unique photos, illustrations, and fonts, you can make your presentation pop. So whether you are giving a sales pitch or presenting to the board, make sure to check out Slidegeeks first This slide represents the working process of statistical data analysis. The steps involved in performing statistical analysis are data collection, data cleaning, descriptive analysis, inferential analysis, interpretation, etc.
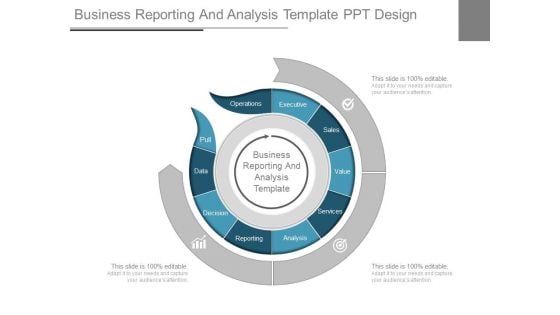
Business Reporting And Analysis Template Ppt Design
This is a business reporting and analysis template ppt design. This is a three stage process. The stages in this process are business reporting and analysis template, operations, executive, sales, value, services, analysis, reporting, decision, data, pull.
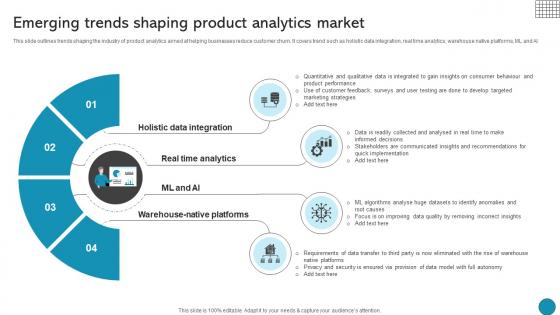
Emerging Trends Shaping Product Analytics Market Driving Business Success Integrating Product
This slide outlines trends shaping the industry of product analytics aimed at helping businesses reduce customer churn. It covers trend such as holistic data integration, real time analytics, warehouse native platforms, ML and AI Coming up with a presentation necessitates that the majority of the effort goes into the content and the message you intend to convey. The visuals of a PowerPoint presentation can only be effective if it supplements and supports the story that is being told. Keeping this in mind our experts created Emerging Trends Shaping Product Analytics Market Driving Business Success Integrating Product to reduce the time that goes into designing the presentation. This way, you can concentrate on the message while our designers take care of providing you with the right template for the situation. This slide outlines trends shaping the industry of product analytics aimed at helping businesses reduce customer churn. It covers trend such as holistic data integration, real time analytics, warehouse native platforms, ML and AI
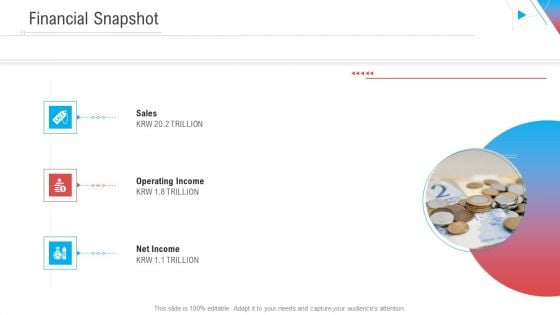
Company Outline Financial Snapshot Ppt Styles Grid PDF
This is a company outline financial snapshot ppt styles grid pdf template with various stages. Focus and dispense information on three stages using this creative set, that comes with editable features. It contains large content boxes to add your information on topics like sales, operating income, net income. You can also showcase facts, figures, and other relevant content using this PPT layout. Grab it now.
Sales Leads Online Ppt Powerpoint Presentation Styles Graphics Download Cpb
This is a sales leads online ppt powerpoint presentation styles graphics download cpb. This is a two stage process. The stages in this process are sales leads online.
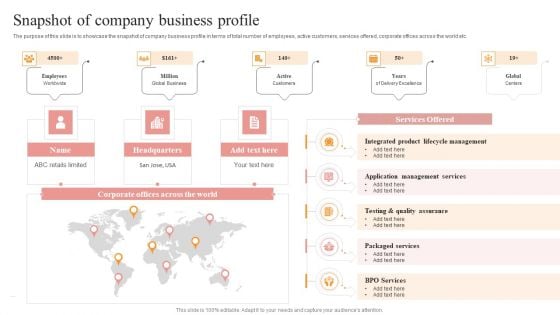
Snapshot Of Company Business Profile Themes PDF
The purpose of this slide is to showcase the snapshot of company business profile in terms of total number of employees, active customers, services offered, corporate offices across the world etc. Slidegeeks is here to make your presentations a breeze with Snapshot Of Company Business Profile Themes PDF With our easy to use and customizable templates, you can focus on delivering your ideas rather than worrying about formatting. With a variety of designs to choose from, you are sure to find one that suits your needs. And with animations and unique photos, illustrations, and fonts, you can make your presentation pop. So whether you are giving a sales pitch or presenting to the board, make sure to check out Slidegeeks first.
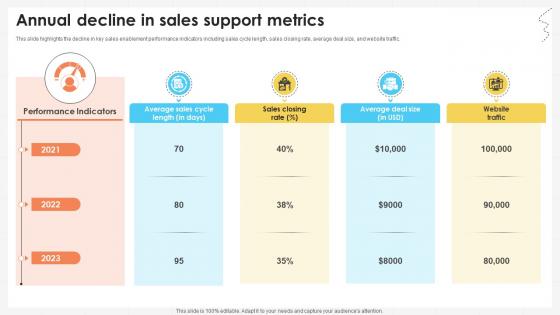
Business Development Team Annual Decline In Sales Support Metrics SA SS V
This slide highlights the decline in key sales enablement performance indicators including sales cycle length, sales closing rate, average deal size, and website traffic. Create an editable Business Development Team Annual Decline In Sales Support Metrics SA SS V that communicates your idea and engages your audience. Whether you are presenting a business or an educational presentation, pre-designed presentation templates help save time. Business Development Team Annual Decline In Sales Support Metrics SA SS V is highly customizable and very easy to edit, covering many different styles from creative to business presentations. Slidegeeks has creative team members who have crafted amazing templates. So, go and get them without any delay. This slide highlights the decline in key sales enablement performance indicators including sales cycle length, sales closing rate, average deal size, and website traffic.
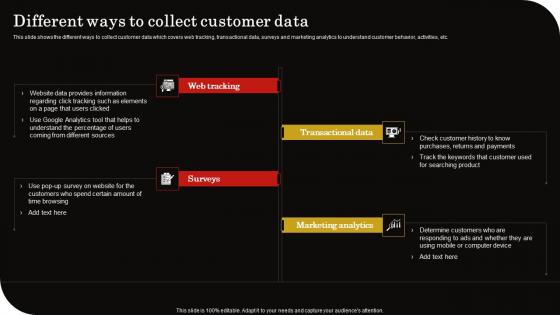
Different Ways To Collect Customer Data Client Retention Strategy To Reduce Churn Rate Portrait Pdf
This slide shows the different ways to collect customer data which covers web tracking, transactional data, surveys and marketing analytics to understand customer behavior, activities, etc. Crafting an eye catching presentation has never been more straightforward. Let your presentation shine with this tasteful yet straightforward Different Ways To Collect Customer Data Client Retention Strategy To Reduce Churn Rate Portrait Pdf template. It offers a minimalistic and classy look that is great for making a statement. The colors have been employed intelligently to add a bit of playfulness while still remaining professional. Construct the ideal Different Ways To Collect Customer Data Client Retention Strategy To Reduce Churn Rate Portrait Pdf that effortlessly grabs the attention of your audience Begin now and be certain to wow your customers This slide shows the different ways to collect customer data which covers web tracking, transactional data, surveys and marketing analytics to understand customer behavior, activities, etc.
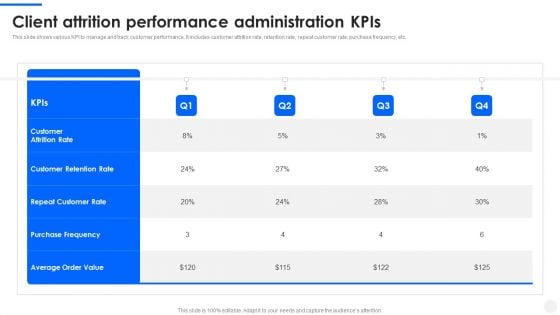
Client Attrition Performance Administration Kpis Topics PDF
This slide shows various KPI to manage and track customer performance. It includes customer attrition rate, retention rate, repeat customer rate, purchase frequency, etc. Pitch your topic with ease and precision using this Client Attrition Performance Administration Kpis Topics PDF. This layout presents information on Customer Retention Rate, Repeat Customer Rate, Purchase Frequency. It is also available for immediate download and adjustment. So, changes can be made in the color, design, graphics or any other component to create a unique layout.
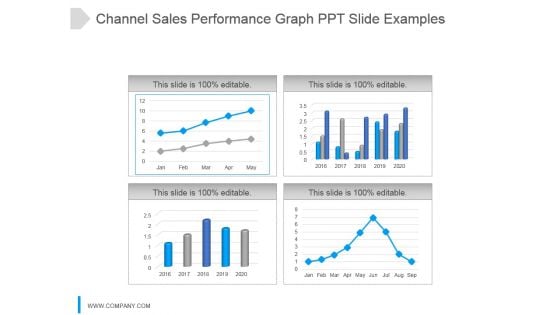
Channel Sales Performance Graph Ppt Slide Examples
This is a channel sales performance graph ppt slide examples. This is a four stage process. The stages in this process are jan, feb, mar, apr, may, jun, jul, aug, sep.
Retail Marketing Campaign Effective Techniques Recent Trends And Snapshots Of Company Icons PDF
This slide highlights the insights of current traditional marketing campaign adopted by the company. It results in decline in customers, sales, and revenue. Welcome to our selection of the Retail Marketing Campaign Effective Techniques Recent Trends And Snapshots Of Company Icons PDF. These are designed to help you showcase your creativity and bring your sphere to life. Planning and Innovation are essential for any business that is just starting out. This collection contains the designs that you need for your everyday presentations. All of our PowerPoints are 100 percent editable, so you can customize them to suit your needs. This multi purpose template can be used in various situations. Grab these presentation templates today.
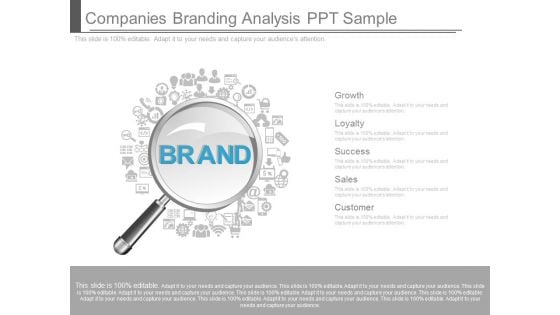
Companies Branding Analysis Ppt Sample
This is a companies branding analysis ppt sample. This is a five stage process. The stages in this process are growth, loyalty, success, sales, customer.
Magnifier Glass Ppt PowerPoint Presentation Visual Aids
This is a magnifier glass ppt powerpoint presentation visual aids. This is a four stage process. The stages in this process are business, strategy, marketing, analysis, success, magnifier glass.

Magnifying Glass Ppt PowerPoint Presentation Gallery Example Introduction
This is a magnifying glass ppt powerpoint presentation gallery example introduction. This is a one stage process. The stages in this process are business, strategy, marketing, analysis, magnifying glass.
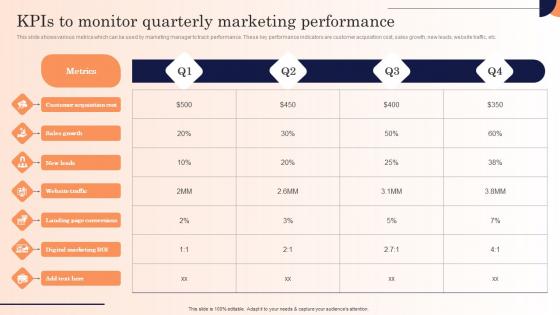
Kpis To Monitor Quarterly Marketing Performance Strategic Marketing Campaign Themes Pdf
This slide shows various metrics which can be used by marketing manager to track performance. These key performance indicators are customer acquisition cost, sales growth, new leads, website traffic, etc.Explore a selection of the finest Kpis To Monitor Quarterly Marketing Performance Strategic Marketing Campaign Themes Pdf here. With a plethora of professionally designed and pre-made slide templates, you can quickly and easily find the right one for your upcoming presentation. You can use our Kpis To Monitor Quarterly Marketing Performance Strategic Marketing Campaign Themes Pdf to effectively convey your message to a wider audience. Slidegeeks has done a lot of research before preparing these presentation templates. The content can be personalized and the slides are highly editable. Grab templates today from Slidegeeks. This slide shows various metrics which can be used by marketing manager to track performance. These key performance indicators are customer acquisition cost, sales growth, new leads, website traffic, etc.
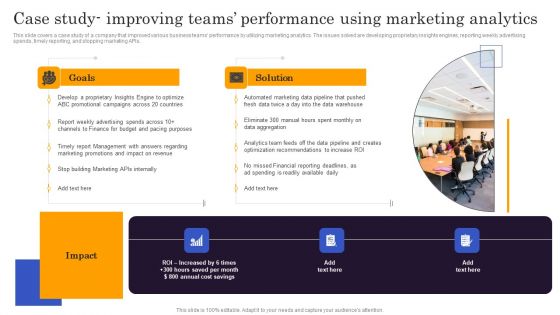
Marketers Guide To Data Analysis Optimization Case Study Improving Teams Performance Using Marketing Professional PDF
This slide covers a case study of a company that improved various business teams performance by utilizing marketing analytics. The issues solved are developing proprietary insights engines, reporting weekly advertising spends, timely reporting, and stopping marketing APIs. Make sure to capture your audiences attention in your business displays with our gratis customizable Marketers Guide To Data Analysis Optimization Case Study Improving Teams Performance Using Marketing Professional PDF. These are great for business strategies, office conferences, capital raising or task suggestions. If you desire to acquire more customers for your tech business and ensure they stay satisfied, create your own sales presentation with these plain slides.
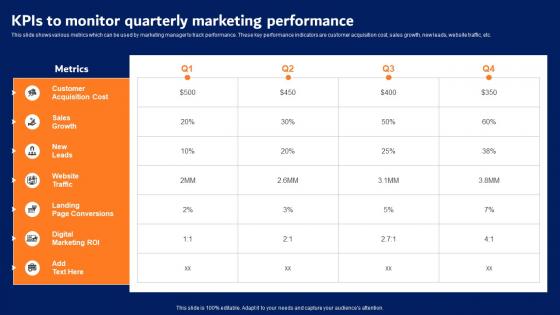
KPIs To Monitor Quarterly Marketing Performance Digital Advertising Strategies Mockup Pdf
This slide shows various metrics which can be used by marketing manager to track performance. These key performance indicators are customer acquisition cost, sales growth, new leads, website traffic, etc. Find a pre designed and impeccable KPIs To Monitor Quarterly Marketing Performance Digital Advertising Strategies Mockup Pdf. The templates can ace your presentation without additional effort. You can download these easy to edit presentation templates to make your presentation stand out from others. So, what are you waiting for Download the template from Slidegeeks today and give a unique touch to your presentation. This slide shows various metrics which can be used by marketing manager to track performance. These key performance indicators are customer acquisition cost, sales growth, new leads, website traffic, etc.
Sales Analysis With Magnifying Glass Vector Icon Ppt PowerPoint Presentation File Inspiration PDF
Presenting this set of slides with name sales analysis with magnifying glass vector icon ppt powerpoint presentation file inspiration pdf. This is a three stage process. The stages in this process are sales analysis with magnifying glass vector icon. This is a completely editable PowerPoint presentation and is available for immediate download. Download now and impress your audience.
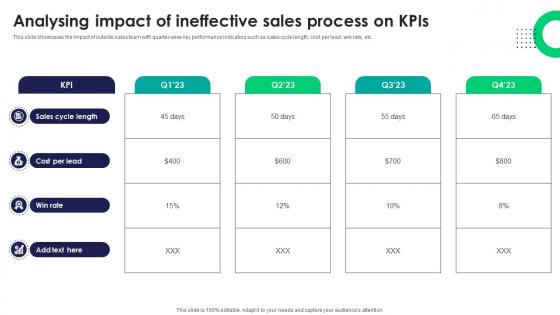
Analysing Impact Of Ineffective Sales Process On Kpis Tactics For Improving Field Sales Team SA SS V
This slide showcases the impact of outside sales team with quarter-wise key performance indicators such as sales cycle length, cost per lead, win rate, etc. Create an editable Analysing Impact Of Ineffective Sales Process On Kpis Tactics For Improving Field Sales Team SA SS V that communicates your idea and engages your audience. Whether you are presenting a business or an educational presentation, pre-designed presentation templates help save time. Analysing Impact Of Ineffective Sales Process On Kpis Tactics For Improving Field Sales Team SA SS V is highly customizable and very easy to edit, covering many different styles from creative to business presentations. Slidegeeks has creative team members who have crafted amazing templates. So, go and get them without any delay. This slide showcases the impact of outside sales team with quarter-wise key performance indicators such as sales cycle length, cost per lead, win rate, etc.
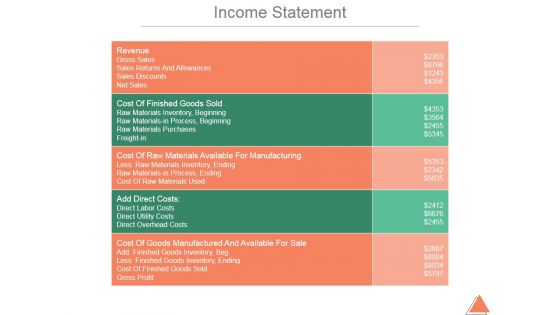
Income Statement Ppt PowerPoint Presentation Background Images
This is a income statement ppt powerpoint presentation background images. This is a five stage process. The stages in this process are revenue, gross sales, sales returns and allowances, sales discounts, net sales.
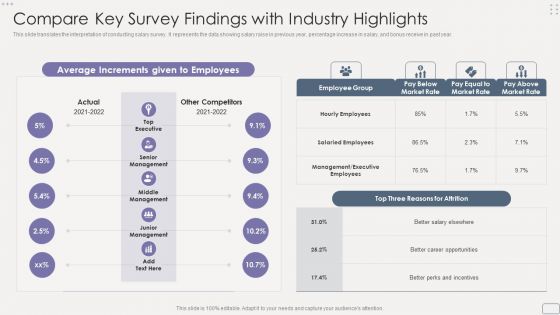
Income Assessment Report Compare Key Survey Findings With Industry Highlights Sample PDF
This slide translates the interpretation of conducting salary survey. It represents the data showing salary raise in previous year, percentage increase in salary, and bonus receive in past year.Deliver an awe inspiring pitch with this creative Income Assessment Report Compare Key Survey Findings With Industry Highlights Sample PDF bundle. Topics like Average Increments, Reasons For Attrition, Junior Management can be discussed with this completely editable template. It is available for immediate download depending on the needs and requirements of the user.
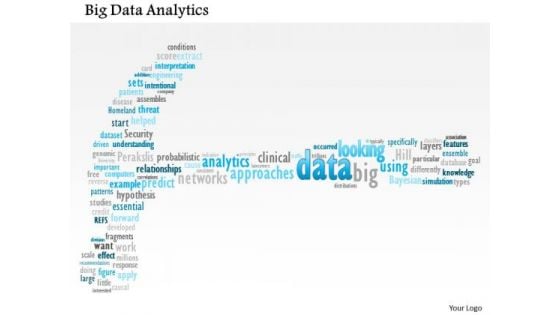
Business Framework Big Data Analytics PowerPoint Presentation
This unique power point diagram slide has been crafted with big data analytics. This data analytics is used to improve predictions and support decision making. Use this image slide for big data analysis related presentations.
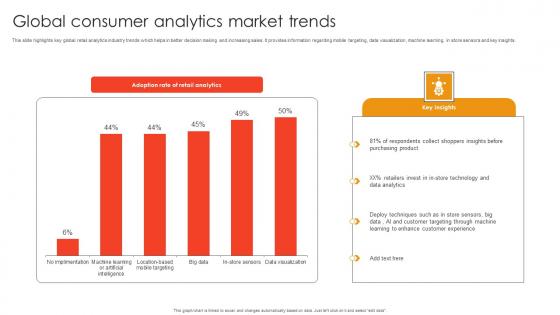
Global Consumer Analytics Market Trends Template Pdf
This slide highlights key global retail analytics industry trends which helps in better decision making and increasing sales. It provides information regarding mobile targeting, data visualization, machine learning, in store sensors and key insights. Pitch your topic with ease and precision using this Global Consumer Analytics Market Trends Template Pdf. This layout presents information on Respondents Collect Shoppers, Retailers Invest Store, Deploy Techniques Store Sensors. It is also available for immediate download and adjustment. So, changes can be made in the color, design, graphics or any other component to create a unique layout. This slide highlights key global retail analytics industry trends which helps in better decision making and increasing sales. It provides information regarding mobile targeting, data visualization, machine learning, in store sensors and key insights.
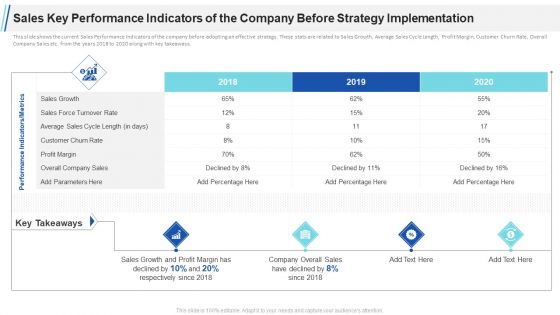
Sales Key Performance Indicators Of The Company Before Strategy Implementation Growth Ppt Infographic Template Microsoft PDF
This slide shows the current Sales Performance Indicators of the company before adopting an effective strategy. These stats are related to Sales Growth, Average Sales Cycle Length, Profit Margin, Customer Churn Rate, Overall Company Sales etc. from the years 2018 to 2020 along with key takeaways. Deliver and pitch your topic in the best possible manner with this sales key performance indicators of the company before strategy implementation growth ppt infographic template microsoft pdf. Use them to share invaluable insights on performance indicators metrics, sales growth, customer churn rate, profit margin, 2018 to 2020 and impress your audience. This template can be altered and modified as per your expectations. So, grab it now.
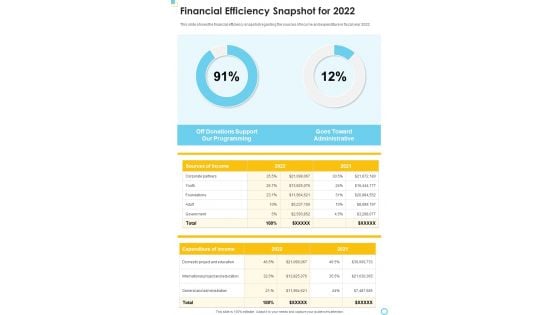
Financial Efficiency Snapshot For 2022 One Pager Documents
This slide shows the financial efficiency snapshot regarding the sources of income and expenditure in fiscal year 2022. Presenting you an exemplary Financial Efficiency Snapshot For 2022 One Pager Documents. Our one-pager comprises all the must-have essentials of an inclusive document. You can edit it with ease, as its layout is completely editable. With such freedom, you can tweak its design and other elements to your requirements. Download this Financial Efficiency Snapshot For 2022 One Pager Documents brilliant piece now.
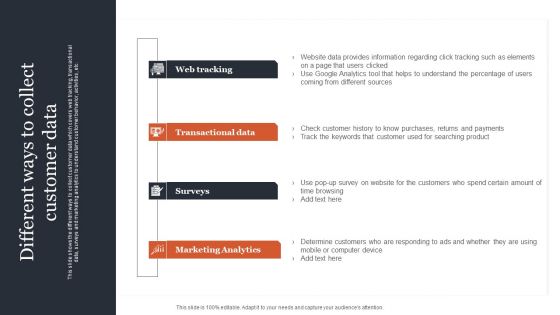
CRM Administration To Reduce Churn Rate Different Ways To Collect Customer Data Demonstration PDF
This slide shows the different ways to collect customer data which covers web tracking, transactional data, surveys and marketing analytics to understand customer behavior, activities, etc. Want to ace your presentation in front of a live audience Our CRM Administration To Reduce Churn Rate Different Ways To Collect Customer Data Demonstration PDF can help you do that by engaging all the users towards you. Slidegeeks experts have put their efforts and expertise into creating these impeccable powerpoint presentations so that you can communicate your ideas clearly. Moreover, all the templates are customizable, and easy to edit and downloadable. Use these for both personal and commercial use.
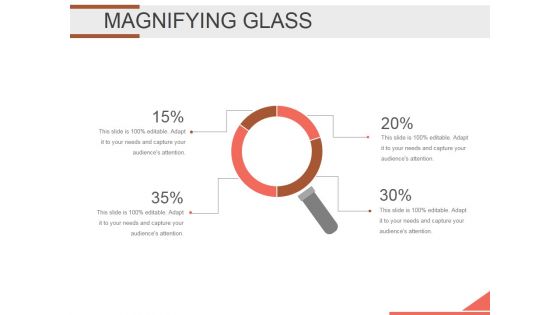
Magnifying Glass Ppt PowerPoint Presentation Visuals
This is a magnifying glass ppt powerpoint presentation visuals. This is a four stage process. The stages in this process are magnifier glass, search, marketing, sales, analysis, business.
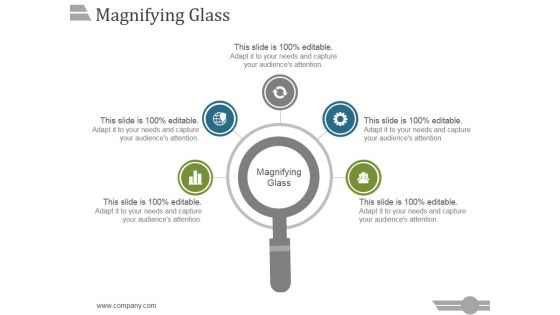
Magnifying Glass Ppt PowerPoint Presentation Templates
This is a magnifying glass ppt powerpoint presentation templates. This is a five stage process. The stages in this process are business, strategy, marketing, analysis, success, magnifying glass.
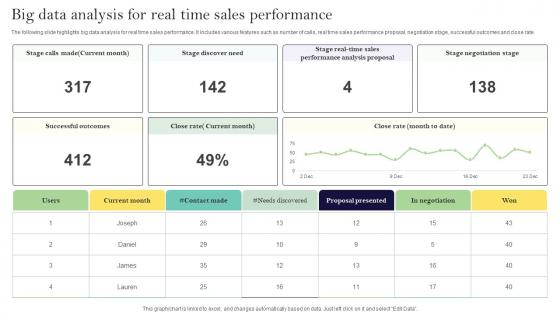
Big Data Analysis For Real Time Sales Performance Ppt Show Format Ideas Pdf
The following slide highlights big data analysis for real time sales performance. It includes various features such as number of calls, real time sales performance proposal, negotiation stage, successful outcomes and close rate. Showcasing this set of slides titled Big Data Analysis For Real Time Sales Performance Ppt Show Format Ideas Pdf. The topics addressed in these templates are Negotiation Stage, Successful Outcomes, Close Rate. All the content presented in this PPT design is completely editable. Download it and make adjustments in color, background, font etc. as per your unique business setting. The following slide highlights big data analysis for real time sales performance. It includes various features such as number of calls, real time sales performance proposal, negotiation stage, successful outcomes and close rate.
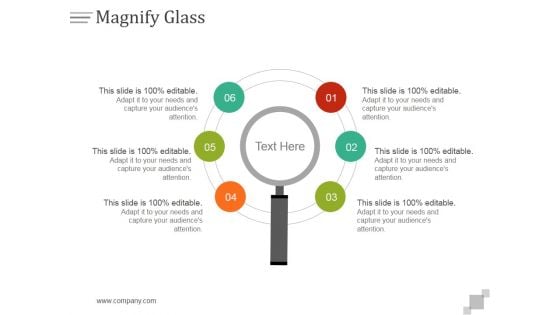
Magnify Glass Ppt PowerPoint Presentation Deck
This is a magnify glass ppt powerpoint presentation deck. This is a six stage process. The stages in this process are magnifier glass, search, analysis, management, business.
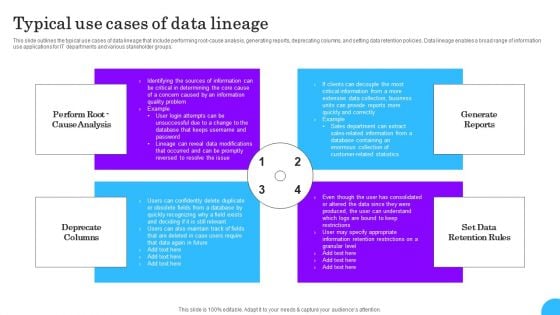
Comprehensive Analysis Of Different Data Lineage Classification Typical Use Cases Of Data Lineage Themes PDF
This slide outlines the typical use cases of data lineage that include performing root cause analysis, generating reports, deprecating columns, and setting data retention policies. Data lineage enables a broad range of information use applications for IT departments and various stakeholder groups. Make sure to capture your audiences attention in your business displays with our gratis customizable Comprehensive Analysis Of Different Data Lineage Classification Typical Use Cases Of Data Lineage Themes PDF. These are great for business strategies, office conferences, capital raising or task suggestions. If you desire to acquire more customers for your tech business and ensure they stay satisfied, create your own sales presentation with these plain slides.
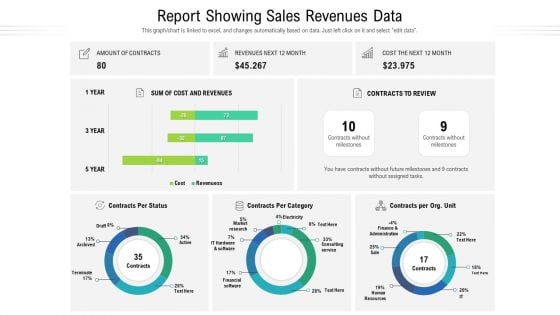
Report Showing Sales Revenues Data Ppt Show Backgrounds PDF
This graph or chart is linked to excel, and changes automatically based on data. Just left click on it and select edit data. Showcasing this set of slides titled report showing sales revenues data ppt show backgrounds pdf. The topics addressed in these templates are cost and revenues, market research, finance and administration. All the content presented in this PPT design is completely editable. Download it and make adjustments in color, background, font etc. as per your unique business setting.
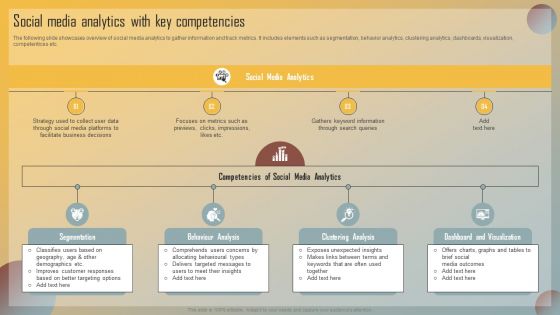
Guide For Marketing Analytics To Improve Decisions Social Media Analytics With Key Competencies Pictures PDF
The following slide showcases overview of social media analytics to gather information and track metrics. It includes elements such as segmentation, behavior analytics, clustering analytics, dashboards, visualization, competentices etc. Slidegeeks is here to make your presentations a breeze with Guide For Marketing Analytics To Improve Decisions Social Media Analytics With Key Competencies Pictures PDF With our easy to use and customizable templates, you can focus on delivering your ideas rather than worrying about formatting. With a variety of designs to choose from, you are sure to find one that suits your needs. And with animations and unique photos, illustrations, and fonts, you can make your presentation pop. So whether you are giving a sales pitch or presenting to the board, make sure to check out Slidegeeks first.
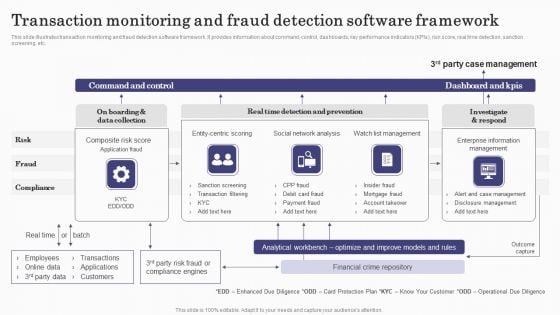
Deploying Banking Transaction Transaction Monitoring And Fraud Detection Software Introduction PDF
This slide illustrates transaction monitoring and fraud detection software framework. It provides information about command, control, dashboards, key performance indicators KPIs, risk score, real time detection, sanction screening, etc. Slidegeeks is here to make your presentations a breeze with Deploying Banking Transaction Transaction Monitoring And Fraud Detection Software Introduction PDF With our easy-to-use and customizable templates, you can focus on delivering your ideas rather than worrying about formatting. With a variety of designs to choose from, youre sure to find one that suits your needs. And with animations and unique photos, illustrations, and fonts, you can make your presentation pop. So whether youre giving a sales pitch or presenting to the board, make sure to check out Slidegeeks first.
Executing Automotive Marketing Tactics For Sales Boost Magnifying Glass Topics PDF
This modern and well arranged Executing Automotive Marketing Tactics For Sales Boost Magnifying Glass Topics PDF provides lots of creative possibilities. It is very simple to customize and edit with the Powerpoint Software. Just drag and drop your pictures into the shapes. All facets of this template can be edited with Powerpoint no extra software is necessary. Add your own material, put your images in the places assigned for them, adjust the colors, and then you can show your slides to the world, with an animated slide included.
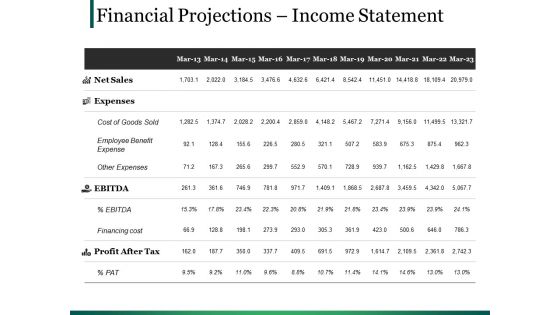
Financial Projections Income Statement Ppt PowerPoint Presentation Model Format
This is a financial projections income statement ppt powerpoint presentation model format. This is a two stage process. The stages in this process are tables, marketing, planning, strategy, finance.
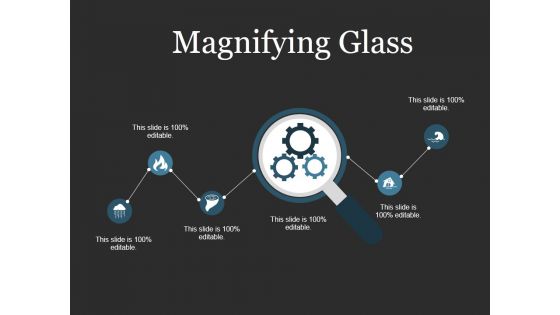
Magnifying Glass Ppt PowerPoint Presentation File Introduction
This is a magnifying glass ppt powerpoint presentation file introduction. This is a five stage process. The stages in this process are magnifier glass, search, marketing, analysis, process, business.
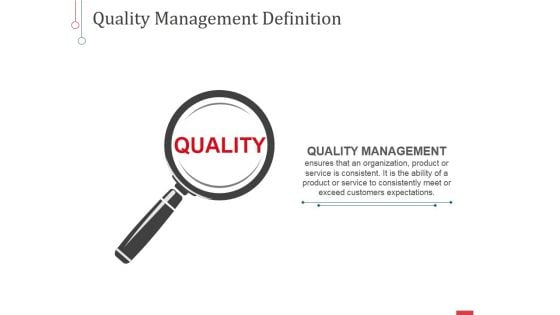
Quality Ppt PowerPoint Presentation Infographic Template Sample
This is a quality ppt powerpoint presentation infographic template sample. This is a one stage process. The stages in this process are quality management, magnifier, search, marketing, strategy, analysis, business.
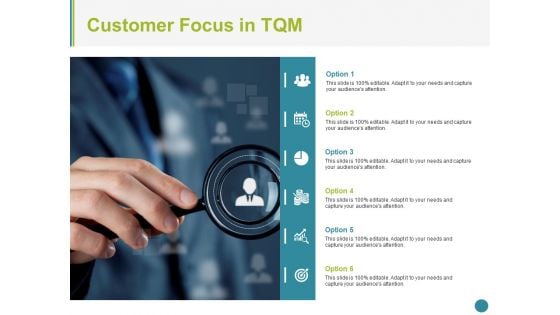
Customer Focus In Tqm Ppt PowerPoint Presentation Portfolio Graphic Images
This is a Customer Focus In Tqm Ppt PowerPoint Presentation Portfolio Graphic Images. This is a six stage process. The stages in this process are business, icons, marketing, strategy, analysis.
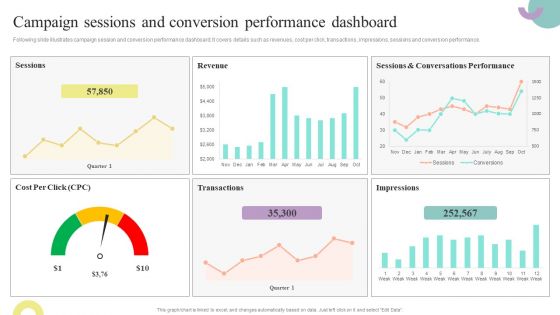
Comprehensive Guide To Enhance Campaign Sessions And Conversion Performance Portrait PDF
Following slide illustrates campaign session and conversion performance dashboard. It covers details such as revenues, cost per click, transactions, impressions, sessions and conversion performance. Slidegeeks is here to make your presentations a breeze with Comprehensive Guide To Enhance Campaign Sessions And Conversion Performance Portrait PDF With our easy-to-use and customizable templates, you can focus on delivering your ideas rather than worrying about formatting. With a variety of designs to choose from, youre sure to find one that suits your needs. And with animations and unique photos, illustrations, and fonts, you can make your presentation pop. So whether youre giving a sales pitch or presenting to the board, make sure to check out Slidegeeks first.

Big Data Types Analyzed To Drive Valuable Developing Strategic Insights Using Big Data Analytics SS V
This slide showcases various types of big data that is used for data analysis which helps in creating deeper insights to enhance business operations. It provides information regarding structure , unstructured and semi structured data. Make sure to capture your audiences attention in your business displays with our gratis customizable Big Data Types Analyzed To Drive Valuable Developing Strategic Insights Using Big Data Analytics SS V. These are great for business strategies, office conferences, capital raising or task suggestions. If you desire to acquire more customers for your tech business and ensure they stay satisfied, create your own sales presentation with these plain slides. This slide showcases various types of big data that is used for data analysis which helps in creating deeper insights to enhance business operations. It provides information regarding structure , unstructured and semi structured data.
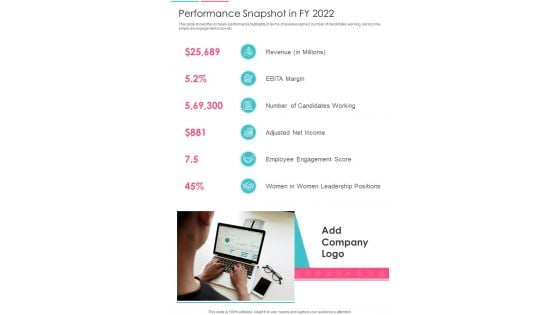
Performance Snapshot In FY 2022 One Pager Documents
This slide shows the company performance highlights in terms of revenue earned, number of candidates working, net income, employee engagement score etc. Presenting you an exemplary Performance Snapshot In FY 2022 One Pager Documents. Our one-pager comprises all the must-have essentials of an inclusive document. You can edit it with ease, as its layout is completely editable. With such freedom, you can tweak its design and other elements to your requirements. Download this Performance Snapshot In FY 2022 One Pager Documents brilliant piece now.

Data Mining Techniques Regression Analysis Data Warehousing And Data Mining Guide AI SS V
This slide showcases regression analysis method of data mining to help businesses forecasting and tracking useful patterns for their operations. It provides details about linear, polynomial, logistic, ridge, lasso, marketing planning, crop yield, etc. Make sure to capture your audiences attention in your business displays with our gratis customizable Data Mining Techniques Regression Analysis Data Warehousing And Data Mining Guide AI SS V. These are great for business strategies, office conferences, capital raising or task suggestions. If you desire to acquire more customers for your tech business and ensure they stay satisfied, create your own sales presentation with these plain slides. This slide showcases regression analysis method of data mining to help businesses forecasting and tracking useful patterns for their operations. It provides details about linear, polynomial, logistic, ridge, lasso, marketing planning, crop yield, etc.
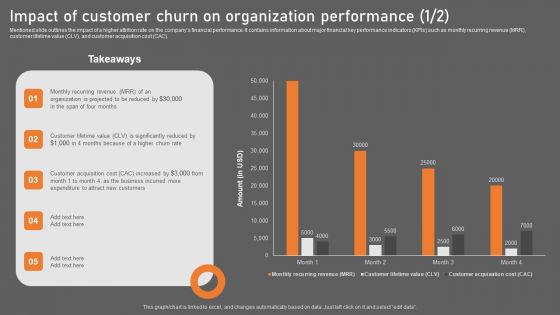
Impact Of Customer Churn On Organization Performance Background PDF
Mentioned slide outlines the impact of a higher attrition rate on the companys financial performance. It contains information about major financial key performance indicators KPIs such as monthly recurring revenue MRR, customer lifetime value CLV, and customer acquisition cost CAC. Take your projects to the next level with our ultimate collection of Impact Of Customer Churn On Organization Performance Background PDF. Slidegeeks has designed a range of layouts that are perfect for representing task or activity duration, keeping track of all your deadlines at a glance. Tailor these designs to your exact needs and give them a truly corporate look with your own brand colors they will make your projects stand out from the rest.
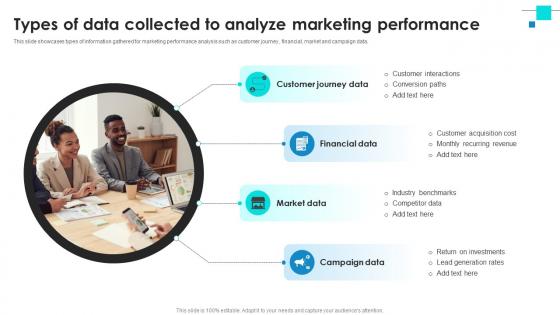
Project Benchmarking Process Types Of Data Collected To Analyze Marketing Performance CRP DK SS V
This slide showcases types of information gathered for marketing performance analysis such as customer journey , financial, market and campaign data. Slidegeeks is here to make your presentations a breeze with Project Benchmarking Process Types Of Data Collected To Analyze Marketing Performance CRP DK SS V With our easy-to-use and customizable templates, you can focus on delivering your ideas rather than worrying about formatting. With a variety of designs to choose from, you are sure to find one that suits your needs. And with animations and unique photos, illustrations, and fonts, you can make your presentation pop. So whether you are giving a sales pitch or presenting to the board, make sure to check out Slidegeeks first This slide showcases types of information gathered for marketing performance analysis such as customer journey , financial, market and campaign data.
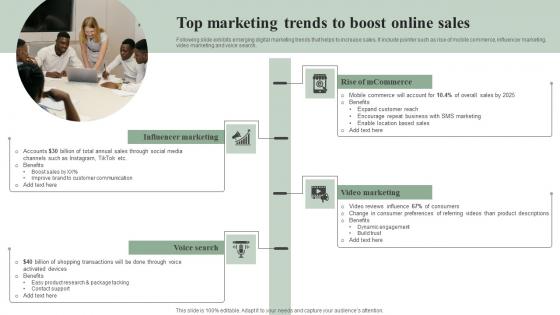
Top Marketing Trends To Boost Online Sales Efficient Marketing Tactics Clipart Pdf
Following slide exhibits emerging digital marketing trends that helps to increase sales. It include pointer such as rise of mobile commerce, influencer marketing, video marketing and voice search. Get a simple yet stunning designed Top Marketing Trends To Boost Online Sales Efficient Marketing Tactics Clipart Pdf. It is the best one to establish the tone in your meetings. It is an excellent way to make your presentations highly effective. So, download this PPT today from Slidegeeks and see the positive impacts. Our easy-to-edit Top Marketing Trends To Boost Online Sales Efficient Marketing Tactics Clipart Pdf can be your go-to option for all upcoming conferences and meetings. So, what are you waiting for Grab this template today. Following slide exhibits emerging digital marketing trends that helps to increase sales. It include pointer such as rise of mobile commerce, influencer marketing, video marketing and voice search.
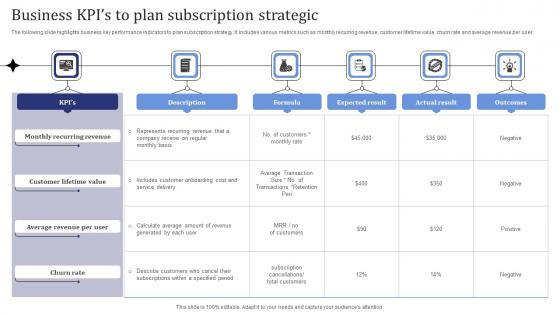
Business Kpis To Plan Subscription Strategic Pictures Pdf
The following slide highlights business key performance indicators to plan subscription strategy. It includes various metrics such as monthly recurring revenue, customer lifetime value, churn rate and average revenue per user. Showcasing this set of slides titled Business Kpis To Plan Subscription Strategic Pictures Pdf. The topics addressed in these templates are Monthly Recurring Revenue, Customer Lifetime Value, Churn Rate. All the content presented in this PPT design is completely editable. Download it and make adjustments in color, background, font etc. as per your unique business setting. The following slide highlights business key performance indicators to plan subscription strategy. It includes various metrics such as monthly recurring revenue, customer lifetime value, churn rate and average revenue per user.
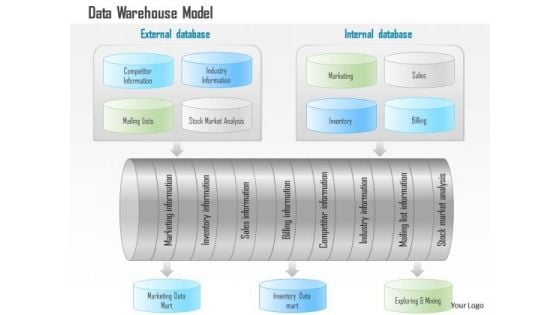
Business Diagram Data Warehouse Model With Analytics And Business Intelligence Ppt Slide
This technology diagram has been designed with graphic of data warehouse model. This model depicts concept of business intelligence and analysis. Download this editable slide build an exclusive presentation.


 Continue with Email

 Home
Home


