Turnover Data
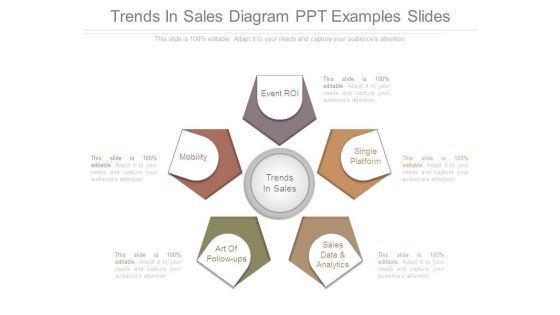
Trends In Sales Diagram Ppt Examples Slides
This is a trends in sales diagram ppt examples slides. This is a five stage process. The stages in this process are event roi, single platform, sales data and analytics, art of follow ups, mobility, trends in sales.
Business Diagram Icons And Charts For Business Growth Presentation Template
Our above slide contains graphics of business charts and icons. It helps to display business reports and analysis. Use this diagram to impart more clarity to data and to create more sound impact on viewers.
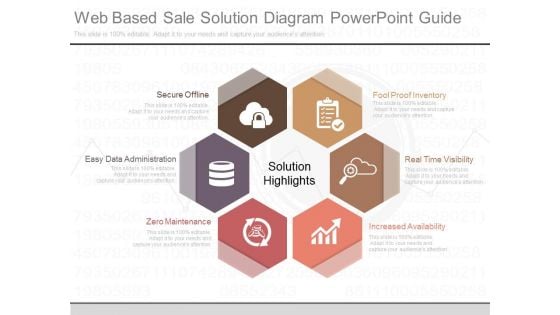
Web Based Sale Solution Diagram Powerpoint Guide
This is a web based sale solution diagram powerpoint guide. This is a six stage process. The stages in this process are fool proof inventory, real time visibility, increased availability, zero maintenance, easy data administration, secure offline.
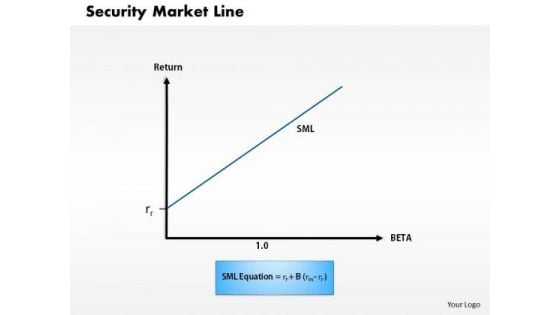
Business Framework Security Market Line 1 PowerPoint Presentation
This diagram displays graph of security market line. You can use line graph to plot changes in data over time, such as monthly revenue and earnings changes or daily changes in stock market prices.
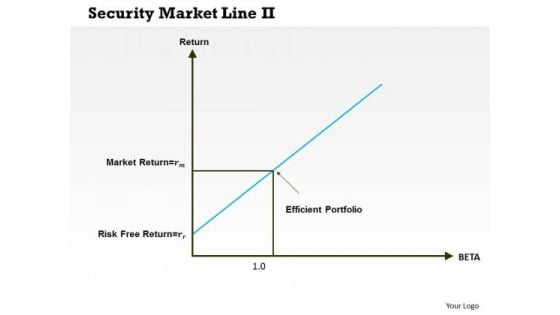
Business Framework Security Market Line 11 PowerPoint Presentation
This diagram displays graph of security market line. You can use line graph to plot changes in data over time, such as monthly revenue and earnings changes or daily changes in stock market prices.
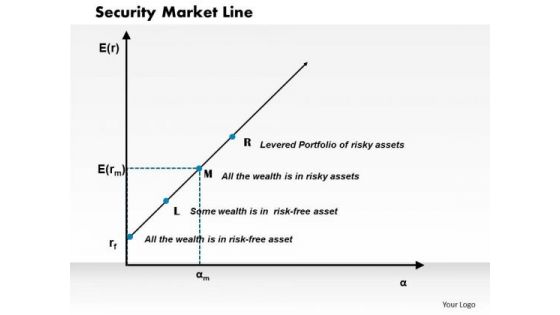
Business Framework Security Market Line PowerPoint Presentation
This diagram displays graph of security market line. You can use line graph to plot changes in data over time, such as monthly revenue and earnings changes or daily changes in stock market prices.
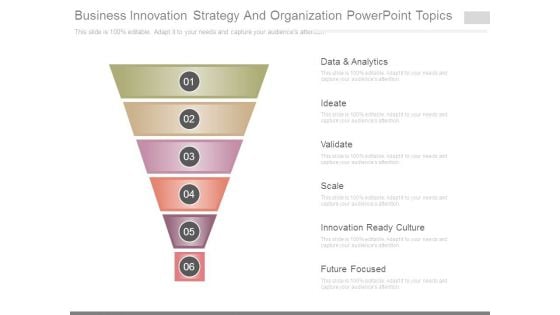
Business Innovation Strategy And Organization Powerpoint Topics
This is a business innovation strategy and organization powerpoint topics. This is a six stage process. The stages in this process are data and analytics, ideate, validate, scale, innovation ready culture, future focused.

Business Diagram Three Darts For Text Representation Presentation Template
Graphic of three darts has been used to design this power point template. This PPT contains the concept of data representation. Use this PPT and build an exclusive presentation for your viewers.
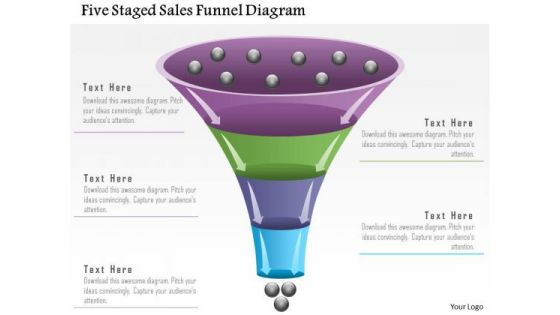
Business Diagram Five Staged Sales Funnel Diagram Presentation Template
Our above slide displays five staged sales funnel diagram. Download our above diagram to express information in a visual way. Use this diagram and get good comments for data related presentations.
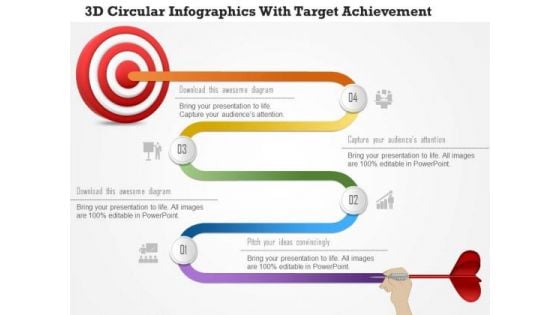
Business Diagram 3d Circular Infographics With Target Achievement PowerPoint Template
This power point template has been crafted with graphic of 3d circular info graphics. This PPT slide contains the concept of data representation and target achievement. This PPT can be used for target and success related presentations.
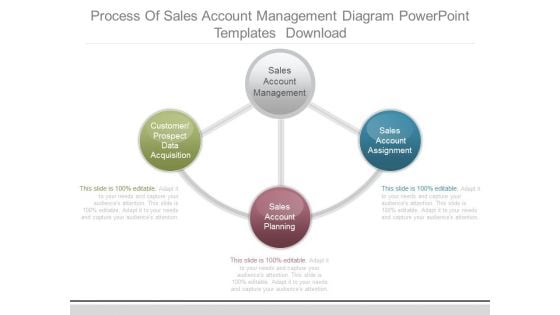
Process Of Sales Account Management Diagram Powerpoint Templates Download
This is a process of sales account management diagram powerpoint templates download. This is a three stage process. The stages in this process are sales account management, customer prospect data acquisition, sales account assignment, sales account planning.
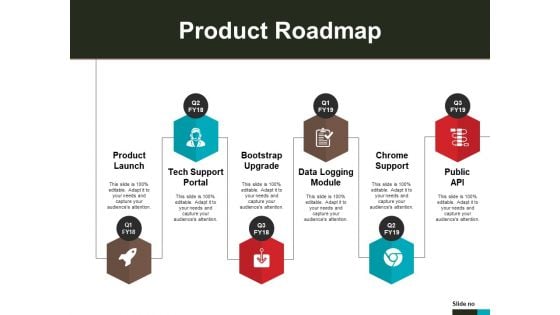
Product Roadmap Template 2 Ppt PowerPoint Presentation Infographic Template Information
This is a product roadmap template 2 ppt powerpoint presentation infographic template information. This is a six stage process. The stages in this process are product launch, tech support portal, bootstrap upgrade, data logging module, chrome support.
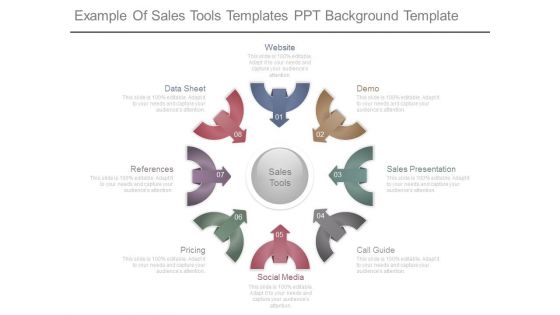
Example Of Sales Tools Templates Ppt Background Template
This is a example of sales tools templates ppt background template. This is a eight stage process. The stages in this process are sales tools, data sheet, references, pricing, social media, call guide, sales presentation, demo, website.
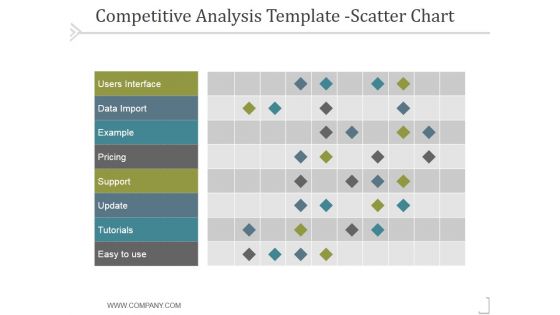
Competitive Analysis Scatter Chart Template 2 Ppt PowerPoint Presentation Files
This is a competitive analysis scatter chart template 2 ppt powerpoint presentation files. This is a nine stage process. The stages in this process are users interface, data import, example, pricing, support, update.
Illustration For Business Steps With Icons Powerpoint Template
Our above PowerPoint slide contains graphics of four text boxes with icons. Download this business slide to illustrate four business steps. Use this diagram to impart more clarity to data and to create more sound impact on viewers.
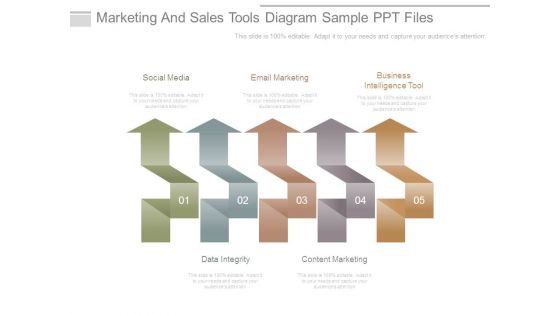
Marketing And Sales Tools Diagram Sample Ppt Files
This is a marketing and sales tools diagram sample ppt files. This is a five stage process. The stages in this process are social media, email marketing, business intelligence tool, data integrity, content marketing.
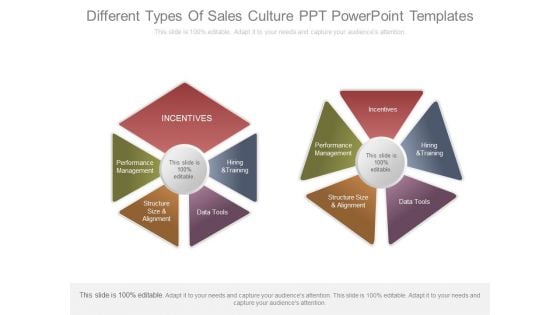
Different Types Of Sales Culture Ppt Powerpoint Templates
This is a different types of sales culture ppt powerpoint templates. This is a two stage process. The stages in this process are incentives, performance management, structure size and alignment, data tools, hiring and training.
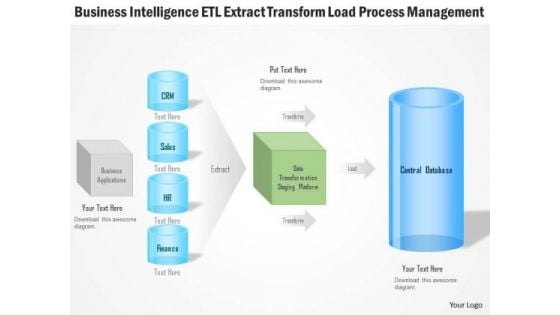
Business Diagram Business Intelligence Etl Extract Transform Load Process Management Ppt Slide
Explain the load process management and ETL extract transform with this unique PPT. This PPT contains the graphic of computer server and data base with connectivity. This PPT can be used for business intelligence related topics in any presentation.
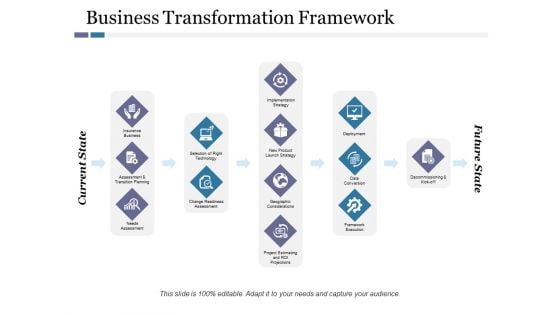
Business Transformation Framework Ppt PowerPoint Presentation Gallery Summary
This is a business transformation framework ppt powerpoint presentation gallery summary. This is a five stage process. The stages in this process are implementation strategy, new product launch strategy, selection of right technology, deployment, data conversion, framework execution.
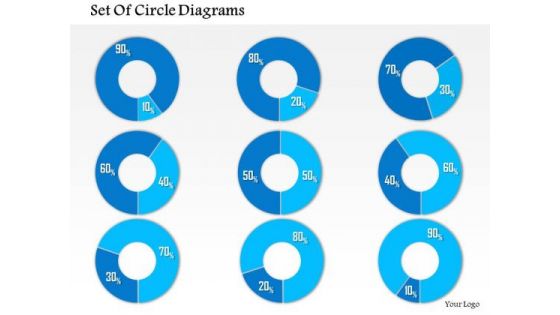
Business Framework 10 Percent To 90 Percent PowerPoint Presentation
This business diagram has been designed with graphic of multiple pie graphs. This diagram slide contains the concept of result analysis with percentage values. Use this diagram to present and compare data in an impressive manner
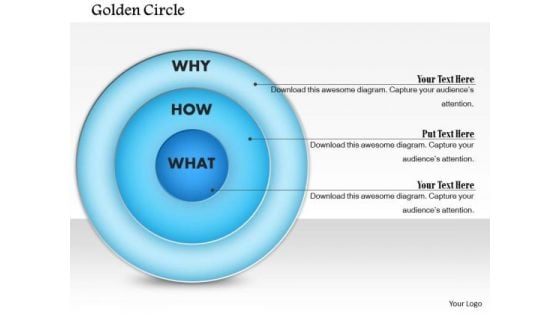
Business Framework Golden Circle PowerPoint Presentation
This business diagram has been designed with graphic of blue colored circle. This business slide is suitable to display data analysis in any business presentation. Use this slide to build a unique presentations for your viewers
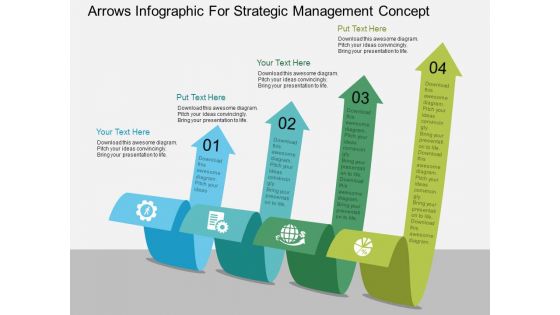
Arrows Infographic For Strategic Management Concept Powerpoint Template
Our above PPT slide contains four curved arrows infographic design. This business diagram helps to depict business information for strategic management. Use this diagram to impart more clarity to data and to create more sound impact on viewers.
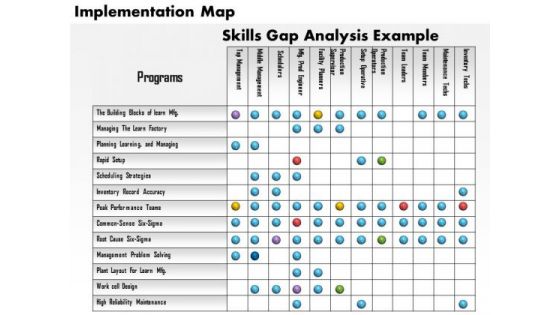
Business Framework Implementation Map PowerPoint Presentation
Graphic of implementation map has been used to decorate this power point diagram slide. This PPT slide contains the concept of data representation. This PPT diagram slide can be used for business and finance related presentations.

Business Framework 3 Axis Graph Diagram PowerPoint Presentation
This business diagram displays 3 axis graphs with cubes. This editable slide contains the concept of business and success. Use this diagram in your business presentations to display data in graphical manner.

Business Framework Battery Charge Loading Bar PowerPoint Presentation
This business diagram displays bar graph of five battery cells. This business slide contains the concept of business growth shown in multiple levels. Use this diagram to present and compare data in an impressive manner.
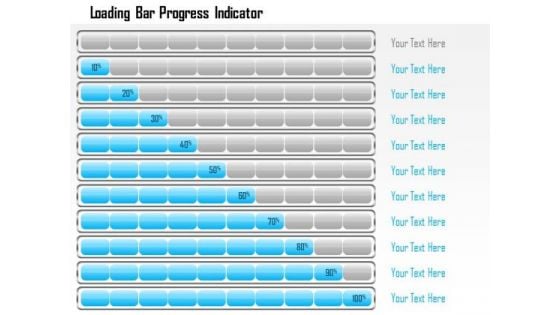
Business Framework Loading Bar Progress Indicator PowerPoint Presentation
This business diagram displays bar progress indicators. This business slide contains the concept of business growth shown in multiple levels. Use this diagram to present and compare data in an impressive manner.
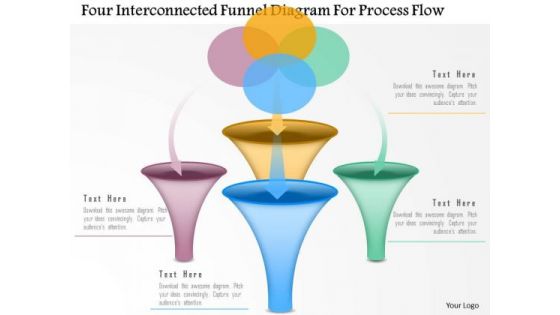
Business Diagram Four Interconnected Funnel Diagram For Process Flow Presentation Template
Graphic of four interconnected funnel diagram has been used to design this power point template diagram. This PPT diagram contains the concept of data and process flow. Use this PPT for marketing and business related presentations.

Business Diagram Three Interconnected Funnel Diagram Presentation Template
Graphic of three interconnected funnel diagram has been used to design this power point template diagram. This PPT diagram contains the concept of data and process flow. Use this PPT for marketing and business related presentations.
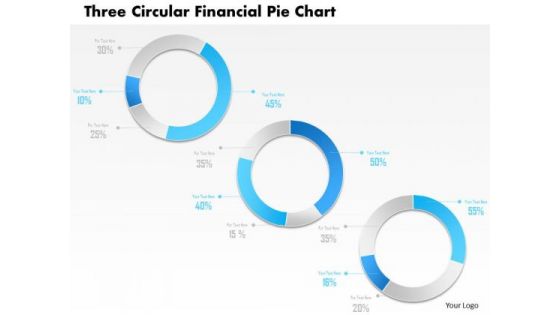
Business Diagram Three Circular Financial Pie Chart PowerPoint Template
This power point template has been designed with graphic of three circular pie chart. This pie chart is suitable for financial data representation. Use this PPt for your business and finance related presentations.
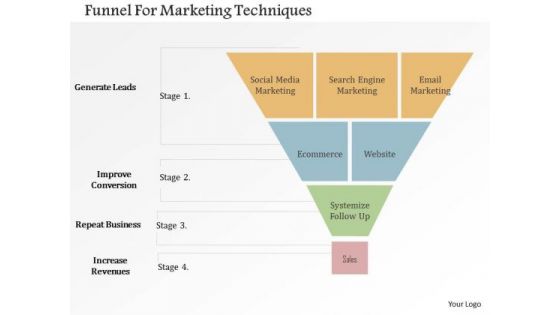
Business Diagram Funnel For Marketing Techniques Presentation Template
Our above slide contains graphics of funnel diagram. It helps to exhibit marketing techniques. Use this diagram to impart more clarity to data and to create more sound impact on viewers.
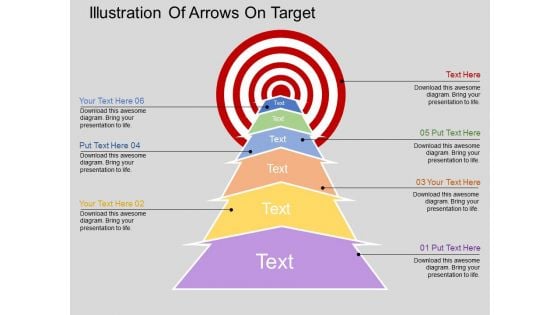
Illustration Of Arrows On Target Powerpoint Templates
Our above slide illustrates arrow steps towards target. This PowerPoint template may be used to exhibit target planning. Use this diagram to impart more clarity to data and to create more sound impact on viewers.
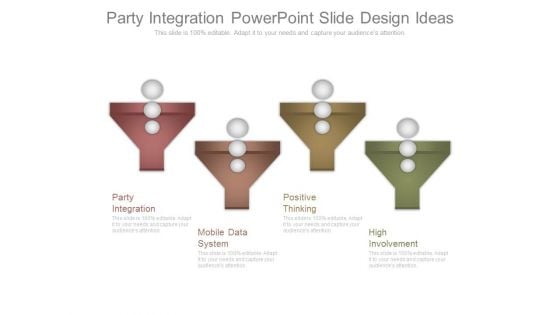
Party Integration Powerpoint Slide Design Ideas
This is a party integration powerpoint slide design ideas. This is a four stage process. The stages in this process are party integration, mobile data system, positive thinking, high involvement.
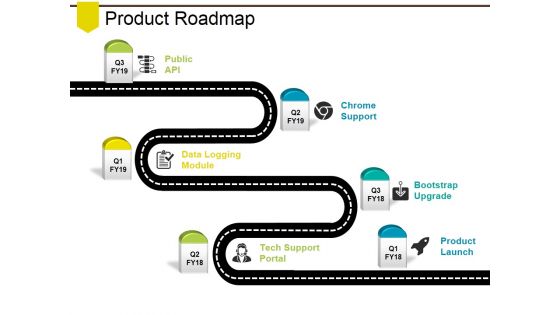
Product Roadmap Ppt PowerPoint Presentation Portfolio Design Ideas
This is a product roadmap ppt powerpoint presentation portfolio design ideas. This is a six stage process. The stages in this process are product launch, tech support portal, bootstrap upgrade, data logging module, chrome support.

Statistical Tools For Evidence Statistical Analytics In Building Material Company
This slide represents the concise overview of the problem, the proposed solution, and the achieved result for using data analytics in building material manufacturing company. The outcomes are enhanced sales productivity, identify relevant data sources, etc. Slidegeeks is one of the best resources for PowerPoint templates. You can download easily and regulate Statistical Tools For Evidence Statistical Analytics In Building Material Company for your personal presentations from our wonderful collection. A few clicks is all it takes to discover and get the most relevant and appropriate templates. Use our Templates to add a unique zing and appeal to your presentation and meetings. All the slides are easy to edit and you can use them even for advertisement purposes. This slide represents the concise overview of the problem, the proposed solution, and the achieved result for using data analytics in building material manufacturing company. The outcomes are enhanced sales productivity, identify relevant data sources, etc.
Infographic Banners With Bulb Target And Globe Icons Powerpoint Templates
Our above slide contains diagram of three banners. It also contains icons of bulb, target and globe. Use this diagram to impart more clarity to data and to create more sound impact on viewers.
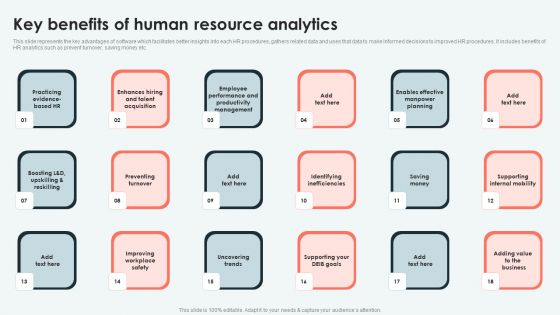
Analyzing And Deploying Key Benefits Of Human Resource Analytics Mockup PDF
This slide represents the key advantages of software which facilitates better insights into each HR procedures, gathers related data and uses that data to make informed decisions to improved HR procedures. It includes benefits of HR analytics such as prevent turnover, saving money etc. Present like a pro with Analyzing And Deploying Key Benefits Of Human Resource Analytics Mockup PDF Create beautiful presentations together with your team, using our easy-to-use presentation slides. Share your ideas in real-time and make changes on the fly by downloading our templates. So whether youre in the office, on the go, or in a remote location, you can stay in sync with your team and present your ideas with confidence. With Slidegeeks presentation got a whole lot easier. Grab these presentations today.
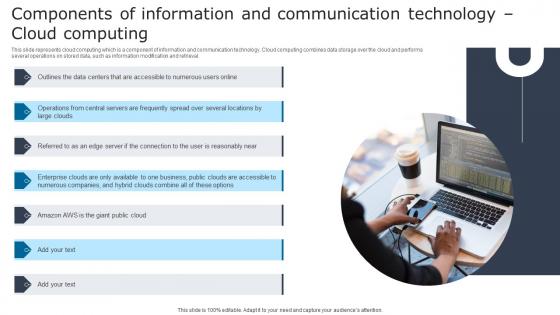
Components Information Communication Digital Signage In Internal Communication Channels Elements Pdf
This slide represents cloud computing which is a component of information and communication technology. Cloud computing combines data storage over the cloud and performs several operations on stored data, such as information modification and retrieval. Make sure to capture your audiences attention in your business displays with our gratis customizable Components Information Communication Digital Signage In Internal Communication Channels Elements Pdf. These are great for business strategies, office conferences, capital raising or task suggestions. If you desire to acquire more customers for your tech business and ensure they stay satisfied, create your own sales presentation with these plain slides. This slide represents cloud computing which is a component of information and communication technology. Cloud computing combines data storage over the cloud and performs several operations on stored data, such as information modification and retrieval.
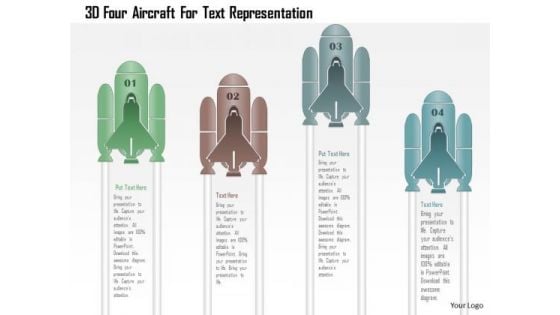
Business Diagram 3d Four Aircraft For Text Representation PowerPoint Template
Graphic of 3d four aircraft text boxes has been used to design this power point template. This PPT slide contains the concept of data flow. Use this PPT slide for business and sales related presentations.
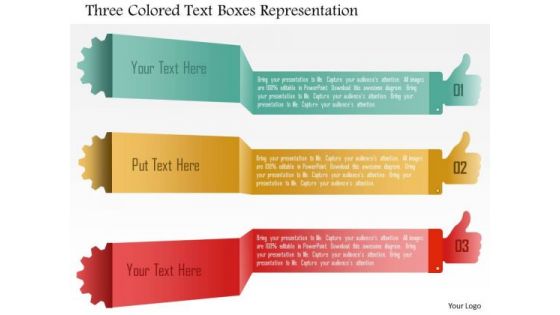
Business Diagram Three Colored Text Boxes Representation PowerPoint Template
Three colored text boxes diagram has been used to design this power point template. This PPT contains the concept of process based data representation. This PPT is suitable for business and sales related presentations.
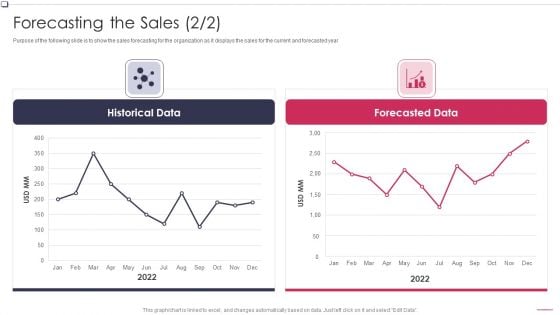
Business To Business Promotion Sales Lead Forecasting The Sales Structure PDF
Purpose of the following slide is to show the sales forecasting for the organization as it displays the sales for the current and forecasted year.Deliver an awe inspiring pitch with this creative Business To Business Promotion Sales Lead Forecasting The Sales Structure PDF bundle. Topics like Forecasting Sales, Historical Data, Forecasted Data can be discussed with this completely editable template. It is available for immediate download depending on the needs and requirements of the user.
Bulb With Business Analysis Icons Powerpoint Templates
This PowerPoint slide contains graphics of bulb diagram with icons. It helps to exhibit concepts of sales planning. Use this diagram to impart more clarity to data and to create more sound impact on viewers.
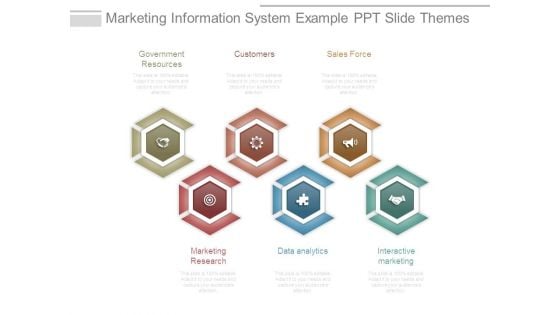
Marketing Information System Example Ppt Slide Themes
This is a marketing information system example ppt slide themes. This is a six stage process. The stages in this process are government resources, customers, sales force, marketing research, data analytics, interactive marketing.
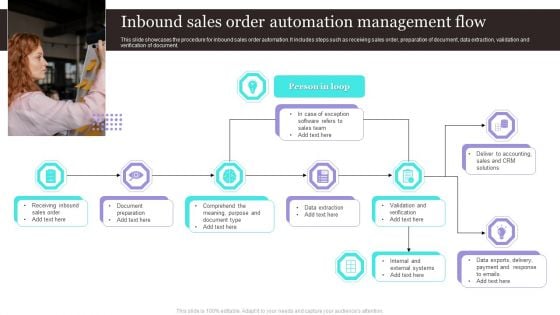
Inbound Sales Order Automation Management Flow Background PDF
This slide showcases the procedure for inbound sales order automation. It includes steps such as receiving sales order, preparation of document, data extraction, validation and verification of document.Pitch your topic with ease and precision using this Inbound Sales Order Automation Management Flow Background PDF. This layout presents information on Receiving Inbound, Software Refers, Data Extraction. It is also available for immediate download and adjustment. So, changes can be made in the color, design, graphics or any other component to create a unique layout.
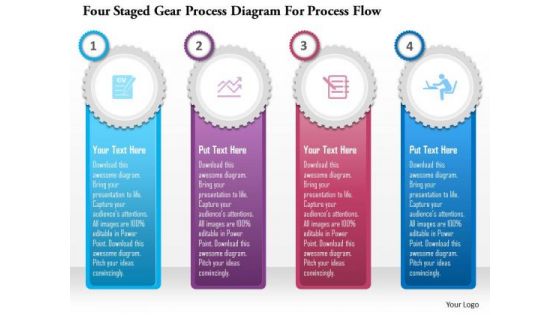
Business Diagram Four Staged Gear Process Diagram For Process Flow Presentation Template
Graphic of four staged gear process diagram has been used to design this power point template diagram. This PPT diagram contains the concept of data and process flow. Use this PPT for marketing and sales related presentations.
Colorful Bulb With Three Icons Powerpoint Templates
This PowerPoint slide contains graphics of bulb diagram with icons. It helps to exhibit concepts of sales planning. Use this diagram to impart more clarity to data and to create more sound impact on viewers.
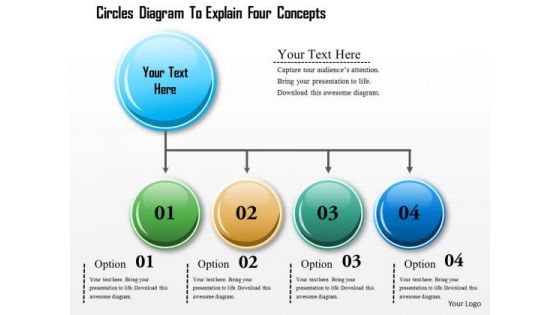
Business Diagram Circles Diagram To Explain Four Concepts Presentation Template
Explain the concept of data flow in any presentation with this unique PPT. This PPT contains the graphic of four staged text boxes. This PPT is suitable for business and sales presentations.
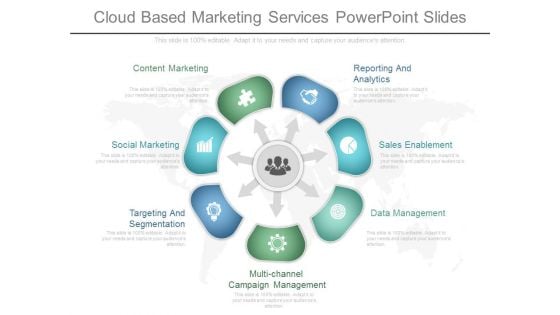
Cloud Based Marketing Services Powerpoint Slides
This is a cloud based marketing services powerpoint slides. This is a seven stage process. The stages in this process are content marketing, social marketing, targeting and segmentation, multi channel campaign management, data management, sales enablement, reporting and analytics.
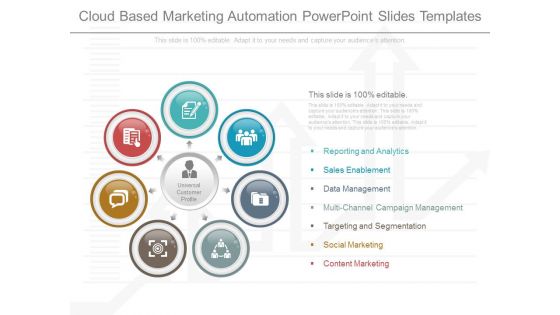
Cloud Based Marketing Automation Powerpoint Slides Templates
This is a cloud based marketing automation powerpoint slides templates. This is a seven stage process. The stages in this process are reporting and analytics, sales enablement, data management, multi channel campaign management, targeting and segmentation, social marketing, content marketing.
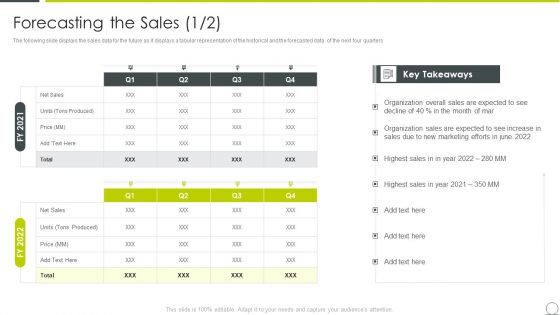
Examining Product Characteristics Brand Messaging Forecasting The Sales Template PDF
The following slide displays the sales data for the future as it displays a tabular representation of the historical and the forecasted data of the next four quarters Deliver and pitch your topic in the best possible manner with this examining product characteristics brand messaging forecasting the sales template pdf. Use them to share invaluable insights on forecasting the sales and impress your audience. This template can be altered and modified as per your expectations. So, grab it now.
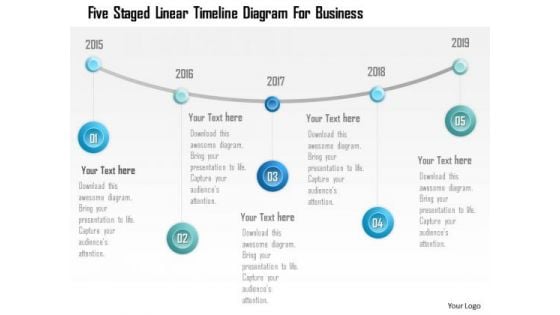
Business Diagram Five Staged Linear Timeline Diagram For Business PowerPoint Template
Five staged linear timeline diagram has been used to design this power point template. This diagram template contains the concept of business data and success strategy representation. Use this PPT for your business and sales related presentations.
Business Diagram Five Staged Timeline Diagram With Icons And Hands Graphics Ppt Template
Five staged timeline diagram with hand icons has been used to develop this power point template. This diagram template contains the concept of business data representation. Use this PPT for your business and sales related presentations.

Business Diagram Four Staged Stair Diagram With Foot Print PowerPoint Template
Four staged stair diagram with foot print has been used to design this power point template. This diagram template contains the concept of success and data flow. Use this PPT for your business and sales related presentations.

Business Diagram Three Staged Process Diagram PowerPoint Template
Three staged process diagram graphic has been used to design this power point template slide. This PPT contains the concept of data representation for business or marketing. Use this PPT for your business and sales related presentations.
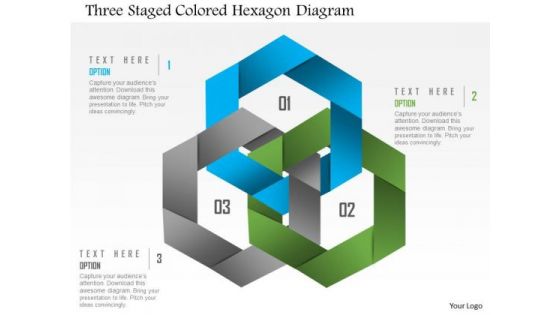
Business Diagram Three Staged Colored Hexagon Diagram PowerPoint Template
Three staged colored hexagon diagram has been used to design this power point template. This PPT contains the concept of study based data representation. This PPT is suitable for business and sales related presentations.
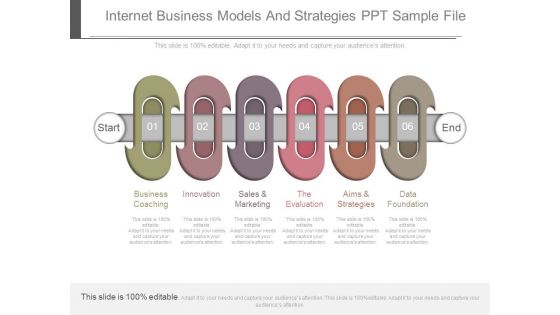
Internet Business Models And Strategies Ppt Sample File
This is a internet business models and strategies ppt sample file. This is a six stage process. The stages in this process are business coaching, innovation, sales and marketing, the evaluation, aims and strategies, data foundation, start, end.

Business Interrelationship Graphic Design Powerpoint Presentation Examples
This is a business interrelationship graphic design powerpoint presentation examples. This is a six stage process. The stages in this process are data integration, performance management, sales, accounting, assemble product, decision support systems.
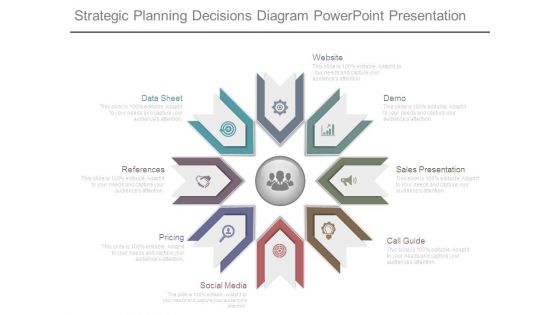
Strategic Planning Decisions Diagram Powerpoint Presentation
This is a strategic planning decisions diagram powerpoint presentation. This is a eight stage process. The stages in this process are data sheet, references, pricing, social media, call guide, sales presentation, demo, website.
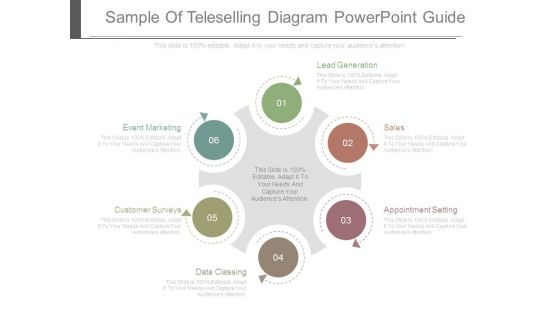
Sample Of Teleselling Diagram Powerpoint Guide
This is a sample of teleselling diagram powerpoint guide. This is a six stage process. The stages in this process are lead generation, sales, appointment setting, data classing, customer surveys, event marketing.
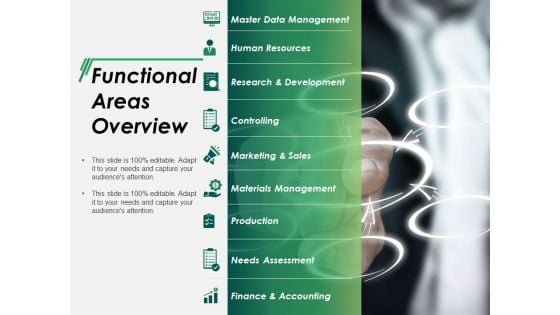
Functional Areas Overview Ppt PowerPoint Presentation Layouts Backgrounds
This is a functional areas overview ppt powerpoint presentation layouts backgrounds. This is a nine stage process. The stages in this process are master data management, human resources, controlling, marketing and sales, materials management.
Functional Areas Overview Ppt PowerPoint Presentation Icon Design Inspiration
This is a functional areas overview ppt powerpoint presentation icon design inspiration. This is a nine stage process. The stages in this process are master data management, human resources, research and development, controlling, marketing and sales.


 Continue with Email

 Home
Home


