Turnover Data

Data Driven Insurance Sales Procedure Boosting Revenue Sample PDF
The following slide highlights insurance sales cycle based on data for predictive analysis and real-time insights. It boost company sales. It includes components such as integrate front and back office, customer centric sales and improve renewal rates. Persuade your audience using this Data Driven Insurance Sales Procedure Boosting Revenue Sample PDF. This PPT design covers three stages, thus making it a great tool to use. It also caters to a variety of topics including Customer Centric Sales, Improve Renewal Rates, Revenue. Download this PPT design now to present a convincing pitch that not only emphasizes the topic but also showcases your presentation skills
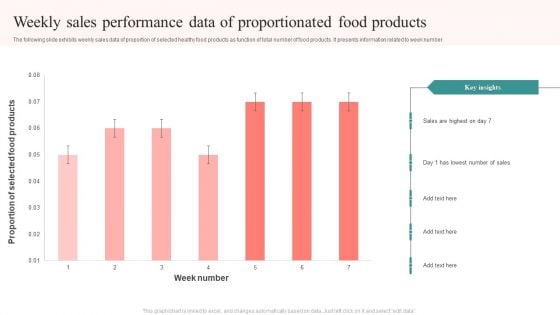
Weekly Sales Performance Data Of Proportionated Food Products Structure PDF
The following slide exhibits weekly sales data of proportion of selected healthy food products as function of total number of food products. It presents information related to week number. Showcasing this set of slides titled Weekly Sales Performance Data Of Proportionated Food Products Structure PDF. The topics addressed in these templates are Proportion Selected, Food Products, Week Number, Sales Highest. All the content presented in this PPT design is completely editable. Download it and make adjustments in color, background, font etc. as per your unique business setting.
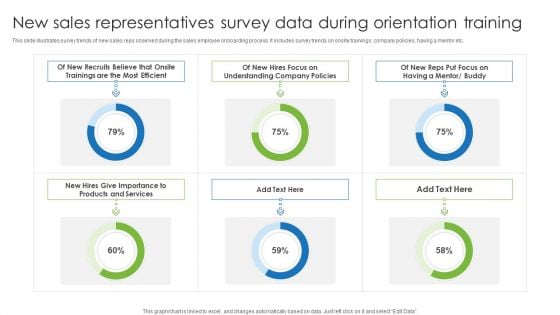
New Sales Representatives Survey Data During Orientation Training Themes PDF
This slide illustrates survey trends of new sales reps observed during the sales employee onboarding process. It includes survey trends on onsite trainings, company policies, having a mentor etc. Showcasing this set of slides titled New Sales Representatives Survey Data During Orientation Training Themes PDF. The topics addressed in these templates are New Sales Representatives Survey, Data During Orientation Training. All the content presented in this PPT design is completely editable. Download it and make adjustments in color, background, font etc. as per your unique business setting.
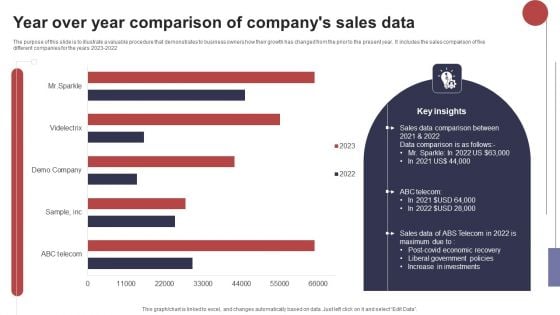
Year Over Year Comparison Of Companys Sales Data Microsoft PDF
The purpose of this slide is to illustrate a valuable procedure that demonstrates to business owners how their growth has changed from the prior to the present year. It includes the sales comparison of five different companies for the years 2023 2022. Pitch your topic with ease and precision using this Year Over Year Comparison Of Companys Sales Data Microsoft PDF. This layout presents information on Sales Data Comparison, Liberal Government, Increase Investments. It is also available for immediate download and adjustment. So, changes can be made in the color, design, graphics or any other component to create a unique layout.
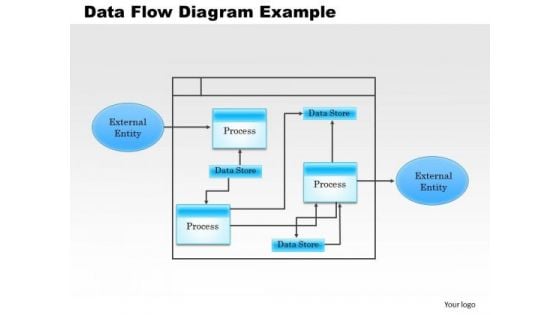
Business Framework Data Flow Diagram Example PowerPoint Presentation
This image slide displays business framework. Use this image slide to express views on data flow in a process. This image slide depicts business strategy plan. You may change color size and orientation of any icon to your liking. This image slide will enhance the quality of presentations.
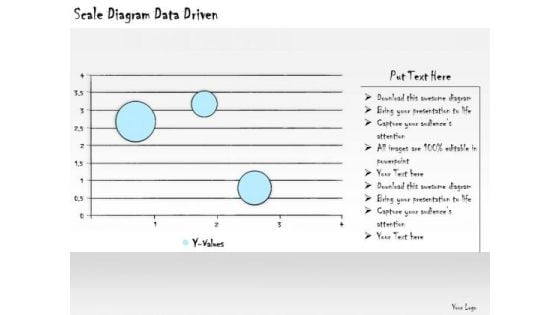
Ppt Slide Scale Diagram Data Driven Consulting Firms
Draw Out The Best In You With Our PPT Slide scale diagram data driven consulting firms Powerpoint Templates. Let Your Inner Brilliance Come To The Surface. Draw Out The Talents Of Your Team. Use Our Business Plan Powerpoint Templates To Give Them An Incentive.
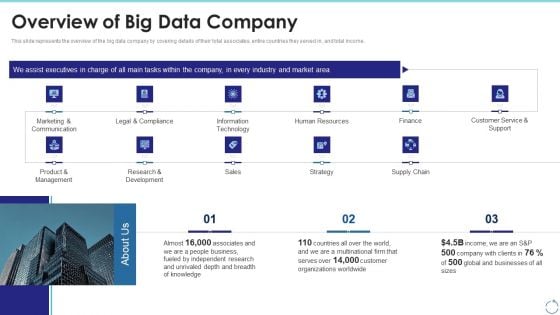
Overview Of Big Data Company Ppt Layouts Rules PDF
This slide represents the overview of the big data company by covering details of their total associates, entire countries they served in, and total income. This is a overview of big data company ppt layouts rules pdf template with various stages. Focus and dispense information on three stages using this creative set, that comes with editable features. It contains large content boxes to add your information on topics like organizations, customer, global, income, supply chain. You can also showcase facts, figures, and other relevant content using this PPT layout. Grab it now.
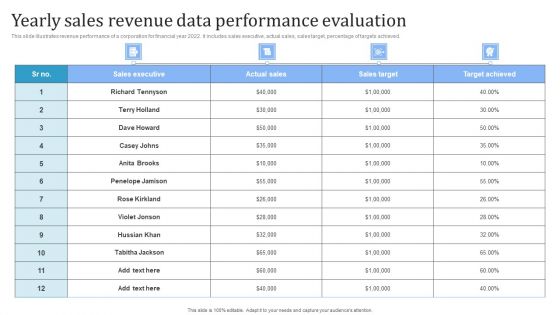
Yearly Sales Revenue Data Performance Evaluation Ideas PDF
Pitch your topic with ease and precision using this Yearly Sales Revenue Data Performance Evaluation Ideas PDF. This layout presents information on Sales Executive, Actual Sales, Sales Target. It is also available for immediate download and adjustment. So, changes can be made in the color, design, graphics or any other component to create a unique layout.
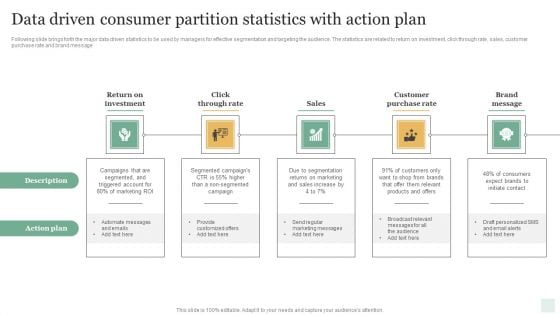
Data Driven Consumer Partition Statistics With Action Plan Pictures PDF
Following slide brings forth the major data driven statistics to be used by managers for effective segmentation and targeting the audience. The statistics are related to return on investment, click through rate, sales, customer purchase rate and brand message. Persuade your audience using this Data Driven Consumer Partition Statistics With Action Plan Pictures PDF. This PPT design covers five stages, thus making it a great tool to use. It also caters to a variety of topics including Return On Investment, Click Through Rate, Sales, Customer Purchase Rate, Brand Message. Download this PPT design now to present a convincing pitch that not only emphasizes the topic but also showcases your presentation skills.
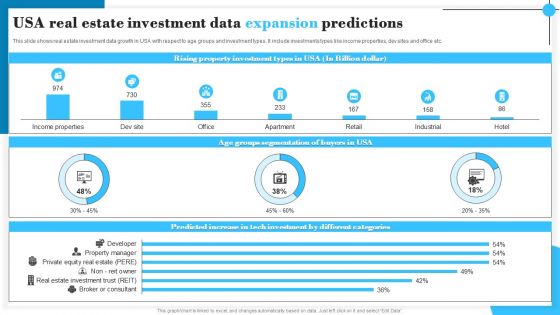
USA Real Estate Investment Data Expansion Predictions Graphics PDF
This slide shows real estate investment data growth in USA with respect to age groups and investment types. It include investments types like income properties, dev sites and office etc. Pitch your topic with ease and precision using this USA Real Estate Investment Data Expansion Predictions Graphics PDF. This layout presents information on Rising Property, Age Groups Segmentation, Investment Types. It is also available for immediate download and adjustment. So, changes can be made in the color, design, graphics or any other component to create a unique layout.
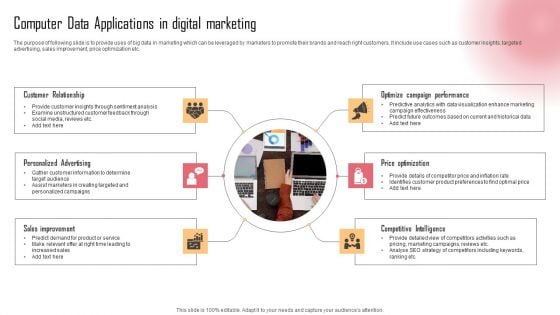
Computer Data Applications In Digital Marketing Structure PDF
The purpose of following slide is to provide uses of big data in marketing which can be leveraged by marketers to promote their brands and reach right customers. It include use cases such as customer insights, targeted advertising, sales improvement, price optimization etc. Persuade your audience using this Computer Data Applications In Digital Marketing Structure PDF. This PPT design covers six stages, thus making it a great tool to use. It also caters to a variety of topics including Customer Relationship, Personalized Advertising, Sales Improvement. Download this PPT design now to present a convincing pitch that not only emphasizes the topic but also showcases your presentation skills.
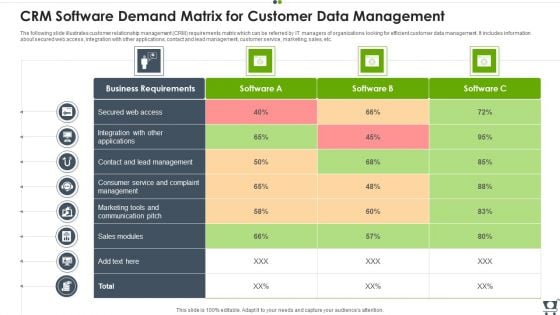
Crm Software Demand Matrix For Customer Data Management Pictures PDF
The following slide illustrates customer relationship management CRM requirements matrix which can be referred by IT managers of organizations looking for efficient customer data management. It includes information about secured web access, integration with other applications, contact and lead management, customer service, marketing, sales, etc. Pitch your topic with ease and precision using this Crm Software Demand Matrix For Customer Data Management Pictures PDF. This layout presents information on Sales Modules, Marketing, Communication. It is also available for immediate download and adjustment. So, changes can be made in the color, design, graphics or any other component to create a unique layout.
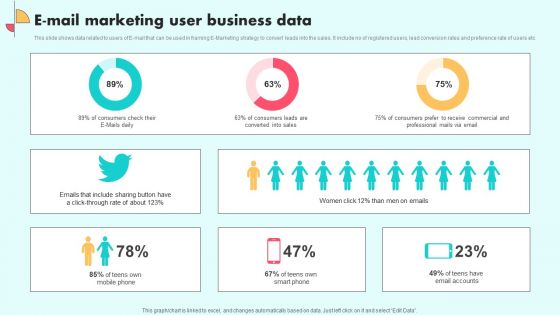
E Mail Marketing User Business Data Portrait PDF
This slide shows data related to users of E-mail that can be used in framing E-Marketing strategy to convert leads into the sales. It include no of registered users, lead conversion rates and preference rate of users etc. Showcasing this set of slides titled E Mail Marketing User Business Data Portrait PDF. The topics addressed in these templates are Consumers Leads, Sales, Professional Mails. All the content presented in this PPT design is completely editable. Download it and make adjustments in color, background, font etc. as per your unique business setting.
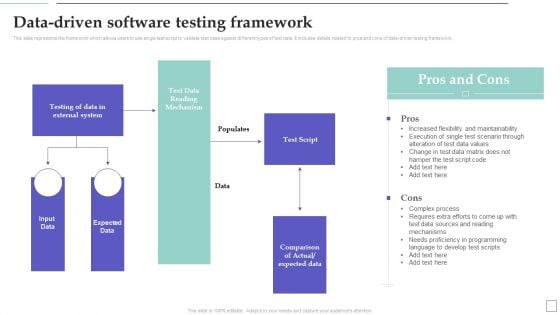
System Deployment Project Data Driven Software Testing Framework Microsoft PDF
This slide represents the framework which allows users to use single test script to validate test case against different types of test data. It includes details related to pros and cons of data-driven testing framework. Slidegeeks is here to make your presentations a breeze with System Deployment Project Data Driven Software Testing Framework Microsoft PDF With our easy-to-use and customizable templates, you can focus on delivering your ideas rather than worrying about formatting. With a variety of designs to choose from, youre sure to find one that suits your needs. And with animations and unique photos, illustrations, and fonts, you can make your presentation pop. So whether youre giving a sales pitch or presenting to the board, make sure to check out Slidegeeks first
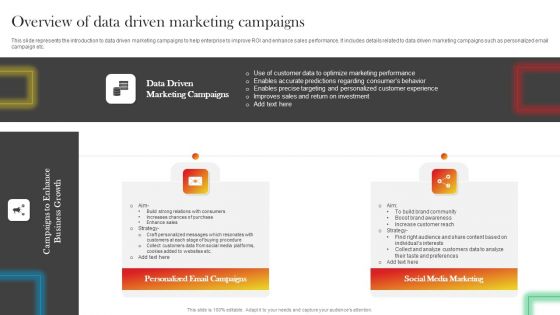
Overview Of Data Driven Marketing Campaigns Diagrams PDF
This slide represents the introduction to data driven marketing campaigns to help enterprise to improve ROI and enhance sales performance. It includes details related to data driven marketing campaigns such as personalized email campaign etc. Slidegeeks is one of the best resources for PowerPoint templates. You can download easily and regulate Overview Of Data Driven Marketing Campaigns Diagrams PDF for your personal presentations from our wonderful collection. A few clicks is all it takes to discover and get the most relevant and appropriate templates. Use our Templates to add a unique zing and appeal to your presentation and meetings. All the slides are easy to edit and you can use them even for advertisement purposes.
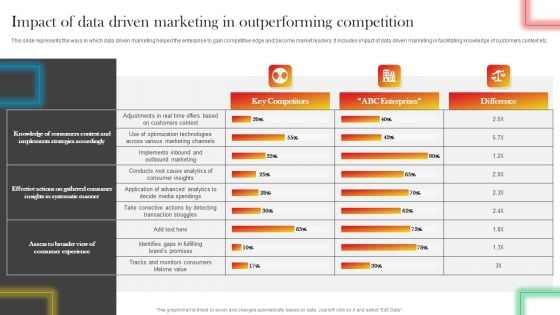
Impact Of Data Driven Marketing In Outperforming Competition Structure PDF
This slide represents the ways in which data driven marketing helped the enterprise to gain competitive edge and become market leaders. It includes impact of data driven marketing in facilitating knowledge of customers context etc. Slidegeeks is here to make your presentations a breeze with Impact Of Data Driven Marketing In Outperforming Competition Structure PDF With our easy-to-use and customizable templates, you can focus on delivering your ideas rather than worrying about formatting. With a variety of designs to choose from, you are sure to find one that suits your needs. And with animations and unique photos, illustrations, and fonts, you can make your presentation pop. So whether you are giving a sales pitch or presenting to the board, make sure to check out Slidegeeks first
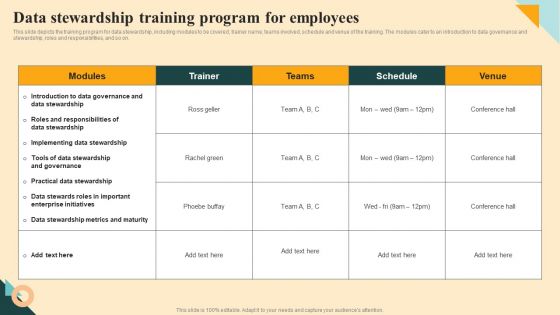
Data Stewardship Training Program For Employees Summary PDF
This slide depicts the training program for data stewardship, including modules to be covered, trainer name, teams involved, schedule and venue of the training. The modules cater to an introduction to data governance and stewardship, roles and responsibilities, and so on. Slidegeeks is here to make your presentations a breeze with Data Stewardship Training Program For Employees Summary PDF With our easy to use and customizable templates, you can focus on delivering your ideas rather than worrying about formatting. With a variety of designs to choose from, you are sure to find one that suits your needs. And with animations and unique photos, illustrations, and fonts, you can make your presentation pop. So whether you are giving a sales pitch or presenting to the board, make sure to check out Slidegeeks first.
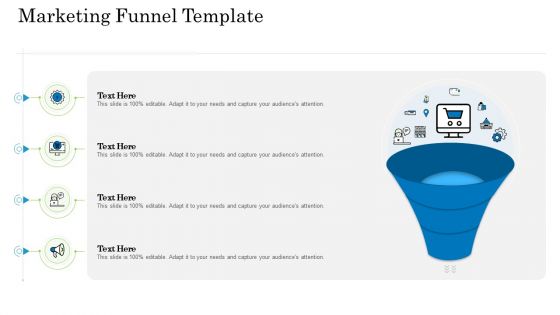
Customer Behavioral Data And Analytics Marketing Funnel Template Background PDF
This is a customer behavioral data and analytics marketing funnel template background pdf template with various stages. Focus and dispense information on three stages using this creative set, that comes with editable features. It contains large content boxes to add your information on topics like marketing funnel template. You can also showcase facts, figures, and other relevant content using this PPT layout. Grab it now.
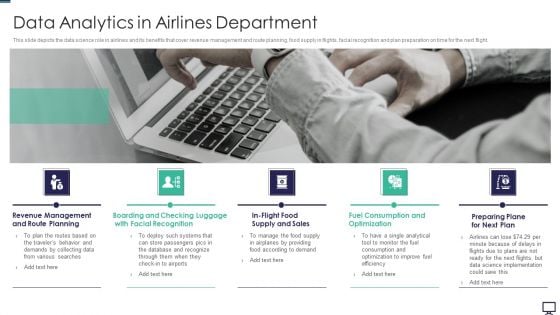
Data Analytics In Airlines Department Ppt Layouts Elements PDF
This slide depicts the data science role in airlines and its benefits that cover revenue management and route planning, food supply in flights, facial recognition and plan preparation on time for the next flight. Presenting data analytics in airlines department ppt layouts elements pdf to provide visual cues and insights. Share and navigate important information on five stages that need your due attention. This template can be used to pitch topics like supply, sales, optimization, systems, planning. In addtion, this PPT design contains high resolution images, graphics, etc, that are easily editable and available for immediate download.
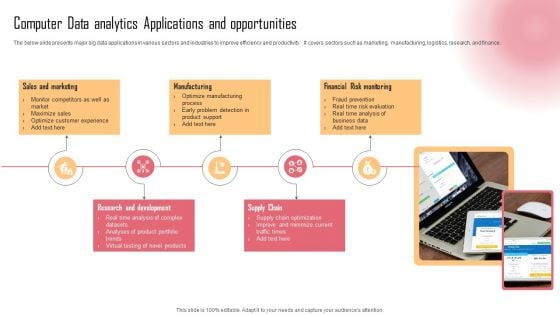
Computer Data Analytics Applications And Opportunities Demonstration PDF
The below slide presents major big data applications in various sectors and industries to improve efficiency and productivity. It covers sectors such as marketing, manufacturing, logistics, research, and finance. Presenting Computer Data Analytics Applications And Opportunities Demonstration PDF to dispense important information. This template comprises five stages. It also presents valuable insights into the topics including Sales And Marketing, Manufacturing, Financial Risk Monitoring . This is a completely customizable PowerPoint theme that can be put to use immediately. So, download it and address the topic impactfully.
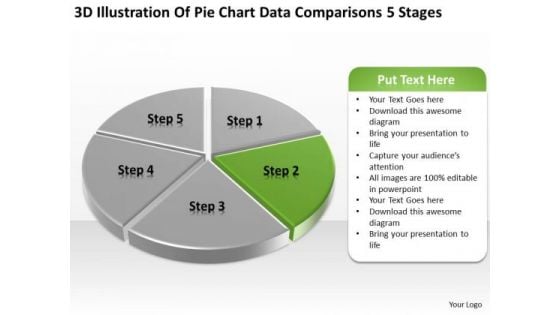
Pie Chart Data Comparisons 5 Stages Business Plan PowerPoint Templates
We present our pie chart data comparisons 5 stages business plan PowerPoint templates.Download and present our Marketing PowerPoint Templates because Our PowerPoint Templates and Slides offer you the widest possible range of options. Use our Finance PowerPoint Templates because You should Ascend the ladder of success with ease. Our PowerPoint Templates and Slides will provide strong and sturdy steps. Download and present our Business PowerPoint Templates because You should Throw the gauntlet with our PowerPoint Templates and Slides. They are created to take up any challenge. Present our Sales PowerPoint Templates because Our PowerPoint Templates and Slides help you pinpoint your timelines. Highlight the reasons for your deadlines with their use. Present our Success PowerPoint Templates because It will Raise the bar of your Thoughts. They are programmed to take you to the next level.Use these PowerPoint slides for presentations relating to Analysis, Analyzing, Brands, Business, Chart, Colorful, Commerce, Compare, Comparison, Data, Economical, Finance, Financial, Grow, Growth, Market, Market Share, Marketing, Measure, Pen, Pie, Pie Chart, Presentation, Profit, Revenue, Sales, Sales Chat, Sales Increase, Share, Statistical, Success, Successful. The prominent colors used in the PowerPoint template are Green, Gray, White. Our Pie Chart Data Comparisons 5 Stages Business Plan PowerPoint Templates are experts in convincing the crowd. They will be greatly assured by your ideas.
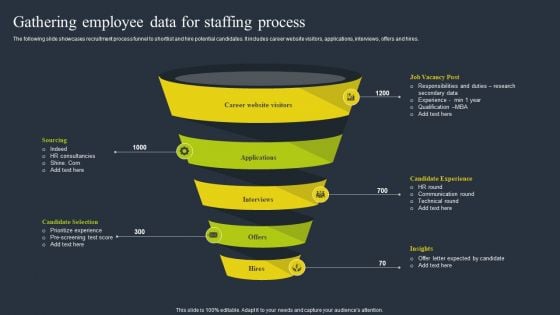
Gathering Employee Data For Staffing Process Summary PDF
The following slide showcases recruitment process funnel to shortlist and hire potential candidates. It includes career website visitors, applications, interviews, offers and hires. Presenting Gathering Employee Data For Staffing Process Summary PDF to dispense important information. This template comprises five stages. It also presents valuable insights into the topics including Applications, Career Website Visitors, Interviews. This is a completely customizable PowerPoint theme that can be put to use immediately. So, download it and address the topic impactfully.
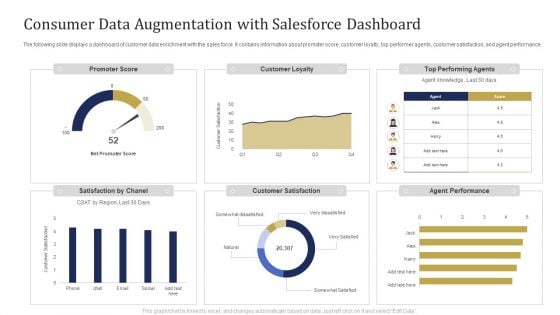
Consumer Data Augmentation With Salesforce Dashboard Ppt Pictures Portrait PDF
The following slide displays a dashboard of customer data enrichment with the sales force. It contains information about promoter score, customer loyalty, top performer agents, customer satisfaction, and agent performance. Showcasing this set of slides titled Consumer Data Augmentation With Salesforce Dashboard Ppt Pictures Portrait PDF. The topics addressed in these templates are Promoter Score, Customer Loyalty, Top Performing Agents. All the content presented in this PPT design is completely editable. Download it and make adjustments in color, background, font etc. as per your unique business setting.
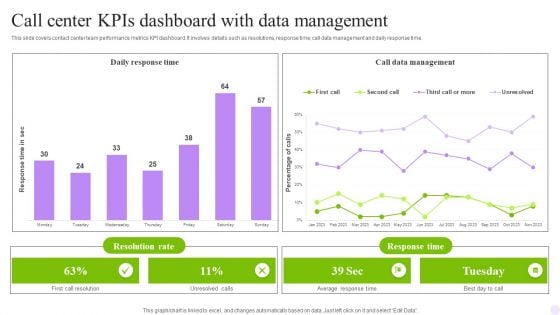
Call Center Kpis Dashboard With Data Management Infographics PDF
This slide covers contact center metrics KPI dashboard with call data details. It involves details such as total number of contacts handled, product sales, repeated calls and contact handles per day. Pitch your topic with ease and precision using this Call Center Kpis Dashboard With Data Management Infographics PDF. This layout presents information on Achieved, Contacts Handled, Repeated Calls. It is also available for immediate download and adjustment. So, changes can be made in the color, design, graphics or any other component to create a unique layout.
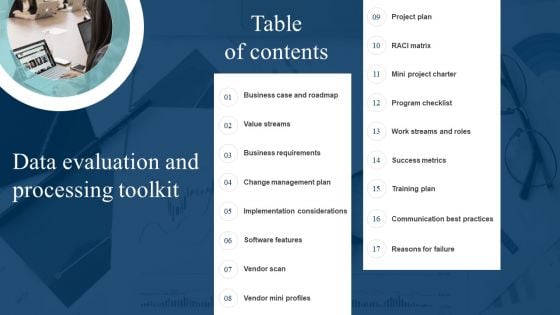
Data Evaluation And Processing Toolkit Table Of Contents Summary PDF
Make sure to capture your audiences attention in your business displays with our gratis customizable Data Evaluation And Processing Toolkit Table Of Contents Summary PDF. These are great for business strategies, office conferences, capital raising or task suggestions. If you desire to acquire more customers for your tech business and ensure they stay satisfied, create your own sales presentation with these plain slides.
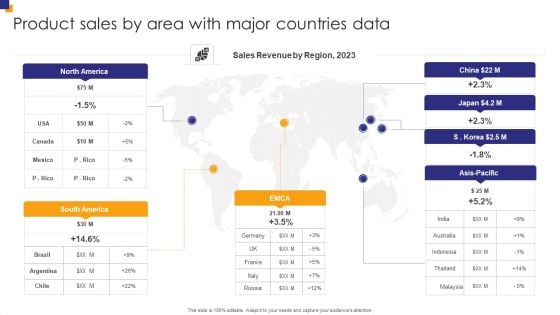
Product Sales By Area With Major Countries Data Portrait PDF
Persuade your audience using this Product Sales By Area With Major Countries Data Portrait PDF. This PPT design covers one stage, thus making it a great tool to use. It also caters to a variety of topics including Sales Revenue, South America, North America. Download this PPT design now to present a convincing pitch that not only emphasizes the topic but also showcases your presentation skills.
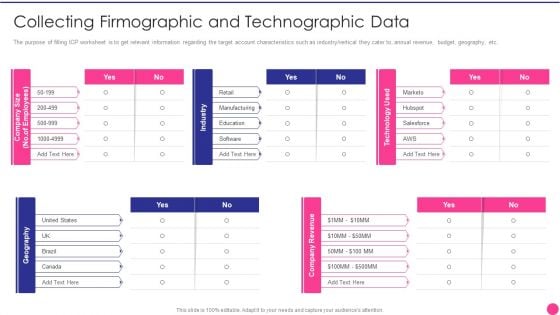
Operating B2B Sales Collecting Firmographic And Technographic Data Microsoft PDF
The purpose of filling ICP worksheet is to get relevant information regarding the target account characteristics such as industry or vertical they cater to, annual revenue, budget, geography, etc. Deliver an awe inspiring pitch with this creative operating b2b sales collecting firmographic and technographic data microsoft pdf bundle. Topics like retail, manufacturing, education, software can be discussed with this completely editable template. It is available for immediate download depending on the needs and requirements of the user.
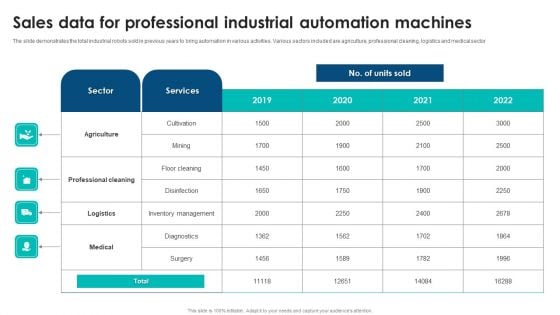
Sales Data For Professional Industrial Automation Machines Infographics PDF
The slide demonstrates the total industrial robots sold in previous years to bring automation in various activities. Various sectors included are agriculture, professional cleaning, logistics and medical sector. Pitch your topic with ease and precision using this Sales Data For Professional Industrial Automation Machines Infographics PDF. This layout presents information on Agriculture, Professional Cleaning, Logistics. It is also available for immediate download and adjustment. So, changes can be made in the color, design, graphics or any other component to create a unique layout.

Customer Relationship Management Dashboard CRM Data Analysis Sample PDF
Deliver an aweinspiring pitch with this creative customer relationship management dashboard crm data analysis sample pdf bundle. Topics like entities by rep, completed activities l, biz notes this month, activity last 3 months, sales last 3 months can be discussed with this completely editable template. It is available for immediate download depending on the needs and requirements of the user.
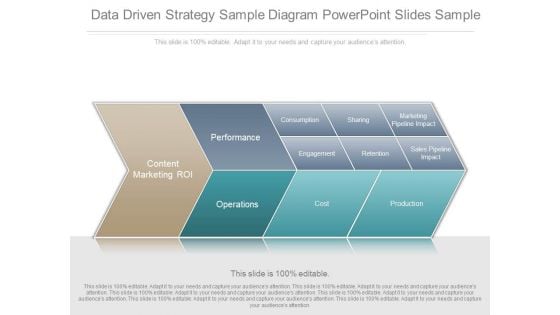
Data Driven Strategy Sample Diagram Powerpoint Slides Sample
This is a data driven strategy sample diagram powerpoint slides sample. This is a five stage process. The stages in this process are content marketing roi, performance, operations, consumption, sharing, marketing pipeline impact, engagement, retention, sales pipeline impact, operations, cost, production.
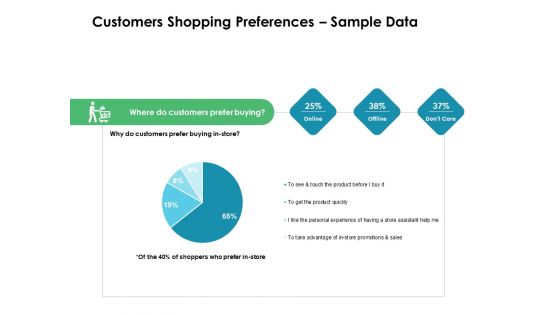
Value Creation Initiatives Customers Shopping Preferences Sample Data Template PDF
Deliver and pitch your topic in the best possible manner with this value creation initiatives customers shopping preferences sample data template pdf. Use them to share invaluable insights on promotion, sales, experience, product, advantage and impress your audience. This template can be altered and modified as per your expectations. So, grab it now.
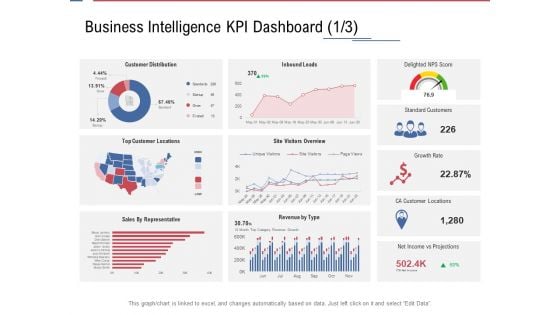
Data Assimilation Business Intelligence KPI Dashboard Score Ppt Graphics PDF
Deliver and pitch your topic in the best possible manner with this data assimilation business intelligence kpi dashboard score ppt graphics pdf. Use them to share invaluable insights on revenue, projections, locations, growth, sales and impress your audience. This template can be altered and modified as per your expectations. So, grab it now.
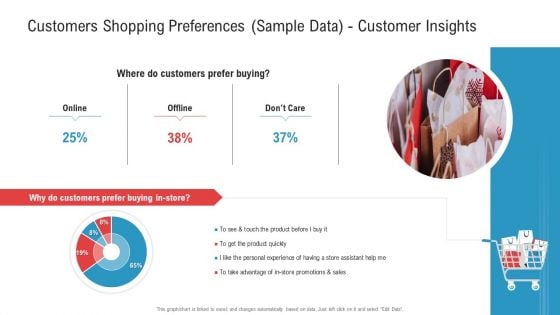
Customers Shopping Preferences Sample Data Customer Insights Mockup PDF
Deliver an awe-inspiring pitch with this creative customers shopping preferences sample data customer insights mockup pdf bundle. Topics like customers prefer buying, promotion and sales can be discussed with this completely editable template. It is available for immediate download depending on the needs and requirements of the user.
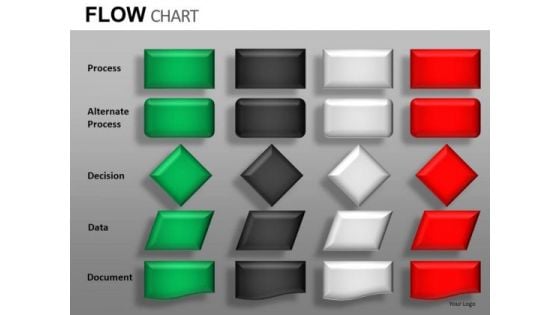
Process Data Document Symbols Flow Chart Poerpoint Slides
Process Data Document Symbols Flow Chart PoerPoint Slides-These high quality powerpoint pre-designed slides and powerpoint templates have been carefully created by our professional team to help you impress your audience. All slides have been created and are 100% editable in powerpoint. Each and every property of any graphic - color, size, orientation, shading, outline etc. can be modified to help you build an effective powerpoint presentation. Any text can be entered at any point in the powerpoint template or slide. Simply DOWNLOAD, TYPE and PRESENT!These PowerPoint Presentation slides can be used for themes relating to--Business, businessman, chain, chart, communication, community, company, concept, connection, contact, corporate, creativity, data, database, diagram, draw, drawing, education, executive, flow, flowchart, global, graphic, group, illustration, internet, isolated, job, manager, meeting, net, network, networking, office, organization, people, person, plan, presentation, relationship, screen, social, structure, success, team, teamwork, web, white, work, writing Our Process Data Document Symbols Flow Chart Poerpoint Slides deliver a blast for a buck. Just a bang is not good enough.
Customer Behavioral Data And Analytics Customer Experience Metrics Topics PDF
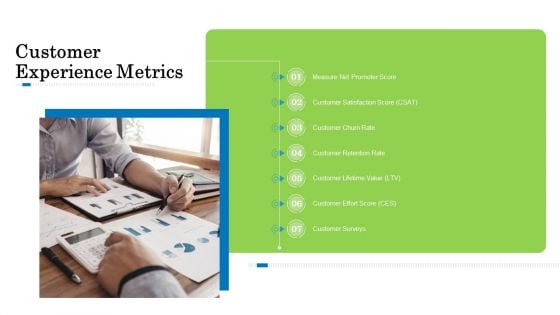
Presenting customer behavioral data and analytics customer experience metrics topics pdf to provide visual cues and insights. Share and navigate important information on seven stages that need your due attention. This template can be used to pitch topics like measure net promoter score, customer satisfaction score, customer churn rate, customer retention rate, customer lifetime value. In addtion, this PPT design contains high resolution images, graphics, etc, that are easily editable and available for immediate download.
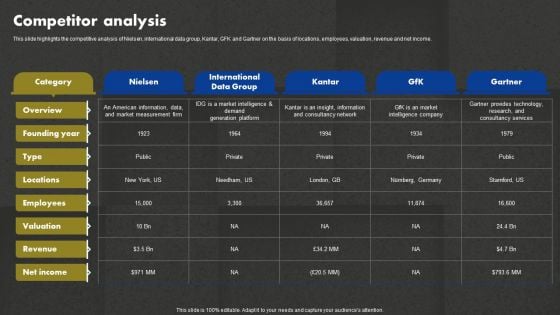
Data And Customer Analysis Company Outline Competitor Analysis Topics PDF
Key Questions For Customer Data Analysis Icons PDF
This slide list the win loss questions that must be asked for improving organizations messaging, positioning, packaging, pricing, and sales practices. Persuade your audience using this key questions for customer data analysis icons pdf. This PPT design covers five stages, thus making it a great tool to use. It also caters to a variety of topics including sales, practices, messaging, positioning. Download this PPT design now to present a convincing pitch that not only emphasizes the topic but also showcases your presentation skills.
Strategic And Sales Customer Data Analysis Evaluation Parameters Inspiration PDF
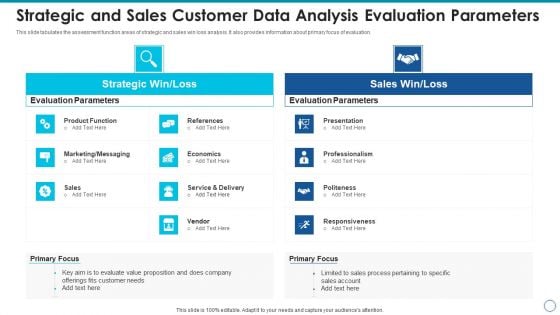
This slide tabulates the assessment function areas of strategic and sales win loss analysis. It also provides information about primary focus of evaluation. Persuade your audience using this strategic and sales customer data analysis evaluation parameters inspiration pdf. This PPT design covers two stages, thus making it a great tool to use. It also caters to a variety of topics including evaluation parameters, strategic win loss, sales win loss. Download this PPT design now to present a convincing pitch that not only emphasizes the topic but also showcases your presentation skills.
ETL Repository Customer Centric Master Data Management Solutions Information PDF
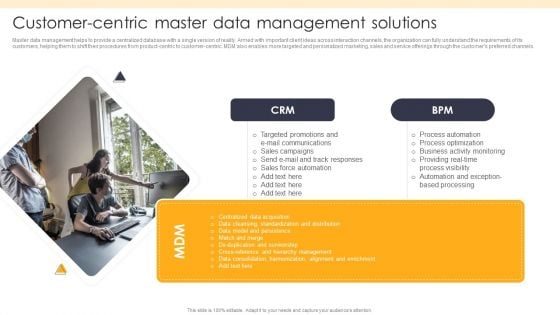
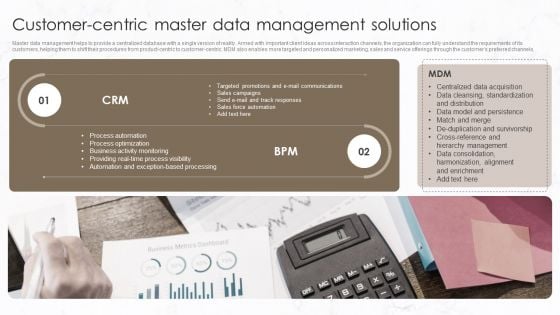
Master data management helps to provide a centralized database with a single version of reality. Armed with important client ideas across interaction channels, the organization can fully understand the requirements of its customers, helping them to shift their procedures from product-centric to customer centric. MDM also enables more targeted and personalized marketing, sales and service offerings through the customers preferred channels.This is a ETL Repository Customer Centric Master Data Management Solutions Information PDF template with various stages. Focus and dispense information on one stage using this creative set, that comes with editable features. It contains large content boxes to add your information on topics like Targeted Promotions, Force Automation, Based Processing. You can also showcase facts, figures, and other relevant content using this PPT layout. Grab it now.
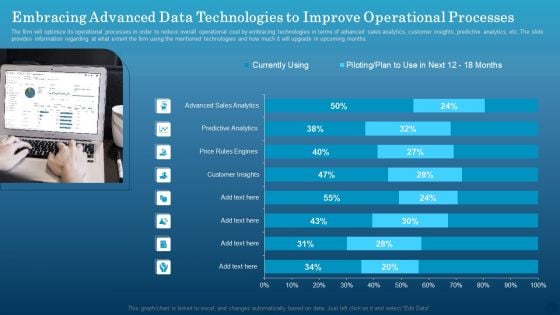
Embracing Advanced Data Technologies To Improve Operational Processes Infographics PDF
The firm will optimize its operational processes in order to reduce overall operational cost by embracing technologies in terms of advanced sales analytics, customer insights, predictive analytics, etc. The slide provides information regarding at what extent the firm using the mentioned technologies and how much it will upgrade in upcoming months. Formulating a presentation can take up a lot of effort and time, so the content and message should always be the primary focus. The visuals of the PowerPoint can enhance the presenters message, so our Embracing Advanced Data Technologies To Improve Operational Processes Infographics PDF was created to help save time. Instead of worrying about the design, the presenter can concentrate on the message while our designers work on creating the ideal templates for whatever situation is needed. Slidegeeks has experts for everything from amazing designs to valuable content, we have put everything into Embracing Advanced Data Technologies To Improve Operational Processes Infographics PDF.
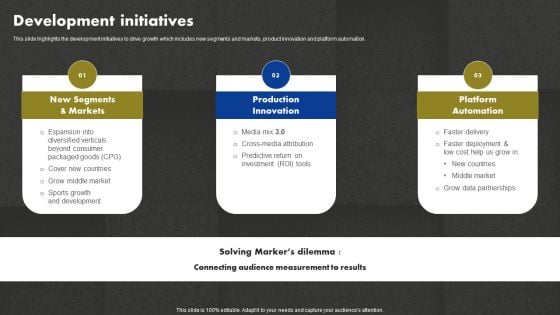
Data And Customer Analysis Company Outline Development Initiatives Pictures PDF
Data Assimilation Dimensional Modelling Store Ppt Icon Graphics PDF
This is a data assimilation dimensional modelling store ppt icon graphics pdf template with various stages. Focus and dispense information on five stages using this creative set, that comes with editable features. It contains large content boxes to add your information on topics like sales, dimension, product, customer, date period. You can also showcase facts, figures, and other relevant content using this PPT layout. Grab it now.
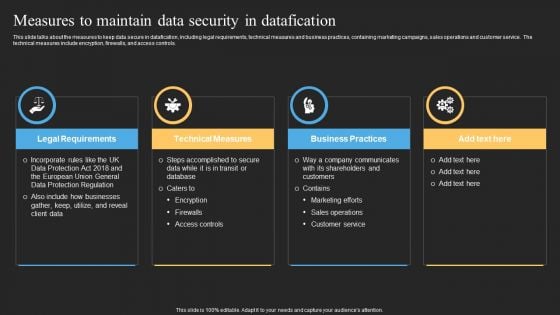
Datafy Measures To Maintain Data Security In Datafication Diagrams PDF
This slide talks about the measures to keep data secure in datafication, including legal requirements, technical measures and business practices, containing marketing campaigns, sales operations and customer service. The technical measures include encryption, firewalls, and access controls. Welcome to our selection of the Datafy Measures To Maintain Data Security In Datafication Diagrams PDF. These are designed to help you showcase your creativity and bring your sphere to life. Planning and Innovation are essential for any business that is just starting out. This collection contains the designs that you need for your everyday presentations. All of our PowerPoints are 100 percent editable, so you can customize them to suit your needs. This multi-purpose template can be used in various situations. Grab these presentation templates today.
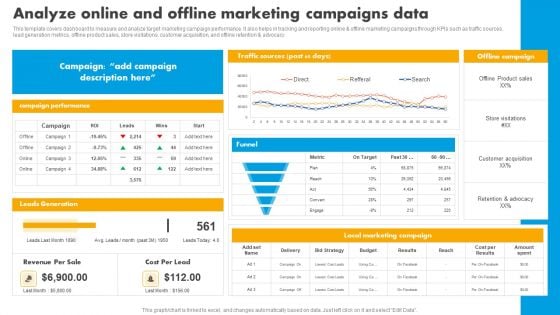
Analyze Online And Offline Marketing Campaigns Data Graphics PDF
This template covers dashboard to measure and analyze target marketing campaign performance. It also helps in tracking and reporting online and offline marketing campaigns through KPIs such as traffic sources, lead generation metrics, offline product sales, store visitations, customer acquisition, and offline retention and advocacy. If you are looking for a format to display your unique thoughts, then the professionally designed Analyze Online And Offline Marketing Campaigns Data Graphics PDF is the one for you. You can use it as a Google Slides template or a PowerPoint template. Incorporate impressive visuals, symbols, images, and other charts. Modify or reorganize the text boxes as you desire. Experiment with shade schemes and font pairings. Alter, share or cooperate with other people on your work. Download Analyze Online And Offline Marketing Campaigns Data Graphics PDF and find out how to give a successful presentation. Present a perfect display to your team and make your presentation unforgettable.
Customer Centric Master Data Management Solutions Introduction PDF
Master data management helps to provide a centralized database with a single version of reality. Armed with important client ideas across interaction channels, the organization can fully understand the requirements of its customers, helping them to shift their procedures from product-centric to customer centric. MDM also enables more targeted and personalized marketing, sales and service offerings through the customers preferred channels.Presenting Customer Centric Master Data Management Solutions Introduction PDF to provide visual cues and insights. Share and navigate important information on one stage that need your due attention. This template can be used to pitch topics like Activity Monitoring, Process Automation, Process Optimization. In addtion, this PPT design contains high resolution images, graphics, etc, that are easily editable and available for immediate download.
Electronic Consumers Demographics Data Analysis Dashboard Topics PDF
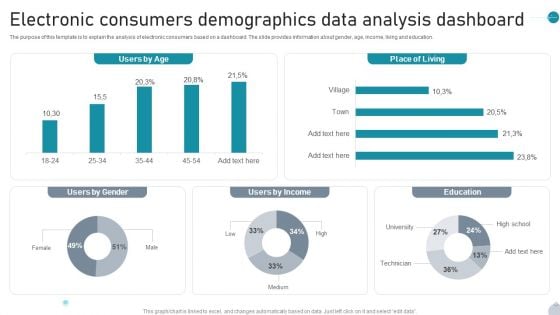
The purpose of this template is to explain the analysis of electronic consumers based on a dashboard. The slide provides information about gender, age, income, living and education. Showcasing this set of slides titled Electronic Consumers Demographics Data Analysis Dashboard Topics PDF. The topics addressed in these templates are Users By Age, Place Of Living, Users By Income All the content presented in this PPT design is completely editable. Download it and make adjustments in color, background, font etc. as per your unique business setting.
Parallel Data Processing 4 Stages Arrow Progress PowerPoint Slides
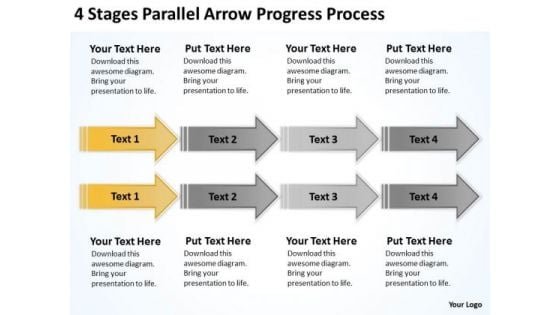
We present our parallel data processing 4 stages arrow progress PowerPoint Slides.Use our Process and Flows PowerPoint Templates because Our PowerPoint Templates and Slides are aesthetically designed to attract attention. We gaurantee that they will grab all the eyeballs you need. Present our Arrows PowerPoint Templates because Our PowerPoint Templates and Slides will bullet point your ideas. See them fall into place one by one. Use our Marketing PowerPoint Templates because Our PowerPoint Templates and Slides will Activate the energies of your audience. Get their creative juices flowing with your words. Use our Future PowerPoint Templates because You can Connect the dots. Fan expectations as the whole picture emerges. Present our Business PowerPoint Templates because Our PowerPoint Templates and Slides will let Your superior ideas hit the target always and everytime.Use these PowerPoint slides for presentations relating to Abstract, aim, arrow, blue,business, competition, concept,development, direction, education,financial, forecast, forward, glossy,gradient, graph, group, growth, higher,icon, illustration, increase, investment,leader, leadership, moving, onwards,outlook, path, plan, prediction, price,profit, progress, property, sales, series,success, target, team, teamwork. The prominent colors used in the PowerPoint template are Yellow, Gray, White. Presenters tell us our parallel data processing 4 stages arrow progress PowerPoint Slides will make you look like a winner. Presenters tell us our development PowerPoint templates and PPT Slides provide you with a vast range of viable options. Select the appropriate ones and just fill in your text. Customers tell us our parallel data processing 4 stages arrow progress PowerPoint Slides are designed by professionals Use our concept PowerPoint templates and PPT Slides will make you look like a winner. Customers tell us our parallel data processing 4 stages arrow progress PowerPoint Slides are specially created by a professional team with vast experience. They diligently strive to come up with the right vehicle for your brilliant Ideas. Presenters tell us our development PowerPoint templates and PPT Slides are specially created by a professional team with vast experience. They diligently strive to come up with the right vehicle for your brilliant Ideas. Specify paths to success with our Parallel Data Processing 4 Stages Arrow Progress PowerPoint Slides. Download without worries with our money back guaranteee.
Annual Financial Data With KPI Insights Dashboard Structure PDF
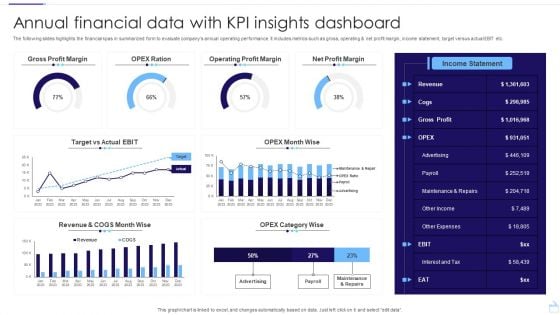
The following slides highlights the financial kpas in summarized form to evaluate companys annual operating performance. It includes metrics such as gross, operating and net profit margin, income statement, target versus actual EBIT etc. Pitch your topic with ease and precision using this Annual Financial Data With KPI Insights Dashboard Structure PDF. This layout presents information on Gross Profit Margin, Operating Profit Margin, Net Profit Margin. It is also available for immediate download and adjustment. So, changes can be made in the color, design, graphics or any other component to create a unique layout.
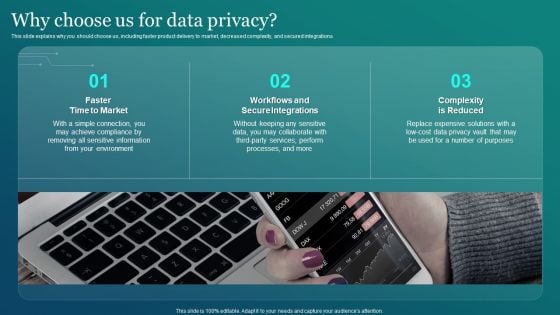
Information Security Why Choose Us For Data Privacy Graphics PDF
This slide explains why you should choose us, including faster product delivery to market, decreased complexity, and secured integrations. Slidegeeks is here to make your presentations a breeze with Information Security Why Choose Us For Data Privacy Graphics PDF With our easy to use and customizable templates, you can focus on delivering your ideas rather than worrying about formatting. With a variety of designs to choose from, you are sure to find one that suits your needs. And with animations and unique photos, illustrations, and fonts, you can make your presentation pop. So whether you are giving a sales pitch or presenting to the board, make sure to check out Slidegeeks first.
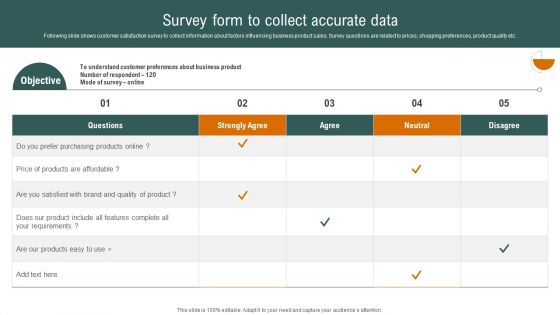
Survey Form To Collect Accurate Data Slides PDF
Following slide shows customer satisfaction survey to collect information about factors influencing business product sales. Survey questions are related to prices, shopping preferences, product quality etc. Make sure to capture your audiences attention in your business displays with our gratis customizable Survey Form To Collect Accurate Data Slides PDF. These are great for business strategies, office conferences, capital raising or task suggestions. If you desire to acquire more customers for your tech business and ensure they stay satisfied, create your own sales presentation with these plain slides.
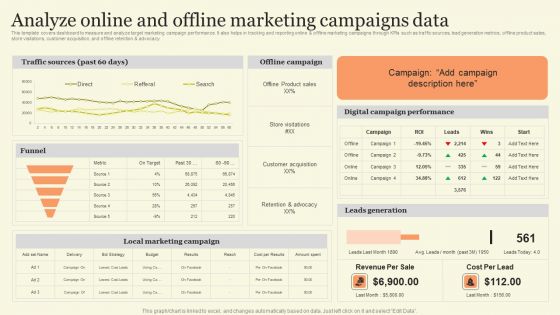
Analyze Online And Offline Marketing Campaigns Data Ideas PDF
This template covers dashboard to measure and analyze target marketing campaign performance. It also helps in tracking and reporting online and offline marketing campaigns through KPIs such as traffic sources, lead generation metrics, offline product sales, store visitations, customer acquisition, and offline retention and advocacy. Find a pre designed and impeccable Analyze Online And Offline Marketing Campaigns Data Ideas PDF. The templates can ace your presentation without additional effort. You can download these easy to edit presentation templates to make your presentation stand out from others. So, what are you waiting for Download the template from Slidegeeks today and give a unique touch to your presentation.
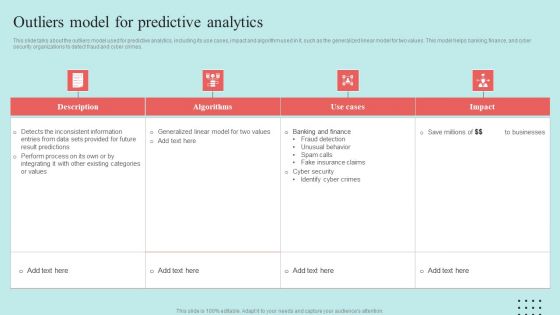
Predictive Data Model Outliers Model For Predictive Analytics Introduction PDF
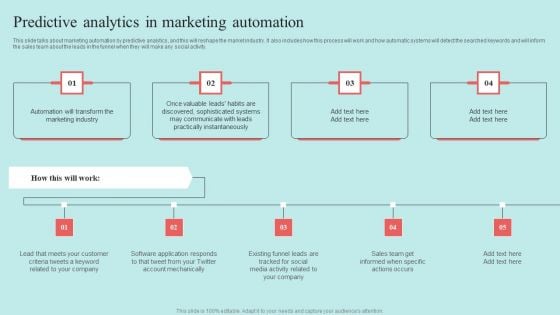
Predictive Data Model Predictive Analytics In Marketing Automation Demonstration PDF
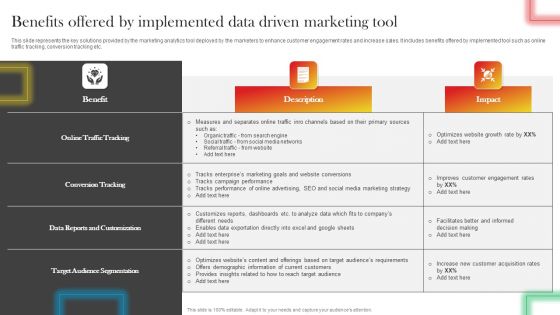
Benefits Offered By Implemented Data Driven Marketing Tool Download PDF
This slide represents the key solutions provided by the marketing analytics tool deployed by the marketers to enhance customer engagement rates and increase sales. It includes benefits offered by implemented tool such as online traffic tracking, conversion tracking etc. Take your projects to the next level with our ultimate collection of Benefits Offered By Implemented Data Driven Marketing Tool Download PDF. Slidegeeks has designed a range of layouts that are perfect for representing task or activity duration, keeping track of all your deadlines at a glance. Tailor these designs to your exact needs and give them a truly corporate look with your own brand colors they will make your projects stand out from the rest
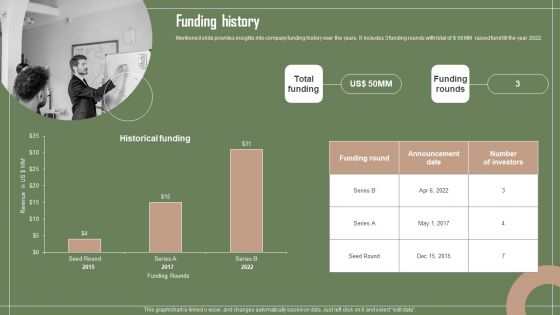
Data Automation Solution Investor Funding Presentation Funding History Template PDF
Mentioned slide provides insights into company funding history over the years. It includes 3 funding rounds with total of doller 50 MM raised fund till the year 2022. Slidegeeks is here to make your presentations a breeze with Data Automation Solution Investor Funding Presentation Funding History Template PDF With our easy to use and customizable templates, you can focus on delivering your ideas rather than worrying about formatting. With a variety of designs to choose from, you are sure to find one that suits your needs. And with animations and unique photos, illustrations, and fonts, you can make your presentation pop. So whether you are giving a sales pitch or presenting to the board, make sure to check out Slidegeeks first.
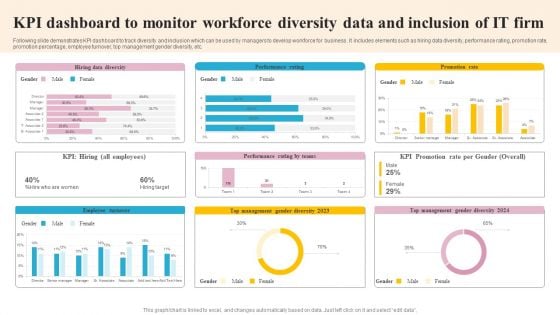
KPI Dashboard To Monitor Workforce Diversity Data And Inclusion Of IT Firm Slides PDF
Following slide demonstrates KPI dashboard to track diversity and inclusion which can be used by managers to develop workforce for business . It includes elements such as hiring data diversity, performance rating, promotion rate, promotion percentage, employee turnover, top management gender diversity, etc. Showcasing this set of slides titled KPI Dashboard To Monitor Workforce Diversity Data And Inclusion Of IT Firm Slides PDF. The topics addressed in these templates are Employee Turnover, Management, Promotion Rate. All the content presented in this PPT design is completely editable. Download it and make adjustments in color, background, font etc. as per your unique business setting.
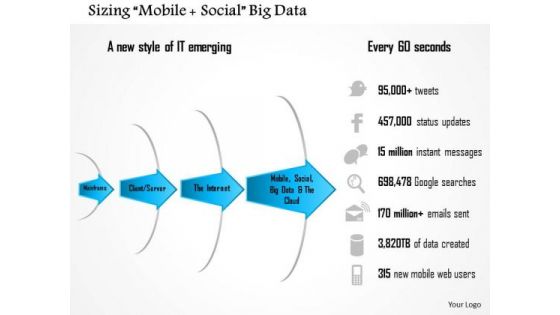
Business Framework Sizing Mobile Social Big Data PowerPoint Presentation
This Power Point template slide has been designed with graphic of four layer semi-circle diagram. This four staged arrow diagram may be used to display the data. This PPT slide contains the social big data. Use this PPT slide in your business presentations.
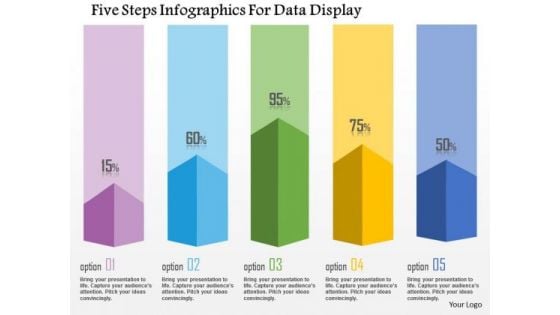
Business Diagram Five Steps Infographics For Data Display Presentation Template
This business diagram has been designed with graphic of five staged info graphics. This diagram can be used to display statistical information. Use this bar graph for your business and sales related presentations.
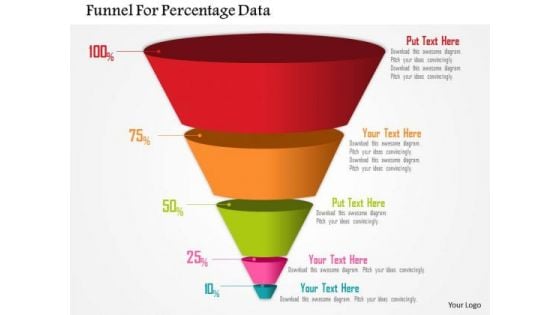
Business Diagram Funnel For Percentage Data Presentation Template
Four staged funnel diagram has been used to design this power point template. This diagram contains the concept of filtration. Present your views and ideas with this impressive image.
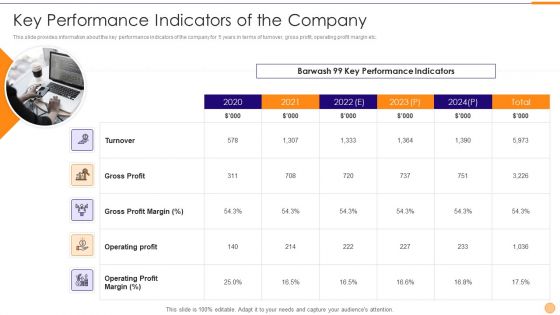
Classified Data Memo Record With Strategic Goals Key Performance Indicators Of The Company Guidelines PDF
This slide provides information about the key performance indicators of the company for 5 years in terms of turnover, gross profit, operating profit margin etc. This is a classified data memo record with strategic goals key performance indicators of the company guidelines pdf template with various stages. Focus and dispense information on five stages using this creative set, that comes with editable features. It contains large content boxes to add your information on topics like turnover, gross profit, gross profit margin, operating profit, operating profit margin. You can also showcase facts, figures, and other relevant content using this PPT layout. Grab it now.


 Continue with Email

 Home
Home


