Two Graphs
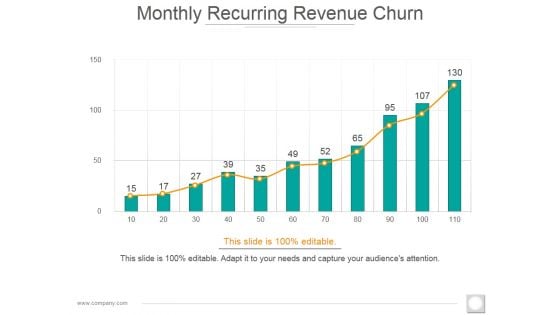
Monthly Recurring Revenue Churn Template 2 Ppt PowerPoint Presentation Diagram Images
This is a monthly recurring revenue churn template 2 ppt powerpoint presentation diagram images. This is a eleven stage process. The stages in this process are bar graph, growth, success, business, marketing.
Service Design Document Template 2 Ppt PowerPoint Presentation Icon Designs Download
This is a service design document template 2 ppt powerpoint presentation icon designs download. This is a twelve stage process. The stages in this process are business, marketing, management, graph.
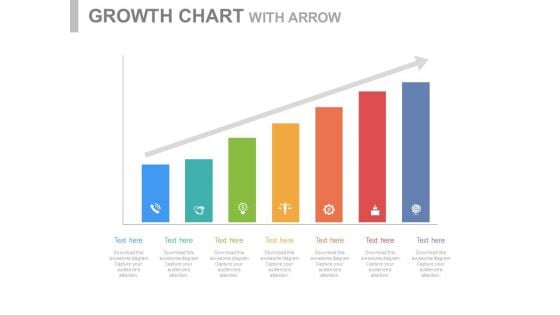
Steps For Developing Strategic Plan Powerpoint Slides
This PowerPoint template is useful for setting goals and developing strategies. This PPT background has a design of seven steps bar graph. This PPT slide is suitable for topics like corporate strategic planning.
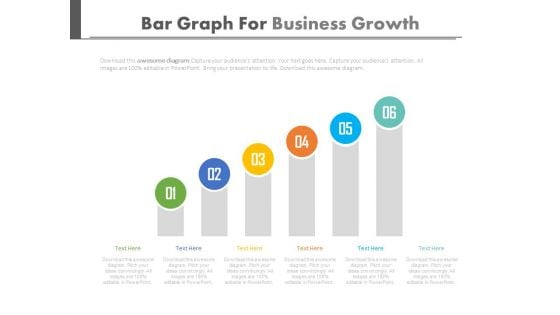
Setting Goals And Developing Strategies Powerpoint Slides
This PowerPoint template is useful for setting goals and developing strategies. This PPT background has a design of six steps bar graph. This PPT slide is suitable for topics like corporate strategic planning.
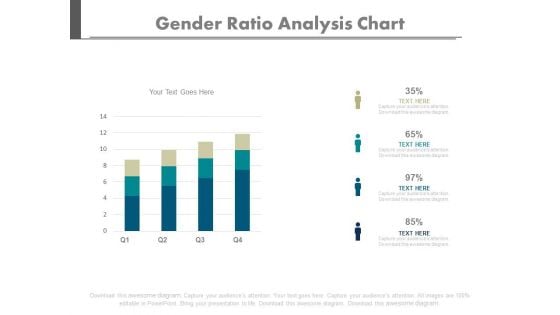
Four Bars Gender Population Ratio Chart Powerpoint Slides
Create dynamic presentations with our creative template of bar graph. This diagram may be used to present gender population. Download this template to leave permanent impression on your audience.
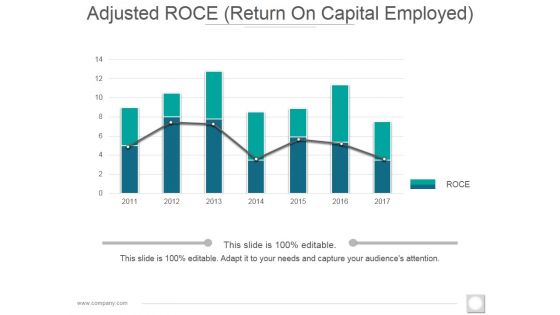
Adjusted Roce Template 1 Ppt PowerPoint Presentation Styles Background Designs
This is a adjusted roce template 1 ppt powerpoint presentation styles background designs. This is a seven stage process. The stages in this process are bar graph, finance, year, business, marketing.
Bar Chart Ppt PowerPoint Presentation Icon Demonstration
This is a bar chart ppt powerpoint presentation icon demonstration. This is a seven stage process. The stages in this process are product, sales in percentage, financial year, graph.

Clustered Column Line Ppt PowerPoint Presentation Slide
This is a clustered column line ppt powerpoint presentation slide. This is a three stage process. The stages in this process are bar graph, growth, finance, product, sales in percentage.
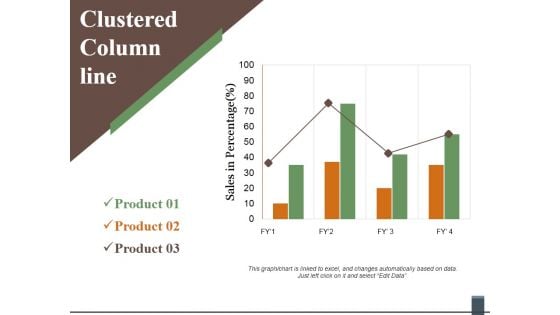
Clustered Column Line Ppt PowerPoint Presentation Inspiration Guidelines
This is a clustered column line ppt powerpoint presentation inspiration guidelines. This is a three stage process. The stages in this process are product, sales in percentage, graph, line, finance, business.
Product Launch Budget Plan Ppt PowerPoint Presentation Icon Slide
This is a product launch budget plan ppt powerpoint presentation icon slide. This is a seven stage process. The stages in this process are bar graph, icons, percentage, finance, business.
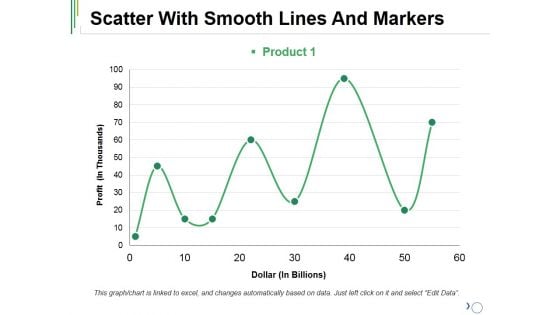
Scatter With Smooth Lines And Markers Ppt PowerPoint Presentation Outline Mockup
This is a scatter with smooth lines and markers ppt powerpoint presentation outline mockup. This is a one stage process. The stages in this process are product, finance, line graph, business, management.
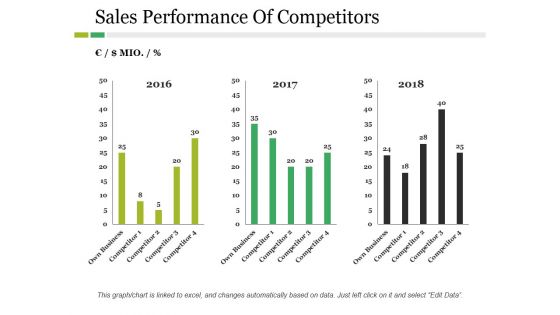
Sales Performance Of Competitors Ppt PowerPoint Presentation Inspiration Example
This is a sales performance of competitors ppt powerpoint presentation inspiration example. This is a three stage process. The stages in this process are business, marketing, year, bar graph, finance.
Competitors Average Price Product Ppt PowerPoint Presentation Icon Layout
This is a competitors average price product ppt powerpoint presentation icon layout. This is a five stage process. The stages in this process are company, bar graph, finance, business, marketing.
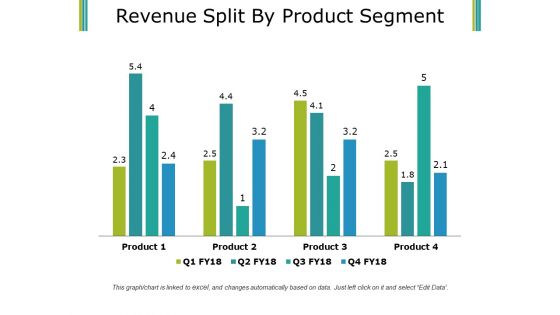
Revenue Split By Product Segment Template 1 Ppt PowerPoint Presentation Infographics Smartart
This is a revenue split by product segment template 1 ppt powerpoint presentation infographics smartart. This is a four stage process. The stages in this process are business, finance, marketing, bar graph, product.
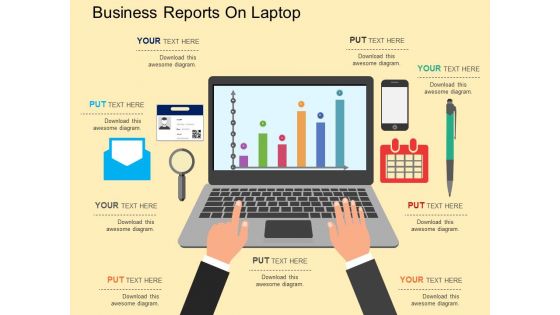
Business Reports On Laptop Powerpoint Template
This PPT slide has been designed with graphics of laptop on office table presenting statistical graph. This business diagram maybe used to exhibit management strategy. Use this diagram to build an exclusive presentation.
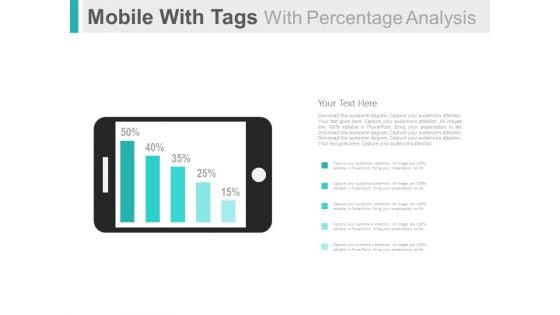
Mobile For Online Survey And Analysis Powerpoint Slides
This PowerPoint template has been designed with graphics of mobile and percentage bar graph. This PPT slide can be used to display online survey and analysis. You can download finance PowerPoint template to prepare awesome presentations.
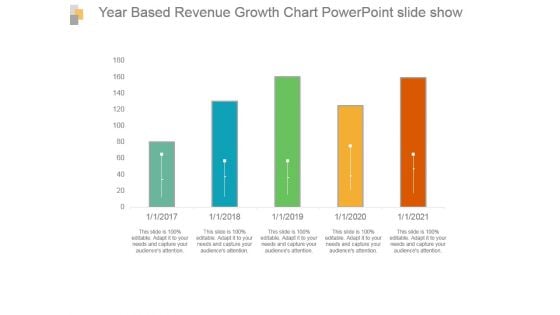
Year Based Revenue Growth Chart Powerpoint Slide Show
This is a year based revenue growth chart powerpoint slide show. This is a five stage process. The stages in this process are bar graph, growth, revenue, year, success.
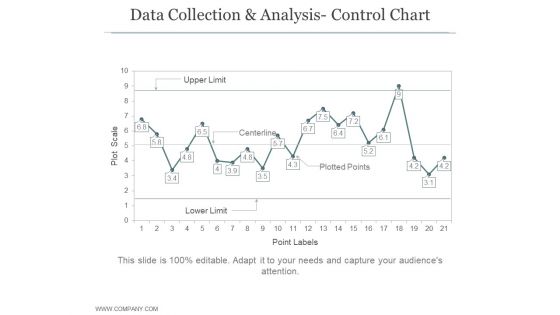
Data Collection And Analysis Control Chart Ppt PowerPoint Presentation Example File
This is a data collection and analysis control chart ppt powerpoint presentation example file. This is a four stage process. The stages in this process are business, strategy, marketing, bar graph, growth strategy.
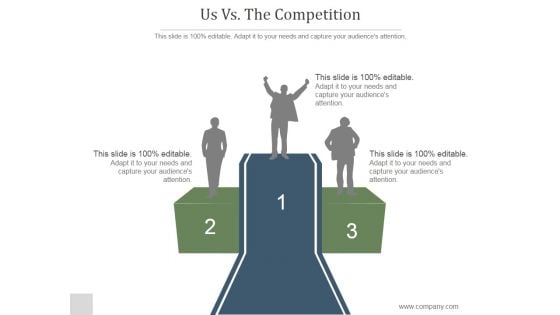
Us Vs The Competition Slide Ppt PowerPoint Presentation Examples
This is a us vs the competition slide ppt powerpoint presentation examples. This is a five stage process. The stages in this process are year, graph, marketing, year, management.
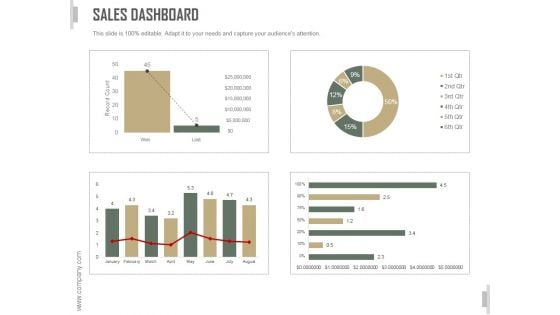
Sales Dashboard Slide Ppt PowerPoint Presentation Template
This is a sales dashboard slide ppt powerpoint presentation template. This is a three stage process. The stages in this process are business, strategy, marketing, analysis, bar graph, growth strategy.
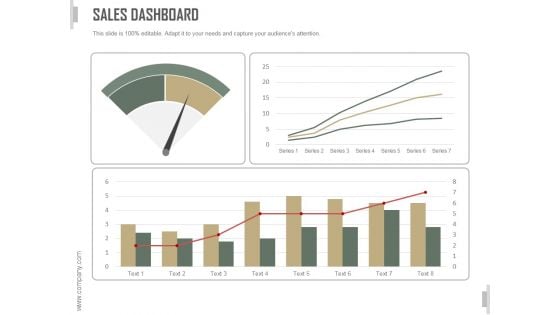
Sales Dashboard Ppt PowerPoint Presentation Design Templates
This is a sales dashboard ppt powerpoint presentation design templates. This is a four stage process. The stages in this process are business, strategy, marketing, analysis, bar graph, growth strategy.
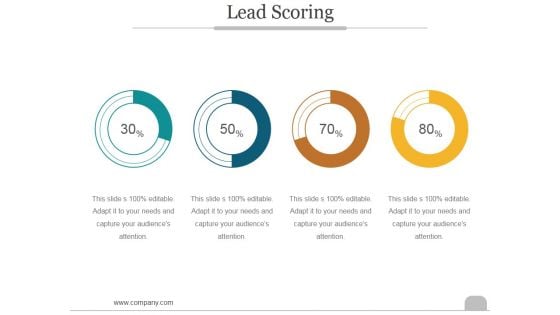
Lead Scoring Template Ppt PowerPoint Presentation Model
This is a lead scoring template ppt powerpoint presentation model. This is a four stage process. The stages in this process are business, marketing, success, bar graph, lead scoring.
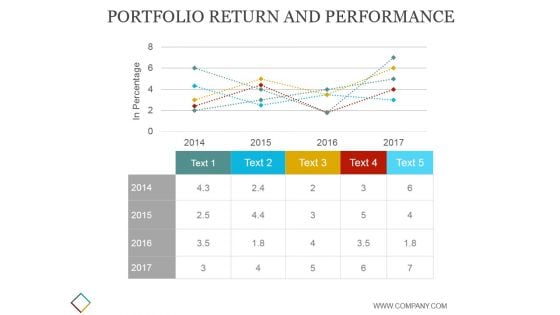
Portfolio Return And Performance Template Ppt PowerPoint Presentation Visuals
This is a portfolio return and performance template ppt powerpoint presentation visuals. This is a five stage process. The stages in this process are business, strategy, marketing, analysis, finance, chart and graph, growth.
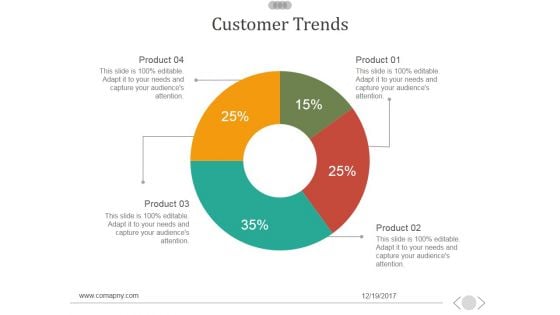
Customer Trends Template 1 Ppt PowerPoint Presentation Diagrams
This is a customer trends template 1 ppt powerpoint presentation diagrams. This is a five stage process. The stages in this process are business, marketing, bar graph, finance, management.
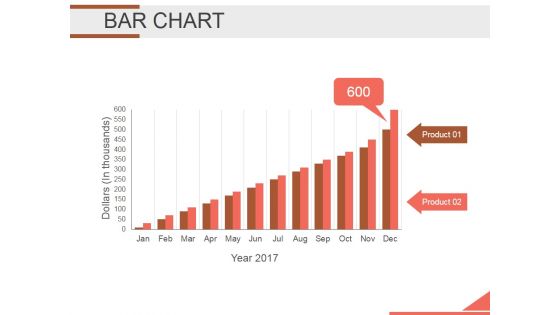
Bar Chart Ppt PowerPoint Presentation Background Designs
This is a bar chart ppt powerpoint presentation background designs. This is a twelve stage process. The stages in this process are bar graph, finance, marketing, strategy, analysis, investment.
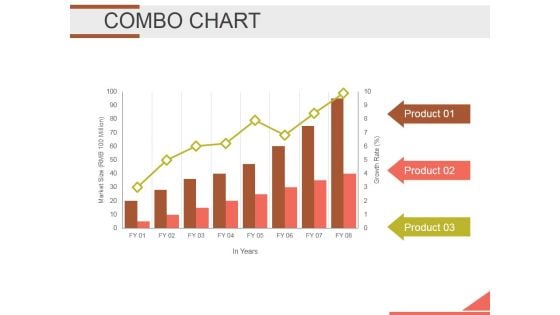
Combo Chart Ppt PowerPoint Presentation Infographics Infographics
This is a combo chart ppt powerpoint presentation infographics infographics. This is a three stage process. The stages in this process are bar graph, growth, finance, marketing, strategy, business.
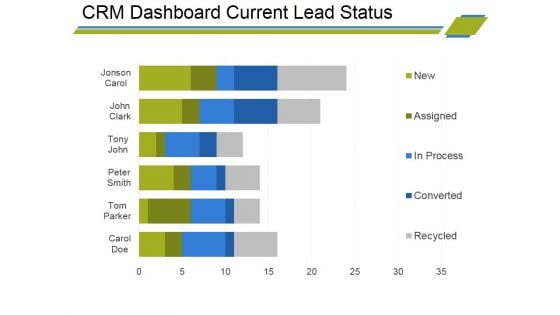
Crm Dashboard Current Lead Status Ppt PowerPoint Presentation Infographic Template Visual Aids
This is a crm dashboard current lead status ppt powerpoint presentation infographic template visual aids. This is a six stage process. The stages in this process are bar graph, finance, marketing, strategy, business, analysis.
Crm Dashboard Deals By Expected Close Date Ppt PowerPoint Presentation Portfolio Icons
This is a crm dashboard deals by expected close date ppt powerpoint presentation portfolio icons. This is a three stage process. The stages in this process are bar graph, finance, marketing, strategy, business, analysis, growth.
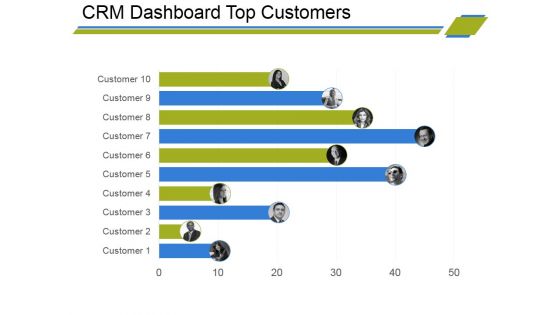
Crm Dashboard Top Customers Ppt PowerPoint Presentation Styles Designs
This is a crm dashboard top customers ppt powerpoint presentation styles designs. This is a ten stage process. The stages in this process are business, customer, finance, bar graph, marketing, strategy, analysis.
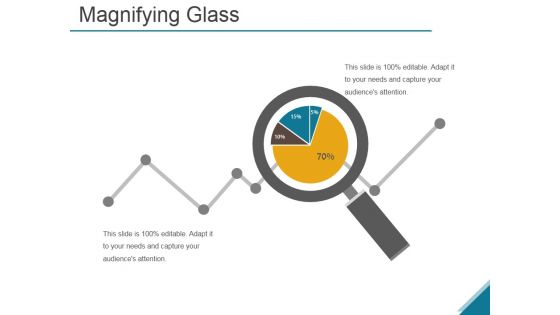
Magnifying Ppt PowerPoint Presentation Outline Maker
This is a magnifying ppt powerpoint presentation outline maker. This is a four stage process. The stages in this process are business, strategy, analysis, success, chart and graph, finance.
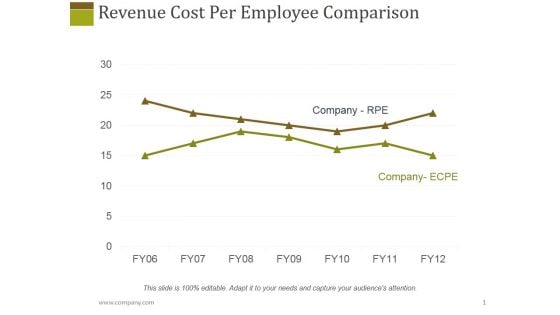
Revenue Cost Per Employee Comparison Ppt PowerPoint Presentation Diagram Lists
This is a revenue cost per employee comparison ppt powerpoint presentation diagram lists. This is a seven stage process. The stages in this process are year, graph, management, finance, company rpe.
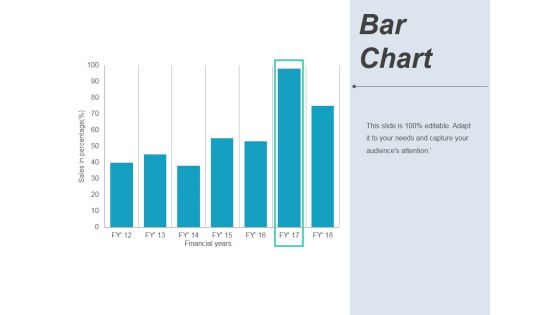
Bar Chart Ppt PowerPoint Presentation Pictures Background Image
This is a bar chart ppt powerpoint presentation pictures background image. This is a seven stage process. The stages in this process are financial years, sales in percentage, graph, business.

Advertising Spent On Different Mediums Ppt PowerPoint Presentation Infographics Show
This is a advertising spent on different mediums ppt powerpoint presentation infographics show. This is a five stage process. The stages in this process are business, finance, marketing, strategy, bar graph, growth.
Revenue Split By Product Segment Template 1 Ppt PowerPoint Presentation Ideas Icons
This is a revenue split by product segment template 1 ppt powerpoint presentation ideas icons. This is a four stage process. The stages in this process are business, marketing, success, bar graph, product.
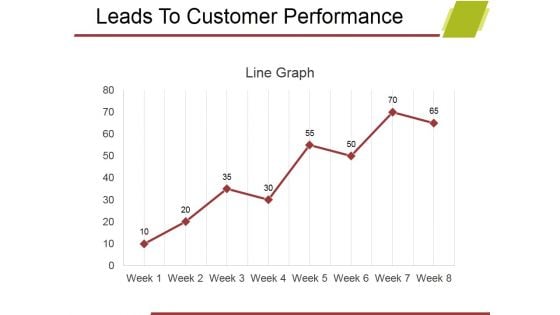
Leads To Customer Performance Ppt PowerPoint Presentation Professional Background Designs
This is a leads to customer performance ppt powerpoint presentation professional background designs. This is a eight stage process. The stages in this process are business, line graph, marketing, growth, management.
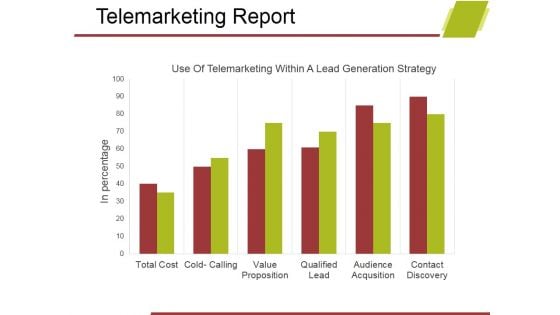
Telemarketing Report Template 1 Ppt PowerPoint Presentation Show Design Ideas
This is a telemarketing report template 1 ppt powerpoint presentation show design ideas. This is a six stage process. The stages in this process are business, bar graph, marketing, analysis, growth, strategy.
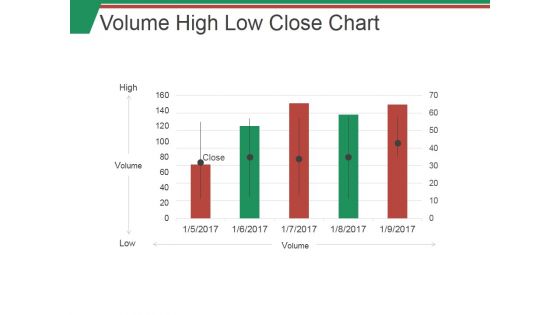
Volume High Low Close Chart Ppt PowerPoint Presentation Outline Examples
This is a volume high low close chart ppt powerpoint presentation outline examples. This is a five stage process. The stages in this process are high, low, volume, graph, business.
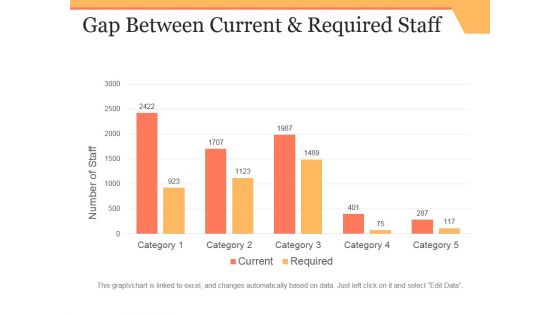
Gap Between Current And Required Staff Ppt PowerPoint Presentation Infographic Template Microsoft
This is a gap between current and required staff ppt powerpoint presentation infographic template microsoft. This is a five stage process. The stages in this process are business, bar graph, finance, marketing, strategy, analysis.
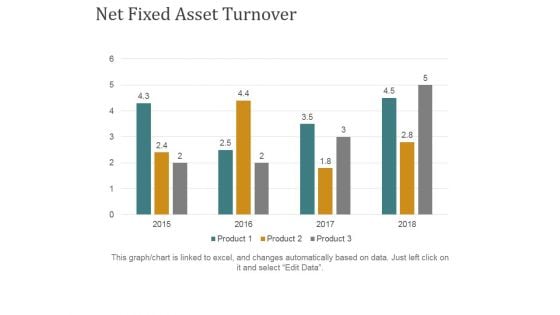
Net Fixed Asset Turnover Ppt PowerPoint Presentation Ideas Grid
This is a net fixed asset turnover ppt powerpoint presentation ideas grid. This is a four stage process. The stages in this process are business, finance, marketing, bar graph, strategy.
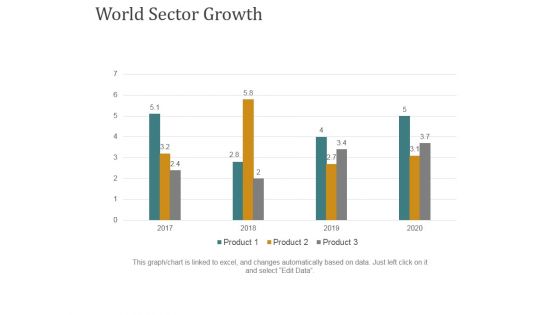
World Sector Growth Ppt PowerPoint Presentation Gallery Template
This is a world sector growth ppt powerpoint presentation gallery template. This is a four stage process. The stages in this process are business, bar graph, finance, marketing, strategy.
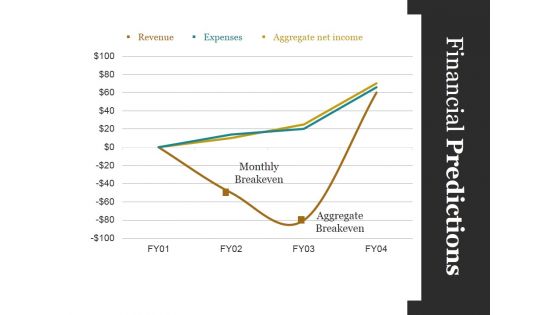
Financial Predictions Template Ppt PowerPoint Presentation Professional Objects
This is a financial predictions template ppt powerpoint presentation professional objects. This is a four stage process. The stages in this process are monthly breakeven, aggregate breakeven, graph, business, marketing.
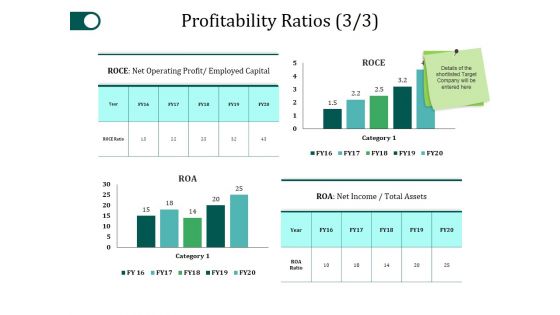
Profitability Ratios Template 3 Ppt PowerPoint Presentation Gallery Slide Portrait
This is a profitability ratios template 3 ppt powerpoint presentation gallery slide portrait. This is a four stage process. The stages in this process are category, roce, net income, business, bar graph.
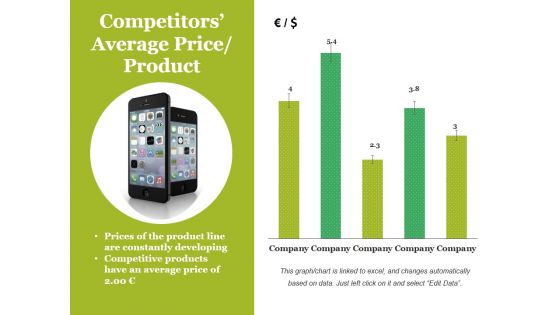
Competitors Average Price Product Ppt PowerPoint Presentation File Pictures
This is a competitors average price product ppt powerpoint presentation file pictures. This is a five stage process. The stages in this process are bar graph, business, marketing, finance, company.
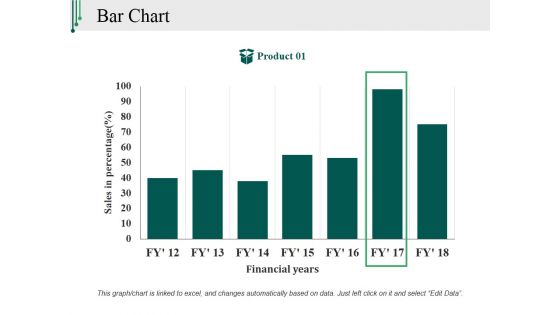
Bar Chart Ppt PowerPoint Presentation Outline Backgrounds
This is a bar chart ppt powerpoint presentation outline backgrounds. This is a one stage process. The stages in this process are sales in percentage, financial years, product, bar graph, finance.
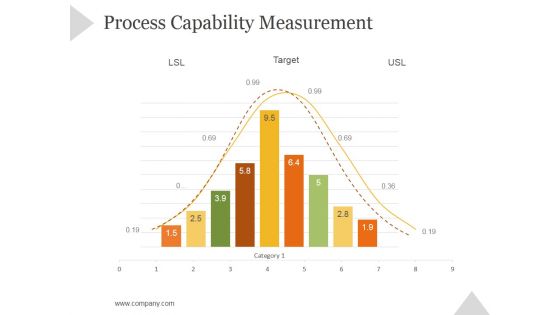
Process Capability Measurement Ppt PowerPoint Presentation Rules
This is a process capability measurement ppt powerpoint presentation rules. This is a nine stage process. The stages in this process are business, strategy, marketing, success, bar graph, growth strategy.
Revenue Generation Company Performance Ppt PowerPoint Presentation Icon
This is a revenue generation company performance ppt powerpoint presentation icon. This is a four stage process. The stages in this process are finance, planning, chart graph, marketing, strategy.
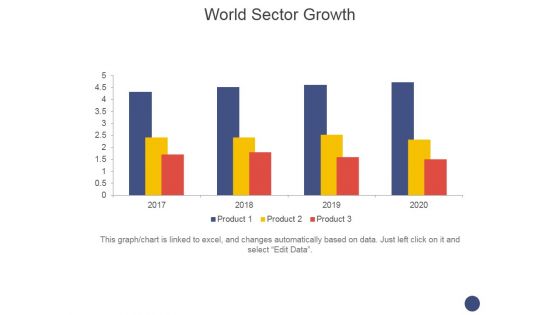
World Sector Growth Ppt PowerPoint Presentation Slides Graphics Example
This is a world sector growth ppt powerpoint presentation slides graphics example. This is a four stage process. The stages in this process are business, marketing, finance, graph, timeline.
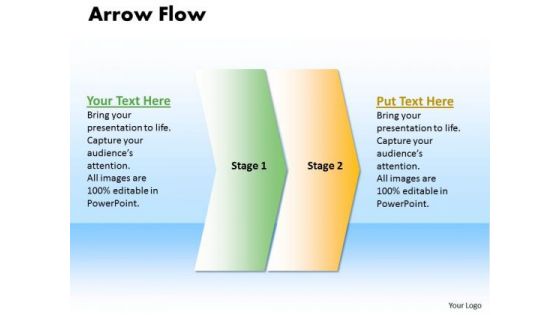
Ppt Linear Work Flow Chart PowerPoint 2 State Diagram Templates
PPT linear work flow chart powerpoint 2 state diagram Templates-This PPT slide is an effective way of displaying information you can edit text, color, shade and style as per you need.-PPT linear work flow chart powerpoint 2 state diagram Templates-Arrow, Art, Background, Blank, Business, Chart, Clip, Diagram, Drop, Flow, Graph, Graphic, Gray, Illustration, Process, Shadow, Shape, Step, Symbol, Three, Transparency Acquire the aura of a champion. Enhance your charisma with our Ppt Linear Work Flow Chart PowerPoint 2 State Diagram Templates.
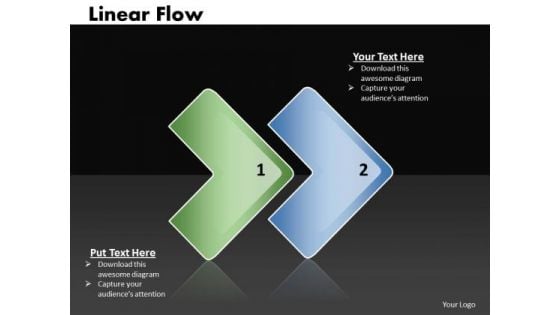
Ppt Linear Flow 2 Stages PowerPoint Templates
PPT linear flow 2 stages PowerPoint Templates-Use this diagram to show either related or contrasting concepts with some connection.-PPT linear flow 2 stages PowerPoint Templates-Abstract, Arrow, Arrow Chart, Business, Design, Development, Diagram, Direction, Element, Flow, Flow Chart, Flow Diagram, Flowchart, Graph, Linear, Management, Model, Motion, Organization, Plan, Process, Process Arrows, Process Chart, Process Diagram, Process Flow, Program, Section, Segment, Set, Sign, Solution, Strategy, Symbol, Technology Our Ppt Linear Flow 2 Stages PowerPoint Templates make a great bait. Your ideas will hook them all.

Picture Of Money Flowing Out Of Bag Ppt PowerPoint Presentation Portfolio Visual Aids
Presenting this set of slides with name picture of money flowing out of bag ppt powerpoint presentation portfolio visual aids. This is a one stage process. The stages in this process are loss, decrease graph, stock market. This is a completely editable PowerPoint presentation and is available for immediate download. Download now and impress your audience.
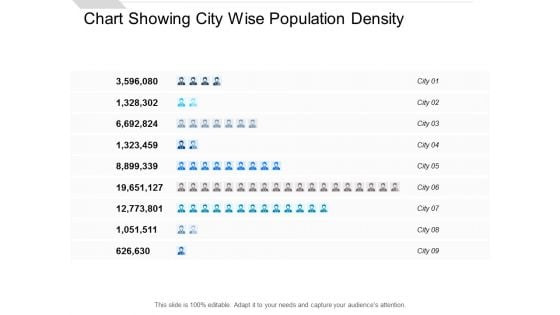
Chart Showing City Wise Population Density Ppt PowerPoint Presentation Infographic Template Slides
Presenting this set of slides with name chart showing city wise population density ppt powerpoint presentation infographic template slides. This is a nine stage process. The stages in this process are people graph, sales performance, population data demographics. This is a completely editable PowerPoint presentation and is available for immediate download. Download now and impress your audience.
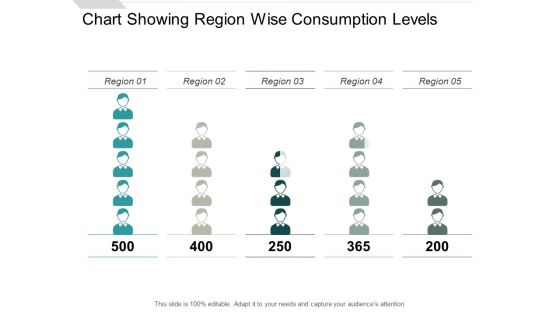
Chart Showing Region Wise Consumption Levels Ppt PowerPoint Presentation Layouts Design Ideas
Presenting this set of slides with name chart showing region wise consumption levels ppt powerpoint presentation layouts design ideas. This is a five stage process. The stages in this process are people graph, sales performance, population data demographics. This is a completely editable PowerPoint presentation and is available for immediate download. Download now and impress your audience.

Graphical Representation Of Personal Interests Ppt PowerPoint Presentation Pictures Designs Download
Presenting this set of slides with name graphical representation of personal interests ppt powerpoint presentation pictures designs download. This is a five stage process. The stages in this process are people graph, sales performance, population data demographics. This is a completely editable PowerPoint presentation and is available for immediate download. Download now and impress your audience.
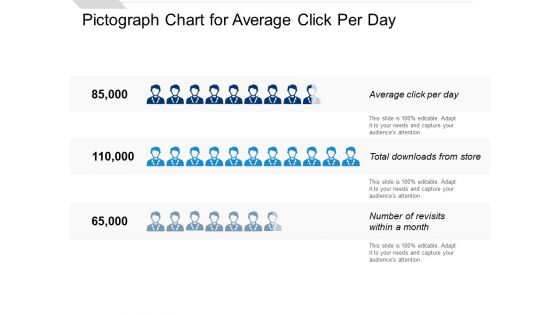
Pictograph Chart For Average Click Per Day Ppt PowerPoint Presentation Slides Format
Presenting this set of slides with name pictograph chart for average click per day ppt powerpoint presentation slides format. This is a three stage process. The stages in this process are people graph, sales performance, population data demographics. This is a completely editable PowerPoint presentation and is available for immediate download. Download now and impress your audience.

Population Data Demographics Yearly Representation Ppt PowerPoint Presentation Ideas Layout
Presenting this set of slides with name population data demographics yearly representation ppt powerpoint presentation ideas layout. This is a four stage process. The stages in this process are people graph, sales performance, population data demographics. This is a completely editable PowerPoint presentation and is available for immediate download. Download now and impress your audience.
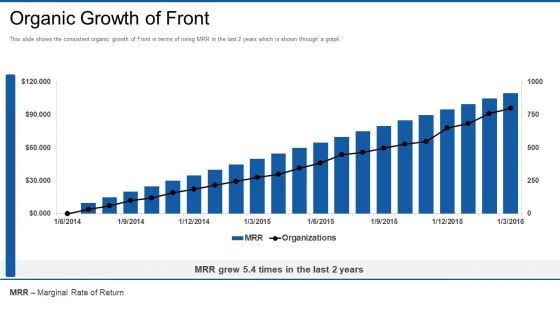
Front Series Venture Capital Funding Organic Growth Of Front Ideas PDF
This slide shows the consistent organic growth of Front in terms of rising MRR in the last 2 years which is shown through a graph. Deliver an awe inspiring pitch with this creative front series venture capital funding organic growth of front ideas pdf bundle. Topics like organic growth of front can be discussed with this completely editable template. It is available for immediate download depending on the needs and requirements of the user.
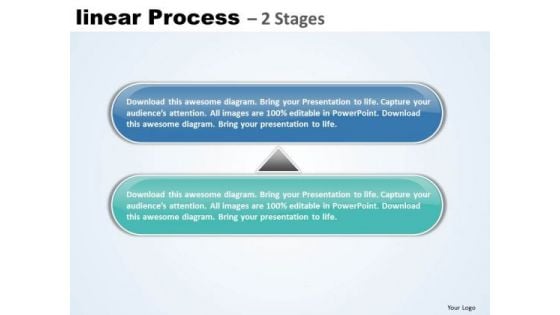
Usa Ppt Background Linear Process 2 Phase Diagram Business Plan PowerPoint 1 Graphic
USA PPT Background linear process 2 phase diagram business plan powerpoint 1 Graphic-\nThis PowerPoint diagram slide has 2 stylish text boxes. This unique image makes your presentations professional and interactive. Deliver amazing presentations to mesmerize your audience.-USA PPT Background linear process 2 phase diagram business plan powerpoint 1 Graphic-Abstract, Achievement, Adding, Analyzing, Arrow, Art, Background, Blank, Blue, Business, Chart, Color, Colorful, Cycle, Data, Design, Diagram, Element, Flow, Graph, Graphic, Gray, Green, Icon, Linear, Management, Market, Numbers, Percent, Process, Project, Round, Stock, Success Load your gun with our Usa Ppt Background Linear Process 2 Phase Diagram Business Plan PowerPoint 1 Graphic. You will come out on top.
Sales Ppt Background Arrow Process 2 Stages Style 1 Project Management PowerPoint Graphic
sales PPT Background arrow process 2 stages style 1 project management powerpoint Graphic- Use our creative template to lay down your views. It enhances the essence of your viable ideas. This template had designed to attract the attention of your audience.-sales PPT Background arrow process 2 stages style 1 project management powerpoint Graphic-Advertisement, Aqua, Arrow, Blank, Blue, Bread-Crumbs, Business, Button, Collection, Decoration, Design, Direction, Elegance, Element, Empty, Financial, Flow, Gradient, Graph, Horizontal, Illustration, Image, Isolated, Label, Menu, Placard, Process Beat the crowd with our Sales Ppt Background Arrow Process 2 Stages Style 1 Project Management PowerPoint Graphic. You will come out on top.
Editable PowerPoint Template Arrow Process 2 Stages Style 1 Business Plan Ppt Image
editable PowerPoint template arrow process 2 stages style 1 business plan ppt Image-You have the ideas and plans on how to achieve success Step by step develop the entire picture and project it onto minds of your team. Use this excellent graphics that allows you to effectively highlight the key issues concerning the growth of your business.-editable PowerPoint template arrow process 2 stages style 1 business plan ppt Image-Advertisement, Aqua, Arrow, Blank, Blue, Bread-Crumbs, Business, Button, Collection, Decoration, Design, Direction, Elegance, Element, Empty, Financial, Flow, Gradient, Graph, Horizontal, Illustration, Image, Isolated, Label, Menu, Placard, Process Give it your all with our Editable PowerPoint Template Arrow Process 2 Stages Style 1 Business Plan Ppt Image. They will back you every inch of the way.
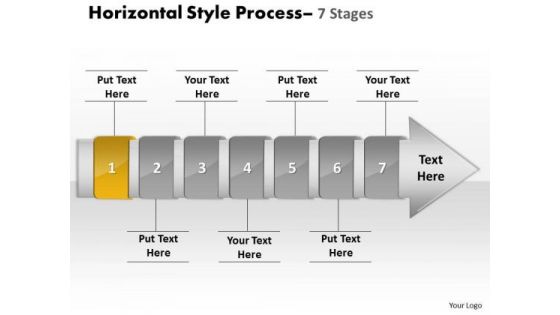
Ppt Theme Linear Demonstration Of 7 Phase Diagram Process 2 Graphic
We present our PPT Theme linear demonstration of 7 phase diagram Process 2 Graphic. Use our Arrows PowerPoint Templates because, the lessons have been analyzed, studied and conclusions drawn. Use our Shapes PowerPoint Templates because; Raise your Company stocks at the Opening Bell. Use our Finance PowerPoint Templates because, are the Tools of the Trade. Use our Business PowerPoint Templates because; illustrate these thoughts with this slide. Use our Process and Flows PowerPoint Templates because; Place them where they need to be. Use these PowerPoint slides for presentations relating to accent, advertisement, arrow, badge, banner, business, button, collection, color, decoration, design, direction, element, financial, flow, graph, horizontal, instruction, isolated, label, manual, message, process, sale, set, shape, steps, symbol, template. The prominent colors used in the PowerPoint template are Yellow, Gray, and Black Draw attention to your expertise. Our Ppt Theme Linear Demonstration Of 7 Phase Diagram Process 2 Graphic are the best bet to do so.


 Continue with Email

 Home
Home


