Two Lists
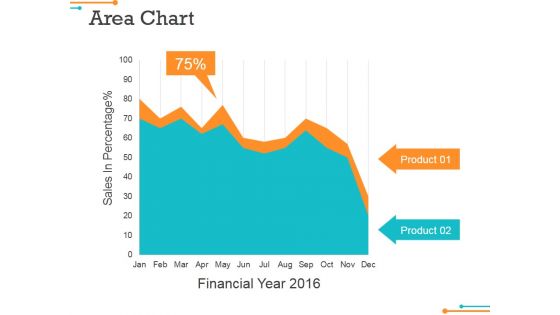
Area Chart Ppt Powerpoint Presentation File Show
This is a area chart ppt powerpoint presentation file show. This is a two stage process. The stages in this process are sales in percentage, financial year, product, financial, business.
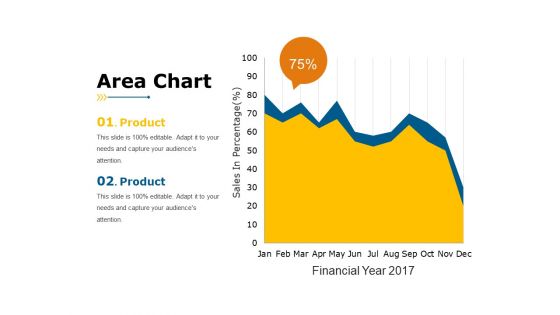
Area Chart Ppt PowerPoint Presentation Slides Rules
This is a area chart ppt powerpoint presentation slides rules. This is a two stage process. The stages in this process are sales in percentage, business, marketing, product, finance.
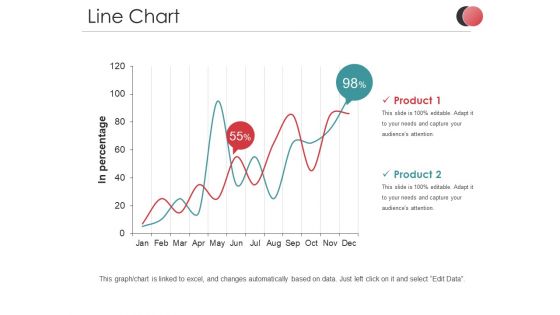
Line Chart Ppt PowerPoint Presentation Professional Ideas
This is a line chart ppt powerpoint presentation professional ideas. This is a two stage process. The stages in this process are in percentage, product, business, marketing, finance, percentage.
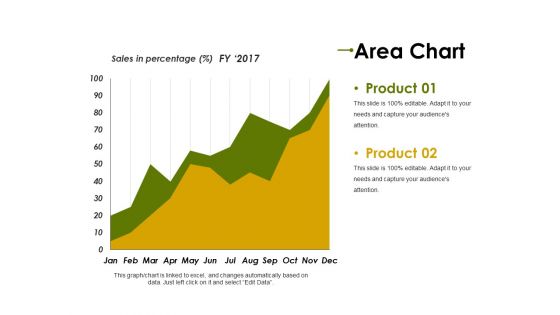
Area Chart Ppt PowerPoint Presentation Summary Objects
This is a area chart ppt powerpoint presentation summary objects. This is a two stage process. The stages in this process are product, sales in percentage, finance, business, marketing.
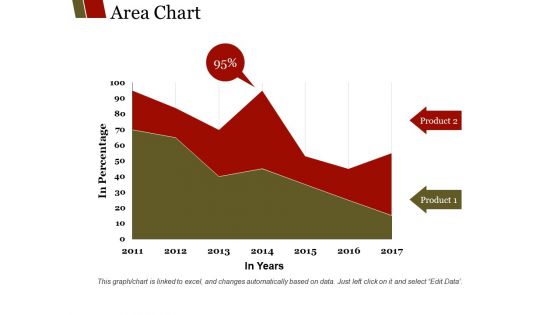
Area Chart Ppt PowerPoint Presentation Show Templates
This is a area chart ppt powerpoint presentation show templates. This is a two stage process. The stages in this process are product, in percentage, in years, finance, graph.
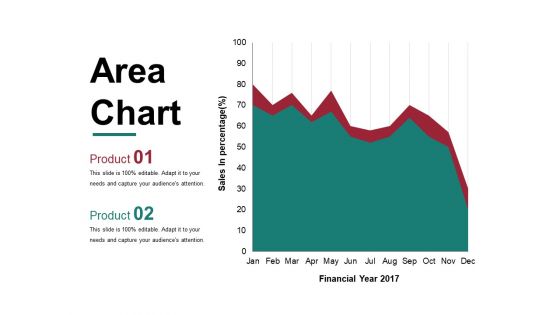
Area Chart Ppt PowerPoint Presentation Layouts Maker
This is a area chart ppt powerpoint presentation layouts maker. This is a two stage process. The stages in this process are financial year, sales in percentage, graph, business, marketing.
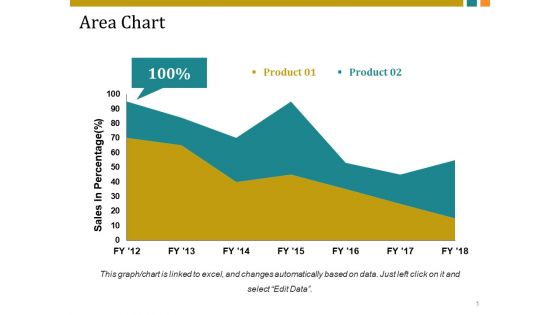
Area Chart Ppt PowerPoint Presentation Professional Brochure
This is a area chart ppt powerpoint presentation professional brochure. This is a two stage process. The stages in this process are sales in percentage, business, marketing, finance, graph.
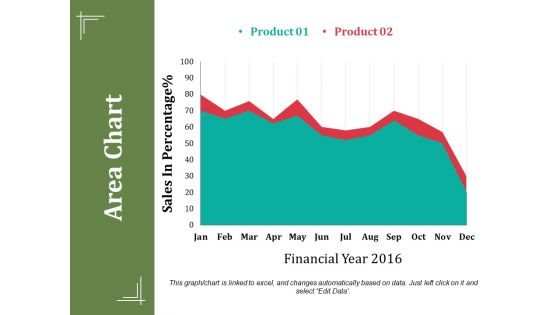
Area Chart Ppt PowerPoint Presentation Summary Show
This is a area chart ppt powerpoint presentation summary show. This is a two stage process. The stages in this process are sales in percentage, financial year, business, marketing, finance.
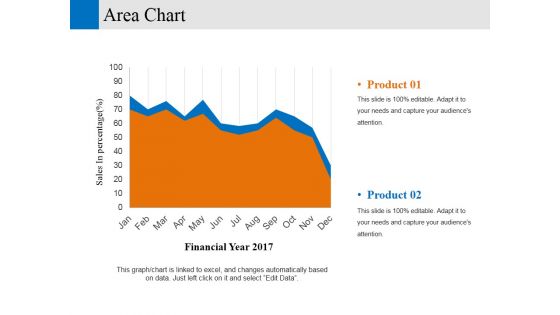
area chart ppt powerpoint presentation professional elements
This is a area chart ppt powerpoint presentation professional elements. This is a two stage process. The stages in this process are financial year sales in percentage, business, marketing, graph.
Column Chart Ppt PowerPoint Presentation Icon Guide
This is a column chart ppt powerpoint presentation icon guide. This is a two stage process. The stages in this process are business, year, sales in percentage, marketing, graph.
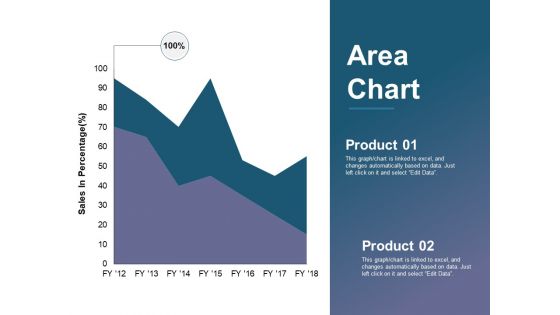
Area Chart Ppt PowerPoint Presentation Summary Information
This is a area chart ppt powerpoint presentation summary information. This is a two stage process. The stages in this process are business, sales in percentage, percentage, marketing, graph.
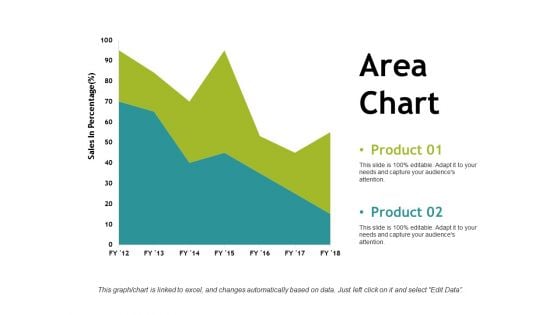
Area Chart Ppt PowerPoint Presentation File Visuals
This is a area chart ppt powerpoint presentation file visuals. This is a two stage process. The stages in this process are business, sales in percentage, marketing, graph, strategy, finance.
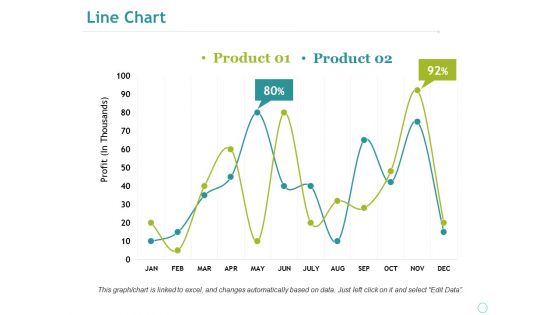
Line Chart Ppt PowerPoint Presentation Professional Portfolio
This is a line chart ppt powerpoint presentation professional portfolio. This is a two stage process. The stages in this process are business, marketing, profit, percentage, graph, strategy, finance.
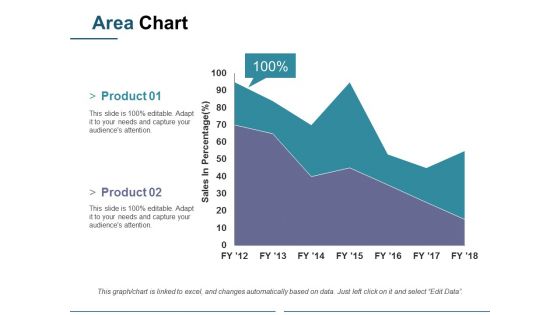
Area Chart Ppt PowerPoint Presentation Pictures Vector
This is a area chart ppt powerpoint presentation pictures vector. This is a two stage process. The stages in this process are sales in percentage, business, marketing, graph, percentage.
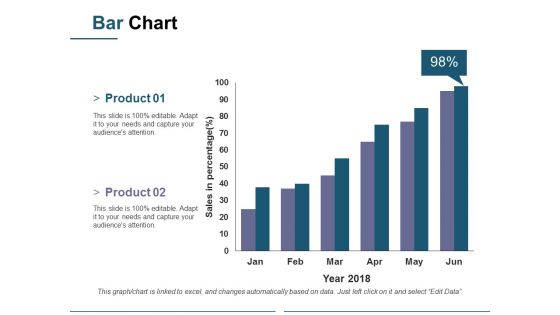
Bar Chart Ppt PowerPoint Presentation Model Sample
This is a bar chart ppt powerpoint presentation model sample. This is a two stage process. The stages in this process are sales in percentage, business, marketing, graph, percentage, year.
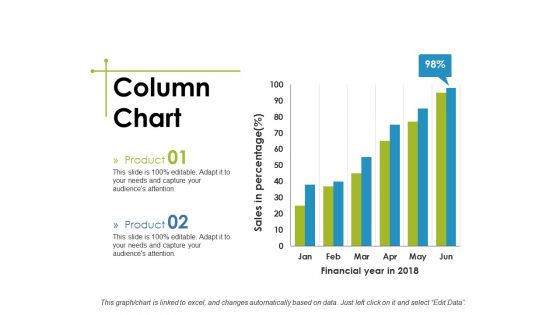
Column Chart Ppt PowerPoint Presentation Show Structure
This is a column chart ppt powerpoint presentation show structure. This is a two stage process. The stages in this process are business, financial year in, sales in percentage, marketing, graph.
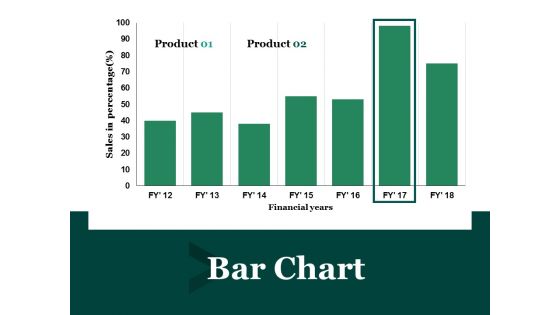
Bar Chart Ppt PowerPoint Presentation Layouts Template
This is a bar chart ppt powerpoint presentation layouts template. This is a two stage process. The stages in this process are financial year, sales in percentage, business, marketing, finance.
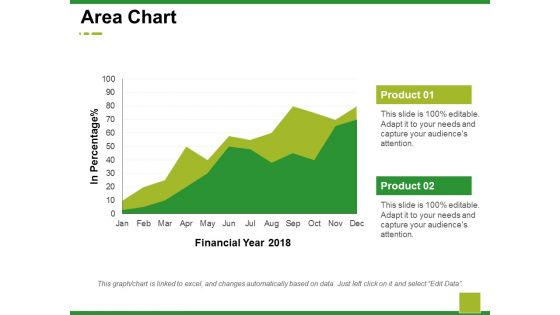
Area Chart Ppt PowerPoint Presentation Model Demonstration
This is a area chart ppt powerpoint presentation model demonstration. This is a two stage process. The stages in this process are business, marketing, financial year, in percentage, graph.
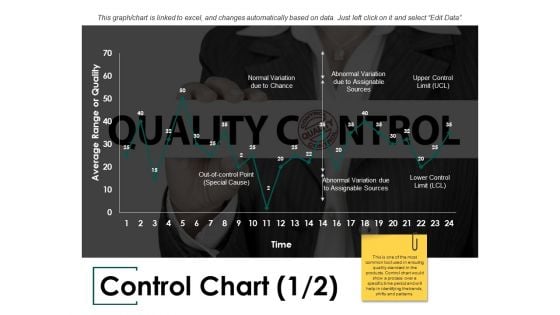
Control Chart Ppt PowerPoint Presentation Infographics Slide
This is a control chart ppt powerpoint presentation infographics slide. This is a two stage process. The stages in this process are normal variation due to chance, abnormal variation due to assignable sources, average range or quality.

Target Planning And Idea Generation Powerpoint Slides
This business slide has been designed with graphics of target board and two business icons. This diagram has been designed to display ideas of goal accomplishment. Develop your marketing strategy and communicate with your team with this professional slide design.
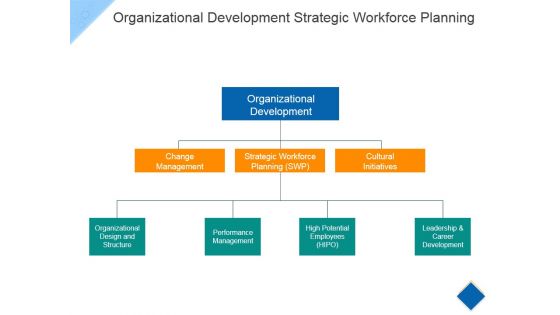
Organizational Development Strategic Workforce Planning Ppt PowerPoint Presentation Ideas Graphics Template
This is a organizational development strategic workforce planning ppt powerpoint presentation ideas graphics template. This is a two stage process. The stages in this process are organizational development, change management, strategic workforce planning, cultural initiatives, organizational design and structure.
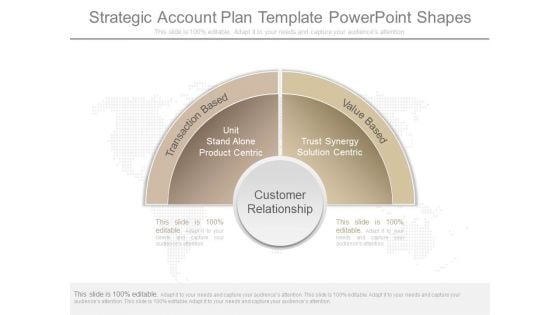
Strategic Account Plan Template Powerpoint Shapes
This is a strategic account plan template powerpoint shapes. This is a two stage process. The stages in this process are transaction based, value based, unit stand alone product centric, trust synergy solution centric, customer relationship.\n\n\n\n\n\n\n\n
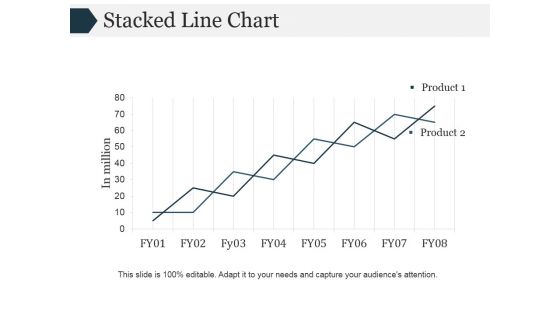
Stacked Line Chart Ppt PowerPoint Presentation Inspiration
This is a stacked line chart ppt powerpoint presentation inspiration. This is a two stage process. The stages in this process are stacked line chart, growth, analysis, management, business.
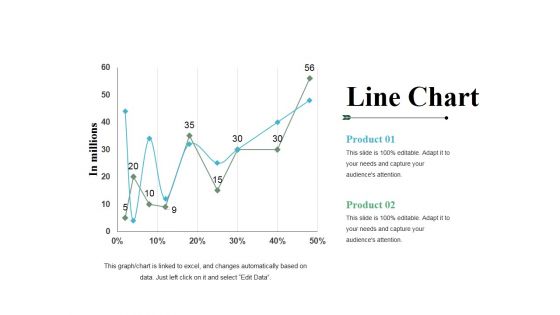
Line Chart Ppt PowerPoint Presentation File Templates
This is a line chart ppt powerpoint presentation file templates. This is a two stage process. The stages in this process are product, line chart, growth, percentage, in millions.
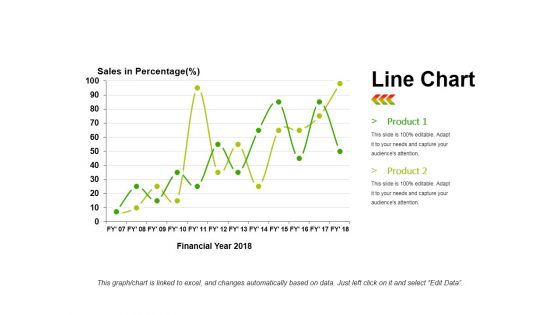
Line Chart Ppt PowerPoint Presentation Infographics Infographics
This is a line chart ppt powerpoint presentation infographics infographics. This is a two stage process. The stages in this process are product, sales in percentage, financial year, line chart, finance.
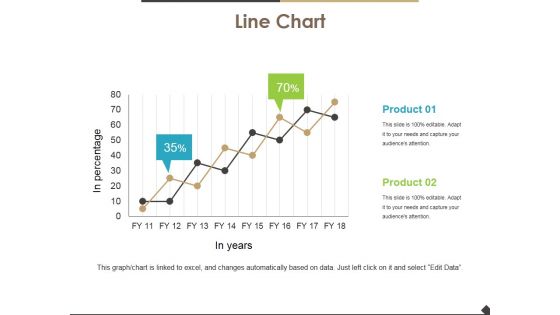
Line Chart Ppt PowerPoint Presentation Inspiration Graphics
This is a line chart ppt powerpoint presentation inspiration graphics. This is a two stage process. The stages in this process are line chart, growth, percentage, marketing, analysis, business.
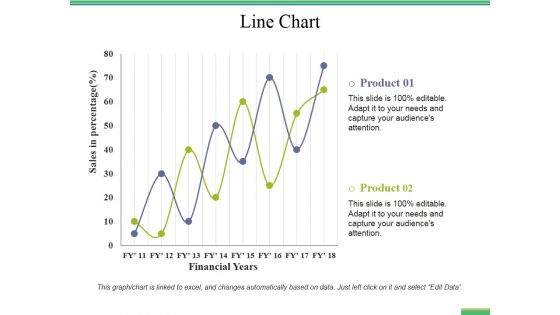
Line Chart Ppt PowerPoint Presentation Portfolio Portrait
This is a line chart ppt powerpoint presentation portfolio portrait. This is a two stage process. The stages in this process are line chart, growth, analysis, marketing, strategy, business.
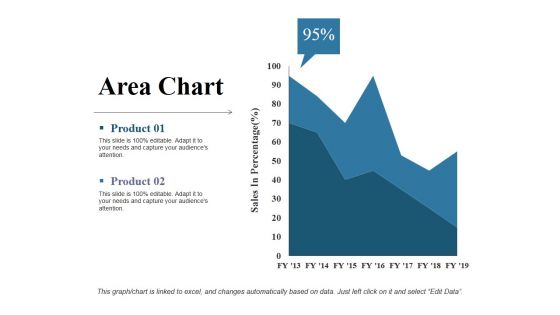
Area Chart Ppt PowerPoint Presentation Slides Example
This is a area chart ppt powerpoint presentation slides example. This is a two stage process. The stages in this process are sales in percentage, product, area chart, business, finance.
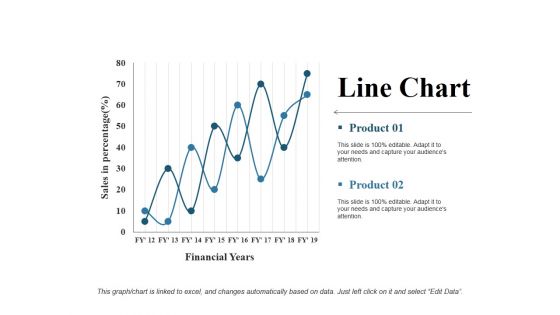
Line Chart Ppt PowerPoint Presentation Gallery Rules
This is a line chart ppt powerpoint presentation gallery rules. This is a two stage process. The stages in this process are financial years, product, sales in percentage, line chart, growth.
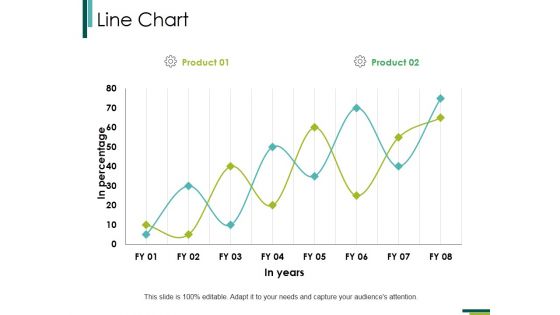
Line Chart Ppt PowerPoint Presentation Professional Examples
This is a line chart ppt powerpoint presentation professional examples. This is a two stage process. The stages in this process are line chart, analysis, growth, marketing, strategy, business.
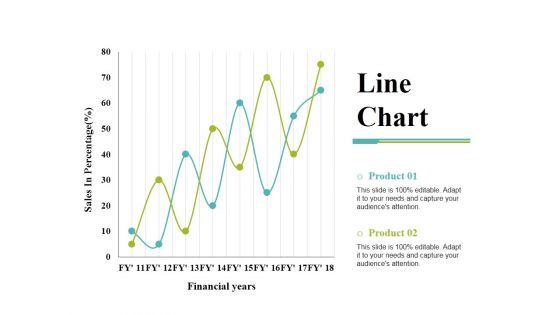
Line Chart Ppt PowerPoint Presentation Gallery Templates
This is a line chart ppt powerpoint presentation gallery templates. This is a two stage process. The stages in this process are product, financial years, sales in percentage, line chart.
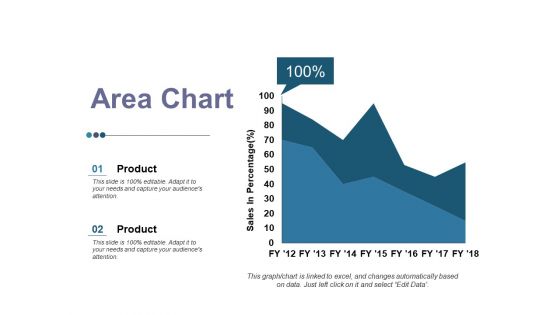
Area Chart Ppt PowerPoint Presentation Inspiration Graphics
This is a area chart ppt powerpoint presentation inspiration graphics. This is a two stage process. The stages in this process are product, area chart, business, growth, sales in percentage.
Area Chart Ppt PowerPoint Presentation Icon Show
This is a area chart ppt powerpoint presentation icon show. This is a two stage process. The stages in this process are product, financial year, in percentage, area chart.
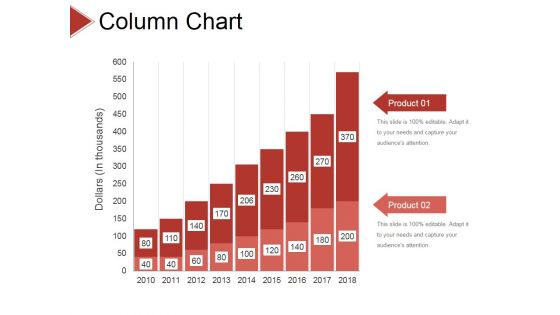
Column Chart Ppt PowerPoint Presentation Gallery Layouts
This is a column chart ppt powerpoint presentation gallery layouts. This is a two stage process. The stages in this process are business, strategy, analysis, pretention, chart and graph, growth.
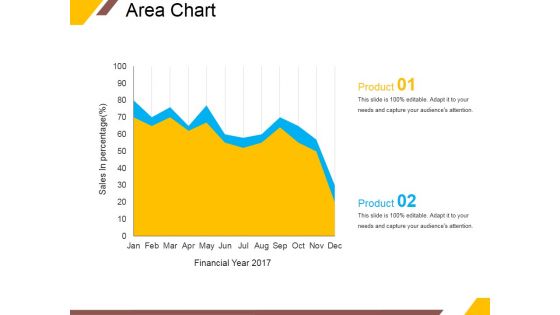
Area Chart Ppt PowerPoint Presentation Layouts Vector
This is a area chart ppt powerpoint presentation layouts vector. This is a two stage process. The stages in this process are area chart, product, sales in percentage, financial year.
Area Chart Ppt PowerPoint Presentation Ideas Icon
This is a area chart ppt powerpoint presentation ideas icon. This is a two stage process. The stages in this process are product, area chart, sales in percentage, growth, success.
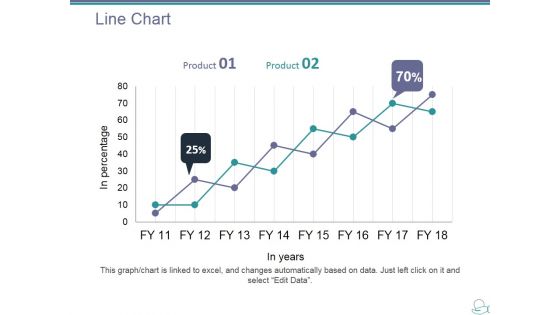
Line Chart Ppt PowerPoint Presentation Layouts Show
This is a line chart ppt powerpoint presentation layouts show. This is a two stage process. The stages in this process are product, in years, in percentage, line chart, growth.
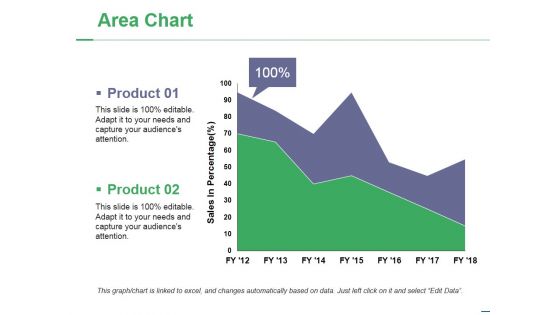
Area Chart Ppt PowerPoint Presentation Layouts Images
This is a area chart ppt powerpoint presentation layouts images. This is a two stage process. The stages in this process are product, sales in percentage, area chart, percentage, finance.
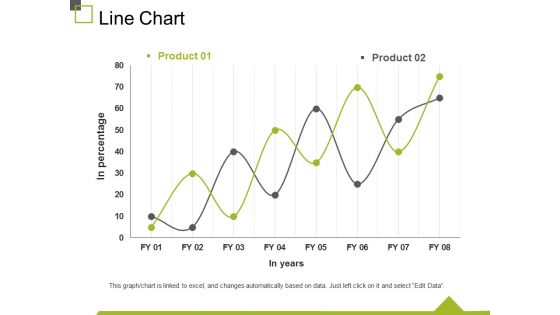
Line Chart Ppt PowerPoint Presentation Infographics Display
This is a line chart ppt powerpoint presentation infographics display. This is a two stage process. The stages in this process are in percentage, in years, chart, business, marketing.
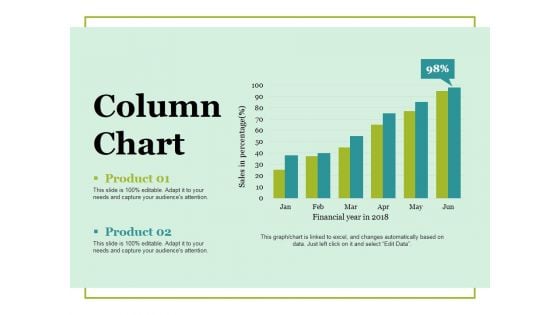
Column Chart Ppt PowerPoint Presentation Ideas Vector
This is a column chart ppt powerpoint presentation ideas vector. This is a two stage process. The stages in this process are column chart, product, financial years, sales in percentage, growth.
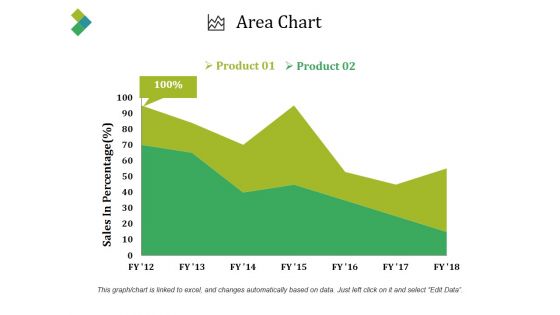
Area Chart Ppt PowerPoint Presentation Infographics Good
This is a area chart ppt powerpoint presentation infographics good. This is a two stage process. The stages in this process are sales in percentage, product, area chart, business, percentage.
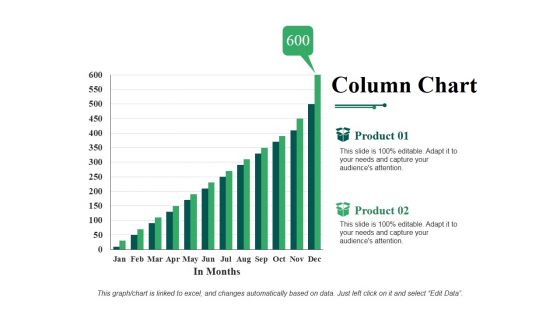
Column Chart Ppt PowerPoint Presentation Gallery Portfolio
This is a column chart ppt powerpoint presentation gallery portfolio. This is a two stage process. The stages in this process are in months, product, column chart, growth, success.
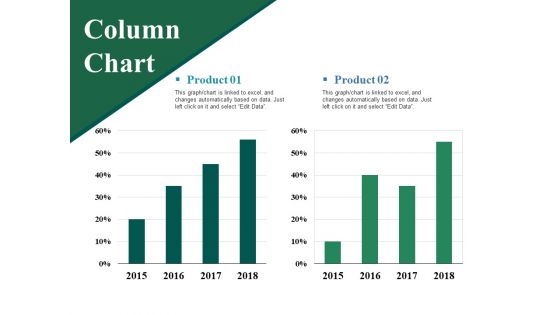
Column Chart Ppt PowerPoint Presentation Layouts Vector
This is a column chart ppt powerpoint presentation layouts vector. This is a two stage process. The stages in this process are product, column chart, bar graph, percentage, finance.
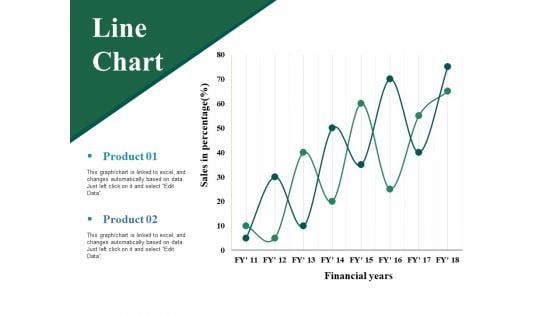
Line Chart Ppt PowerPoint Presentation Professional Grid
This is a line chart ppt powerpoint presentation professional grid. This is a two stage process. The stages in this process are sales in percentage, financial years, product, line chart.
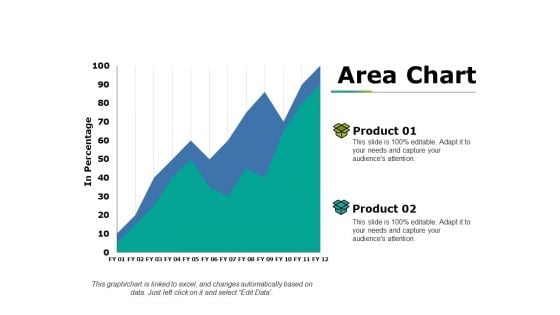
Area Chart Ppt PowerPoint Presentation Show Professional
This is a area chart ppt powerpoint presentation show professional. This is a two stage process. The stages in this process are product, in percentage, area chart, growth, success.
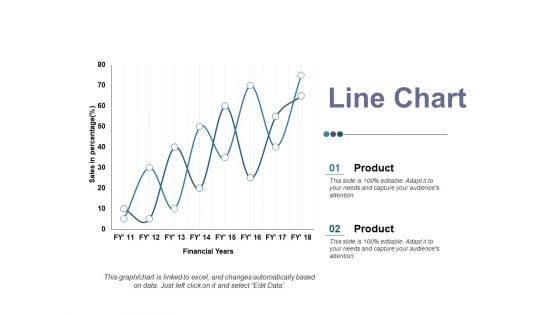
Line Chart Ppt PowerPoint Presentation Ideas Elements
This is a line chart ppt powerpoint presentation ideas elements. This is a two stage process. The stages in this process are product, sales in percentage, financial year, business, line chart.
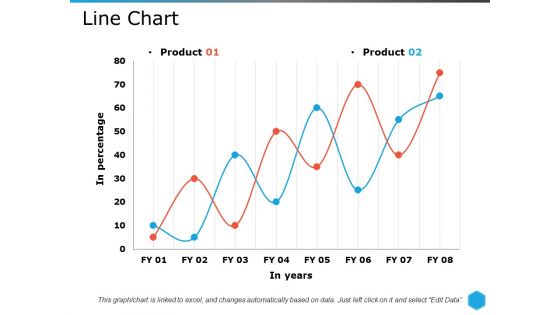
Line Chart Ppt PowerPoint Presentation Pictures Themes
This is a line chart ppt powerpoint presentation pictures themes. This is a two stage process. The stages in this process are line chart, growth, strategy, marketing, strategy, business.
Area Chart Ppt PowerPoint Presentation Icon Summary
This is a area chart ppt powerpoint presentation icon summary. This is a two stage process. The stages in this process are financial year, area chart, in percentage, product.
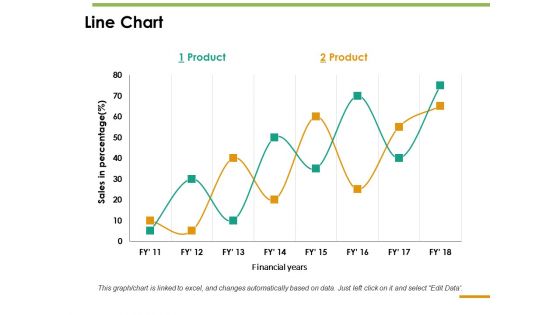
Line Chart Ppt PowerPoint Presentation Inspiration Guide
This is a line chart ppt powerpoint presentation inspiration guide. This is a two stage process. The stages in this process are line chart, sales in percentage, product, financial years.
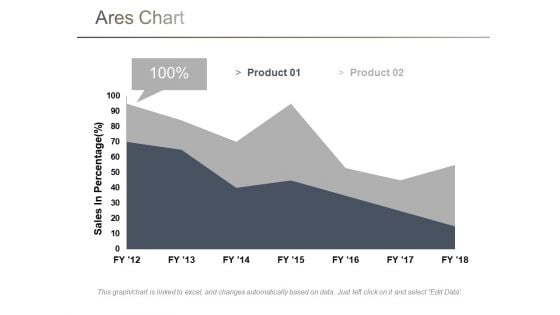
Area Chart Ppt PowerPoint Presentation Model Influencers
This is a area chart ppt powerpoint presentation model influencers. This is a two stage process. The stages in this process are sales in percentage, chart, business, marketing, finance.
Bar Chart Ppt PowerPoint Presentation Icon Diagrams
This is a bar chart ppt powerpoint presentation icon diagrams. This is a two stage process. The stages in this process are bar chart, finance, analysis, business, marketing, strategy.
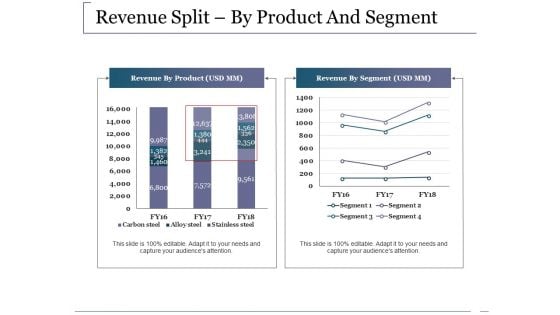
Revenue Split By Product And Segment Ppt PowerPoint Presentation Outline Shapes
This is a revenue split by product and segment ppt powerpoint presentation outline shapes. This is a two stage process. The stages in this process are business, revenue by product, revenue by segment, marketing, graph.
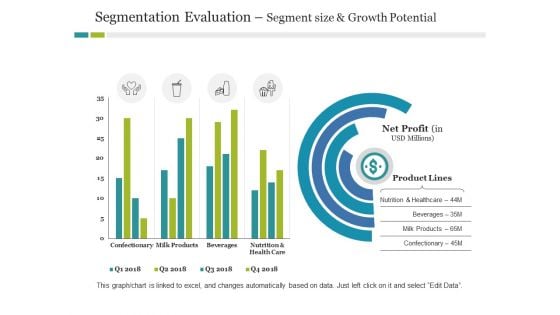
Segmentation Evaluation Segment Size And Growth Potential Ppt PowerPoint Presentation Infographic Template Outline
This is a segmentation evaluation segment size and growth potential ppt powerpoint presentation infographic template outline. This is a two stage process. The stages in this process are business, product lines, finance, marketing, strategy.
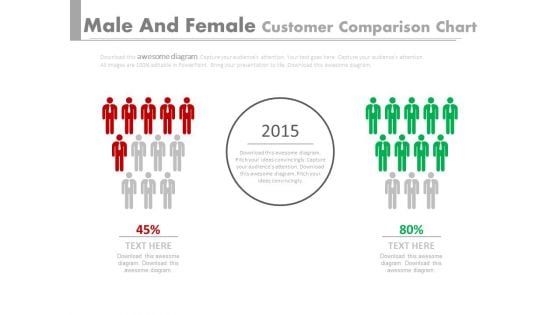
Red Green Teams Comparison Chart Powerpoint Slides
This PPT slide displays graphics of two red and green teams. Use this PPT design to display comparison of teams performances. This PowerPoint template can be customized as per requirements of business education or any other theme.
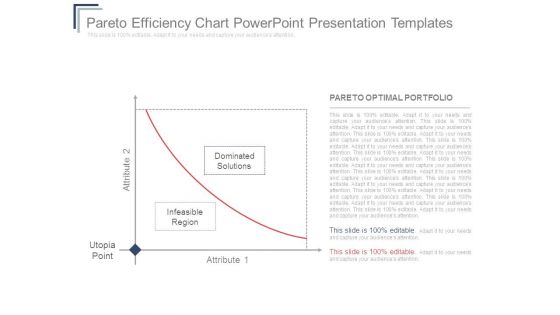
Pareto Efficiency Chart Powerpoint Presentation Templates
This is a pareto efficiency chart powerpoint presentation templates. This is a two stage process. The stages in this process are attribute 2, utopia, point, infeasible region, dominated, solutions, attribute 1, pareto optimal portfolio.
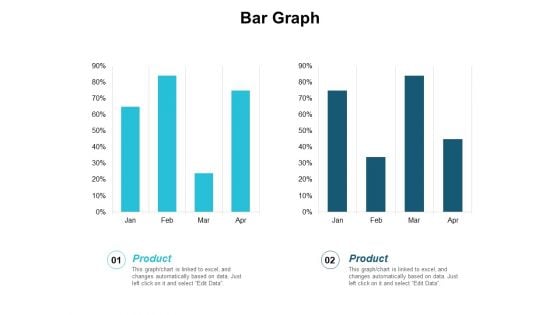
Bar Graph Finance Planning Ppt PowerPoint Presentation Infographic Template Master Slide
This is a bar graph finance planning ppt powerpoint presentation infographic template master slide. This is a two stage process. The stages in this process are finance, analysis, business, investment, marketing.
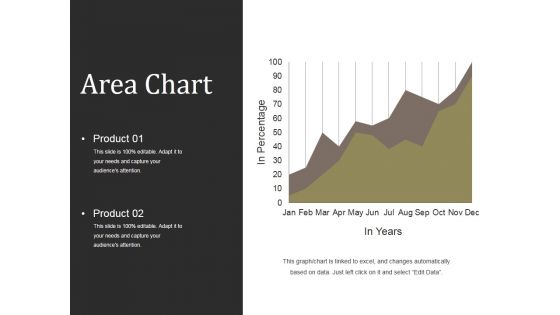
Area Chart Ppt PowerPoint Presentation Professional Designs
This is a area chart ppt powerpoint presentation professional designs. This is a two stage process. The stages in this process are in percentage, product, in years, strategy, business, marketing.
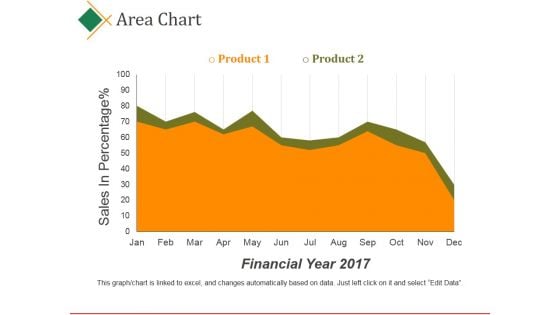
Area Chart Ppt PowerPoint Presentation Pictures Files
This is a area chart ppt powerpoint presentation pictures files. This is a two stage process. The stages in this process are product, sales, in percentage, financial year, business.
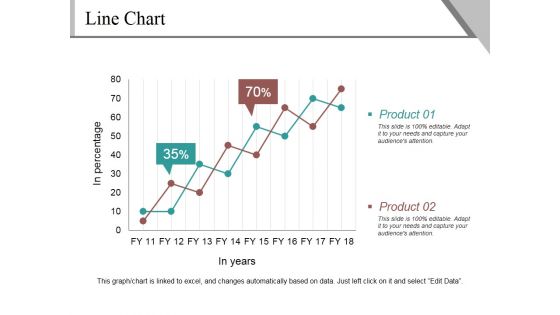
Line Chart Ppt PowerPoint Presentation Infographics Example
This is a line chart ppt powerpoint presentation infographics example. This is a two stage process. The stages in this process are product, in percentage, in years, finance, growth.
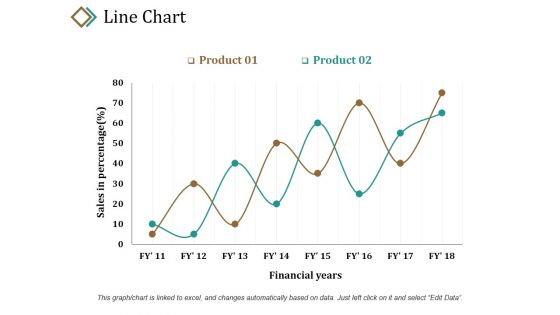
Line Chart Ppt PowerPoint Presentation Layouts Example
This is a line chart ppt powerpoint presentation layouts example. This is a two stage process. The stages in this process are sales in percentage, product, financial years, growth, success.


 Continue with Email

 Home
Home


