Two Phased Approach
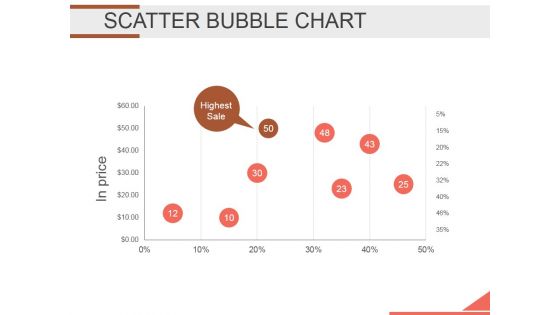
Scatter Bubble Chart Ppt PowerPoint Presentation Backgrounds
This is a scatter bubble chart ppt powerpoint presentation backgrounds. This is a one stage process. The stages in this process are bubble chart, finance, marketing, analysis, strategy, business.
Business Framework Model Labyrinth Rectangular Strategy Diagram
Dig in to our vast array of Business Framework Model Labyrinth Rectangular Strategy Diagram Powerpoint Templates. Be sure to come with many that fit your need perfectly. Unleash the value of your experience with our Business Framework Model Labyrinth Rectangular Strategy Diagram Powerpoint Templates. Educate your team with the knowledge you have gained.
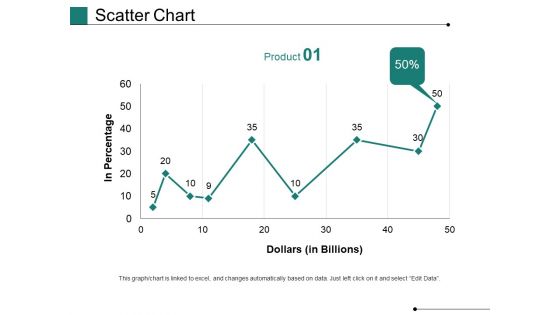
Scatter Chart Ppt PowerPoint Presentation Gallery Show
This is a scatter chart ppt powerpoint presentation gallery show. This is a one stage process. The stages in this process are in percentage, dollars, business, marketing, growth, graph.
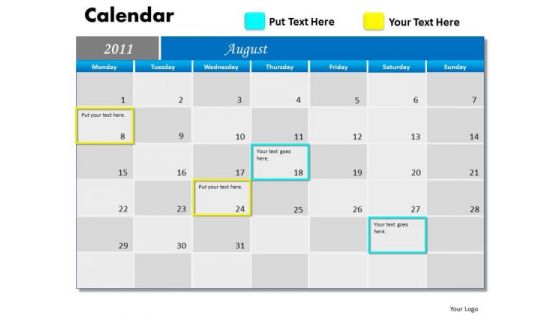
Strategy Diagram Blue Calendar 2011 Strategic Management
Doll Up Your Thoughts With Our Strategy_Diagram_Blue_Calendar_2011_Strategic_Management Powerpoint Templates. They Will Make A Pretty Picture. They Say A Dog Is Man's Best Friend. Our Strategy_Diagram_Blue_Calendar_2011_Strategic_Management Powerpoint Templates Come A Close Second.
DMAIC Technique Methodology For Quality Improvement Icons PDF
Presenting DMAIC Technique Methodology For Quality Improvement Icons PDF to dispense important information. This template comprises Five stages. It also presents valuable insights into the topics including Technique, Methodology, Quality Improvement. This is a completely customizable PowerPoint theme that can be put to use immediately. So, download it and address the topic impactfully.
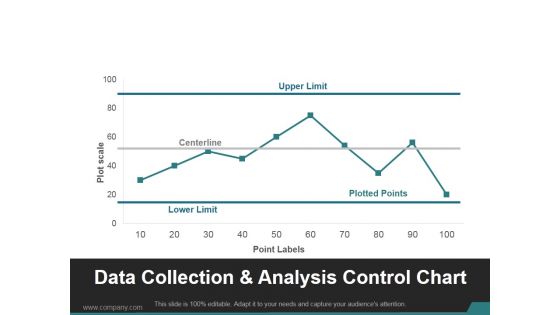
Data Collection And Analysis Control Chart Ppt PowerPoint Presentation Visuals
This is a data collection and analysis control chart ppt powerpoint presentation visuals. This is a ten stage process. The stages in this process are upper limit, centerline, lower limit, plotted points.
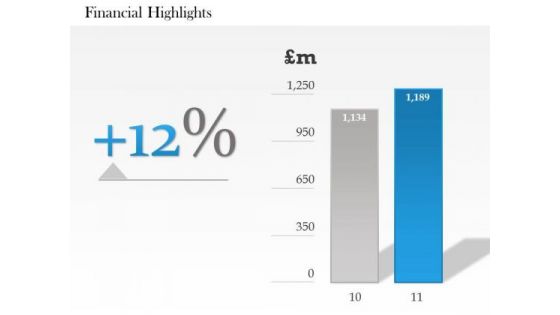
Business Diagram Profit And Financial Analysis Diagram Mba Models And Frameworks
Be The Doer With Our Business Diagram Profit And Financial Analysis Diagram MBA Models And Frameworks Powerpoint Templates. Put Your Thoughts Into Practice. Your Ideas Will Do The Trick. Wave The Wand With Our Business Diagram Profit And Financial Analysis Diagram MBA Models And Frameworks Powerpoint Templates.
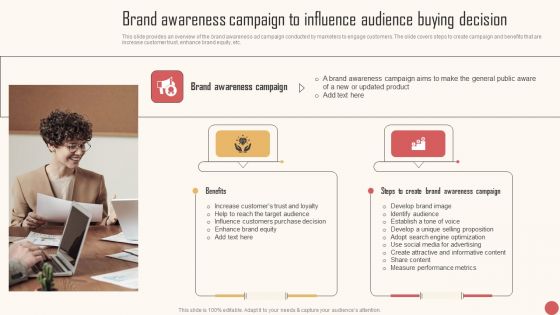
Brand Awareness Campaign To Influence Audience Buying Decision Graphics PDF
This slide provides an overview of the brand awareness ad campaign conducted by marketers to engage customers. The slide covers steps to create campaign and benefits that are increase customer trust, enhance brand equity, etc. Find highly impressive Brand Awareness Campaign To Influence Audience Buying Decision Graphics PDF on Slidegeeks to deliver a meaningful presentation. You can save an ample amount of time using these presentation templates. No need to worry to prepare everything from scratch because Slidegeeks experts have already done a huge research and work for you. You need to download Brand Awareness Campaign To Influence Audience Buying Decision Graphics PDF for your upcoming presentation. All the presentation templates are 100 percent editable and you can change the color and personalize the content accordingly. Download now
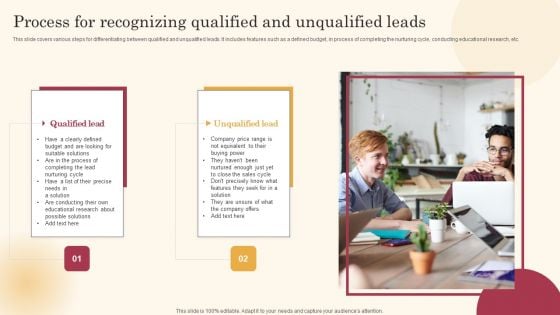
Process For Recognizing Qualified And Unqualified Leads Improving Lead Generation Process Introduction PDF
This slide covers various steps for differentiating between qualified and unqualified leads. It includes features such as a defined budget, in process of completing the nurturing cycle, conducting educational research, etc. Explore a selection of the finest Process For Recognizing Qualified And Unqualified Leads Improving Lead Generation Process Introduction PDF here. With a plethora of professionally designed and pre made slide templates, you can quickly and easily find the right one for your upcoming presentation. You can use our Process For Recognizing Qualified And Unqualified Leads Improving Lead Generation Process Introduction PDF to effectively convey your message to a wider audience. Slidegeeks has done a lot of research before preparing these presentation templates. The content can be personalized and the slides are highly editable. Grab templates today from Slidegeeks.
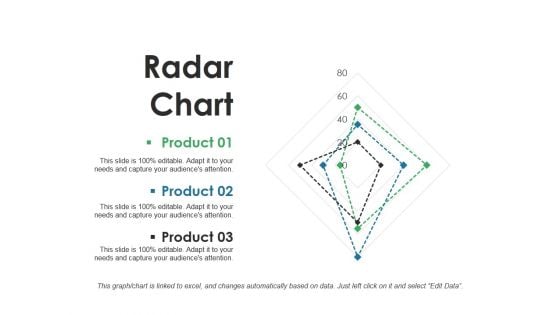
Radar Chart Ppt PowerPoint Presentation Deck
This is a radar chart ppt powerpoint presentation deck. This is a three stage process. The stages in this process are radar chart, analysis, finance, marketing, business.
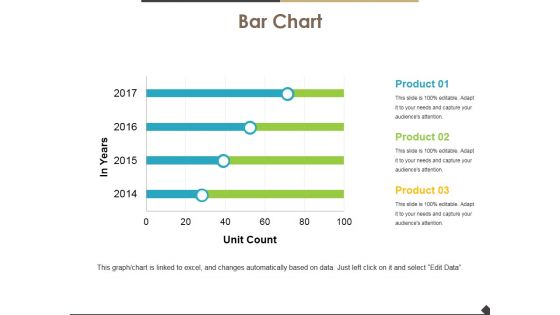
Bar Chart Ppt PowerPoint Presentation Show Grid
This is a bar chart ppt powerpoint presentation show grid. This is a four stage process. The stages in this process are bar chart, finance, marketing, analysis, business.

Combo Chart Ppt PowerPoint Presentation Infographics Good
This is a combo chart ppt powerpoint presentation infographics good. This is a three stage process. The stages in this process are combo chart, finance, analysis, business, marketing.

Combo Chart Template 1 Ppt PowerPoint Presentation Inspiration
This is a combo chart template 1 ppt powerpoint presentation inspiration. This is a four stage process. The stages in this process are business, marketing, growth, product, finance.

Combo Chart Ppt PowerPoint Presentation Professional Infographics
This is a combo chart ppt powerpoint presentation professional infographics. This is a three stage process. The stages in this process are combo chart, market size, product.
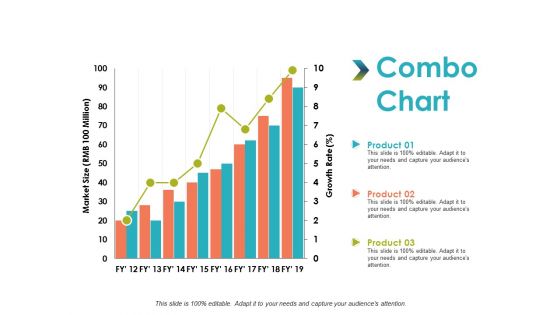
Combo Chart Analysis Management Ppt PowerPoint Presentation Professional Gridlines
This is a combo chart analysis management ppt powerpoint presentation professional gridlines. This is a three stage process. The stages in this process are combo chart, finance, marketing, business, analysis.
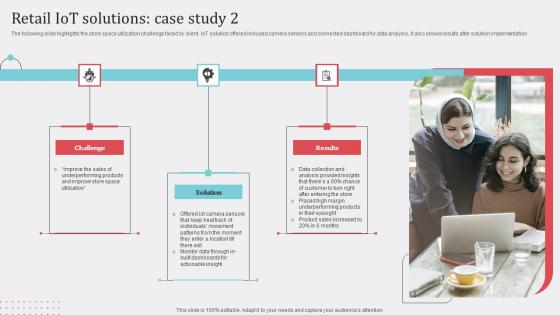
How Industrial IoT Is Changing Worldwide Retail IoT Solutions Case Study 2 Mockup Pdf
The following slide highlights the store space utilization challenge faced by client. IoT solution offered included camera sensors and connected dashboard for data analysis, it also shows results after solution implementation If you are looking for a format to display your unique thoughts, then the professionally designed How Industrial IoT Is Changing Worldwide Retail IoT Solutions Case Study 2 Mockup Pdf is the one for you. You can use it as a Google Slides template or a PowerPoint template. Incorporate impressive visuals, symbols, images, and other charts. Modify or reorganize the text boxes as you desire. Experiment with shade schemes and font pairings. Alter, share or cooperate with other people on your work. Download How Industrial IoT Is Changing Worldwide Retail IoT Solutions Case Study 2 Mockup Pdf and find out how to give a successful presentation. Present a perfect display to your team and make your presentation unforgettable. The following slide highlights the store space utilization challenge faced by client. IoT solution offered included camera sensors and connected dashboard for data analysis, it also shows results after solution implementation
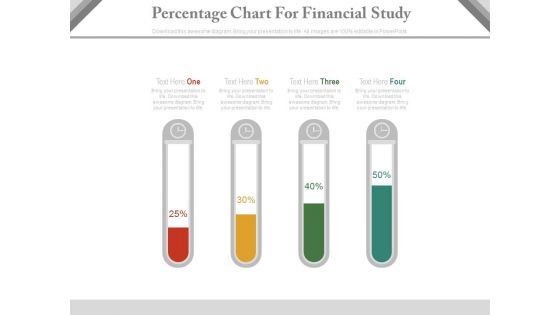
Test Tubes Percentage Chart For Financial Analysis Powerpoint Slides
This PPT slide contains test tubes percentage chart. You may download this PowerPoint template for financial analysis in your presentations. Make outstanding business presentation with this template.
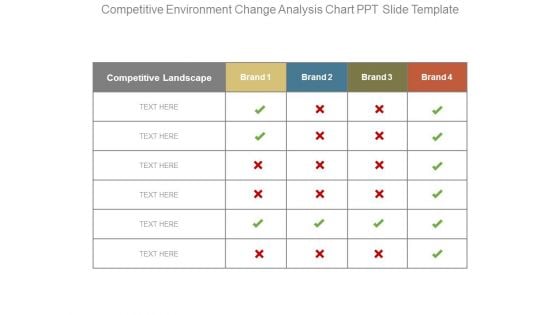
Competitive Environment Change Analysis Chart Ppt Slide Template
This is a competitive environment change analysis chart ppt slide template. This is a four stage process. The stages in this process are competitive landscape, brand.
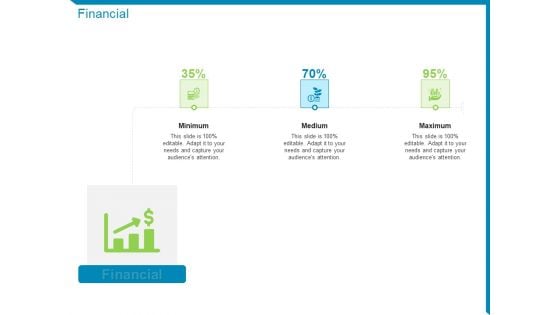
Case Competition Reduction In Existing Customer Of Telecommunication Company Financial Ppt Show Layout PDF
This is a case competition reduction in existing customer of telecommunication company financial ppt show layout pdf template with various stages. Focus and dispense information on three stages using this creative set, that comes with editable features. It contains large content boxes to add your information on topics like minimum, medium, maximum. You can also showcase facts, figures, and other relevant content using this PPT layout. Grab it now.
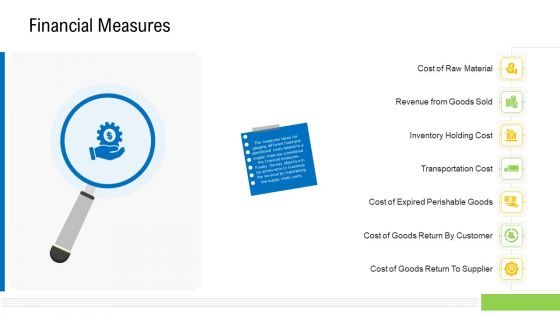
Viable Logistics Network Management Financial Measures Inspiration PDF
This is a viable logistics network management eoq cost model structure pdf template with various stages. Focus and dispense information on seven stages using this creative set, that comes with editable features. It contains large content boxes to add your information on topics like eoq cost model. You can also showcase facts, figures, and other relevant content using this PPT layout. Grab it now.
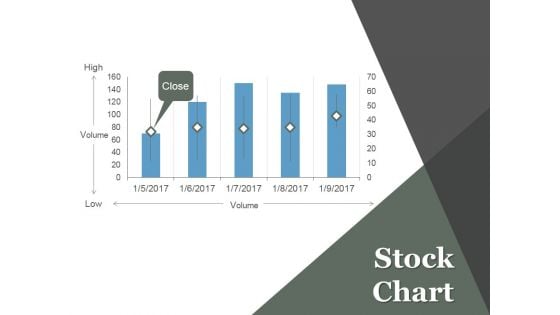
Stock Chart Ppt PowerPoint Presentation Information
This is a stock chart ppt powerpoint presentation information. This is a five stage process. The stages in this process are projects, marketing, high, volume, low.
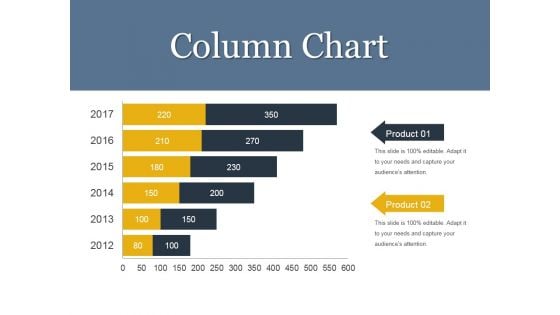
Column Chart Ppt PowerPoint Presentation Show Pictures
This is a column chart ppt powerpoint presentation show pictures. This is a six stage process. The stages in this process are business, finance, planning, years, marketing.
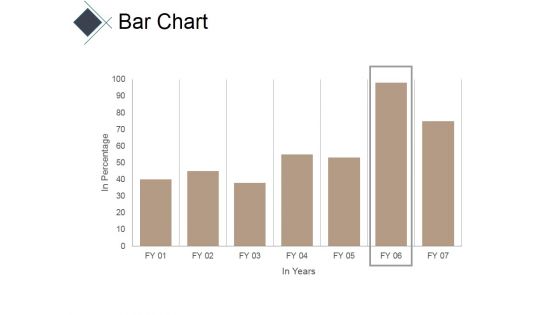
Bar Chart Ppt PowerPoint Presentation Model Good
This is a bar chart ppt powerpoint presentation model good. This is a seven stage process. The stages in this process are business, marketing, bar, success, finance.
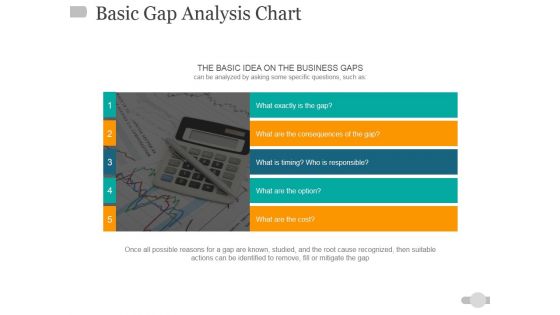
Basic Gap Analysis Chart Ppt PowerPoint Presentation Pictures Design Ideas
This is a basic gap analysis chart ppt powerpoint presentation pictures design ideas. This is a five stage process. The stages in this process are business, finance, marketing, analysis, investment.
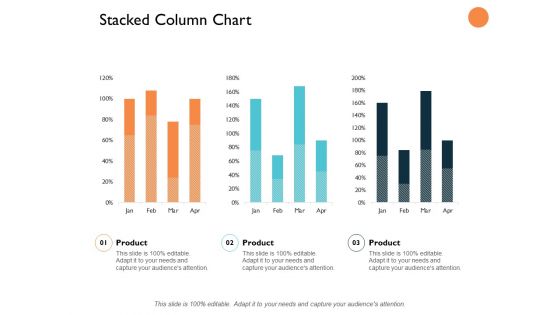
Stacked Column Chart Analysis Ppt PowerPoint Presentation Slides Graphics Design
This is a stacked column chart analysis ppt powerpoint presentation slides graphics design. This is a three stage process. The stages in this process are finance, marketing, management, investment, analysis.
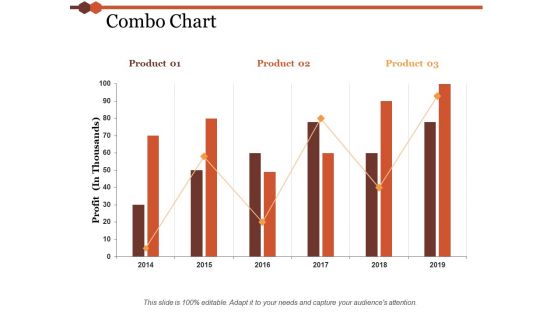
Combo Chart Ppt PowerPoint Presentation Model Professional
This is a combo chart ppt powerpoint presentation model professional. This is a three stage process. The stages in this process are finance, marketing, management, investment, analysis.
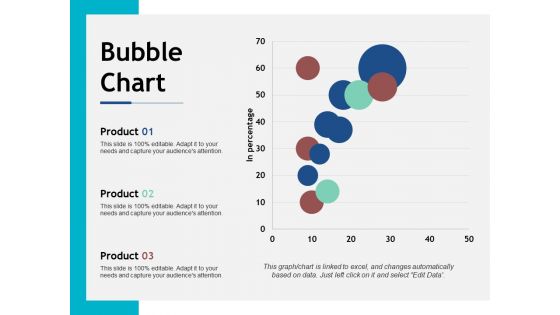
Bubble Chart Ppt PowerPoint Presentation Styles Show
This is a bubble chart ppt powerpoint presentation styles show. This is a three stage process. The stages in this process are finance, marketing, management, investment, analysis.
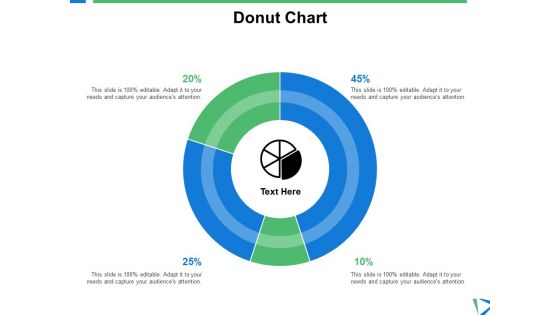
Donut Chart Investment Ppt PowerPoint Presentation Shapes
This is a donut chart investment ppt powerpoint presentation shapes. This is a four stage process. The stages in this process are finance, analysis, business, investment, marketing.
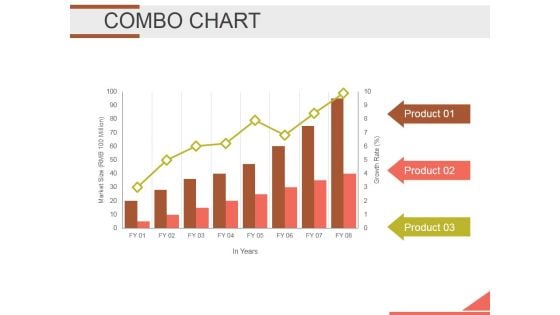
Combo Chart Ppt PowerPoint Presentation Infographics Infographics
This is a combo chart ppt powerpoint presentation infographics infographics. This is a three stage process. The stages in this process are bar graph, growth, finance, marketing, strategy, business.
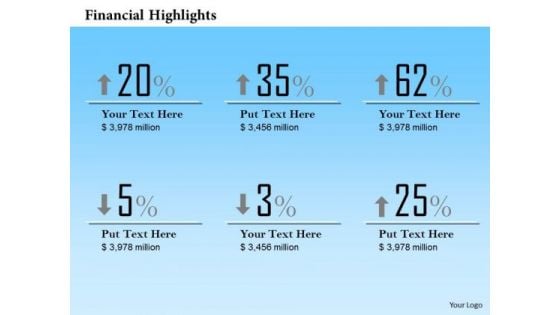
Mba Models And Frameworks Profit Percentage Analysis Diagram Strategic Management
Our MBA Models And Frameworks Profit Percentage Analysis Diagram Strategic Management Powerpoint Templates Abhor Doodling. They Never Let The Interest Flag. Our MBA Models And Frameworks Profit Percentage Analysis Diagram Strategic Management Powerpoint Templates Make Good Beasts Of Burden. Place All Your Demands On Them.

Stock Chart Ppt PowerPoint Presentation Topics
This is a stock chart ppt powerpoint presentation topics. This is a five stage process. The stages in this process are high, volume, low, volume.
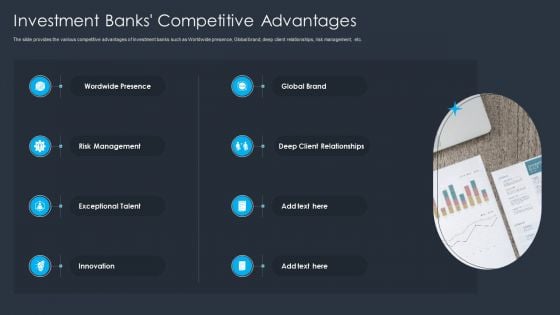
Merger And Acquisition Buying Strategy For Business Growth Investment Banks Competitive Advantages Themes PDF
The slide provides the various competitive advantages of investment banks such as Worldwide presence, Global brand, deep client relationships, risk management, etc. This is a Merger And Acquisition Buying Strategy For Business Growth Investment Banks Competitive Advantages Themes PDF template with various stages. Focus and dispense information on eight stages using this creative set, that comes with editable features. It contains large content boxes to add your information on topics like Global Brand, Wordwide Presence, Risk Management. You can also showcase facts, figures, and other relevant content using this PPT layout. Grab it now.
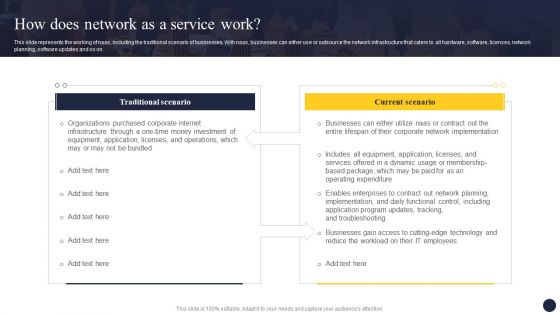
Integrating Naas Service Model To Enhance How Does Network As A Service Work Diagrams PDF
This slide represents the working of naas, including the traditional scenario of businesses. With naas, businesses can either use or outsource the network infrastructure that caters to all hardware, software, licenses, network planning, software updates and so on. Whether you have daily or monthly meetings, a brilliant presentation is necessary. Integrating Naas Service Model To Enhance How Does Network As A Service Work Diagrams PDF can be your best option for delivering a presentation. Represent everything in detail using Integrating Naas Service Model To Enhance How Does Network As A Service Work Diagrams PDF and make yourself stand out in meetings. The template is versatile and follows a structure that will cater to your requirements. All the templates prepared by Slidegeeks are easy to download and edit. Our research experts have taken care of the corporate themes as well. So, give it a try and see the results.
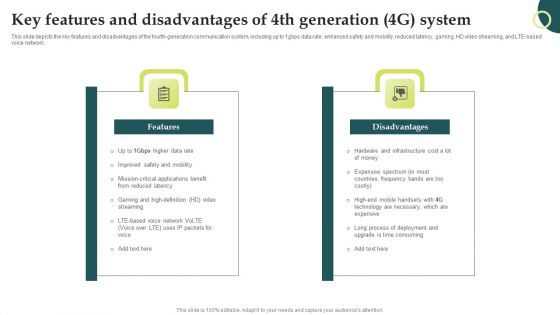
Evolution Of Wireless Technologies Key Features And Disadvantages Of 4Th Generation Themes PDF
This slide depicts the key features and disadvantages of the fourth-generation communication system, including up to 1gbps data rate, enhanced safety and mobility, reduced latency, gaming, HD video streaming, and LTE-based voice network. Formulating a presentation can take up a lot of effort and time, so the content and message should always be the primary focus. The visuals of the PowerPoint can enhance the presenters message, so our Evolution Of Wireless Technologies Key Features And Disadvantages Of 4Th Generation Themes PDF was created to help save time. Instead of worrying about the design, the presenter can concentrate on the message while our designers work on creating the ideal templates for whatever situation is needed. Slidegeeks has experts for everything from amazing designs to valuable content, we have put everything into Evolution Of Wireless Technologies Key Features And Disadvantages Of 4Th Generation Themes PDF.
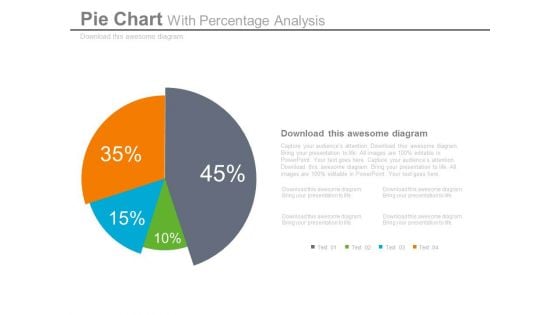
Pie Chart Dashboard Style For Percentage Analysis Powerpoint Slides
This dashboard PPT template contains graphics of pie chart. This dashboard PowerPoint template helps to display percentage analysis in a visual manner. Download this PPT slide for quick decision-making.
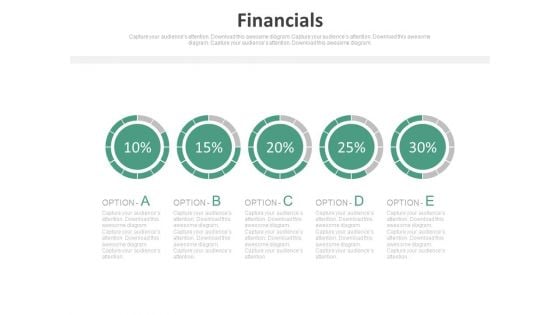
Pie Charts For Percentage Value Analysis Powerpoint Slides
Our above PPT slide displays graphics of Pie charts. This PowerPoint template may be used to display percentage value analysis. Download this template to leave permanent impression on your audience.
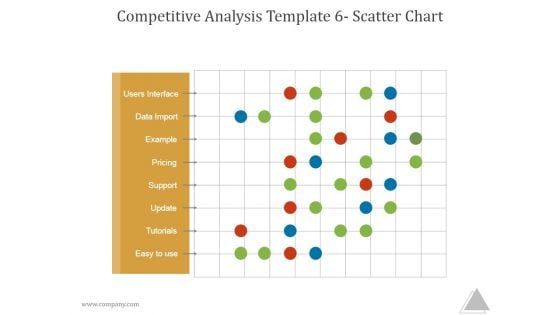
Competitive Analysis Template 6 Scatter Chart Ppt PowerPoint Presentation Shapes
This is a competitive analysis template 6 scatter chart ppt powerpoint presentation shapes. This is a one stage process. The stages in this process are users interface, data import, example, pricing, support update, tutorials, easy to use.
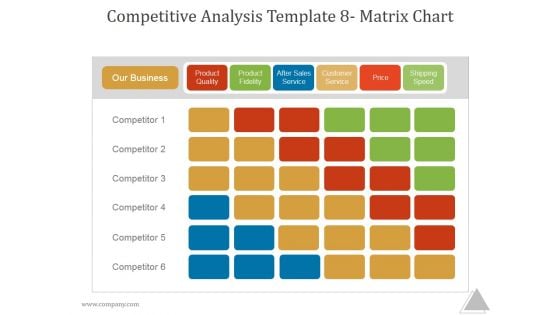
Competitive Analysis Template 8 Matrix Chart Ppt PowerPoint Presentation Templates
This is a competitive analysis template 8 matrix chart ppt powerpoint presentation templates. This is a six stage process. The stages in this process are our business, product quality, product fidelity, after sales service, customer service, price, shipping speed, competitor.
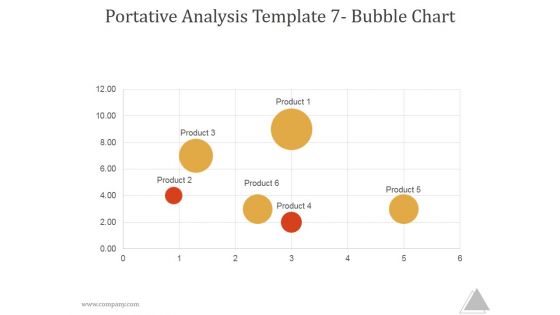
Portative Analysis Template 7 Bubble Chart Ppt PowerPoint Presentation Picture
This is a portative analysis template 7 bubble chart ppt powerpoint presentation picture. This is a six stage process. The stages in this process are product, business, marketing, management.
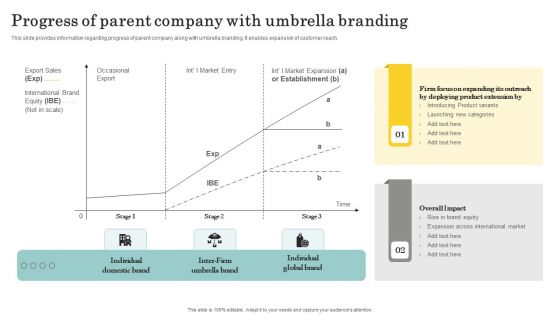
Optimize Brand Valuation Progress Of Parent Company With Umbrella Branding Themes PDF
This slide provides information regarding progress of parent company along with umbrella branding. It enables expansion of customer reach. Want to ace your presentation in front of a live audience Our Optimize Brand Valuation Progress Of Parent Company With Umbrella Branding Themes PDF can help you do that by engaging all the users towards you.. Slidegeeks experts have put their efforts and expertise into creating these impeccable powerpoint presentations so that you can communicate your ideas clearly. Moreover, all the templates are customizable, and easy-to-edit and downloadable. Use these for both personal and commercial use.
Variance Analysis Techniques And Models Efficient Operations Cycle Icon Introduction PDF
Persuade your audience using this variance analysis techniques and models efficient operations cycle icon introduction pdf. This PPT design covers four stages, thus making it a great tool to use. It also caters to a variety of topics including variance analysis techniques and models efficient operations cycle icon. Download this PPT design now to present a convincing pitch that not only emphasizes the topic but also showcases your presentation skills.
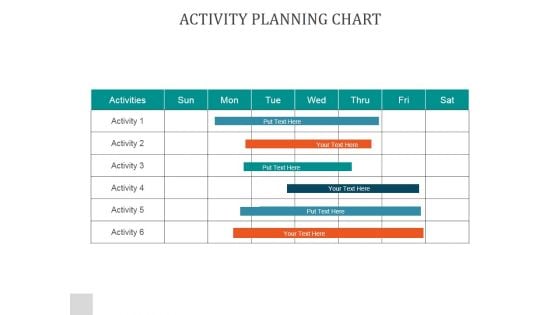
Activity Planning Chart Ppt PowerPoint Presentation Designs
This is a activity planning chart ppt powerpoint presentation designs. This is a seven stage process. The stages in this process are sun, mon, tue, wed, thru, fri, sat.
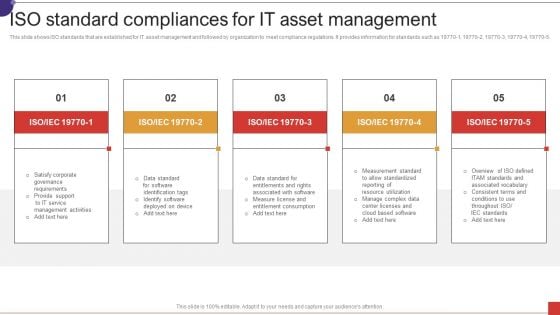
ISO Standard Compliances For IT Asset Management Ppt Visuals PDF
This slide shows ISO standards that are established for IT asset management and followed by organization to meet compliance regulations. It provides information for standards such as 19770-1, 19770-2, 19770-3, 19770-4, 19770-5. Presenting ISO Standard Compliances For IT Asset Management Ppt Visuals PDF to dispense important information. This template comprises five stages. It also presents valuable insights into the topics including Satisfy Corporate Governance, Provide Support, IT Service. This is a completely customizable PowerPoint theme that can be put to use immediately. So, download it and address the topic impactfully.
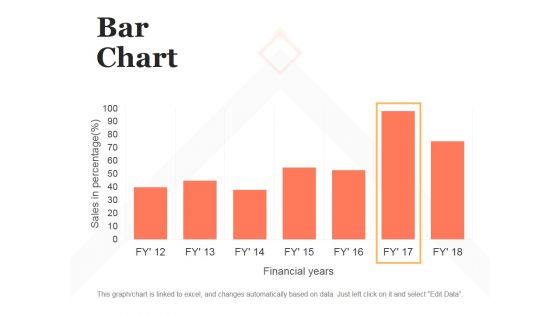
Bar Chart Ppt PowerPoint Presentation Infographic Template Brochure
This is a bar chart ppt powerpoint presentation infographic template brochure. This is a seven stage process. The stages in this process are bar graph, finance, marketing, strategy, analysis, business.
Financial Medium Minimum Ppt PowerPoint Presentation Icon Diagrams
This is a financial medium minimum ppt powerpoint presentation icon diagrams. This is a three stage process. The stages in this process are finance, analysis, business, investment, marketing.
Half Yearly Process Roadmap For ITIL Execution Strategy Icons
We present our half yearly process roadmap for itil execution strategy icons. This PowerPoint layout is easy to edit so you can change the font size, font type, color, and shape conveniently. In addition to this, the PowerPoint layout is Google Slides compatible, so you can share it with your audience and give them access to edit it. Therefore, download and save this well researched half yearly process roadmap for itil execution strategy icons in different formats like PDF, PNG, and JPG to smoothly execute your business plan.
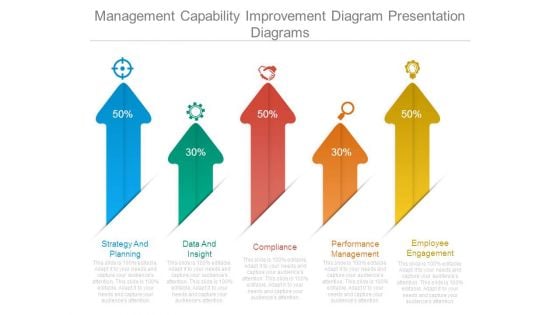
Management Capability Improvement Diagram Presentation Diagrams
This is a management capability improvement diagram presentation diagrams. This is a five stage process. The stages in this process are strategy and planning, data and insight, compliance, performance management, employee engagement.
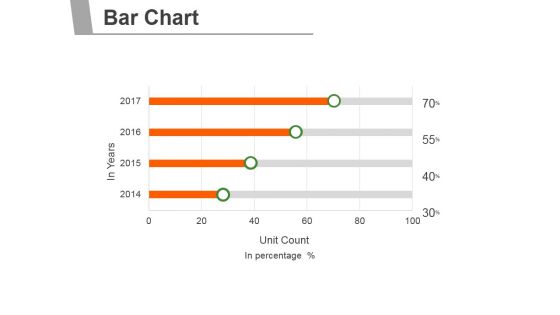
Bar Chart Ppt PowerPoint Presentation Deck
This is a bar chart ppt powerpoint presentation deck. This is a four stage process. The stages in this process are business, marketing, management, bar chart, finance.
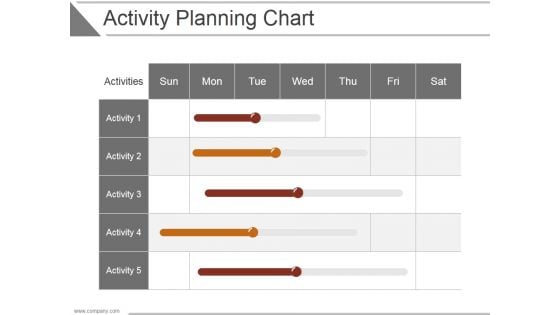
Activity Planning Chart Ppt PowerPoint Presentation Backgrounds
This is a activity planning chart ppt powerpoint presentation backgrounds. This is a five stage process. The stages in this process are business, strategy, analysis, marketing, chart and graph, compare.

Donut Pie Chart Finance Ppt PowerPoint Presentation Portfolio Model
This is a donut pie chart finance ppt powerpoint presentation portfolio model. This is a three stage process. The stages in this process are finance, management, strategy, analysis, marketing.
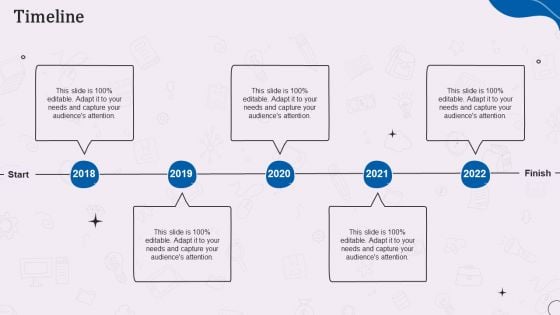
Types Of Corporate Communication Techniques Timeline Diagrams PDF
Presenting Types Of Corporate Communication Techniques Timeline Diagrams PDF to provide visual cues and insights. Share and navigate important information on three stages that need your due attention. This template can be used to pitch topics like Thank You For Watching. In addtion, this PPT design contains high resolution images, graphics, etc, that are easily editable and available for immediate download.
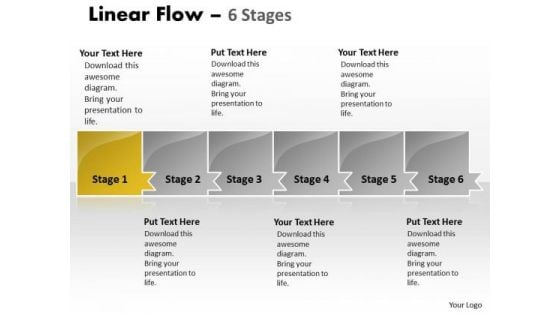
Usa PowerPoint Template Uniform Demonstration Ppt Of 6 Stages Business Plan 2 Image
We present our USA PowerPoint template uniform demonstration ppt of 6 stages business plan 2 Image. Use our Advertising PowerPoint Templates because, Individual components well researched and understood in their place. Use our Shapes PowerPoint Templates because, Timelines Display:- You have developed a vision of where you want to be a few years from now. Use our Business PowerPoint Templates because, Marketing Strategy Business Template:- Maximizing sales of your product is the intended destination. Use our Finance PowerPoint Templates because, Expound on how you plan to gain their confidence and assure them of continued and consistent excellence in quality of service. Use our Process and Flows PowerPoint Templates because, Brilliant ideas are your forte. Use these PowerPoint slides for presentations relating to abstract, algorithm, arrow, business, chart, color, connection, design, development, direction, element, flow, graph, linear, management, model, organization, plan, process, program, section, segment, set, sign, solution, strategy, symbol, technology. The prominent colors used in the PowerPoint template are Yellow, Gray, and Black Our Usa PowerPoint Template Uniform Demonstration Ppt Of 6 Stages Business Plan 2 Image provide classic cover. Drape your thoughts in them and dazzle the audience.
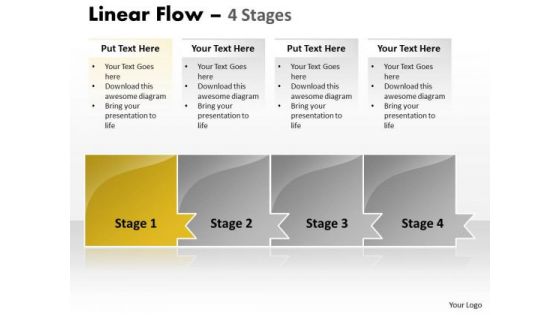
Usa Ppt Horizontal Model Of 4 Concepts Operations Management PowerPoint 2 Graphic
We present our USA PPT horizontal model of 4 concepts operations management power point 2 Graphic. Use our Advertising PowerPoint Templates because, you are going along well but your foresight shows that it may need a slight change in plans or direction. Use our Shapes PowerPoint Templates because; in any endeavor people matter most. Use our Business PowerPoint Templates because, Cycle Template: - Rolling along while gathering profits along the way is the aim. Use our Finance PowerPoint Templates because, you have some hits, you had some misses. Use our Process and Flows PowerPoint Templates because, develop your marketing strategy and communicate your enthusiasm and motivation to raise the bar. Use these PowerPoint slides for presentations relating to abstract, algorithm, arrow, business, chart, color, connection, design, development, direction, element, flow, graph, linear, management, model, organization, plan, process, program, section, segment, set, sign, solution, strategy, symbol, technology. The prominent colors used in the PowerPoint template are Yellow, Gray, and Black Halt doubts with our Usa Ppt Horizontal Model Of 4 Concepts Operations Management PowerPoint 2 Graphic. Download without worries with our money back guaranteee.
Sales Strategy Lightning GUI Half Yearly Roadmap Icons
Introducing our sales strategy lightning gui half yearly roadmap icons. This PPT presentation is Google Slides compatible, therefore, you can share it easily with the collaborators for measuring the progress. Also, the presentation is available in both standard screen and widescreen aspect ratios. So edit the template design by modifying the font size, font type, color, and shapes as per your requirements. As this PPT design is fully editable it can be presented in PDF, JPG and PNG formats.
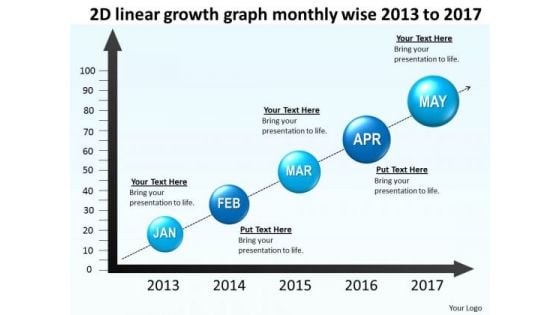
2d Linear Growth Graph Monthly Wise 2013 To 2017 PowerPoint Templates Ppt Slides Graphics
We present our 2D linear growth graph monthly wise 2013 to 2017 PowerPoint Templates PPT Slides Graphics.Use our Marketing PowerPoint Templates because customer satisfaction is a mantra of the marketplace. Building a loyal client base is an essential element of your business. Download and present our Timelines PowerPoint Templates because this diagram helps you to explain your strategy to co-ordinate activities of these seperate groups. Download our Business PowerPoint Templates because generation of sales is the core of any business. Use our Arrows PowerPoint Templates because You have found the one missing link in the picture. That one strand that will bring together the entire edifice. Put it out there for all to see. Emphasise the value of its contribution in propelling the venture forward. Use our Time planning PowerPoint Templates because it Draws the universal impact to highlight the similarities with your organizational structure and plans.Use these PowerPoint slides for presentations relating to Art, Background, Button, Call, City, Colorful, Concept, Country, Destination, Editable, Flag, Fuel, Geography, Graphic, Home, Icon, Illustration, Journey, Land, Locate, Location, Macro, Map, Mapping, Mark, Navigate, Needle, Petrol, Pin, Pinpoint, Place, Pointing, Pump, Push, Pushpin, Restaurant, Road, Roadmap, Service, Set, Shiny, Space, Symbol, Town, Travel, Trip. The prominent colors used in the PowerPoint template are Blue, Black, Blue light. PowerPoint presentation experts tell us our 2D linear growth graph monthly wise 2013 to 2017 PowerPoint Templates PPT Slides Graphics are Dynamic. Customers tell us our City PowerPoint templates and PPT Slides are specially created by a professional team with vast experience. They diligently strive to come up with the right vehicle for your brilliant Ideas. Customers tell us our 2D linear growth graph monthly wise 2013 to 2017 PowerPoint Templates PPT Slides Graphics are Splendid. Customers tell us our Button PowerPoint templates and PPT Slides are Functional. PowerPoint presentation experts tell us our 2D linear growth graph monthly wise 2013 to 2017 PowerPoint Templates PPT Slides Graphics help you meet deadlines which are an element of today's workplace. Just browse and pick the slides that appeal to your intuitive senses. People tell us our Destination PowerPoint templates and PPT Slides effectively help you save your valuable time. Make a fancy impression with our 2d Linear Growth Graph Monthly Wise 2013 To 2017 PowerPoint Templates Ppt Slides Graphics. You will be at the top of your game.
Icon For Target Market Assessment Survey Diagrams PDF
Persuade your audience using this Icon For Target Market Assessment Survey Diagrams PDF. This PPT design covers four stages, thus making it a great tool to use. It also caters to a variety of topics including Icon For Target Market, Assessment Survey. Download this PPT design now to present a convincing pitch that not only emphasizes the topic but also showcases your presentation skills.
Transaction Overview Icon Showcasing Account Statement Diagrams PDF
Persuade your audience using this Transaction Overview Icon Showcasing Account Statement Diagrams PDF. This PPT design covers three stages, thus making it a great tool to use. It also caters to a variety of topics including Transaction Overview Icon, Showcasing Account Statement. Download this PPT design now to present a convincing pitch that not only emphasizes the topic but also showcases your presentation skills.
Replacing 2 With 3 To Form New Business PowerPoint Templates Ppt Backgrounds For Slides 1212
We present our Replacing 2 With 3 To Form New Business PowerPoint Templates PPT Backgrounds For Slides 1212.Download and present our New year PowerPoint Templates because its New Year time. Use our People PowerPoint Templates because this layout helps you to impress upon the audience how your strategy will carry all to the top of the corporate heap. Download and present our Holidays PowerPoint Templates because educate your staff on the means to provide the required support for speedy recovery. Download and present our Business PowerPoint Templates because you can Lead your flock steadily to greater heights. Look around at the vast potential of achievement around you. Download and present our Future PowerPoint Templates because this helps you to chart the path ahead to arrive at your destination and acheive the goal.Use these PowerPoint slides for presentations relating to Replacing 2 with 3 to new year, business, people, new year, holidays, future. The prominent colors used in the PowerPoint template are Blue , Gray, White. Professionals tell us our Replacing 2 With 3 To Form New Business PowerPoint Templates PPT Backgrounds For Slides 1212 are Excellent. Use our business PowerPoint templates and PPT Slides are aesthetically designed to attract attention. We guarantee that they will grab all the eyeballs you need. Presenters tell us our Replacing 2 With 3 To Form New Business PowerPoint Templates PPT Backgrounds For Slides 1212 are Luxuriant. Professionals tell us our business PowerPoint templates and PPT Slides are Magnificent. Presenters tell us our Replacing 2 With 3 To Form New Business PowerPoint Templates PPT Backgrounds For Slides 1212 are Exuberant. The feedback we get is that our 3 PowerPoint templates and PPT Slides are Efficient. Exploit the talents of our Replacing 2 With 3 To Form New Business PowerPoint Templates Ppt Backgrounds For Slides 1212 team. They will take up the challenge of your demands.
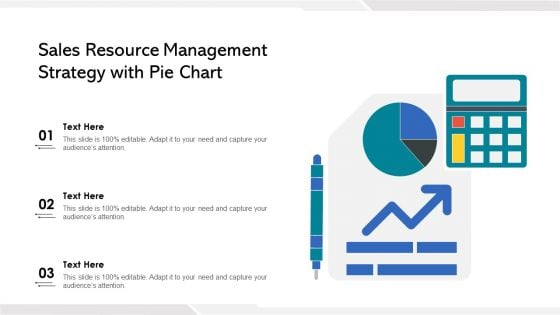
Sales Resource Management Strategy With Pie Chart Ppt File Aids PDF
Presenting sales resource management strategy with pie chart ppt file aids pdf to dispense important information. This template comprises three stages. It also presents valuable insights into the topics including sales resource management strategy with pie chart. This is a completely customizable PowerPoint theme that can be put to use immediately. So, download it and address the topic impactfully.
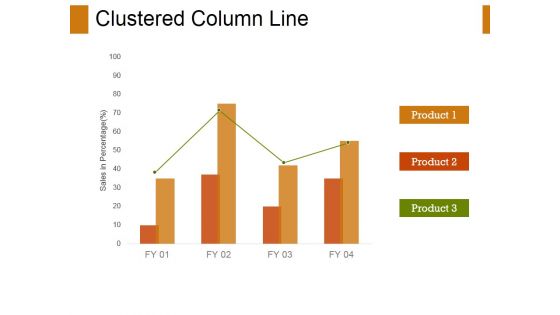
Clustered Column-Line Ppt PowerPoint Presentation Ideas Diagrams
This is a clustered column-line ppt powerpoint presentation ideas diagrams. This is a three stage process. The stages in this process are clustered column line, business, finance, marketing, strategy.


 Continue with Email

 Home
Home


