Two Phases
Nature Sky With Stars Ppt PowerPoint Presentation Icon Designs Download
This is a nature sky with stars ppt powerpoint presentation icon designs download. This is a two stage process. The stages in this process are nature, clouds, blue sky.
Bar Chart Ppt PowerPoint Presentation Icon Diagrams
This is a bar chart ppt powerpoint presentation icon diagrams. This is a two stage process. The stages in this process are bar chart, finance, analysis, business, marketing, strategy.
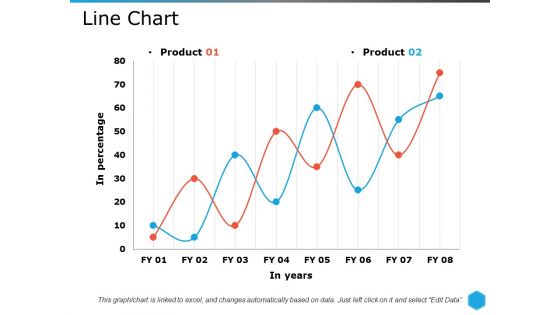
Line Chart Ppt PowerPoint Presentation Pictures Themes
This is a line chart ppt powerpoint presentation pictures themes. This is a two stage process. The stages in this process are line chart, growth, strategy, marketing, strategy, business.
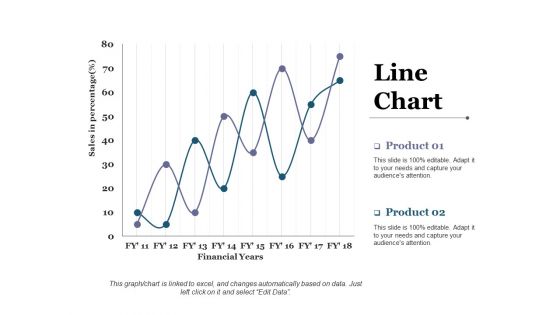
Line Chart Ppt PowerPoint Presentation Styles Themes
This is a line chart ppt powerpoint presentation styles themes. This is a two stage process. The stages in this process are business, marketing, financial years, sales in percentage.
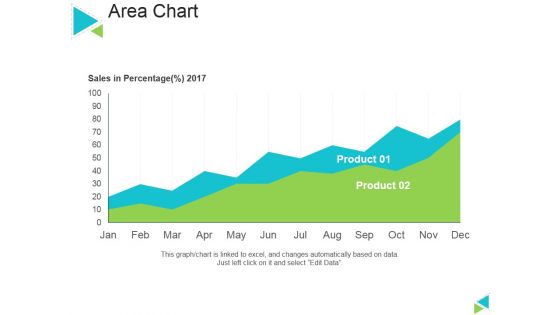
Area Chart Ppt PowerPoint Presentation Inspiration Themes
This is a area chart ppt powerpoint presentation inspiration themes. This is a two stage process. The stages in this process are sales in percentage, product, area chart, business, marketing.
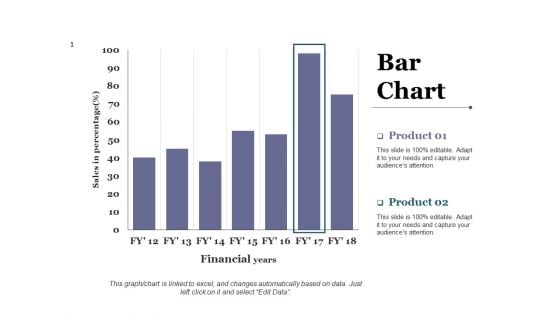
Bar Chart Ppt PowerPoint Presentation Diagram Lists
This is a bar chart ppt powerpoint presentation diagram lists. This is a two stage process. The stages in this process are business, marketing, financial years, sales in percentage, graph.
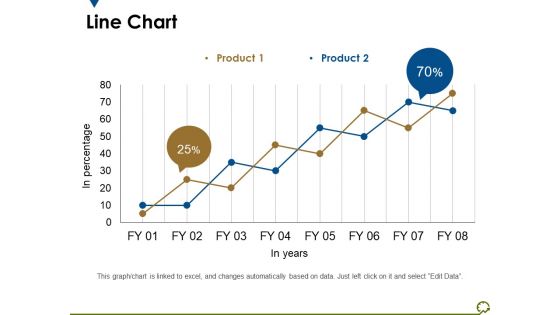
Line Chart Ppt PowerPoint Presentation Outline Diagrams
This is a line chart ppt powerpoint presentation outline diagrams. This is a two stage process. The stages in this process are in percentage, in years, percentage, business, marketing.
Activity Ratios Ppt PowerPoint Presentation Icon Themes
This is a activity ratios ppt powerpoint presentation icon themes. This is a two stage process. The stages in this process are inventory turnover, cogs, average inventory, receivable turnover, net credit sales, average accounts receivable .
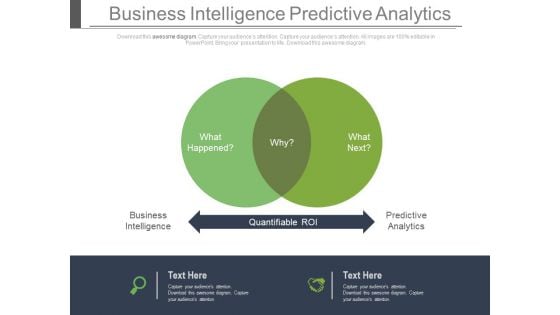
Venn Diagram For Business Intelligence And Predictive Analysis Powerpoint Slides
This power point template has been designed with two steps Venn diagram. Use this Venn diagram for business intelligence and predictive analysis. Illustrate your ideas and imprint them in the minds of your team with this template.
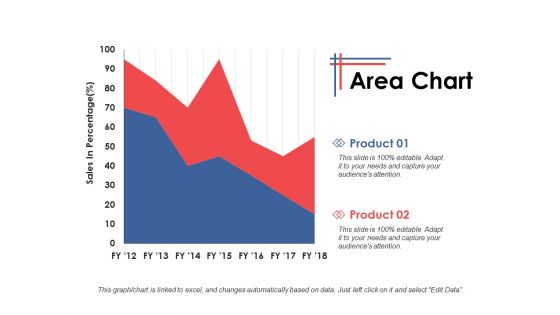
Area Chart Growth Strategy Ppt PowerPoint Presentation Infographics Themes
This is a area chart growth strategy ppt powerpoint presentation infographics themes. This is a two stage process. The stages in this process are finance, marketing, management, investment, analysis.
Column Chart Ppt PowerPoint Presentation Icon Guide
This is a column chart ppt powerpoint presentation icon guide. This is a two stage process. The stages in this process are business, year, sales in percentage, marketing, graph.
Area Chart Ppt PowerPoint Presentation Ideas Icon
This is a area chart ppt powerpoint presentation ideas icon. This is a two stage process. The stages in this process are product, area chart, sales in percentage, growth, success.
Area Chart Ppt PowerPoint Presentation Icon Summary
This is a area chart ppt powerpoint presentation icon summary. This is a two stage process. The stages in this process are financial year, area chart, in percentage, product.
Area Chart Ppt PowerPoint Presentation Icon Show
This is a area chart ppt powerpoint presentation icon show. This is a two stage process. The stages in this process are product, financial year, in percentage, area chart.
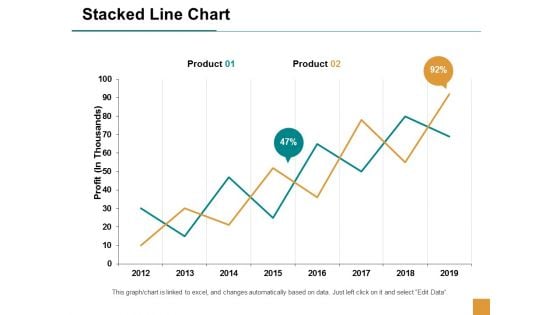
Stacked Line Chart Finance Ppt Powerpoint Presentation Outline Themes
This is a stacked line chart finance ppt powerpoint presentation outline themes. This is a two stage process. The stages in this process are finance, marketing, management, investment, analysis.
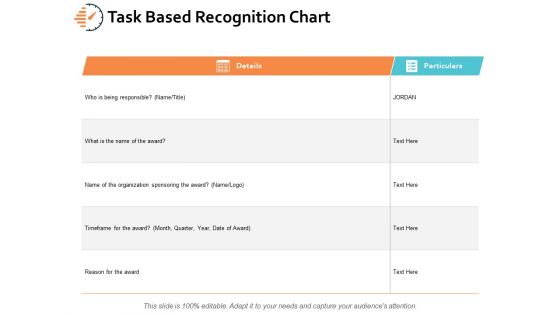
Task Based Recognition Chart Ppt PowerPoint Presentation Professional Themes
This is a task based recognition chart ppt powerpoint presentation professional themes. This is a two stage process. The stages in this process are business, planning, strategy, marketing, management.
Column Chart Ppt PowerPoint Presentation Icon Show
This is a column chart ppt powerpoint presentation icon show. This is a two stage process. The stages in this process are column chart, product, years, bar graph, growth.
Area Chart Ppt PowerPoint Presentation Gallery Icons
This is a area chart ppt powerpoint presentation gallery icons. This is a two stage process. The stages in this process are financial year, sales in percentage, product, finance, graph.
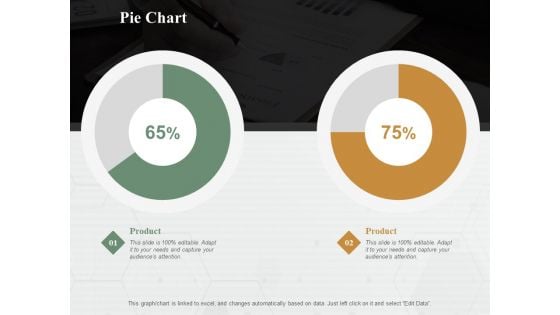
Pie Chart Finance Ppt PowerPoint Presentation Diagram Lists
This is a pie chart finance ppt powerpoint presentation diagram lists. This is a two stage process. The stages in this process are pie chart, finance, marketing, analysis, business.
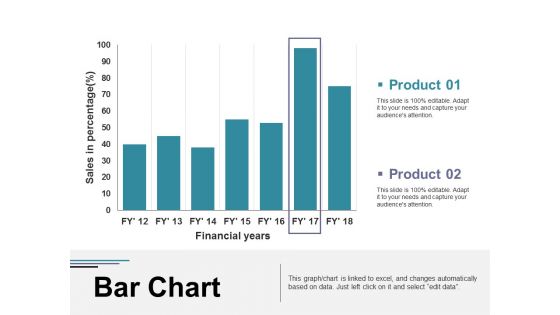
Bar Chart Ppt PowerPoint Presentation Visual Aids Diagrams
This is a bar chart ppt powerpoint presentation visual aids diagrams. This is a two stage process. The stages in this process are business, marketing, financial years, sales in percentage, graph.
Scatter Chart Template 2 Ppt PowerPoint Presentation Slides Icons
This is a scatter chart template 2 ppt powerpoint presentation slides icons. This is a two stage process. The stages in this process are business, marketing, graph, in percentage, finance.
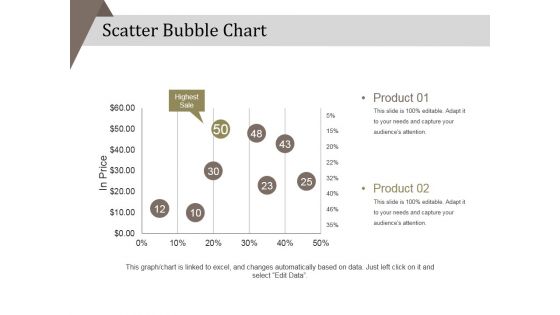
Scatter Bubble Chart Ppt PowerPoint Presentation Diagram Ppt
This is a scatter bubble chart ppt powerpoint presentation diagram ppt. This is a two stage process. The stages in this process are product, in price, highest sale, percentage, business, marketing.

Client Testimonials Template 1 Ppt PowerPoint Presentation Diagrams
This is a client testimonials template 1 ppt powerpoint presentation diagrams. This is a two stage process. The stages in this process are john doe, julie star, financial advisor.
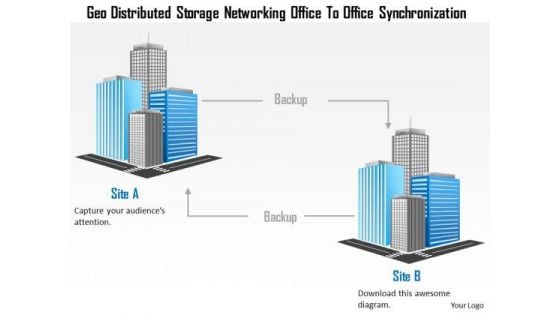
Business Diagram Geo Distributed Storage Networking Office To Office Synchronization Ppt Slide
Concept of networking and device synchronization has been displayed in this diagram with suitable graphics. This diagram depicts the graphic of two interconnected servers. This diagram displays the GEO distributed storage networking between offices to office.
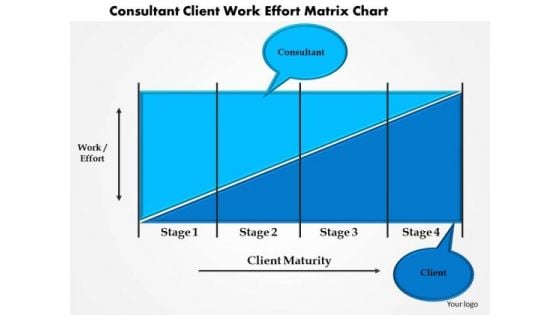
Business Diagram Consultant Client Work Effort Matrix Chart Presentation Template
This business diagram displays two directional multistage triangles. This slide contains the concept of work effort. This business slide depicts the work efforts matrix chart for client work efforts. Use this diagram to build exclusive presentation for your viewers.
Line Chart Ppt PowerPoint Presentation Infographic Template Icons
This is a line chart ppt powerpoint presentation infographic template icons. This is a two stage process. The stages in this process are sales in percentage, financial years, product, line chart.
Rader Chart Ppt PowerPoint Presentation Icon Graphic Tips
This is a rader chart ppt powerpoint presentation icon graphic tips. This is a two stage process. The stages in this process are rader chart, finance, analysis, business, marketing.
Rader Chart Ppt PowerPoint Presentation Icon Slide Portrait
This is a rader chart ppt powerpoint presentation icon slide portrait. This is a two stage process. The stages in this process are rader chart, business, analysis, finance, marketing.
Column Chart Ppt PowerPoint Presentation Icon Clipart Images
This is a column chart ppt powerpoint presentation icon clipart images. This is a two stage process. The stages in this process are column chart, finance, marketing, strategy, business.
Stacked Line Chart Ppt PowerPoint Presentation Show Icon
This is a stacked line chart ppt powerpoint presentation show icon. This is a two stage process. The stages in this process are profit, chart, years, business, marketing, years.
Area Chart Product Finance Ppt PowerPoint Presentation Icon Influencers
This is a area chart product finance ppt powerpoint presentation icon influencers. This is a two stage process. The stages in this process are area chart, finance, business, planning, marketing.
Area Chart Marketing Planning Ppt PowerPoint Presentation Icon Sample
This is a area chart marketing planning ppt powerpoint presentation icon sample. This is a two stage process. The stages in this process are area chart, finance, marketing, analysis, investment.
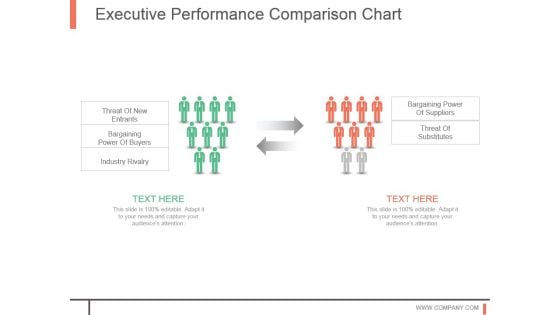
Executive Performance Comparison Chart
This is a executive performance comparison chart. This is a two stage process. The stages in this process are threat of new entrants, bargaining power of buyers, industry rivalry, bargaining power of suppliers, threat of substitutes.
Radar Chart Ppt PowerPoint Presentation Icon Slide Portrait
This is a radar chart ppt powerpoint presentation icon slide portrait. This is a two stage process. The stages in this process are radar chart, organization, success, strategy, marketing, management.
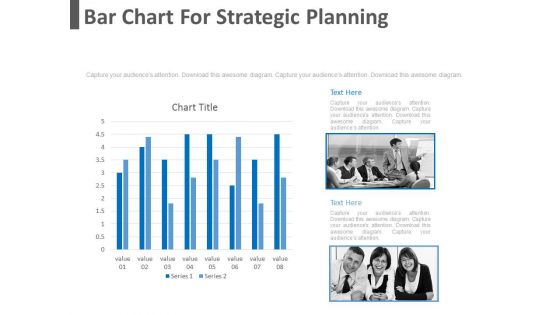
Bar Chart For Strategic Planning Powerpoint Slides
This PowerPoint template has been designed with bar graph with two teams. This diagram is useful to exhibit strategic planning. This diagram slide can be used to make impressive presentations.
Column Chart Ppt PowerPoint Presentation Infographic Template Icon
This is a column chart ppt powerpoint presentation infographic template icon. This is a two stage process. The stages in this process are business, marketing, sales in percentage, financial year, graph.
Open High Low Close Chart Ppt PowerPoint Presentation Icon Portrait
This is a open high low close chart ppt powerpoint presentation icon portrait. This is a two stage process. The stages in this process are business, management, marketing, percentage, product.
Column Chart Marketing Management Ppt PowerPoint Presentation Infographic Template Icon
This is a column chart marketing management ppt powerpoint presentation infographic template icon. This is a two stage process. The stages in this process are finance, marketing, management, investment, analysis.
Scatter Chart Ppt PowerPoint Presentation Icon Example Introduction
This is a scatter chart ppt powerpoint presentation icon example introduction. This is a two stage process. The stages in this process are product, profit, in percentage, growth, scattered chart.
Cost Benefit Analysis Chart With Icons Powerpoint Layout
This is a cost benefit analysis chart with icons powerpoint layout. This is a two stage process. The stages in this process are balance scale, compare, business, marketing, management.
Line Chart Ppt PowerPoint Presentation Icon Example Topics
This is a line chart ppt powerpoint presentation icon example topics. This is a two stage process. The stages in this process are line chart, finance, growth, strategy, business.
Area Chart Ppt PowerPoint Presentation Icon Layout Ideas
This is a area chart ppt powerpoint presentation icon layout ideas. This is a two stage process. The stages in this process are area chart, sales in percentage, years, planning, business.
Clustered Bar Chart Finance Ppt PowerPoint Presentation Icon Tips
This is a clustered bar chart finance ppt powerpoint presentation icon tips. This is a two stage process. The stages in this process are analysis, finance, marketing, management, investment.
Bubble Chart Employee Value Proposition Ppt PowerPoint Presentation Icon Sample
This is a bubble chart employee value proposition ppt powerpoint presentation icon sample. This is a two stage process. The stages in this process are business, management, strategy, analysis, marketing.
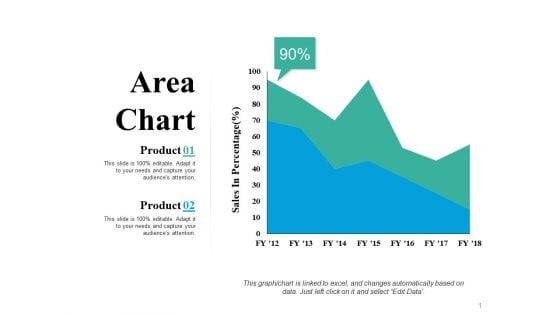
Area Chart Financial Chart Ppt PowerPoint Presentation Design Ideas
This is a area chart financial chart ppt powerpoint presentation design ideas. This is two stage process. The stages in this process are finance, marketing, business, strategy, area chart.
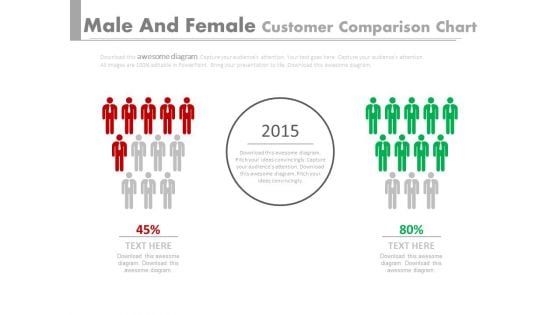
Red Green Teams Comparison Chart Powerpoint Slides
This PPT slide displays graphics of two red and green teams. Use this PPT design to display comparison of teams performances. This PowerPoint template can be customized as per requirements of business education or any other theme.
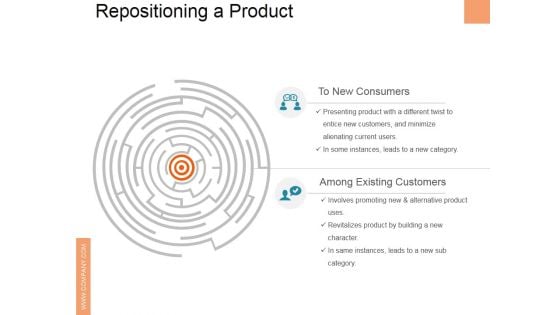
Repositioning A Product Ppt PowerPoint Presentation Model Maker
This is a repositioning a product ppt powerpoint presentation model maker. This is a two stage process. The stages in this process are to new consumers, among existing customers.
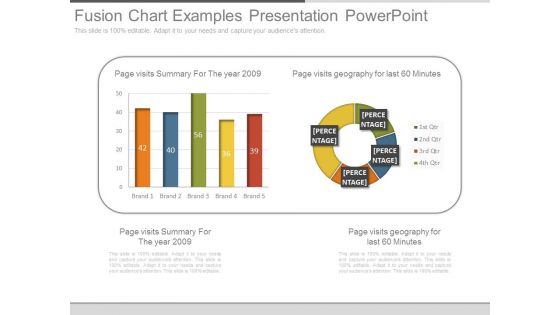
Fusion Chart Examples Presentation Powerpoint
This is a fusion chart examples presentation powerpoint. This is a two stage process. The stages in this process are page visits summary for the year 2009, brand, page visits geography for last 60 minutes, brand, qtr.
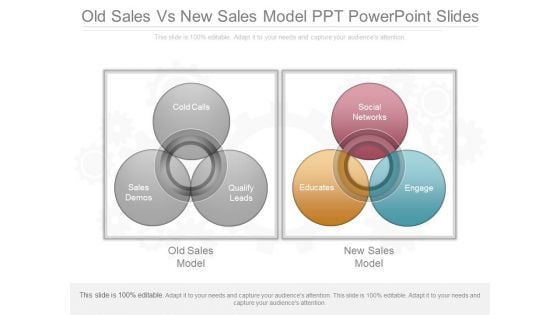
Old Sales Vs New Sales Model Ppt Powerpoint Slides
This is a old sales vs new sales model ppt powerpoint slides. This is a two stage process. The stages in this process are cold calls, sales demos, qualify leads, old sales model, social networks, educates, engage, new sales model.
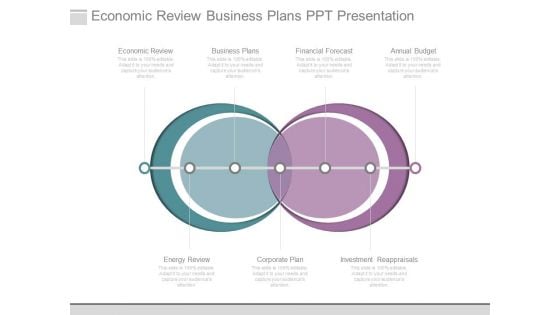
Economic Review Business Plans Ppt Presentation
This is a economic review business plans ppt presentation. This is a two stage process. The stages in this process are economic review, business plans, financial forecast, annual budget, energy review, corporate plan, investment reappraisals.
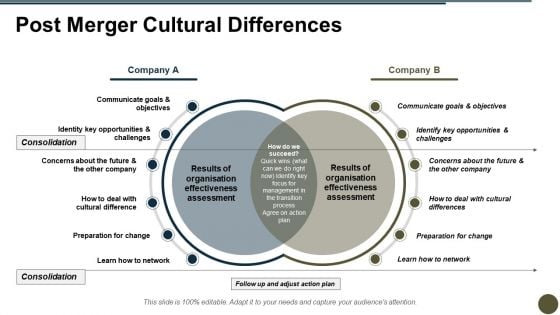
Post Merger Cultural Differences Ppt PowerPoint Presentation Pictures Layout
This is a post merger cultural differences ppt powerpoint presentation pictures layout. This is a two stage process. The stages in this process are communicate goals, objectives, business, marketing, strategy.
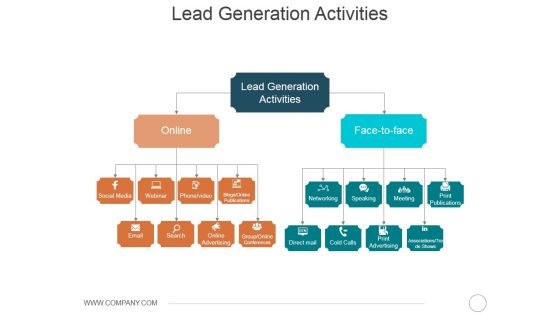
Lead Generation Activities Ppt PowerPoint Presentation Professional Samples
This is a lead generation activities ppt powerpoint presentation professional samples. This is a two stage process. The stages in this process are lead generation activities, online, social media, webinar, advertising, speaking, advertising, networking.
Business Diagram Film Roll With Icons Timeline Diagram Presentation Template
Two staged film roll style timeline diagram has been used to design this business diagram. This diagram contains the concept of business timeline formation. Use this slide for your business timeline related presentations.
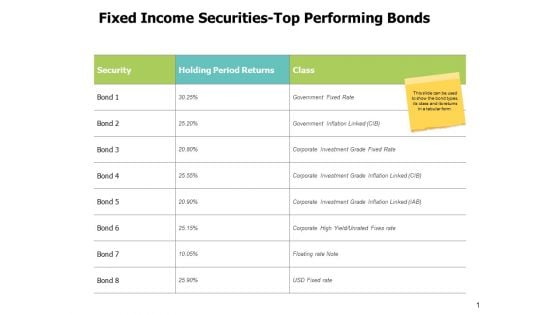
Fixed Income Securities Top Performing Bonds Ppt PowerPoint Presentation Diagram Graph Charts
This is a fixed income securities top performing bonds ppt powerpoint presentation diagram graph charts. This is a two stage process. The stages in this process are compare, marketing, business, management, planning.
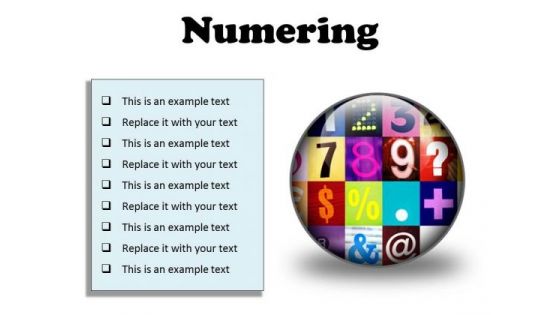
Numbering Education PowerPoint Presentation Slides C
Microsoft Powerpoint Slides and Backgrounds with write numbers with this signs i got two letters alphabet like this one in my portfolio Excite the senses with our Numbering Education PowerPoint Presentation Slides C. Tickle the minds with your views.
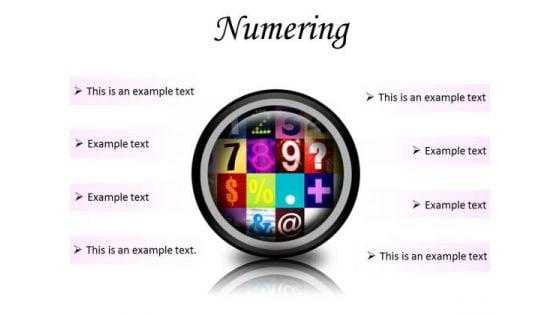
Numbering Education PowerPoint Presentation Slides Cc
Microsoft Powerpoint Slides and Backgrounds with write numbers with this signs i got two letters alphabet like this one in my portfolio Our Numbering Education PowerPoint Presentation Slides Cc will entice the audience. They will make a beeline for you.
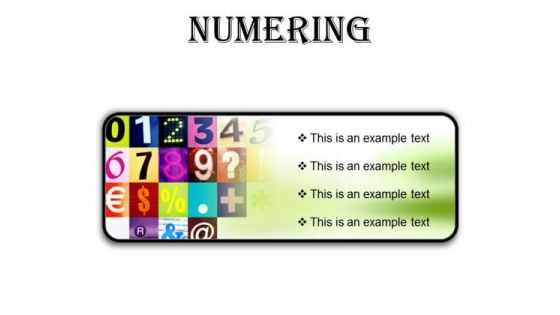
Numbering Education PowerPoint Presentation Slides R
Microsoft Powerpoint Slides and Backgrounds with write numbers with this signs i got two letters alphabet like this one in my portfolio Conquer fatigue with our Numbering Education PowerPoint Presentation Slides R. They are like a deep breath.
Numbering Education PowerPoint Presentation Slides S
Microsoft Powerpoint Slides and Backgrounds with write numbers with this signs i got two letters alphabet like this one in my portfolio Find favour with the audience for your ideas. Our Numbering Education PowerPoint Presentation Slides S will extract approval.
Profitability Ratios Template 2 Ppt PowerPoint Presentation Icon Diagrams
This is a profitability ratios template 2 ppt powerpoint presentation icon diagrams. This is a two stage process. The stages in this process are net profit ratio, gross profit ratio.
Have Themed Office Days Ppt PowerPoint Presentation Summary Icons
This is a have themed office days ppt powerpoint presentation summary icons. This is a two stage process. The stages in this process are business, marketing, planning, strategy, management.


 Continue with Email

 Home
Home


