Two Stages

Work Motivation And Attitudes Sample Powerpoint Slides
This is a work motivation and attitudes sample powerpoint slides. This is a two stage process. The stages in this process are motivators, demotivators, advancement, the work itself, responsibility, achievement, growth, recognition, policies, status, security, relationships, work conditions, pay.

Hr Dashboard Solutions Diagram Powerpoint Slides
This is a hr dashboard solutions diagram powerpoint slides. This is a two stage process. The stages in this process are time to recruit by month, recruitment cost by month, sick, holiday, suspended, injured.
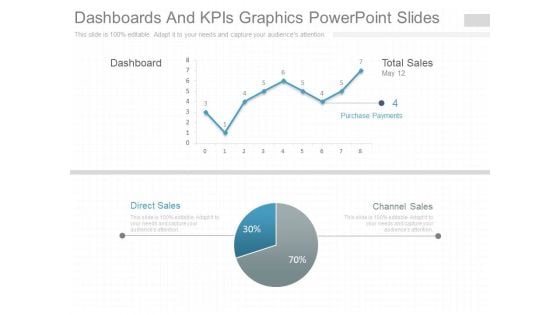
Dashboards And Kpis Graphics Powerpoint Slides
This is a dashboards and kpis graphics powerpoint slides. This is a two stage process. The stages in this process are dashboard, total sales, channel sales, direct sales, purchase payments.
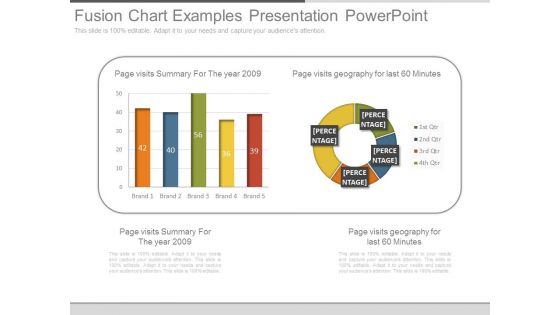
Fusion Chart Examples Presentation Powerpoint
This is a fusion chart examples presentation powerpoint. This is a two stage process. The stages in this process are page visits summary for the year 2009, brand, page visits geography for last 60 minutes, brand, qtr.
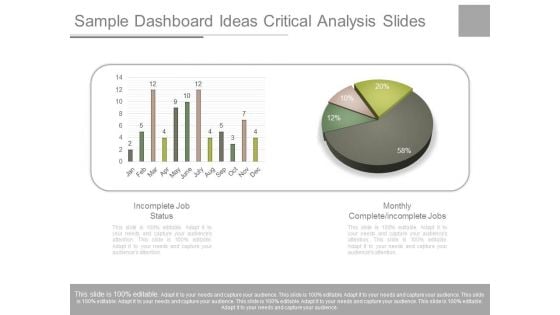
Sample Dashboard Ideas Critical Analysis Slides
This is a sample dashboard ideas critical analysis slides. This is a two stage process. The stages in this process are incomplete job status, monthly complete incomplete jobs, jan feb, mar, apr, may, june, july, aug, sep, oct, nov, dec.
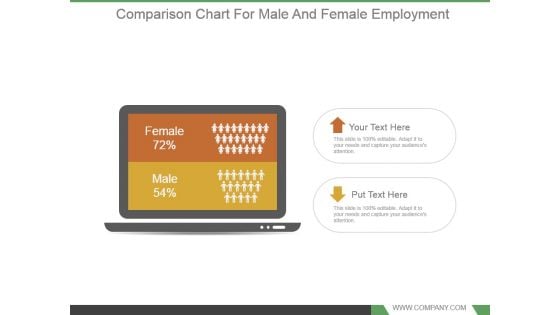
Comparison Chart For Male And Female Employment Powerpoint Shapes
This is a comparison chart for male and female employment powerpoint shapes. This is a two stage process. The stages in this process are female 72 percent, male 54 percent.

About Our Company Description With Image Ppt PowerPoint Presentation Ideas
This is a about our company description with image ppt powerpoint presentation ideas. This is a two stage process. The stages in this process are we are a, professional company, mary smith.
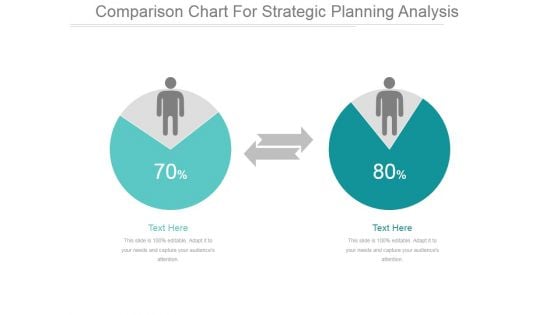
Comparison Chart For Strategic Planning Analysis Ppt PowerPoint Presentation Example
This is a comparison chart for strategic planning analysis ppt powerpoint presentation example. This is a two stage process. The stages in this process are business, finance, marketing, strategy, success.
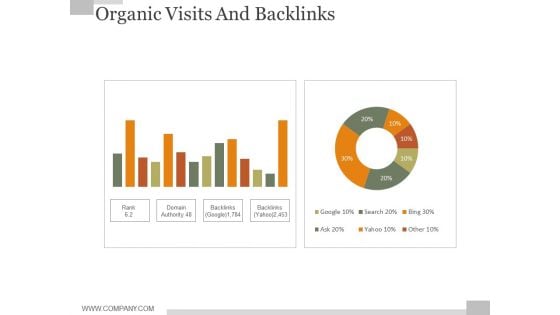
Organic Visits And Backlinks Ppt PowerPoint Presentation Graphics
This is a organic visits and backlinks ppt powerpoint presentation graphics. This is a two stage process. The stages in this process are business, finance, pie chart, marketing, strategy, success.
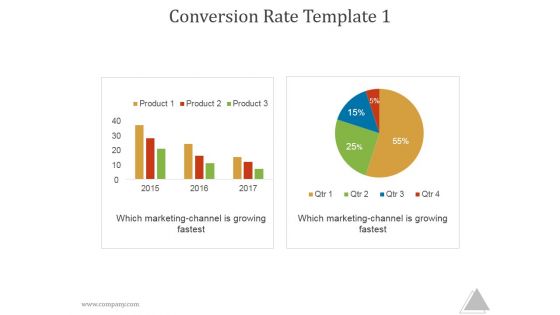
Conversion Rate Template 1 Ppt PowerPoint Presentation Summary
This is a conversion rate template 1 ppt powerpoint presentation summary. This is a two stage process. The stages in this process are which marketing channel is growing fastest, which marketing channel is growing fastest, product, business, marketing.
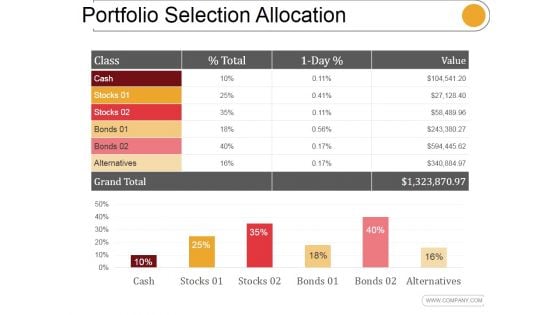
Portfolio Selection Allocation Template 1 Ppt PowerPoint Presentation Templates
This is a portfolio selection allocation template 1 ppt powerpoint presentation templates. This is a two stage process. The stages in this process are class, stocks, bonds, total, value.
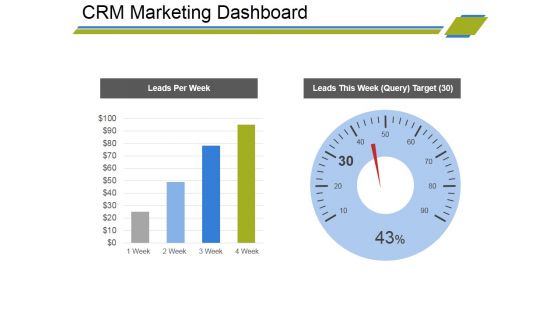
Crm Marketing Dashboard Ppt PowerPoint Presentation Gallery Tips
This is a crm marketing dashboard ppt powerpoint presentation gallery tips. This is a two stage process. The stages in this process are leads per week, leads this week.
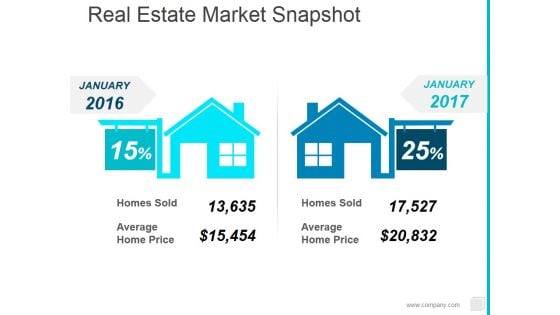
Real Estate Market Snapshot Ppt PowerPoint Presentation Outline Visuals
This is a real estate market snapshot ppt powerpoint presentation outline visuals. This is a two stage process. The stages in this process are homes sold, average home price, january.

Employee Who Leave Within First 6 Months Ppt PowerPoint Presentation Gallery Grid
This is a employee who leave within first 6 months ppt powerpoint presentation gallery grid. This is a two stage process. The stages in this process are business, finance, marketing, strategy, analysis.
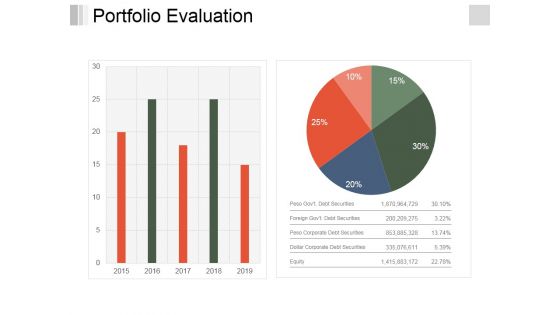
Portfolio Evaluation Ppt PowerPoint Presentation Infographics Objects
This is a portfolio evaluation ppt powerpoint presentation infographics objects. This is a two stage process. The stages in this process are business, finance, bar graph, pie chart, marketing, analysis, investment.
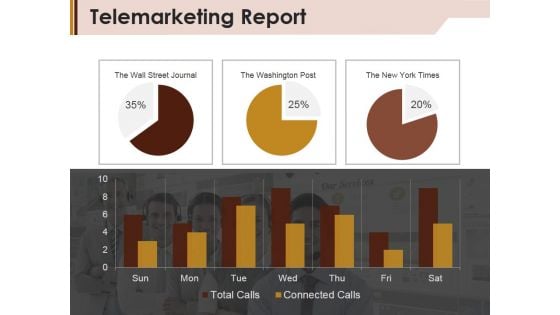
Telemarketing Report Template 1 Ppt PowerPoint Presentation Summary Example
This is a telemarketing report template 1 ppt powerpoint presentation summary example. This is a two stage process. The stages in this process are the wall street journal, the washington post, total calls, connected calls.
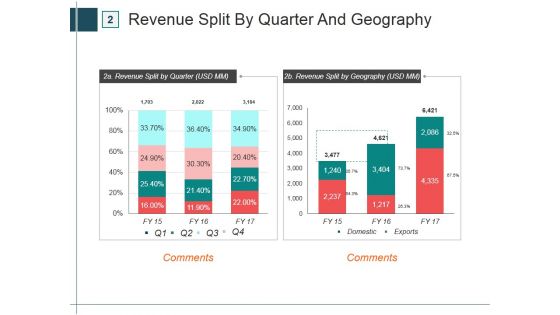
Revenue Split By Quarter And Geography Template 1 Ppt PowerPoint Presentation Infographics Graphics Template
This is a revenue split by quarter and geography template 1 ppt powerpoint presentation infographics graphics template. This is a two stage process. The stages in this process are domestic, exports, comments.
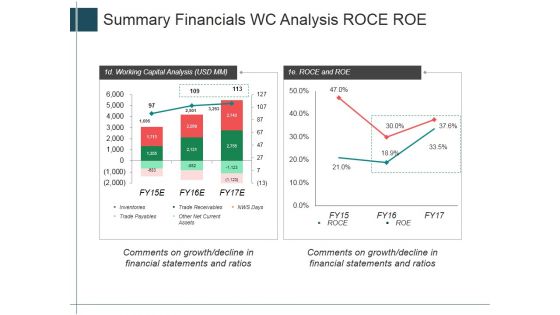
Summary Financials Wc Analysis Roce Roe Ppt PowerPoint Presentation Inspiration Templates
This is a summary financials wc analysis roce roe ppt powerpoint presentation inspiration templates. This is a two stage process. The stages in this process are working capital analysis, roce and roe, growth, finance.
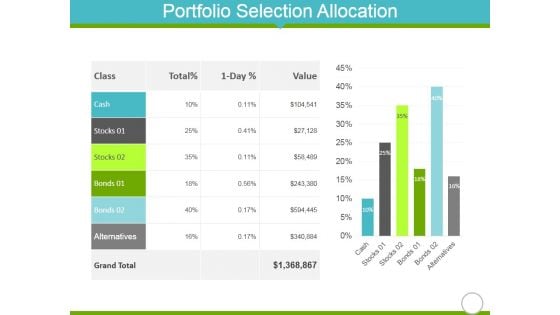
Portfolio Selection Allocation Template 1 Ppt PowerPoint Presentation Show Guidelines
This is a portfolio selection allocation template 1 ppt powerpoint presentation show guidelines. This is a two stage process. The stages in this process are cash, stocks, bonds, alternatives, values.
Addressable Market In Sector 1 Ppt PowerPoint Presentation Ideas Icons
This is a addressable market in sector 1 ppt powerpoint presentation ideas icons. This is a two stage process. The stages in this process are fossil fuels, nuclear, bioenergy, biofuels.
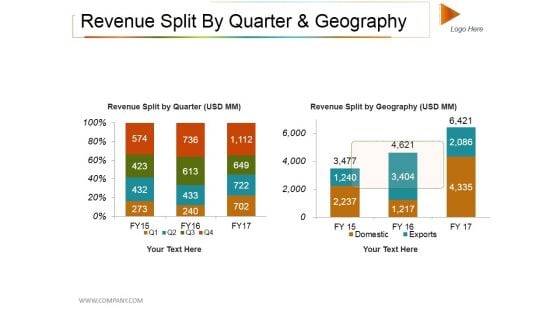
Revenue Split By Quarter And Geography Ppt PowerPoint Presentation Professional Slide Download
This is a revenue split by quarter and geography ppt powerpoint presentation professional slide download. This is a two stage process. The stages in this process are domestic, exports, revenue split by quarter, revenue split by geography.
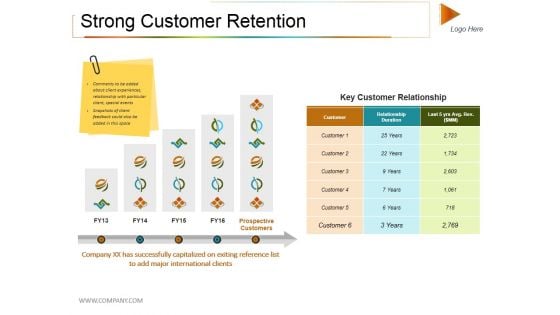
Strong Customer Retention Ppt PowerPoint Presentation Infographic Template Ideas
This is a strong customer retention ppt powerpoint presentation infographic template ideas. This is a two stage process. The stages in this process are key customer relationship, prospective customers, customers, years.
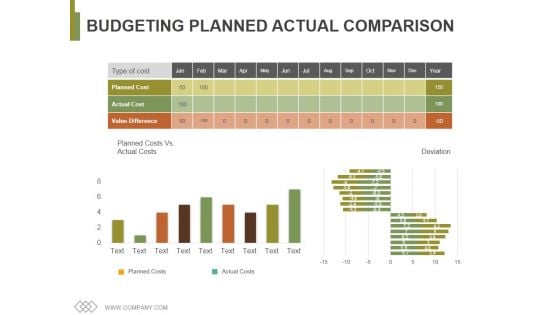
Budgeting Planned Actual Comparison Ppt PowerPoint Presentation Pictures Elements
This is a budgeting planned actual comparison ppt powerpoint presentation pictures elements. This is a two stage process. The stages in this process are type of cost, planned cost, actual cost, value difference.
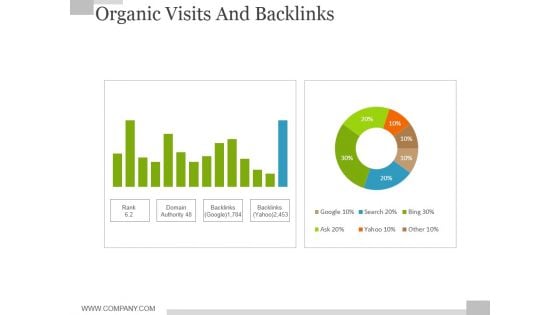
Organic Visits And Backlinks Ppt PowerPoint Presentation Infographic Template Model
This is a organic visits and backlinks ppt powerpoint presentation infographic template model. This is a two stage process. The stages in this process are rank, domain authority, backlinks, google, search.
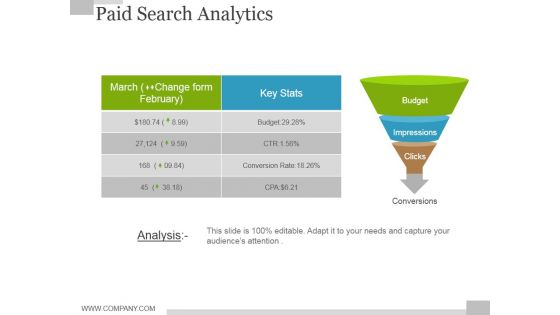
Paid Search Analytics Ppt PowerPoint Presentation Show Slide
This is a paid search analytics ppt powerpoint presentation show slide. This is a two stage process. The stages in this process are budget, impressions, clicks, key stats, funnel.

Capital Allocation Ppt PowerPoint Presentation Layouts Introduction
This is a capital allocation ppt powerpoint presentation layouts introduction. This is a two stage process. The stages in this process are capital expenditure, working capital, shareholder distribution, debt repayment.
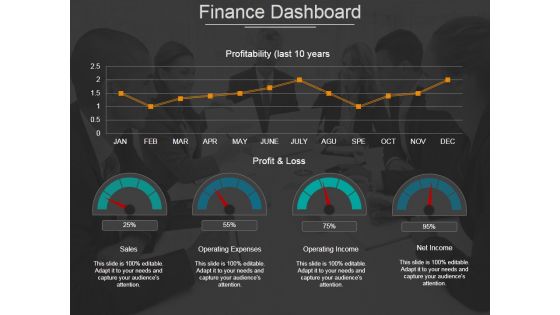
Finance Dashboard Ppt PowerPoint Presentation Model Graphics Example
This is a finance dashboard ppt powerpoint presentation model graphics example. This is a two stage process. The stages in this process are sales, operating expenses, operating income, net income.
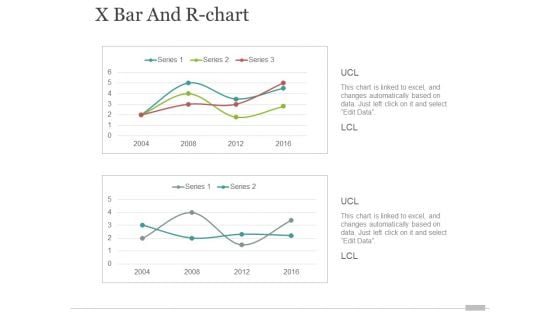
x bar and r chart ppt powerpoint presentation portfolio elements
This is a x bar and r chart ppt powerpoint presentation portfolio elements. This is a two stage process. The stages in this process are finance, business, marketing, growth.
Organic Visits And Backlinks Ppt PowerPoint Presentation Model Icon
This is a organic visits and backlinks ppt powerpoint presentation model icon. This is a two stage process. The stages in this process are business, finance, marketing, analysis, investment.
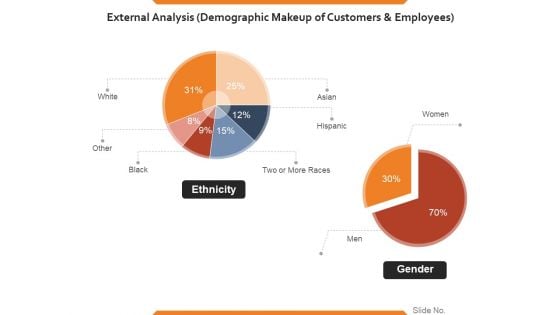
External Analysis Demographic Makeup Of Customers And Employees Ppt PowerPoint Presentation Slides Example
This is a external analysis demographic makeup of customers and employees ppt powerpoint presentation slides example. This is a two stage process. The stages in this process are asian, hispanic, other, white, ethnicity, percentage.
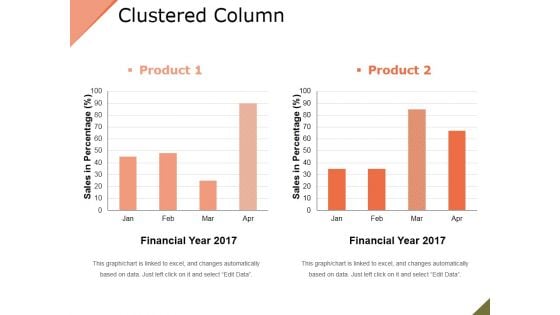
Clustered Column Ppt PowerPoint Presentation File Slide
This is a clustered column ppt powerpoint presentation file slide. This is a two stage process. The stages in this process are product, financial year, sales in percentage, bar graph.
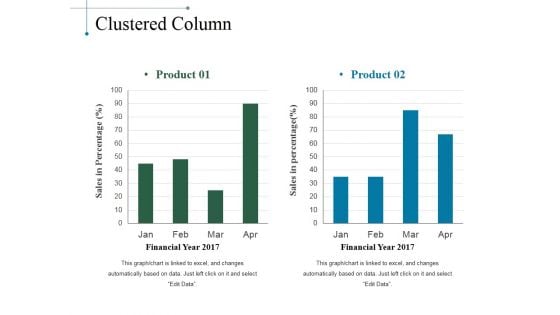
Clustered Column Ppt PowerPoint Presentation Slides Smartart
This is a clustered column ppt powerpoint presentation slides smartart. This is a two stage process. The stages in this process are product, sales in percentage, financial year, bar graph.
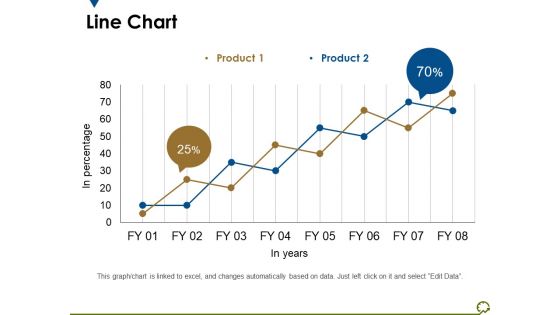
Line Chart Ppt PowerPoint Presentation Outline Diagrams
This is a line chart ppt powerpoint presentation outline diagrams. This is a two stage process. The stages in this process are in percentage, in years, percentage, business, marketing.
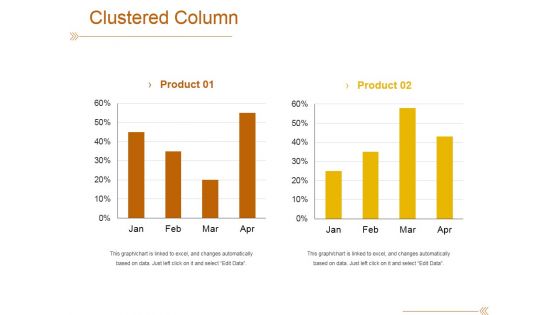
Clustered Column Template 1 Ppt PowerPoint Presentation Outline File Formats
This is a clustered column template 1 ppt powerpoint presentation outline file formats. This is a two stage process. The stages in this process are product, bar graph, success, growth, finance.
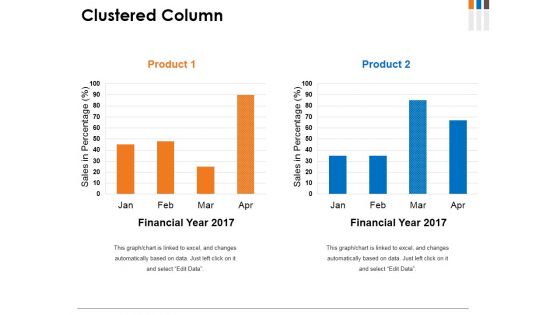
Clustered Column Ppt PowerPoint Presentation File Graphics
This is a clustered column ppt powerpoint presentation file graphics. This is a two stage process. The stages in this process are product, financial year, sales in percentage, graph, growth.
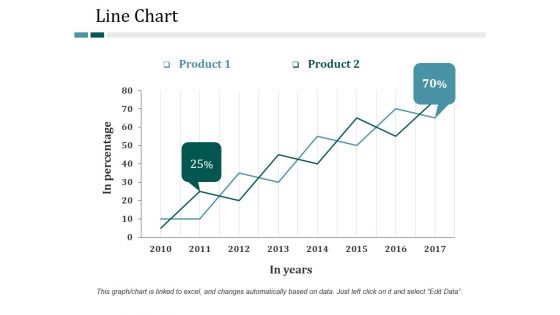
Line Chart Ppt PowerPoint Presentation Summary Graphic Tips
This is a line chart ppt powerpoint presentation summary graphic tips. This is a two stage process. The stages in this process are line chart, product, in percentage, analysis, business.
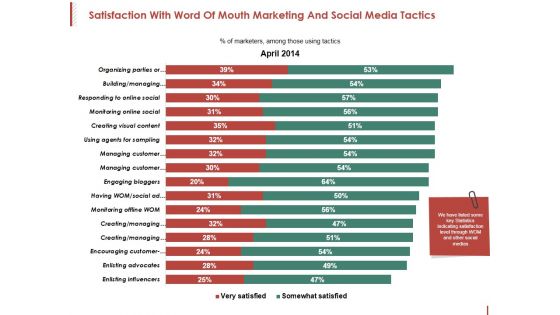
Satisfaction With Word Of Mouth Marketing And Social Media Tactics Ppt PowerPoint Presentation Professional Outline
This is a satisfaction with word of mouth marketing and social media tactics ppt powerpoint presentation professional outline. This is a two stage process. The stages in this process are managing customer, creating, engaging bloggers, enlisting advocates, enlisting influencers.
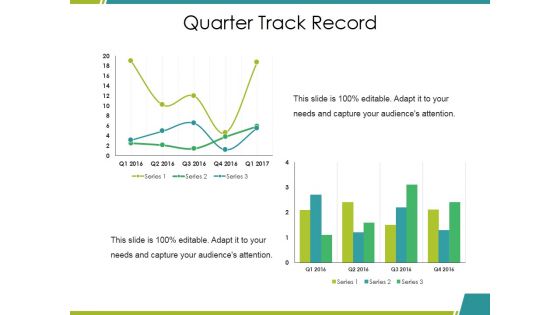
Quarter Track Record Ppt PowerPoint Presentation File Clipart Images
This is a quarter track record ppt powerpoint presentation file clipart images. This is a two stage process. The stages in this process are bar graph, growth, success, business, marketing.

Sales Budget Vs Actual Ppt PowerPoint Presentation Show Master Slide
This is a sales budget vs actual ppt powerpoint presentation show master slide. This is a two stage process. The stages in this process are business, finance, management, analysis, budget, actual.
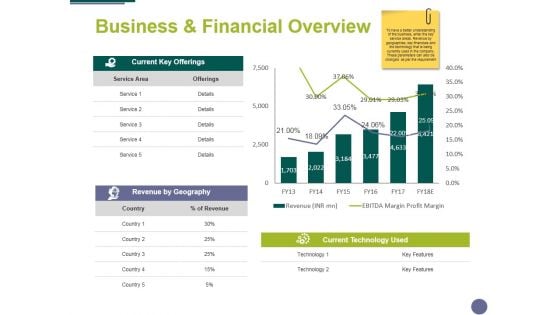
Business And Financial Overview Ppt PowerPoint Presentation Summary Format
This is a business and financial overview ppt powerpoint presentation summary format. This is a two stage process. The stages in this process are finance, analysis, marketing, business, compere.
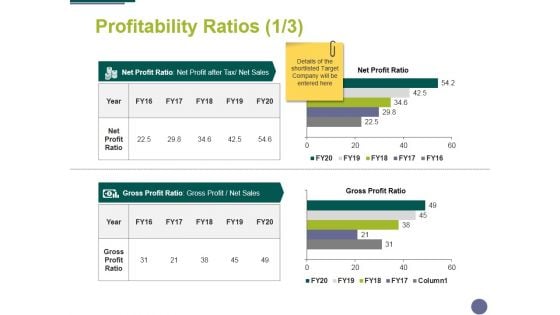
Profitability Ratios Template 1 Ppt PowerPoint Presentation Professional Skills
This is a profitability ratios template 1 ppt powerpoint presentation professional skills. This is a two stage process. The stages in this process are compere, finance, marketing, analysis, business.
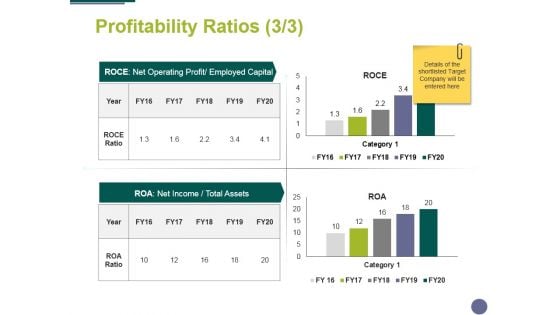
Profitability Ratios Template 3 Ppt PowerPoint Presentation Ideas Skills
This is a profitability ratios template 3 ppt powerpoint presentation ideas skills. This is a two stage process. The stages in this process are compere, finance, marketing, analysis, business.
Activity Ratios Template 1 Ppt PowerPoint Presentation Outline Icons
This is a activity ratios template 1 ppt powerpoint presentation outline icons. This is a two stage process. The stages in this process are inventory turnover, receivables turnover, year, inventory ratio, category.
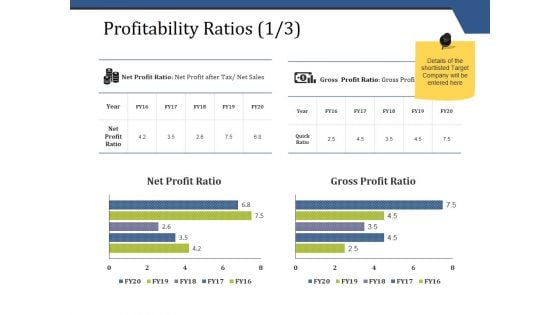
Profitability Ratios Template 1 Ppt PowerPoint Presentation Infographics Mockup
This is a profitability ratios template 1 ppt powerpoint presentation infographics mockup. This is a two stage process. The stages in this process are business, finance, marketing, strategy, analysis.
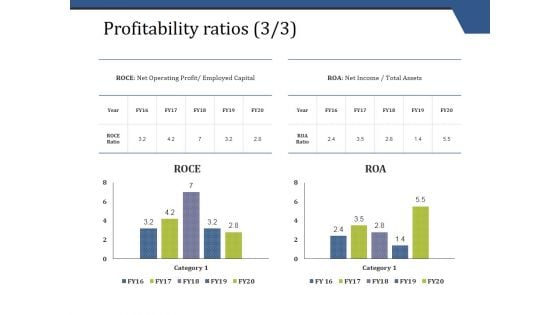
Profitability Ratios Template 3 Ppt PowerPoint Presentation Infographic Template Visual Aids
This is a profitability ratios template 3 ppt powerpoint presentation infographic template visual aids. This is a two stage process. The stages in this process are business, finance, marketing, analysis, investment.
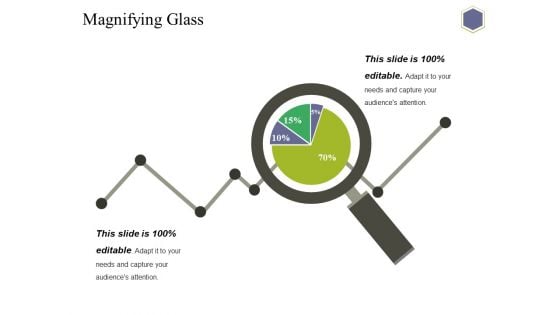
Magnifying Glass Ppt PowerPoint Presentation Infographic Template Graphics Download
This is a magnifying glass ppt powerpoint presentation infographic template graphics download. This is a two stage process. The stages in this process are magnifying glass, business, marketing, percentage, technology.
Activity Ratios Template 1 Ppt PowerPoint Presentation Icon File Formats
This is a activity ratios template 1 ppt powerpoint presentation icon file formats. This is a two stage process. The stages in this process are finance, analysis, compere, business, marketing.
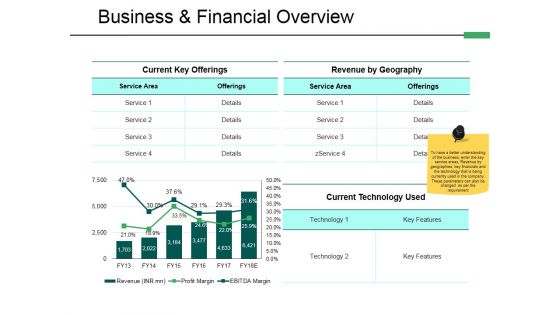
Business And Financial Overview Ppt PowerPoint Presentation Pictures Visuals
This is a business and financial overview ppt powerpoint presentation pictures visuals. This is a two stage process. The stages in this process are current key offerings, revenue by geography, current technology used, business financial overview.
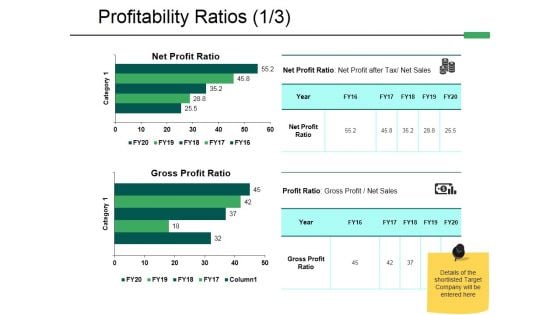
Profitability Ratios Template 1 Ppt PowerPoint Presentation Infographic Template Images
This is a profitability ratios template 1 ppt powerpoint presentation infographic template images. This is a two stage process. The stages in this process are finance, analysis, compere, strategy, business.
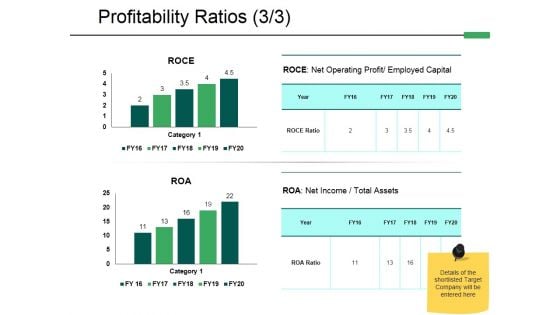
Profitability Ratios Template 3 Ppt PowerPoint Presentation Styles Introduction
This is a profitability ratios template 3 ppt powerpoint presentation styles introduction. This is a two stage process. The stages in this process are finance, analysis, compere, strategy, business.
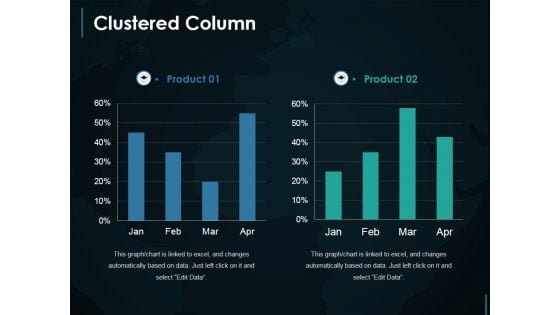
Clustered Column Ppt PowerPoint Presentation Layouts Deck
This is a clustered column ppt powerpoint presentation layouts deck. This is a two stage process. The stages in this process are clustered column, finance, marketing, strategy, investment, business.
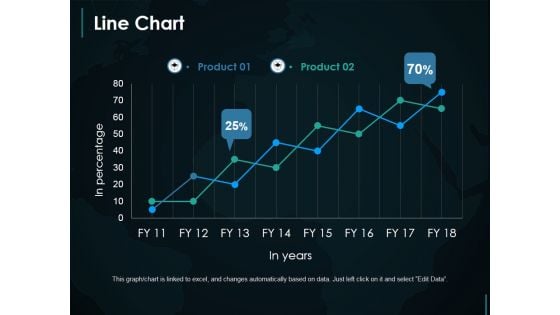
Line Chart Ppt PowerPoint Presentation Infographic Template Demonstration
This is a line chart ppt powerpoint presentation infographic template demonstration. This is a two stage process. The stages in this process are line chart, growth, finance, marketing, strategy.
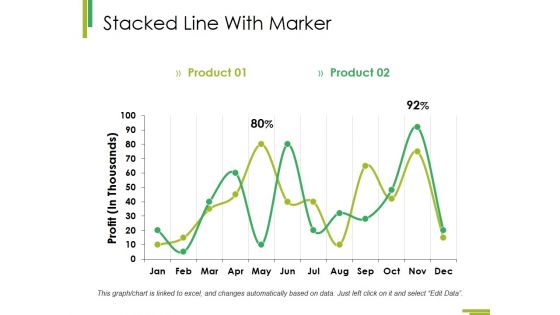
Stacked Line With Marker Ppt PowerPoint Presentation Summary Clipart Images
This is a stacked line with marker ppt powerpoint presentation summary clipart images. This is a two stage process. The stages in this process are growth, business, finance, analysis, marketing.
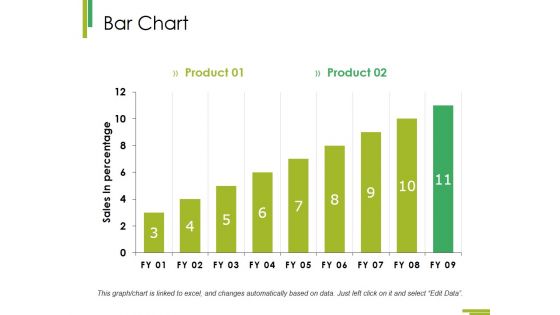
Bar Chart Ppt PowerPoint Presentation Infographic Template Master Slide
This is a bar chart ppt powerpoint presentation infographic template master slide. This is a two stage process. The stages in this process are growth, finance, business, analysis, marketing.
Internal Rate Of Return Valuation Summary Ppt PowerPoint Presentation Icon Visual Aids
This is a internal rate of return valuation summary ppt powerpoint presentation icon visual aids. This is a two stage process. The stages in this process are business, marketing, analysis, strategy, compare.
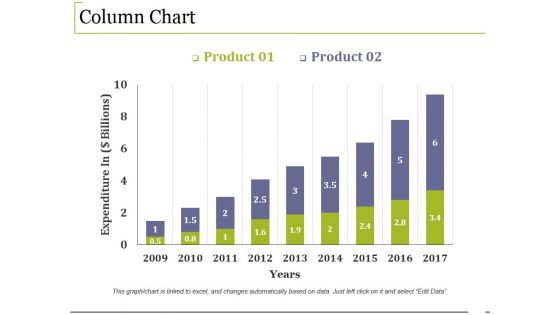
Column Chart Ppt PowerPoint Presentation Infographic Template Example File
This is a column chart ppt powerpoint presentation infographic template example file. This is a two stage process. The stages in this process are growth, finance, business, marketing, analysis.
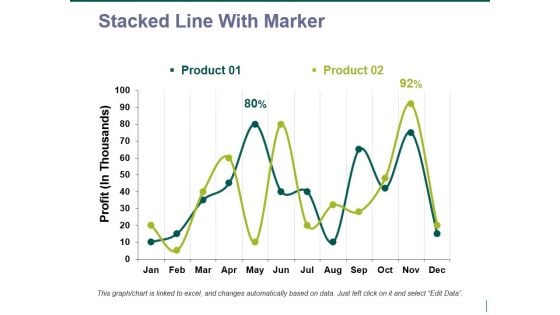
stacked line with marker ppt powerpoint presentation styles slide portrait
This is a stacked line with marker ppt powerpoint presentation styles slide portrait. This is a two stage process. The stages in this process are stacked line, growth, strategy, business, finance.
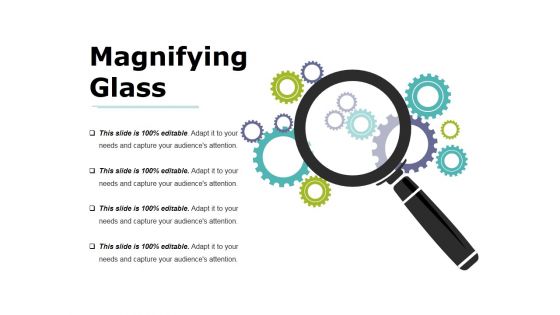
Magnifying Glass Ppt PowerPoint Presentation Summary Deck
This is a magnifying glass ppt powerpoint presentation summary deck. This is a two stage process. The stages in this process are magnifying glass, gears, technology, marketing, strategy, business.
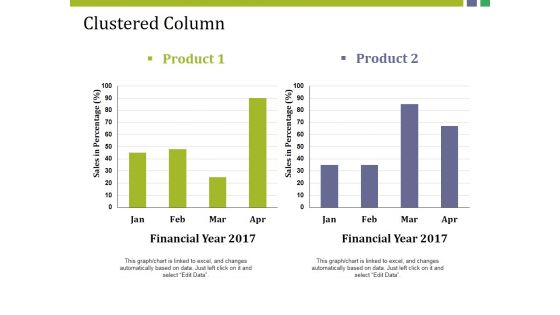
Clustered Column Ppt PowerPoint Presentation Gallery Structure
This is a clustered column ppt powerpoint presentation gallery structure. This is a two stage process. The stages in this process are product, sales in percentage, financial year, bar graph, finance.
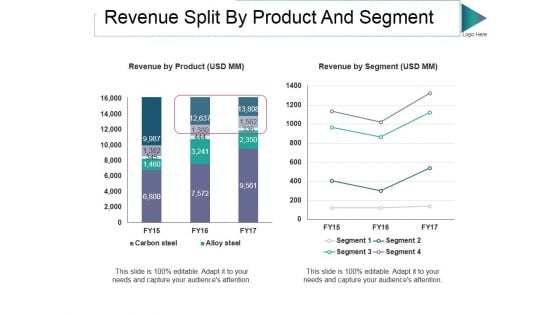
Revenue Split By Product And Segment Ppt PowerPoint Presentation Outline Graphic Images
This is a revenue split by product and segment ppt powerpoint presentation outline graphic images. This is a two stage process. The stages in this process are revenue by product, revenue by segment, segment, alloy steel, carbon steel.


 Continue with Email

 Home
Home


