Usage Metrics
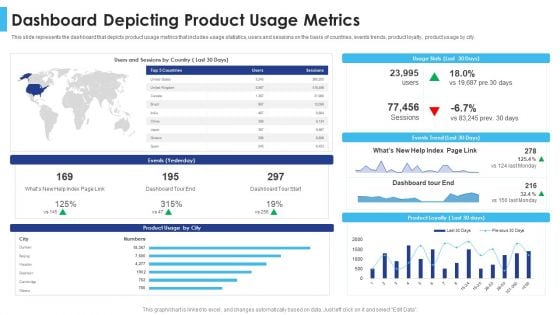
Satisfying Consumers Through Strategic Product Building Plan Dashboard Depicting Product Usage Metrics Inspiration PDF
This slide represents the dashboard that depicts product usage metrics that includes usage statistics, users and sessions on the basis of countries, events trends, product loyalty, product usage by city. Deliver and pitch your topic in the best possible manner with this satisfying consumers through strategic product building plan dashboard depicting product usage metrics inspiration pdf. Use them to share invaluable insights on dashboard depicting product usage metrics and impress your audience. This template can be altered and modified as per your expectations. So, grab it now.

Sustainable Power Usage Effectiveness PUE Performance Metric
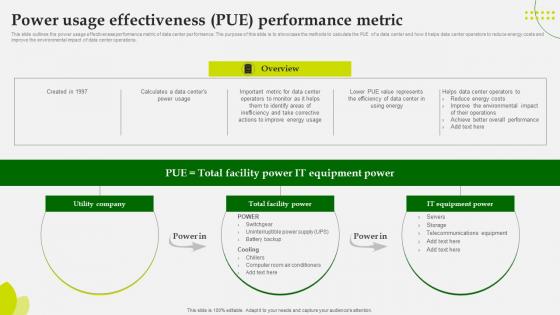
This slide outlines the power usage effectiveness performance metric of data center performance. The purpose of this slide is to showcase the methods to calculate the PUE of a data center and how it helps data center operators to reduce energy costs and improve the environmental impact of data center operations. Find highly impressive Sustainable Power Usage Effectiveness PUE Performance Metric on Slidegeeks to deliver a meaningful presentation. You can save an ample amount of time using these presentation templates. No need to worry to prepare everything from scratch because Slidegeeks experts have already done a huge research and work for you. You need to download Sustainable Power Usage Effectiveness PUE Performance Metric for your upcoming presentation. All the presentation templates are 100 percent editable and you can change the color and personalize the content accordingly. Download now This slide outlines the power usage effectiveness performance metric of data center performance. The purpose of this slide is to showcase the methods to calculate the PUE of a data center and how it helps data center operators to reduce energy costs and improve the environmental impact of data center operations.
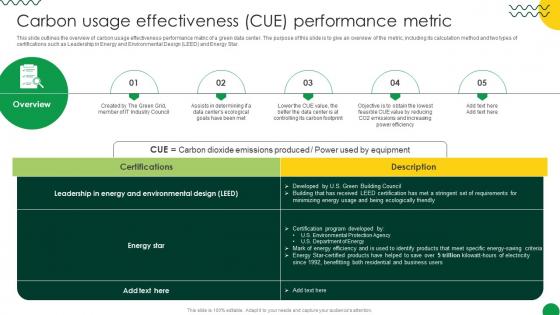
Sustainable Carbon Usage Effectiveness CUE Performance Metric
This slide outlines the overview of carbon usage effectiveness performance matric of a green data center. The purpose of this slide is to give an overview of the metric, including its calculation method and two types of certifications such as Leadership in Energy and Environmental Design LEED and Energy Star. Find highly impressive Sustainable Carbon Usage Effectiveness CUE Performance Metric on Slidegeeks to deliver a meaningful presentation. You can save an ample amount of time using these presentation templates. No need to worry to prepare everything from scratch because Slidegeeks experts have already done a huge research and work for you. You need to download Sustainable Carbon Usage Effectiveness CUE Performance Metric for your upcoming presentation. All the presentation templates are 100 percent editable and you can change the color and personalize the content accordingly. Download now This slide outlines the overview of carbon usage effectiveness performance matric of a green data center. The purpose of this slide is to give an overview of the metric, including its calculation method and two types of certifications such as Leadership in Energy and Environmental Design LEED and Energy Star.
Green Computing Power Usage Effectiveness Pue Performance Metric
This slide outlines the power usage effectiveness performance metric of data center performance. The purpose of this slide is to showcase the methods to calculate the PUE of a data center and how it helps data center operators to reduce energy costs and improve the environmental impact of data center operations. Create an editable Green Computing Power Usage Effectiveness Pue Performance Metric that communicates your idea and engages your audience. Whether you are presenting a business or an educational presentation, pre-designed presentation templates help save time. Green Computing Power Usage Effectiveness Pue Performance Metric is highly customizable and very easy to edit, covering many different styles from creative to business presentations. Slidegeeks has creative team members who have crafted amazing templates. So, go and get them without any delay. This slide outlines the power usage effectiveness performance metric of data center performance. The purpose of this slide is to showcase the methods to calculate the PUE of a data center and how it helps data center operators to reduce energy costs and improve the environmental impact of data center operations.
Power Usage Effectiveness Pue Performance Metric Eco Friendly Computing IT
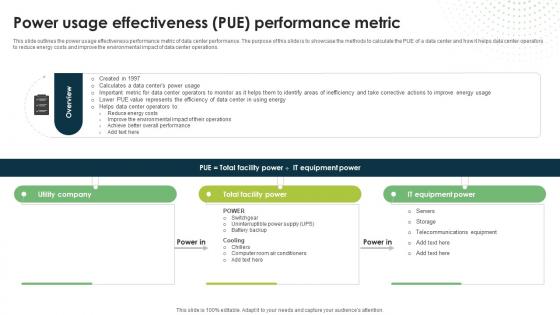
This slide outlines the power usage effectiveness performance metric of data center performance. The purpose of this slide is to showcase the methods to calculate the PUE of a data center and how it helps data center operators to reduce energy costs and improve the environmental impact of data center operations.Slidegeeks is one of the best resources for PowerPoint templates. You can download easily and regulate Power Usage Effectiveness Pue Performance Metric Eco Friendly Computing IT for your personal presentations from our wonderful collection. A few clicks is all it takes to discover and get the most relevant and appropriate templates. Use our Templates to add a unique zing and appeal to your presentation and meetings. All the slides are easy to edit and you can use them even for advertisement purposes. This slide outlines the power usage effectiveness performance metric of data center performance. The purpose of this slide is to showcase the methods to calculate the PUE of a data center and how it helps data center operators to reduce energy costs and improve the environmental impact of data center operations.

Solar Computing IT Power Usage Effectiveness Pue Performance Metric
This slide outlines the power usage effectiveness performance metric of data center performance. The purpose of this slide is to showcase the methods to calculate the PUE of a data center and how it helps data center operators to reduce energy costs and improve the environmental impact of data center operations. Slidegeeks is one of the best resources for PowerPoint templates. You can download easily and regulate Solar Computing IT Power Usage Effectiveness Pue Performance Metric for your personal presentations from our wonderful collection. A few clicks is all it takes to discover and get the most relevant and appropriate templates. Use our Templates to add a unique zing and appeal to your presentation and meetings. All the slides are easy to edit and you can use them even for advertisement purposes. This slide outlines the power usage effectiveness performance metric of data center performance. The purpose of this slide is to showcase the methods to calculate the PUE of a data center and how it helps data center operators to reduce energy costs and improve the environmental impact of data center operations.

Carbon Usage Effectiveness Cue Performance Metric Eco Friendly Computing IT
This slide outlines the overview of carbon usage effectiveness performance matric of a green data center. The purpose of this slide is to give an overview of the metric, including its calculation method and two types of certifications such as Leadership in Energy and Environmental Design LEED and Energy Star.Create an editable Carbon Usage Effectiveness Cue Performance Metric Eco Friendly Computing IT that communicates your idea and engages your audience. Whether you are presenting a business or an educational presentation, pre-designed presentation templates help save time. Carbon Usage Effectiveness Cue Performance Metric Eco Friendly Computing IT is highly customizable and very easy to edit, covering many different styles from creative to business presentations. Slidegeeks has creative team members who have crafted amazing templates. So, go and get them without any delay. This slide outlines the overview of carbon usage effectiveness performance matric of a green data center. The purpose of this slide is to give an overview of the metric, including its calculation method and two types of certifications such as Leadership in Energy and Environmental Design ,LEED and Energy Star.
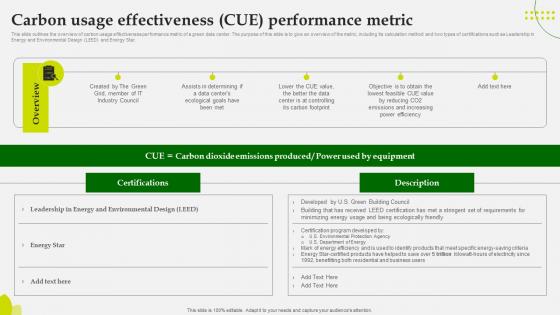
Green Computing Carbon Usage Effectiveness Cue Performance Metric
This slide outlines the overview of carbon usage effectiveness performance matric of a green data center. The purpose of this slide is to give an overview of the metric, including its calculation method and two types of certifications such as Leadership in Energy and Environmental Design LEED and Energy Star. Create an editable Green Computing Carbon Usage Effectiveness Cue Performance Metric that communicates your idea and engages your audience. Whether you are presenting a business or an educational presentation, pre-designed presentation templates help save time. Green Computing Carbon Usage Effectiveness Cue Performance Metric is highly customizable and very easy to edit, covering many different styles from creative to business presentations. Slidegeeks has creative team members who have crafted amazing templates. So, go and get them without any delay. This slide outlines the overview of carbon usage effectiveness performance matric of a green data center. The purpose of this slide is to give an overview of the metric, including its calculation method and two types of certifications such as Leadership in Energy and Environmental Design LEED and Energy Star.
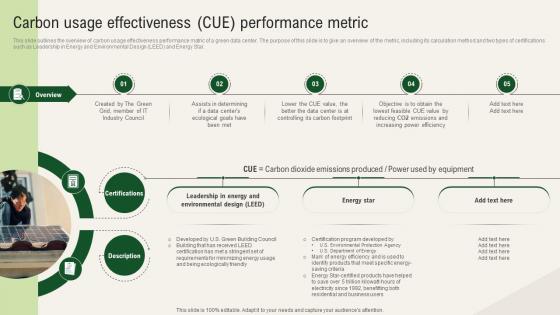
Solar Computing IT Carbon Usage Effectiveness Cue Performance Metric
This slide outlines the overview of carbon usage effectiveness performance matric of a green data center. The purpose of this slide is to give an overview of the metric, including its calculation method and two types of certifications such as Leadership in Energy and Environmental Design LEED and Energy Star. Slidegeeks is one of the best resources for PowerPoint templates. You can download easily and regulate Solar Computing IT Carbon Usage Effectiveness Cue Performance Metric for your personal presentations from our wonderful collection. A few clicks is all it takes to discover and get the most relevant and appropriate templates. Use our Templates to add a unique zing and appeal to your presentation and meetings. All the slides are easy to edit and you can use them even for advertisement purposes. This slide outlines the overview of carbon usage effectiveness performance matric of a green data center. The purpose of this slide is to give an overview of the metric, including its calculation method and two types of certifications such as Leadership in Energy and Environmental Design LEED and Energy Star.
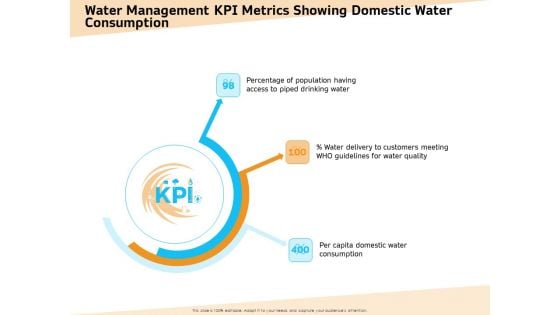
Optimization Of Water Usage Water Management KPI Metrics Showing Domestic Water Consumption Ppt Professional Information PDF
Presenting this set of slides with name optimization of water usage water management kpi metrics showing domestic water consumption ppt professional information pdf. This is a three stage process. The stages in this process are percentage population, having access, piped drinking water, water delivery, customers meeting who guidelines, water quality. This is a completely editable PowerPoint presentation and is available for immediate download. Download now and impress your audience.
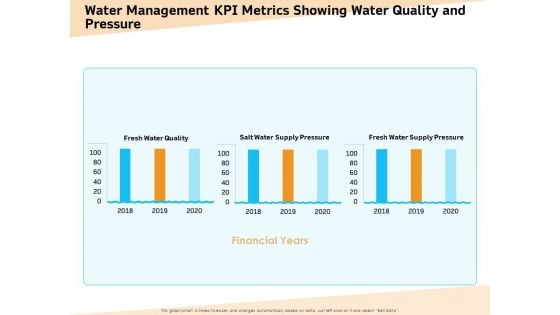
Optimization Of Water Usage Water Management KPI Metrics Showing Water Quality And Pressure Ppt Gallery Graphics PDF
Presenting this set of slides with name optimization of water usage water management kpi metrics showing water quality and pressure ppt gallery graphics pdf. The topics discussed in these slides are financial years, fresh water quality, fresh water supply pressure, salt water supply pressure, 2018 to 2020. This is a completely editable PowerPoint presentation and is available for immediate download. Download now and impress your audience.
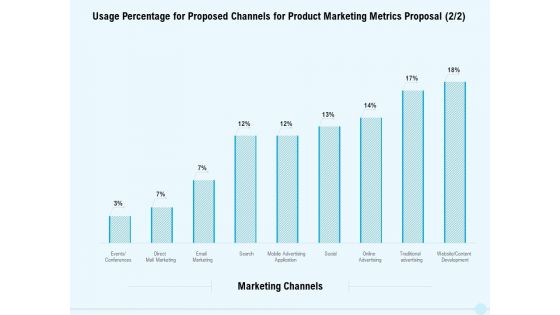
Business Commodity Market KPIS Usage Percentage For Proposed Channels For Product Marketing Metrics Proposal Rules PDF
Presenting this set of slides with name business commodity market kpis usage percentage for proposed channels for product marketing metrics proposal rules pdf. The topics discussed in these slides are development, marketing, social, traditional, advertising application. This is a completely editable PowerPoint presentation and is available for immediate download. Download now and impress your audience.
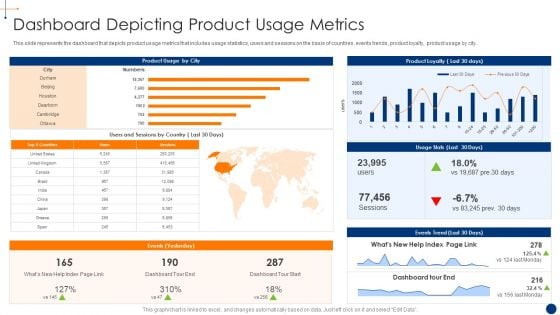
New Product Development Process Optimization Dashboard Depicting Product Usage Structure PDF
This slide represents the dashboard that depicts product usage metrics that includes usage statistics, users and sessions on the basis of countries, events trends, product loyalty, product usage by city.Deliver an awe inspiring pitch with this creative new product development process optimization dashboard depicting product usage structure pdf bundle. Topics like dashboard depicting product usage metrics can be discussed with this completely editable template. It is available for immediate download depending on the needs and requirements of the user.
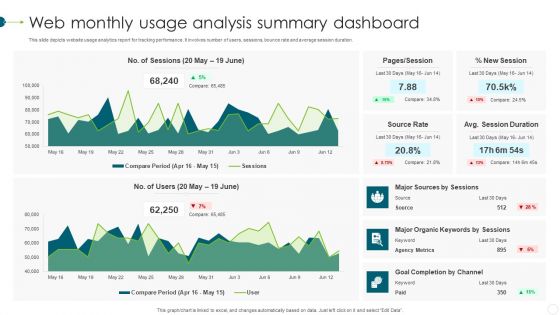
Web Monthly Usage Analysis Summary Dashboard Clipart PDF
This slide depicts website usage analytics report for tracking performance. It involves number of users, sessions, bounce rate and average session duration. Pitch your topic with ease and precision using this Web Monthly Usage Analysis Summary Dashboard Clipart PDF. This layout presents information on Agency Metrics, Source Rate, Goal. It is also available for immediate download and adjustment. So, changes can be made in the color, design, graphics or any other component to create a unique layout.
Feature Acquisition Software To Measure Product Usage Icon Brochure PDF
Presenting Feature Acquisition Software To Measure Product Usage Icon Brochure PDF to dispense important information. This template comprises three stages. It also presents valuable insights into the topics including Feature Acquisition Software, Measure Product Usage Icon. This is a completely customizable PowerPoint theme that can be put to use immediately. So, download it and address the topic impactfully.
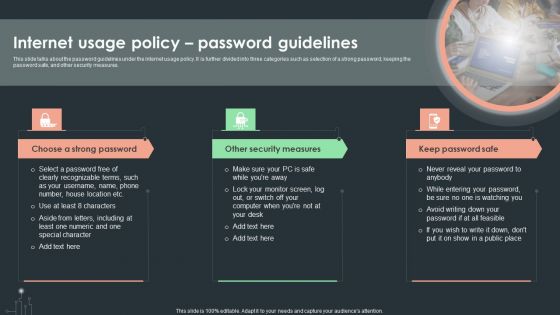
Cybersecurity Guidelines IT Internet Usage Policy Password Guidelines Download PDF
This slide talks about the password guidelines under the internet usage policy. It is further divided into three categories such as selection of a strong password, keeping the password safe, and other security measures. The best PPT templates are a great way to save time, energy, and resources. Slidegeeks have 100 percent editable powerpoint slides making them incredibly versatile. With these quality presentation templates, you can create a captivating and memorable presentation by combining visually appealing slides and effectively communicating your message. Download Cybersecurity Guidelines IT Internet Usage Policy Password Guidelines Download PDF from Slidegeeks and deliver a wonderful presentation.
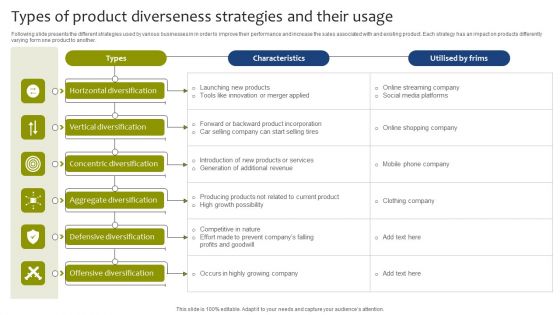
Types Of Product Diverseness Strategies And Their Usage Background PDF
Following slide presents the different strategies used by various businesses in in order to improve their performance and increase the sales associated with and existing product. Each strategy has an impact on products differently varying form one product to another. Showcasing this set of slides titled Types Of Product Diverseness Strategies And Their Usage Background PDF. The topics addressed in these templates are Horizontal Diversification, Vertical Diversification, Concentric Diversification. All the content presented in this PPT design is completely editable. Download it and make adjustments in color, background, font etc. as per your unique business setting.
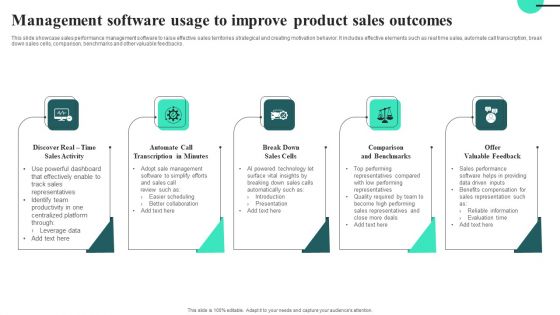
Management Software Usage To Improve Product Sales Outcomes Themes PDF
This slide showcase sales performance management software to raise effective sales territories strategical and creating motivation behavior. It includes effective elements such as real time sales, automate call transcription, break down sales cells, comparison, benchmarks and other valuable feedbacks.Presenting Management Software Usage To Improve Product Sales Outcomes Themes PDF to dispense important information. This template comprises five stages. It also presents valuable insights into the topics including Automate Call, Transcription In Minutes. This is a completely customizable PowerPoint theme that can be put to use immediately. So, download it and address the topic impactfully.
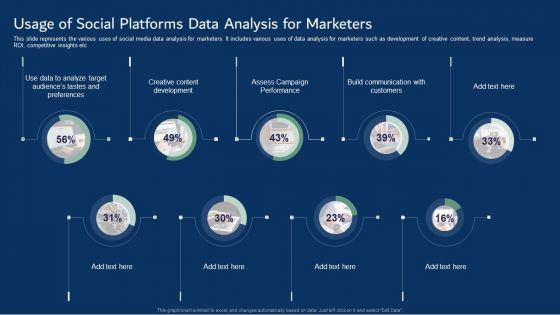
Usage Of Social Platforms Data Analysis For Marketers Information PDF
This slide represents the various uses of social media data analysis for marketers. It includes various uses of data analysis for marketers such as development of creative content, trend analysis, measure ROI, competitive insights etc. Showcasing this set of slides titled Usage Of Social Platforms Data Analysis For Marketers Information PDF. The topics addressed in these templates are Creative Content Development, Assess Campaign Performance, Build Communication. All the content presented in this PPT design is completely editable. Download it and make adjustments in color, background, font etc. as per your unique business setting.
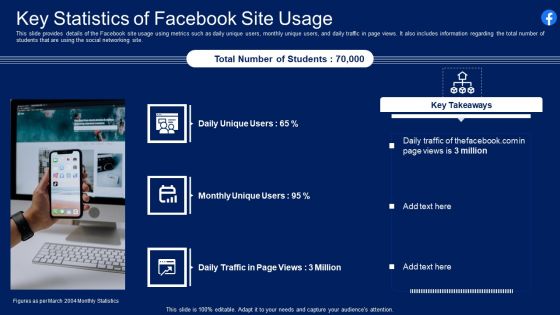
Facebook Original Capital Funding Key Statistics Of Facebook Site Usage Topics PDF
This slide provides details of the Facebook site usage using metrics such as daily unique users, monthly unique users, and daily traffic in page views. It also includes information regarding the total number of students that are using the social networking site. Presenting facebook original capital funding key statistics of facebook site usage topics pdf to provide visual cues and insights. Share and navigate important information on three stages that need your due attention. This template can be used to pitch topics like key statistics of facebook site usage. In addtion, this PPT design contains high resolution images, graphics, etc, that are easily editable and available for immediate download.
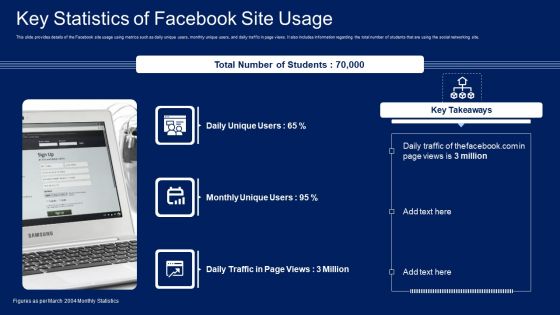
Facebook Original Elevator Funding Pitch Deck Key Statistics Of Facebook Site Usage Background PDF
This slide provides details of the Facebook site usage using metrics such as daily unique users, monthly unique users, and daily traffic in page views. It also includes information regarding the total number of students that are using the social networking site. Presenting Facebook Original Elevator Funding Pitch Deck Key Statistics Of Facebook Site Usage Background PDF to provide visual cues and insights. Share and navigate important information on three stages that need your due attention. This template can be used to pitch topics like Key Statistics. In addtion, this PPT design contains high resolution images, graphics, etc, that are easily editable and available for immediate download.
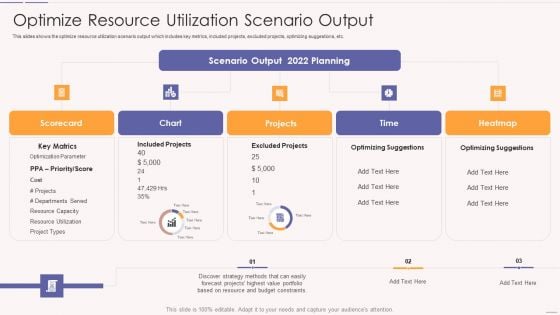
Asset Usage And Monitoring With Resource Management Plan Optimize Resource Utilization Clipart PDF
This slides shows the optimize resource utilization scenario output which includes key metrics, included projects, excluded projects, optimizing suggestions, etc.Deliver and pitch your topic in the best possible manner with this asset usage and monitoring with resource management plan optimize resource utilization clipart pdf Use them to share invaluable insights on included projects, excluded projects, optimizing suggestions and impress your audience. This template can be altered and modified as per your expectations. So, grab it now.

Front Series C Capital Raising Pitch Deck High Product Usage Showcasing Impressive Diagrams PDF
This slide caters details about high product usage showcasing impressive performance of front platform. Deliver an awe inspiring pitch with this creative front series c capital raising pitch deck high product usage showcasing impressive diagrams pdf bundle. Topics like high product usage showcasing impressive performance of front platform can be discussed with this completely editable template. It is available for immediate download depending on the needs and requirements of the user.

Improving Corporate Performance Benefits And Impact Of Presence Functionality Usage Portrait PDF
Following slide displays informational stats about benefits of using presence functionality on employee productivity along with the impact stats of instant messaging software on the same. Create an editable Improving Corporate Performance Benefits And Impact Of Presence Functionality Usage Portrait PDF that communicates your idea and engages your audience. Whether youre presenting a business or an educational presentation, pre-designed presentation templates help save time. Improving Corporate Performance Benefits And Impact Of Presence Functionality Usage Portrait PDF is highly customizable and very easy to edit, covering many different styles from creative to business presentations. Slidegeeks has creative team members who have crafted amazing templates. So, go and get them without any delay.
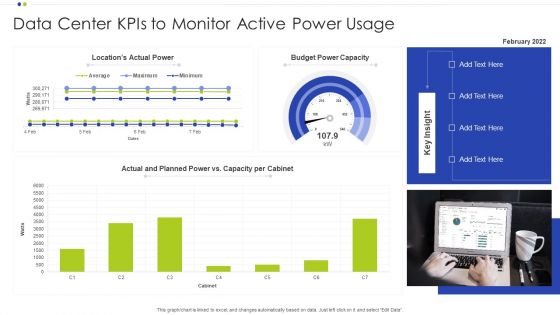
Data Center Kpis To Monitor Active Power Usage Ppt Styles Microsoft PDF
Showcasing this set of slides titled Data Center Kpis To Monitor Active Power Usage Ppt Styles Microsoft PDF. The topics addressed in these templates are Budget Power Capacity, Data Center, Monitor Active Power. All the content presented in this PPT design is completely editable. Download it and make adjustments in color, background, font etc. as per your unique business setting.
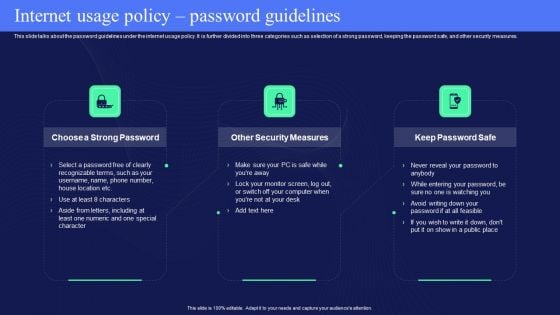
IT Policies And Procedures Internet Usage Policy Password Guidelines Microsoft PDF
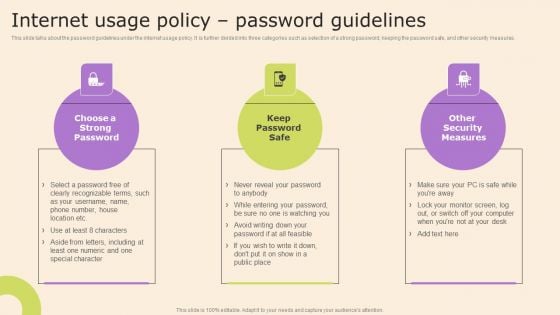
This slide talks about the password guidelines under the internet usage policy. It is further divided into three categories such as selection of a strong password, keeping the password safe, and other security measures. Explore a selection of the finest IT Policies And Procedures Internet Usage Policy Password Guidelines Microsoft PDF here. With a plethora of professionally designed and pre-made slide templates, you can quickly and easily find the right one for your upcoming presentation. You can use our IT Policies And Procedures Internet Usage Policy Password Guidelines Microsoft PDF to effectively convey your message to a wider audience. Slidegeeks has done a lot of research before preparing these presentation templates. The content can be personalized and the slides are highly editable. Grab templates today from Slidegeeks.
Information Technology Policy And Processes Internet Usage Policy Password Guidelines Mockup PDF
This slide talks about the password guidelines under the internet usage policy. It is further divided into three categories such as selection of a strong password, keeping the password safe, and other security measures. This Information Technology Policy And Processes Internet Usage Policy Password Guidelines Mockup PDF is perfect for any presentation, be it in front of clients or colleagues. It is a versatile and stylish solution for organizing your meetings. The Information Technology Policy And Processes Internet Usage Policy Password Guidelines Mockup PDF features a modern design for your presentation meetings. The adjustable and customizable slides provide unlimited possibilities for acing up your presentation. Slidegeeks has done all the homework before launching the product for you. So, do not wait, grab the presentation templates today
Optimization Of Water Usage Trends Influencing Water Industry Ppt Icon Design Ideas PDF
Presenting this set of slides with name optimization of water usage trends influencing water industry ppt icon design ideas pdf. The topics discussed in these slides are increasing regulation, failing infrastructure, enhanced monitoring and measurement, growth desalination, greater conservation and efficiency, water scarcity. This is a completely editable PowerPoint presentation and is available for immediate download. Download now and impress your audience.
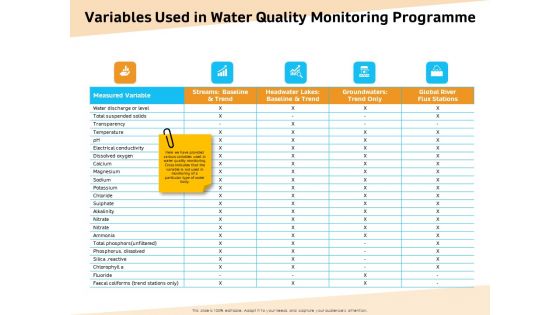
Optimization Of Water Usage Variables Used In Water Quality Monitoring Programme Ppt Summary Grid PDF
Presenting this set of slides with name optimization of water usage variables used in water quality monitoring programme ppt summary grid pdf. The topics discussed in these slides are measured variable, streams baseline and trend, headwater lakes baseline and trend, groundwaters trend only, global river flux stations. This is a completely editable PowerPoint presentation and is available for immediate download. Download now and impress your audience.
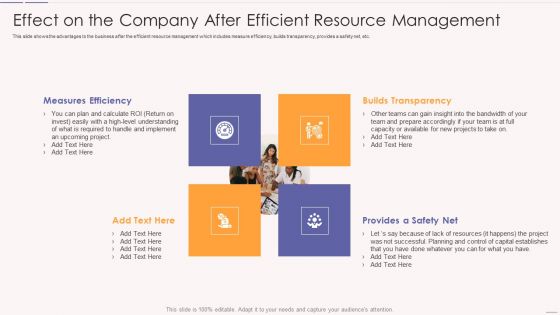
Asset Usage And Monitoring With Resource Management Plan Effect On The Company Microsoft PDF
This slide shows the advantages to the business after the efficient resource management which includes measure efficiency, builds transparency, provides a safety net, etc.This is a asset usage and monitoring with resource management plan effect on the company microsoft pdf template with various stages. Focus and dispense information on four stages using this creative set, that comes with editable features. It contains large content boxes to add your information on topics like measures efficiency, builds transparency, provides a safety net You can also showcase facts, figures, and other relevant content using this PPT layout. Grab it now.
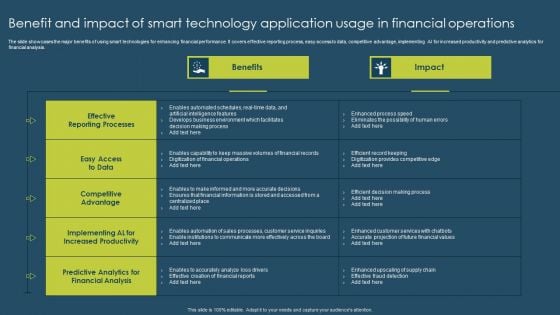
Benefit And Impact Of Smart Technology Application Usage In Financial Operations Summary PDF
The slide showcases the major benefits of using smart technologies for enhancing financial performance. It covers effective reporting process, easy access to data, competitive advantage, implementing AI for increased productivity and predictive analytics for financial analysis. Showcasing this set of slides titled Benefit And Impact Of Smart Technology Application Usage In Financial Operations Summary PDF. The topics addressed in these templates are Benefits, Impact. All the content presented in this PPT design is completely editable. Download it and make adjustments in color, background, font etc. as per your unique business setting.
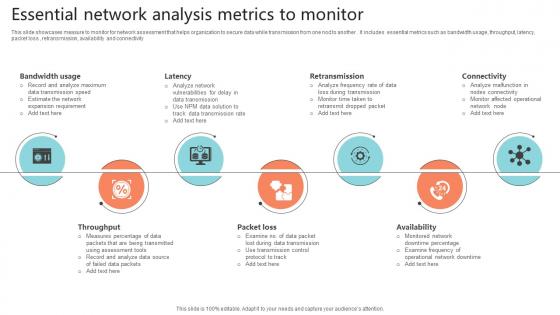
Essential Network Analysis Metrics To Monitor Portrait Pdf
This slide showcases measure to monitor for network assessment that helps organization to secure data while transmission from one nod to another . It includes essential metrics such as bandwidth usage, throughput, latency, packet loss , retransmission, availability and connectivity.Pitch your topic with ease and precision using this Essential Network Analysis Metrics To Monitor Portrait Pdf This layout presents information on Bandwidth Usage, Retransmission, Throughput It is also available for immediate download and adjustment. So, changes can be made in the color, design, graphics or any other component to create a unique layout. This slide showcases measure to monitor for network assessment that helps organization to secure data while transmission from one nod to another . It includes essential metrics such as bandwidth usage, throughput, latency, packet loss , retransmission, availability and connectivity
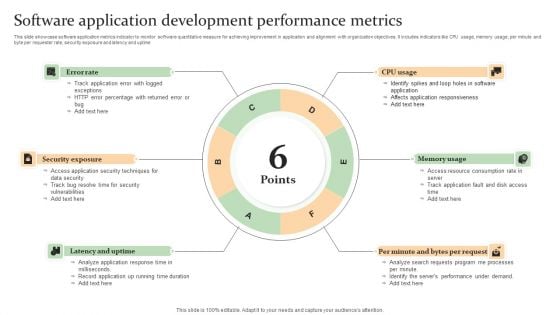
Software Application Development Performance Metrics Mockup PDF
This slide showcase software application metrics indicator to monitor software quantitative measure for achieving improvement in application and alignment with organization objectives. It includes indicators like CPU usage, memory usage, per minute and byte per requester rate, security exposure and latency and uptime Persuade your audience using this Software Application Development Performance Metrics Mockup PDF. This PPT design covers Six stages, thus making it a great tool to use. It also caters to a variety of topics including Latency And Uptime, Memory Usage, Security Exposure . Download this PPT design now to present a convincing pitch that not only emphasizes the topic but also showcases your presentation skills.
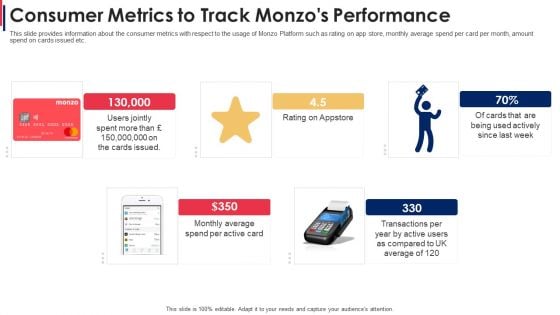
Consumer Metrics To Track Monzos Performance Formats PDF
This slide provides information about the consumer metrics with respect to the usage of Monzo Platform such as rating on app store, monthly average spend per card per month, amount spend on cards issued etc. This is a consumer metrics to track monzos performance formats pdf template with various stages. Focus and dispense information on five stages using this creative set, that comes with editable features. It contains large content boxes to add your information on topics like consumer metrics to track monzos performance. You can also showcase facts, figures, and other relevant content using this PPT layout. Grab it now.
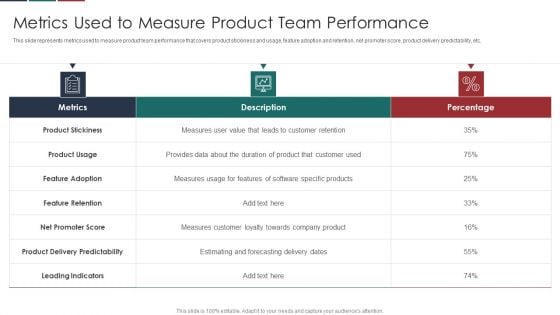
Deliver Efficiency Innovation Metrics Used To Measure Product Team Performance Designs PDF
This slide represents metrics used to measure product team performance that covers product stickiness and usage, feature adoption and retention, net promoter score, product delivery predictability, etc. Deliver an awe inspiring pitch with this creative Deliver Efficiency Innovation Metrics Used To Measure Product Team Performance Designs PDF bundle. Topics like Metrics, Percentage, Product Stickiness, Product Usage can be discussed with this completely editable template. It is available for immediate download depending on the needs and requirements of the user.
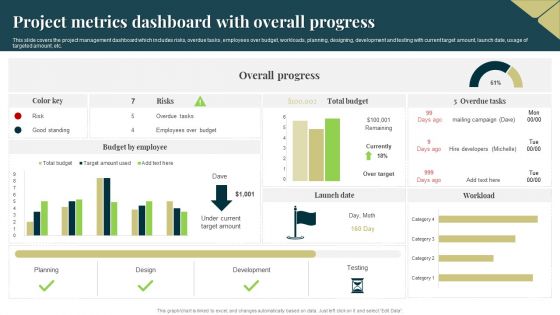
Project Metrics Dashboard With Overall Progress Brochure PDF
This slide covers the project management dashboard which includes risks, overdue tasks, employees over budget, workloads, planning, designing, development and testing with current target amount, launch date, usage of targeted amount, etc. Pitch your topic with ease and precision using this Project Metrics Dashboard With Overall Progress Brochure PDF. This layout presents information on Design, Planning, Development. It is also available for immediate download and adjustment. So, changes can be made in the color, design, graphics or any other component to create a unique layout.
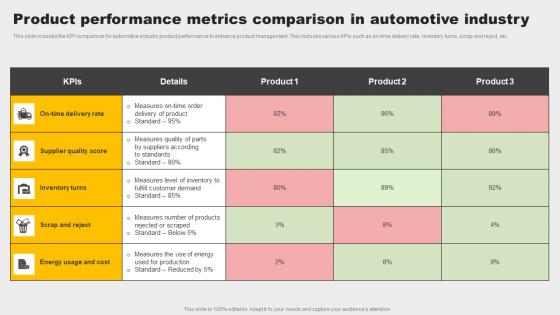
Product Performance Metrics Comparison In Automotive Industry Topics Pdf
This slide includes the KPI comparison for automotive industry product performance to enhance product management. This includes various KPIs such as on time delivery rate, inventory turns, scrap and reject, etc. Showcasing this set of slides titled Product Performance Metrics Comparison In Automotive Industry Topics Pdf. The topics addressed in these templates are Inventory Turns, Supplier Quality Score, Energy Usage And Cost. All the content presented in this PPT design is completely editable. Download it and make adjustments in color, background, font etc. as per your unique business setting. This slide includes the KPI comparison for automotive industry product performance to enhance product management. This includes various KPIs such as on time delivery rate, inventory turns, scrap and reject, etc.
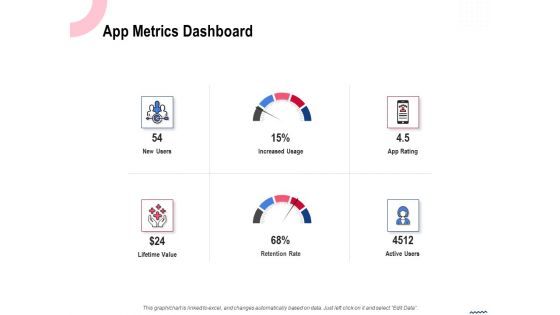
Wireless Phone Information Management Plan App Metrics Dashboard Themes PDF
Presenting this set of slides with name wireless phone information management plan app metrics dashboard themes pdf. The topics discussed in these slides are new users, lifetime value, retention rate, increased usage, app rating, active users. This is a completely editable PowerPoint presentation and is available for immediate download. Download now and impress your audience.
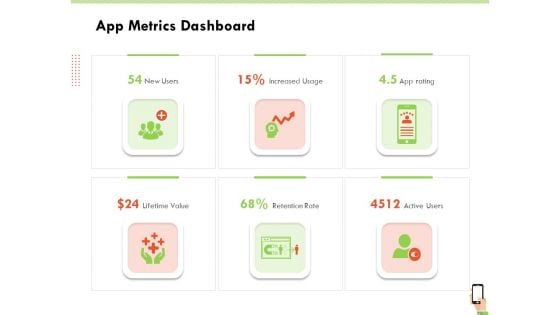
Multi Channel Online Commerce App Metrics Dashboard Sample PDF
This is a multi channel online commerce app metrics dashboard sample pdf template with various stages. Focus and dispense information on six stages using this creative set, that comes with editable features. It contains large content boxes to add your information on topics like lifetime value, active users, retention rate, increased usage. You can also showcase facts, figures, and other relevant content using this PPT layout. Grab it now.
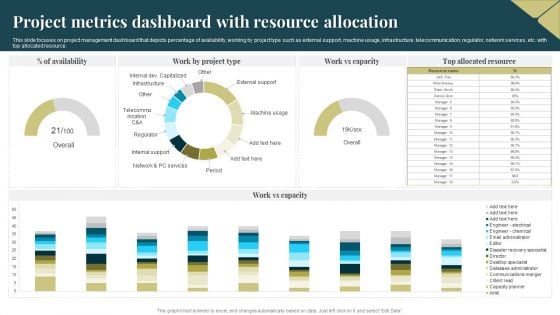
Project Metrics Dashboard With Resource Allocation Portrait PDF
This slide focuses on project management dashboard that depicts percentage of availability, working by project type such as external support, machine usage, infrastructure, telecommunication, regulator, network services, etc. with top allocated resource. Pitch your topic with ease and precision using this Project Metrics Dashboard With Resource Allocation Portrait PDF. This layout presents information on Project Metrics Dashboard, Resource Allocation. It is also available for immediate download and adjustment. So, changes can be made in the color, design, graphics or any other component to create a unique layout.
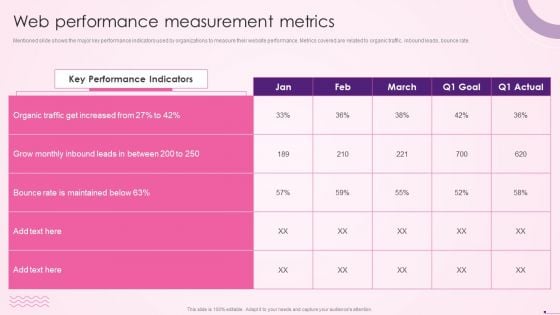
Web Performance Measurement Metrics Social Media Content Promotion Playbook Summary PDF
Mentioned slide highlights details about the different content formats along with their usage and best practices. Organizations can use these formats according to their needs.Welcome to our selection of the Web Performance Measurement Metrics Social Media Content Promotion Playbook Summary PDF. These are designed to help you showcase your creativity and bring your sphere to life. Planning and Innovation are essential for any business that is just starting out. This collection contains the designs that you need for your everyday presentations. All of our PowerPoints are 100precent editable, so you can customize them to suit your needs. This multipurpose template can be used in various situations. Grab these presentation templates today

Illustrating Product Leadership Plan Incorporating Innovative Techniques Metrics Used To Measure Summary PDF
This slide represents metrics used to measure product team performance that covers product stickiness and usage, feature adoption and retention, net promoter score, product delivery predictability, etc. This is a illustrating product leadership plan incorporating innovative techniques metrics used to measure summary pdf template with various stages. Focus and dispense information on three stages using this creative set, that comes with editable features. It contains large content boxes to add your information on topics like metrics, description, percentage. You can also showcase facts, figures, and other relevant content using this PPT layout. Grab it now.
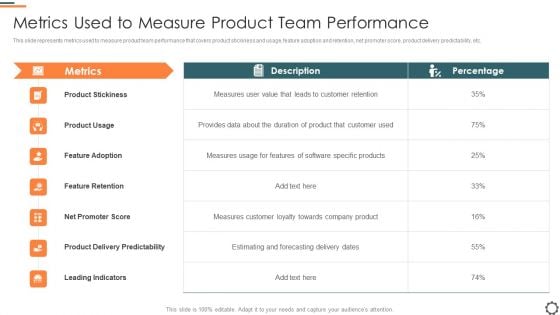
Agile Group For Product Development Metrics Used To Measure Product Team Performance Download PDF
This slide represents metrics used to measure product team performance that covers product stickiness and usage, feature adoption and retention, net promoter score, product delivery predictability, etc. Deliver and pitch your topic in the best possible manner with this agile group for product development metrics used to measure product team performance download pdf. Use them to share invaluable insights on leading indicators, product delivery predictability, product stickiness and impress your audience. This template can be altered and modified as per your expectations. So, grab it now.
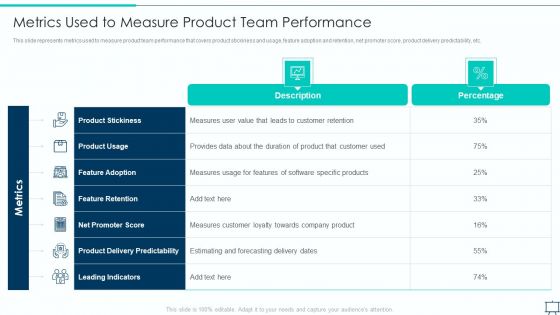
Formulating Competitive Plan Of Action For Effective Product Leadership Metrics Used To Measure Product Formats PDF
This slide represents metrics used to measure product team performance that covers product stickiness and usage, feature adoption and retention, net promoter score, product delivery predictability, etc. Deliver an awe inspiring pitch with this creative formulating competitive plan of action for effective product leadership metrics used to measure product formats pdf bundle. Topics like customer loyalty, software specific products, customer retention can be discussed with this completely editable template. It is available for immediate download depending on the needs and requirements of the user.
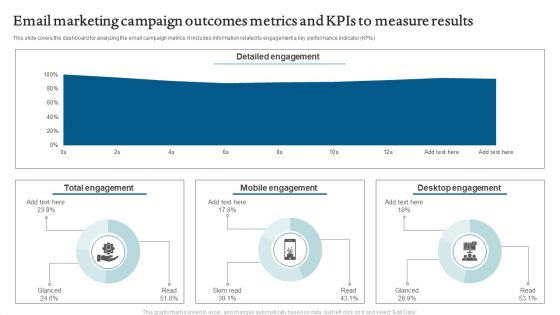
Email Marketing Campaign Outcomes Metrics And Kpis To Measure Results Rules PDF
This slide depicts the dashboard for analyzing the results of email campaign and social media marketing. It includes information related to the comparison, statistics, usage, etc. Showcasing this set of slides titled Email Marketing Campaign Outcomes Metrics And Kpis To Measure Results Rules PDF. The topics addressed in these templates are Detailed Engagement, Mobile Engagement, Desktop Engagement. All the content presented in this PPT design is completely editable. Download it and make adjustments in color, background, font etc. as per your unique business setting.
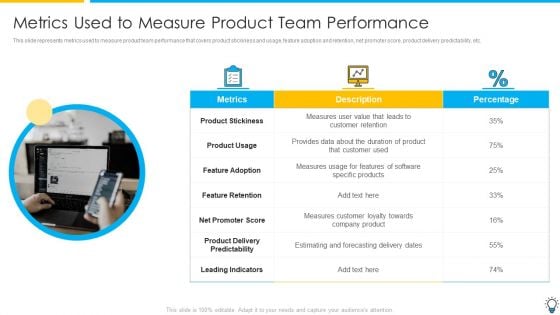
Assuring Management In Product Innovation To Enhance Processes Metrics Used To Measure Product Team Performance Structure PDF
This slide represents metrics used to measure product team performance that covers product stickiness and usage, feature adoption and retention, net promoter score, product delivery predictability, etc.This is a assuring management in product innovation to enhance processes metrics used to measure product team performance structure pdf template with various stages. Focus and dispense information on five stages using this creative set, that comes with editable features. It contains large content boxes to add your information on topics like product stickiness, feature adoption, leading indicators You can also showcase facts, figures, and other relevant content using this PPT layout. Grab it now.
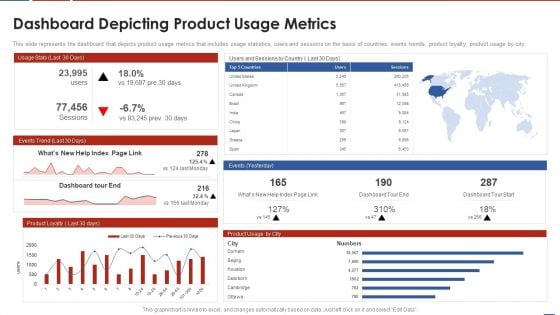
Formulating Product Development Action Plan To Enhance Client Experience Dashboard Depicting Product Download PDF
This slide represents the dashboard that depicts product usage metrics that includes usage statistics, users and sessions on the basis of countries, events trends, product loyalty, product usage by city. Deliver an awe inspiring pitch with this creative formulating product development action plan to enhance client experience dashboard depicting product download pdf bundle. Topics like usage statistics, users and sessions on the basis of countries, events trends, product loyalty, product usage by city can be discussed with this completely editable template. It is available for immediate download depending on the needs and requirements of the user.
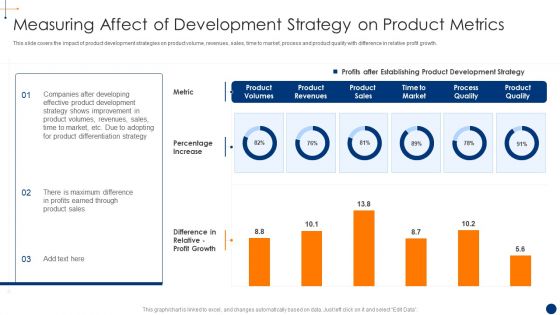
New Product Development Process Optimization Measuring Affect Of Development Professional PDF
This slide covers the impact of product development strategies on product volume, revenues, sales, time to market, process and product quality with difference in relative profit growth. Deliver and pitch your topic in the best possible manner with this new product development process optimization measuring affect of development professional pdf . Use them to share invaluable insights on dashboard depicting product usage metrics and impress your audience. This template can be altered and modified as per your expectations. So, grab it now.

New Product Development Process Optimization Impact Of Product Differentiation Infographics PDF
This slide covers impact of product differentiation strategy on customer experience by completing target and improving customer experience rate in twelve months Deliver an awe inspiring pitch with this creative new product development process optimization impact of product differentiation infographics pdf bundle. Topics like dashboard depicting product usage metrics can be discussed with this completely editable template. It is available for immediate download depending on the needs and requirements of the user.
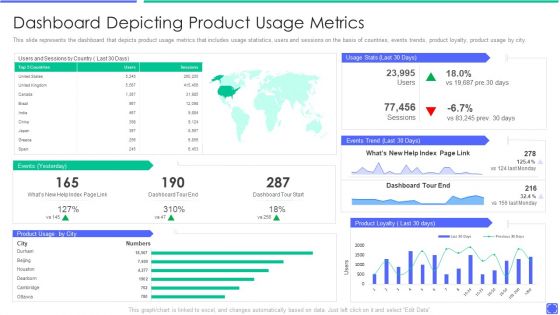
Best Techniques To Enhance New Product Management Efficiency Dashboard Depicting Product Rules PDF
This slide represents the dashboard that depicts product usage metrics that includes usage statistics, users and sessions on the basis of countries, events trends, product loyalty, product usage by city. Deliver and pitch your topic in the best possible manner with this best techniques to enhance new product management efficiency comparing product metrics themes pdf. Use them to share invaluable insights on costs associated with product development stages and impress your audience. This template can be altered and modified as per your expectations. So, grab it now.
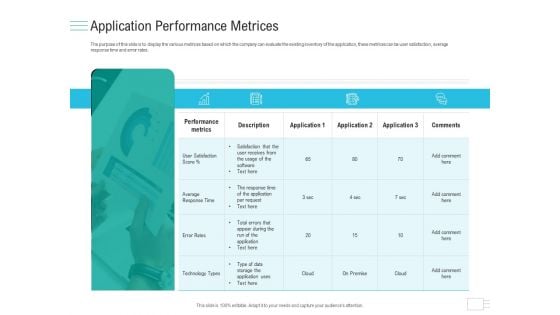
Business API Management Application Performance Metrices Brochure PDF
Deliver and pitch your topic in the best possible manner with this business API management application performance metrices brochure pdf. Use them to share invaluable insights on performance metrics, technology types, average response time, satisfaction that user receives from usage software and impress your audience. This template can be altered and modified as per your expectations. So, grab it now.
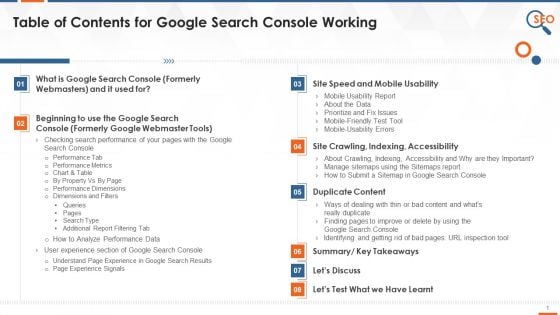
Table Of Contents For SEO Tool Google Search Console Training Ppt
This slide depicts the table of contents for the session google search console working. The topics included in the session are what is google search console and its usage to determine site speed, crawling, indexing, accessibility, and duplicate content.
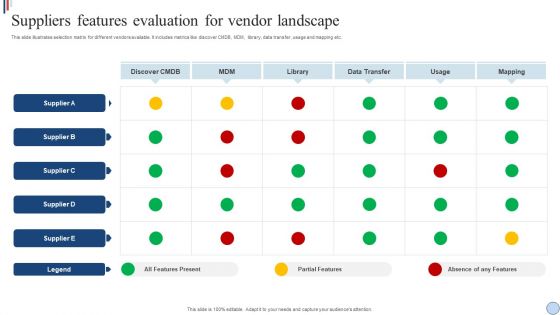
Suppliers Features Evaluation For Vendor Landscape Portrait PDF

Dashboard To Analyze City Ecological And Carbon Footprints Consumption Mockup PDF
This slide illustrates the dashboard to analyze ecological and carbon footprint of a city. The purpose of this template is to provide layout to analyze footprint data and define measures to protect environment. It includes metrics related to carbon emissions, usage of air, water and energy. Showcasing this set of slides titled Dashboard To Analyze City Ecological And Carbon Footprints Consumption Mockup PDF. The topics addressed in these templates are Installing Rooftop Photovoltaic, Using Mass Transport, Composting. All the content presented in this PPT design is completely editable. Download it and make adjustments in color, background, font etc. as per your unique business setting.
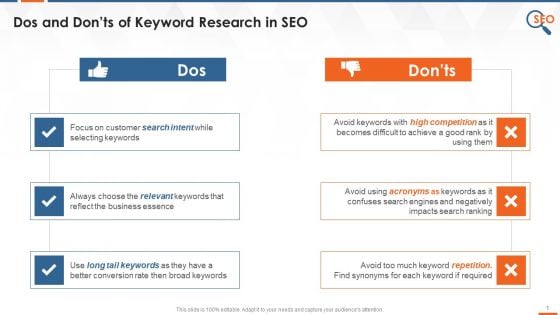
Keyword Research In SEO Dos And Donts Training Ppt
This slide lists down the multiple dos and donts of keyword research in SEO. The common dos are using long tail keywords, focusing on customer search intent while selecting keywords, etc., and donts are avoiding usage of acronyms and too much keyword repetition.
Customer Success KPIS Survey Results Icon Ppt PowerPoint Presentation Model Samples PDF
This slide covers SaaS customer success metrics challenge with data collection engines. It includes metrics such as product usage, customer surveys, customer demographics, customer purchase data and engagement data. Presenting Customer Success KPIS Survey Results Icon Ppt PowerPoint Presentation Model Samples PDF to dispense important information. This template comprises three stages. It also presents valuable insights into the topics including Customer Success, KPIs Survey Results Icon. This is a completely customizable PowerPoint theme that can be put to use immediately. So, download it and address the topic impactfully.
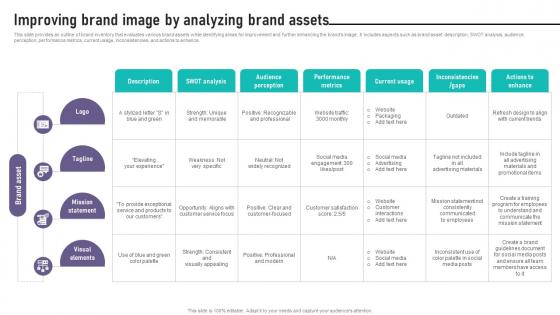
Brand Equity Management To Raise Recognition Improving Brand Image By Analyzing
This slide provides an outline of brand inventory that evaluates various brand assets while identifying areas for improvement and further enhancing the brands image. It includes aspects such as brand asset, description, SWOT analysis, audience perception, performance metrics, current usage, inconsistencies, and actions to enhance. Get a simple yet stunning designed Brand Equity Management To Raise Recognition Improving Brand Image By Analyzing. It is the best one to establish the tone in your meetings. It is an excellent way to make your presentations highly effective. So, download this PPT today from Slidegeeks and see the positive impacts. Our easy-to-edit Brand Equity Management To Raise Recognition Improving Brand Image By Analyzing can be your go-to option for all upcoming conferences and meetings. So, what are you waiting for Grab this template today. This slide provides an outline of brand inventory that evaluates various brand assets while identifying areas for improvement and further enhancing the brands image. It includes aspects such as brand asset, description, SWOT analysis, audience perception, performance metrics, current usage, inconsistencies, and actions to enhance.
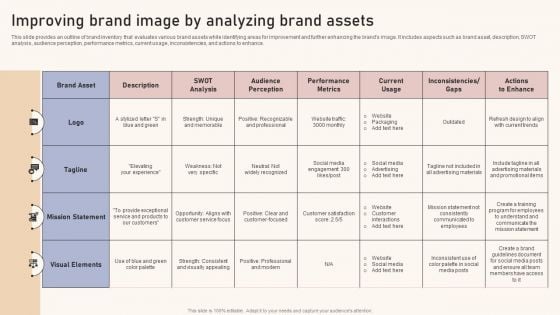
Optimizing Brand Equity Through Strategic Management Improving Brand Image By Analyzing Brand Assets Formats PDF
This slide provides an outline of brand inventory that evaluates various brand assets while identifying areas for improvement and further enhancing the brands image. It includes aspects such as brand asset, description, SWOT analysis, audience perception, performance metrics, current usage, inconsistencies, and actions to enhance. Welcome to our selection of the Optimizing Brand Equity Through Strategic Management Improving Brand Image By Analyzing Brand Assets Formats PDF. These are designed to help you showcase your creativity and bring your sphere to life. Planning and Innovation are essential for any business that is just starting out. This collection contains the designs that you need for your everyday presentations. All of our PowerPoints are 100 percent editable, so you can customize them to suit your needs. This multi-purpose template can be used in various situations. Grab these presentation templates today
Key Findings Of Consumer Intelligence Analytics Ppt PowerPoint Presentation Icon Model PDF
Following slide highlights consumer intelligence analytics findings that can be used by organization to understand individual customer needs and wants. Customer analytics findings include metrics such as customer name, tenure days, transaction usage, NPS, churn probability, churn prediction and required actions to be taken. Pitch your topic with ease and precision using this Key Findings Of Consumer Intelligence Analytics Ppt PowerPoint Presentation Icon Model PDF. This layout presents information on Customer, Tenure days, Transition Usage. It is also available for immediate download and adjustment. So, changes can be made in the color, design, graphics or any other component to create a unique layout.
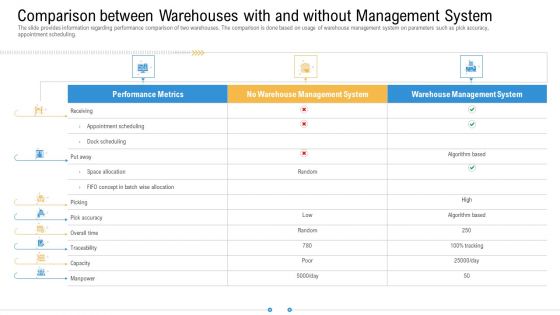
Comparison Between Warehouses With And Without Management System Structure PDF
The slide provides information regarding performance comparison of two warehouses. The comparison is done based on usage of warehouse management system on parameters such as pick accuracy, appointment scheduling. Deliver an awe inspiring pitch with this creative comparison between warehouses with and without management system structure pdf bundle. Topics like warehouse management system, performance metrics can be discussed with this completely editable template. It is available for immediate download depending on the needs and requirements of the user.


 Continue with Email

 Home
Home


