User Icons
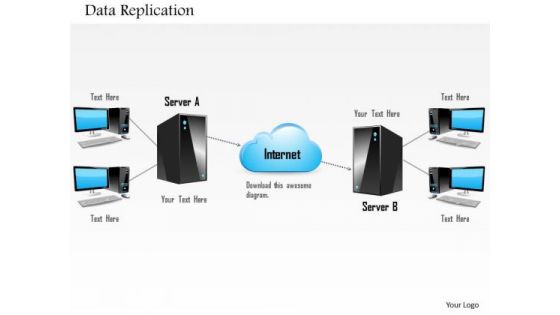
1 Data Replication From Primary To Replica Over Local Area Network Or Wide Are Network Ppt Slides
This image slide displays data replication. This image slide has been designed with graphic of cloud, two servers and clients over network. This image slide depicts process of data replication. Database replication can be used on many database management systems, usually with a master slave relationship between the original and the copies. The master logs the updates, which then pass through to the slaves. You may change size, color and orientation of any icon to your liking. Use this PowerPoint template, in your presentations to explain concept of data replication and cloud computing. This image slide will enhance the quality of your presentations.

Sustainable Workplace Development Focus On Three Pillars Of Sustainable Marketing Pictures Pdf
This slide covers three pillars of sustainable marketing which are environmental, social and economic impact of company operations. Environmental aspect includes green initiatives, social aspect includes health and safety of people and economic aspect includes employment generation. The Sustainable Workplace Development Focus On Three Pillars Of Sustainable Marketing Pictures Pdf is a compilation of the most recent design trends as a series of slides. It is suitable for any subject or industry presentation, containing attractive visuals and photo spots for businesses to clearly express their messages. This template contains a variety of slides for the user to input data, such as structures to contrast two elements, bullet points, and slides for written information. Slidegeeks is prepared to create an impression. This slide covers three pillars of sustainable marketing which are environmental, social and economic impact of company operations. Environmental aspect includes green initiatives, social aspect includes health and safety of people and economic aspect includes employment generation.
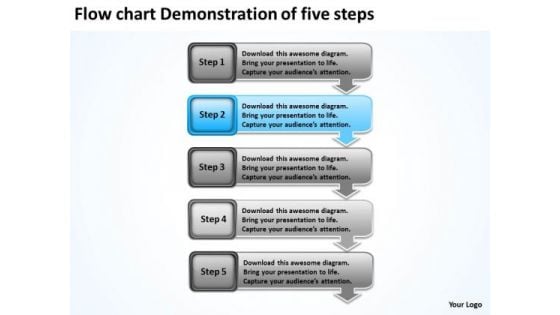
Flow Chart Demonstration Of Five Steps Gas Station Business Plan PowerPoint Templates
We present our flow chart demonstration of five steps gas station business plan PowerPoint templates.Download and present our Business PowerPoint Templates because the foundation stones of many a life. Download and present our Boxes PowerPoint Templates because the colour coding of our templates are specifically designed to highlight you points. Download and present our Arrows PowerPoint Templates because it transmits this clarity of purpose onto the eager minds of your team. Download and present our Process and Flows PowerPoint Templates because you should explain the process by which you intend to right it. Download our Shapes PowerPoint Templates because you are aware of some pitfalls ahead where you need to be cautious not to overrun and avoid a stall.Use these PowerPoint slides for presentations relating to Arrow, Background, Business, Chart, Diagram, Financial, Graphic, Gray, Icon, Illustration, Management, Orange, Perspective, Planning, Process, Stages, Steps, Text. The prominent colors used in the PowerPoint template are Blue light, Gray, Black. We assure you our flow chart demonstration of five steps gas station business plan PowerPoint templates are Tranquil. We assure you our Icon PowerPoint templates and PPT Slides are specially created by a professional team with vast experience. They diligently strive to come up with the right vehicle for your brilliant Ideas. Customers tell us our flow chart demonstration of five steps gas station business plan PowerPoint templates are Nice. Presenters tell us our Financial PowerPoint templates and PPT Slides are Swanky. You can be sure our flow chart demonstration of five steps gas station business plan PowerPoint templates are designed to make your presentations professional. The feedback we get is that our Icon PowerPoint templates and PPT Slides are Bright. Deliver fascinating presentations with our Flow Chart Demonstration Of Five Steps Gas Station Business Plan PowerPoint Templates. Dont waste time struggling with PowerPoint. Let us do it for you.
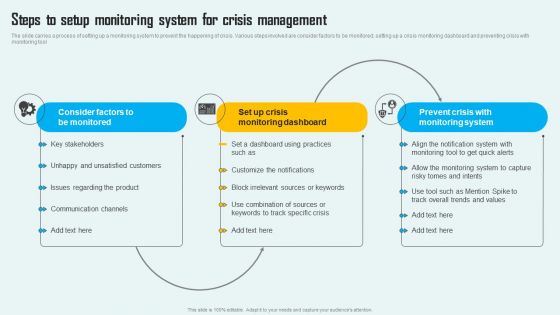
Key Phase Of Crisis Communication Management Plan Steps To Setup Monitoring System For Crisis Themes PDF
The slide carries a process of setting up a monitoring system to prevent the happening of crisis. Various steps involved are consider factors to be monitored, setting up a crisis monitoring dashboard and preventing crisis with monitoring tool The Key Phase Of Crisis Communication Management Plan Steps To Setup Monitoring System For Crisis Themes PDF is a compilation of the most recent design trends as a series of slides. It is suitable for any subject or industry presentation, containing attractive visuals and photo spots for businesses to clearly express their messages. This template contains a variety of slides for the user to input data, such as structures to contrast two elements, bullet points, and slides for written information. Slidegeeks is prepared to create an impression.
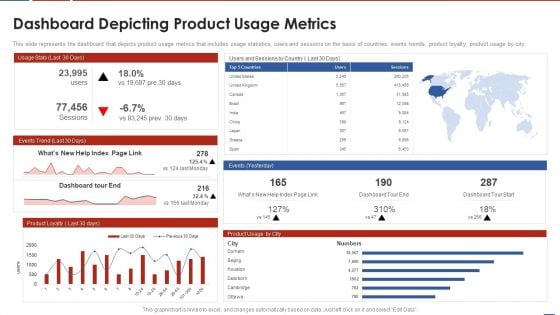
Formulating Product Development Action Plan To Enhance Client Experience Dashboard Depicting Product Download PDF
This slide represents the dashboard that depicts product usage metrics that includes usage statistics, users and sessions on the basis of countries, events trends, product loyalty, product usage by city. Deliver an awe inspiring pitch with this creative formulating product development action plan to enhance client experience dashboard depicting product download pdf bundle. Topics like usage statistics, users and sessions on the basis of countries, events trends, product loyalty, product usage by city can be discussed with this completely editable template. It is available for immediate download depending on the needs and requirements of the user.
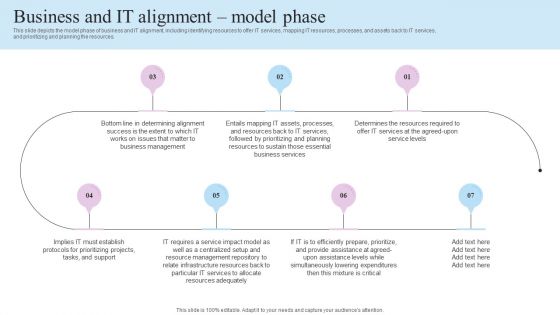
IT Business Alignment Framework Business And IT Alignment Model Phase Diagrams PDF
This slide depicts the model phase of business and IT alignment, including identifying resources to offer IT services, mapping IT resources, processes, and assets back to IT services, and prioritizing and planning the resources. The IT Business Alignment Framework Business And IT Alignment Model Phase Diagrams PDF is a compilation of the most recent design trends as a series of slides. It is suitable for any subject or industry presentation, containing attractive visuals and photo spots for businesses to clearly express their messages. This template contains a variety of slides for the user to input data, such as structures to contrast two elements, bullet points, and slides for written information. Slidegeeks is prepared to create an impression.
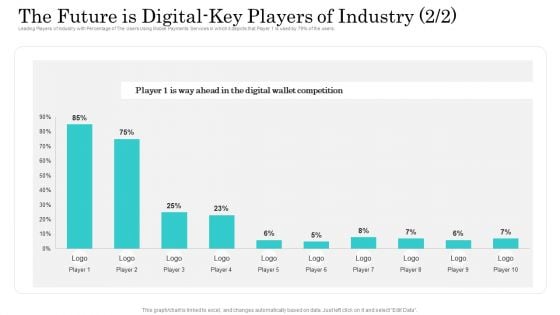
Online Payment Service The Future Is Digital Key Players Of Industry Ppt Show Clipart Images PDF
Leading Players of Industry with Percentage of The Users Using Mobile Payments Services in which it depicts that Player 1 is used by 79 percent of the users. Deliver an awe-inspiring pitch with this creative online payment service the future is digital key players of industry ppt show clipart images pdf bundle. Topics like the future is digital key players of industry can be discussed with this completely editable template. It is available for immediate download depending on the needs and requirements of the user.
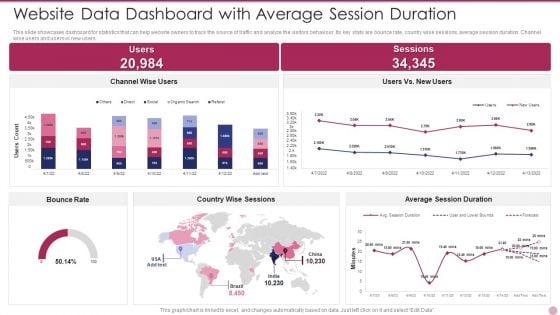
Website Data Dashboard With Average Session Duration Ideas PDF
This slide showcases dashboard for statistics that can help website owners to track the source of traffic and analyze the visitors behaviour. Its key stats are bounce rate, country wise sessions, average session duration. Channel wise users and users vs new users. Pitch your topic with ease and precision using this Website Data Dashboard With Average Session Duration Ideas PDF. This layout presents information on Website Data Dashboard With Average Session Duration. It is also available for immediate download and adjustment. So, changes can be made in the color, design, graphics or any other component to create a unique layout.
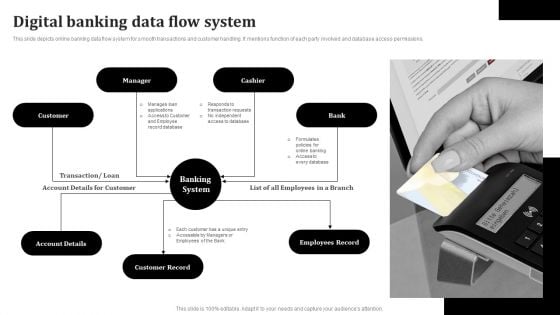
Digital Banking Data Flow System Template PDF
This slide depicts online banking data flow system for smooth transactions and customer handling. It mentions function of each party involved and database access permissions. Persuade your audience using this Digital Banking For Financial Management Icon Information PDF. This PPT design covers Seven stages, thus making it a great tool to use. It also caters to a variety of topics including Manager, Cashier, Banking System, Employees Record. Download this PPT design now to present a convincing pitch that not only emphasizes the topic but also showcases your presentation skills.
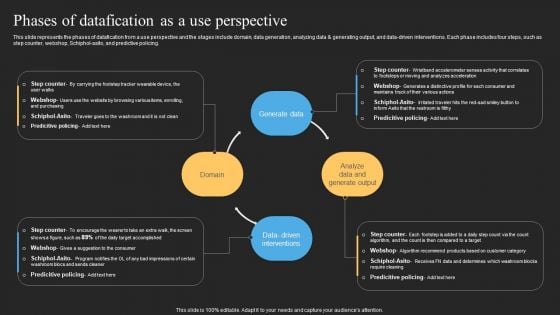
Datafy Phases Of Datafication As A Use Perspective Ideas PDF
This slide represents the phases of datafication from a use perspective and the stages include domain, data generation, analyzing data and generating output, and data-driven interventions. Each phase includes four steps, such as step counter, webshop, Schiphol-asito, and predictive policing. The Datafy Phases Of Datafication As A Use Perspective Ideas PDF is a compilation of the most recent design trends as a series of slides. It is suitable for any subject or industry presentation, containing attractive visuals and photo spots for businesses to clearly express their messages. This template contains a variety of slides for the user to input data, such as structures to contrast two elements, bullet points, and slides for written information. Slidegeeks is prepared to create an impression.
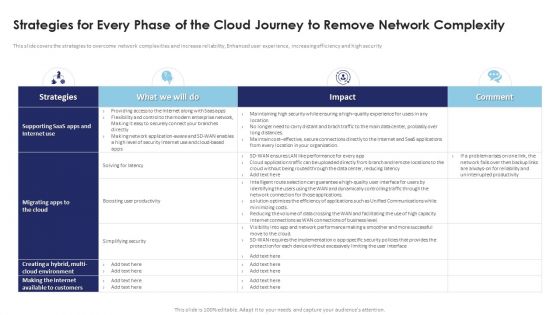
Multi Cloud Infrastructure Management Strategies For Every Phase Of The Cloud Journey Sample PDF
This slide covers the strategies to overcome network complexities and increase reliability, Enhanced user experience, increasing efficiency and high security. Retrieve professionally designed Multi Cloud Infrastructure Management Strategies For Every Phase Of The Cloud Journey Sample PDF to effectively convey your message and captivate your listeners. Save time by selecting pre-made slideshows that are appropriate for various topics, from business to educational purposes. These themes come in many different styles, from creative to corporate, and all of them are easily adjustable and can be edited quickly. Access them as PowerPoint templates or as Google Slides themes. You dont have to go on a hunt for the perfect presentation because Slidegeeks got you covered from everywhere.
Cloud Based Computing Analysis Strategies For Every Phase Of The Cloud Journey Clipart PDF
This slide covers the strategies to overcome network complexities and increase reliability, enhanced user experience, increasing efficiency and high security. Do you know about Slidesgeeks Cloud Based Computing Analysis Strategies For Every Phase Of The Cloud Journey Clipart PDF These are perfect for delivering any kind od presentation. Using it, create PowerPoint presentations that communicate your ideas and engage audiences. Save time and effort by using our pre-designed presentation templates that are perfect for a wide range of topic. Our vast selection of designs covers a range of styles, from creative to business, and are all highly customizable and easy to edit. Download as a PowerPoint template or use them as Google Slides themes.
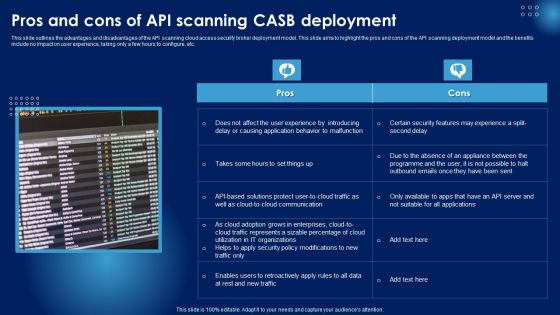
Pros And Cons Of API Scanning CASB Deployment Ppt PowerPoint Presentation Diagram Graph Charts PDF
This slide outlines the advantages and disadvantages of the API scanning cloud access security broker deployment model. This slide aims to highlight the pros and cons of the API scanning deployment model and the benefits include no impact on user experience, taking only a few hours to configure, etc. Whether you have daily or monthly meetings, a brilliant presentation is necessary. Pros And Cons Of API Scanning CASB Deployment Ppt PowerPoint Presentation Diagram Graph Charts PDF can be your best option for delivering a presentation. Represent everything in detail using Pros And Cons Of API Scanning CASB Deployment Ppt PowerPoint Presentation Diagram Graph Charts PDF and make yourself stand out in meetings. The template is versatile and follows a structure that will cater to your requirements. All the templates prepared by Slidegeeks are easy to download and edit. Our research experts have taken care of the corporate themes as well. So, give it a try and see the results.
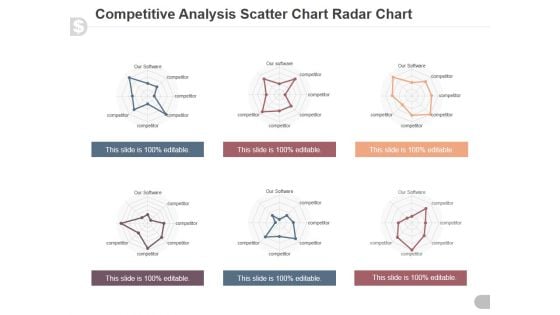
Competitive Analysis Scatter Chart Radar Chart Ppt PowerPoint Presentation Model
This is a competitive analysis scatter chart radar chart ppt powerpoint presentation model. This is a eight stage process. The stages in this process are users interface, data import, example, pricing, support, update, tutorials, easy to use.
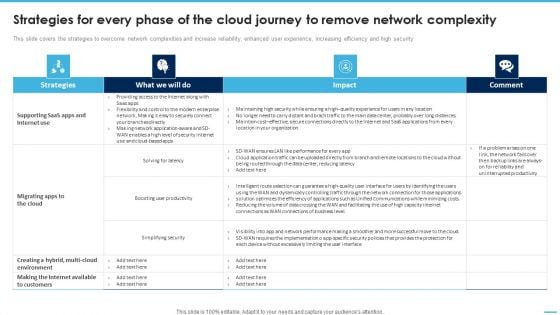
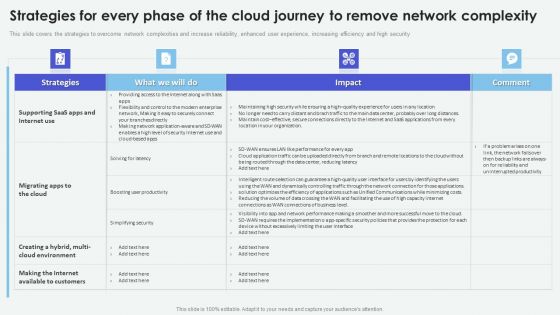
Strategies For Every Phase Of The Cloud Journey To Remove Network Complexity Formats PDF
This slide covers the strategies to overcome network complexities and increase reliability, enhanced user experience, increasing efficiency and high security.Formulating a presentation can take up a lot of effort and time, so the content and message should always be the primary focus. The visuals of the PowerPoint can enhance the presenters message, so our Strategies For Every Phase Of The Cloud Journey To Remove Network Complexity Formats PDF was created to help save time. Instead of worrying about the design, the presenter can concentrate on the message while our designers work on creating the ideal templates for whatever situation is needed. Slidegeeks has experts for everything from amazing designs to valuable content, we have put everything into Strategies For Every Phase Of The Cloud Journey To Remove Network Complexity Formats PDF.
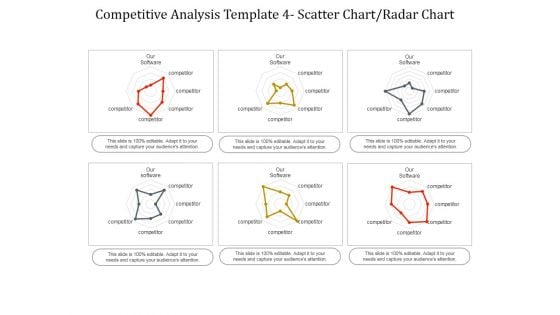
Competitive Analysis Scatter Chart Radar Chart Ppt PowerPoint Presentation Infographics
This is a competitive analysis scatter chart radar chart ppt powerpoint presentation infographics. This is a eight stage process. The stages in this process are users interface, data import, example, pricing, support, update, tutorials, easy to use.
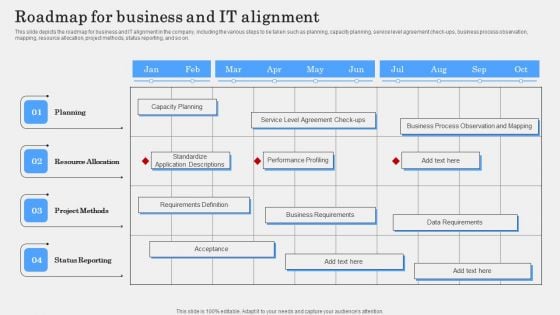
IT Alignment Phases In Business Roadmap For Business And IT Alignment Template PDF
This slide depicts the roadmap for business and IT alignment in the company, including the various steps to be taken such as planning, capacity planning, service level agreement check ups, business process observation, mapping, resource allocation, project methods, status reporting, and so on. The IT Alignment Phases In Business Roadmap For Business And IT Alignment Template PDF is a compilation of the most recent design trends as a series of slides. It is suitable for any subject or industry presentation, containing attractive visuals and photo spots for businesses to clearly express their messages. This template contains a variety of slides for the user to input data, such as structures to contrast two elements, bullet points, and slides for written information. Slidegeeks is prepared to create an impression.
Tracking Progress Of Project Management Tasks Ppt PowerPoint Presentation Diagram Graph Charts PDF
The following slide illustrates task management tool for tracking project status. It provides information about requirements, coding, development, knowledge, user acceptance testing, standup meeting, etc. Welcome to our selection of the Tracking Progress Of Project Management Tasks Ppt PowerPoint Presentation Diagram Graph Charts PDF. These are designed to help you showcase your creativity and bring your sphere to life. Planning and Innovation are essential for any business that is just starting out. This collection contains the designs that you need for your everyday presentations. All of our PowerPoints are 100 percent editable, so you can customize them to suit your needs. This multi purpose template can be used in various situations. Grab these presentation templates today.
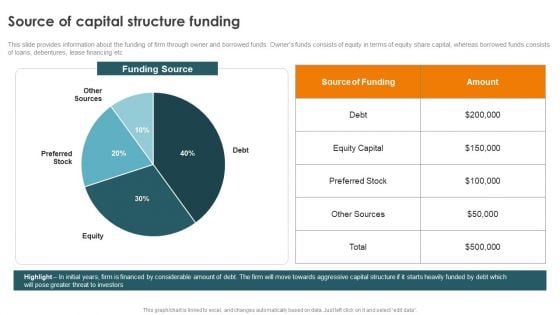
Profitability Modelling Framework Source Of Capital Structure Funding Themes PDF
This slide provides information about the funding of firm through owner and borrowed funds. Owners funds consists of equity in terms of equity share capital, whereas borrowed funds consists of loans, debentures, lease financing etc. The Profitability Modelling Framework Source Of Capital Structure Funding Themes PDF is a compilation of the most recent design trends as a series of slides. It is suitable for any subject or industry presentation, containing attractive visuals and photo spots for businesses to clearly express their messages. This template contains a variety of slides for the user to input data, such as structures to contrast two elements, bullet points, and slides for written information. Slidegeeks is prepared to create an impression.
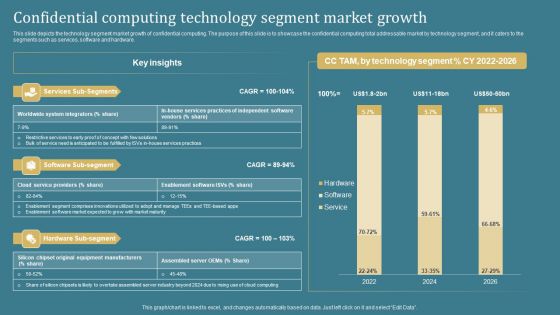
Confidential Computing System Technology Confidential Computing Technology Segment Themes PDF
This slide depicts the technology segment market growth of confidential computing. The purpose of this slide is to showcase the confidential computing total addressable market by technology segment, and it caters to the segments such as services, software and hardware. The Confidential Computing System Technology Confidential Computing Technology Segment Themes PDF is a compilation of the most recent design trends as a series of slides. It is suitable for any subject or industry presentation, containing attractive visuals and photo spots for businesses to clearly express their messages. This template contains a variety of slides for the user to input data, such as structures to contrast two elements, bullet points, and slides for written information. Slidegeeks is prepared to create an impression.
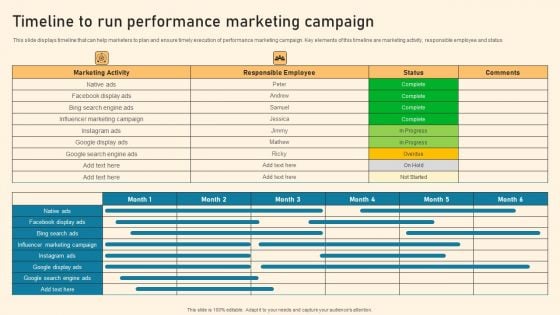
Timeline To Run Performance Marketing Campaign Ppt PowerPoint Presentation Diagram Graph Charts PDF
This slide displays timeline that can help marketers to plan and ensure timely execution of performance marketing campaign. Key elements of this timeline are marketing activity, responsible employee and status The Timeline To Run Performance Marketing Campaign Ppt PowerPoint Presentation Diagram Graph Charts PDF is a compilation of the most recent design trends as a series of slides. It is suitable for any subject or industry presentation, containing attractive visuals and photo spots for businesses to clearly express their messages. This template contains a variety of slides for the user to input data, such as structures to contrast two elements, bullet points, and slides for written information. Slidegeeks is prepared to create an impression.
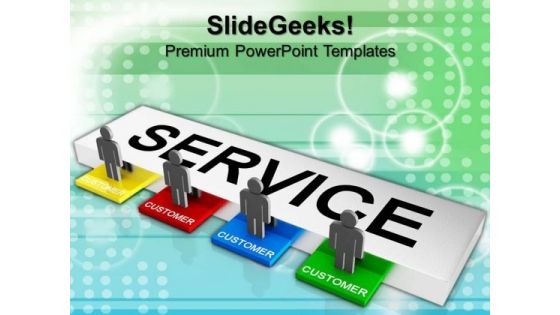
Customer Service Concept Computer PowerPoint Templates And PowerPoint Themes 1012
Customer Service Concept Computer PowerPoint Templates And PowerPoint Themes 1012-Develop competitive advantage with our above template which contains a diagram of customer service concept. Adjust the above image in your PPT presentations to visually support your content in your Communication and Marketing PPT slideshows support services, user support, telephone companies, call centers, inquiry service PPT presentations. The vision of being the market leader is clear to you. Transmit your thoughts via our slides and prod your team to action.-Customer Service Concept Computer PowerPoint Templates And PowerPoint Themes 1012-This PowerPoint template can be used for presentations relating to-Customer service concept, business, communication, marketing, teamwork, services Do the right thing with our Customer Service Concept Computer PowerPoint Templates And PowerPoint Themes 1012. They promote an ethical approach.
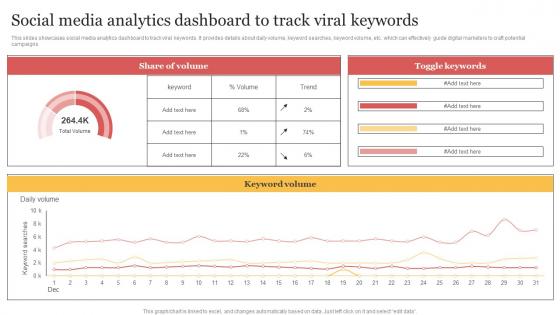
Social Media Analytics Dashboard To Track Viral Keywords Organizing Buzzworthy Social Themes Pdf
This slides showcases social media analytics dashboard to track viral keywords. It provides details about daily volume, keyword searches, keyword volume, etc. which can effectively guide digital marketers to craft potential campaigns. The Social Media Analytics Dashboard To Track Viral Keywords Organizing Buzzworthy Social Themes Pdf is a compilation of the most recent design trends as a series of slides. It is suitable for any subject or industry presentation, containing attractive visuals and photo spots for businesses to clearly express their messages. This template contains a variety of slides for the user to input data, such as structures to contrast two elements, bullet points, and slides for written information. Slidegeeks is prepared to create an impression. This slides showcases social media analytics dashboard to track viral keywords. It provides details about daily volume, keyword searches, keyword volume, etc. which can effectively guide digital marketers to craft potential campaigns.
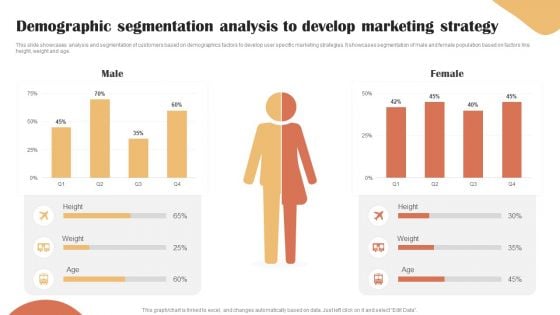
Categories Of Segmenting And Profiling Customers Demographic Segmentation Analysis To Develop Themes PDF
This slide showcases analysis and segmentation of customers based on demographics factors to develop user specific marketing strategies. It showcases segmentation of male and female population based on factors like height, weight and age. Crafting an eye catching presentation has never been more straightforward. Let your presentation shine with this tasteful yet straightforward Categories Of Segmenting And Profiling Customers Demographic Segmentation Analysis To Develop Themes PDF template. It offers a minimalistic and classy look that is great for making a statement. The colors have been employed intelligently to add a bit of playfulness while still remaining professional. Construct the ideal Categories Of Segmenting And Profiling Customers Demographic Segmentation Analysis To Develop Themes PDF that effortlessly grabs the attention of your audience. Begin now and be certain to wow your customers.
Dashboard For Tracking Customer Service Team Performance Consumer Contact Point Guide Diagrams PDF
This slide covers the KPI dashboard for analyzing the performance of client support department. It includes metrics such as first call resolution, unresolved calls, average response rate, the best day to call, average time to solve issues, etc. The Dashboard For Tracking Customer Service Team Performance Consumer Contact Point Guide Diagrams PDF is a compilation of the most recent design trends as a series of slides. It is suitable for any subject or industry presentation, containing attractive visuals and photo spots for businesses to clearly express their messages. This template contains a variety of slides for the user to input data, such as structures to contrast two elements, bullet points, and slides for written information. Slidegeeks is prepared to create an impression.
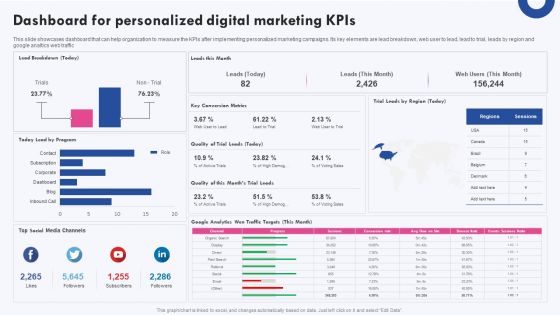
Targeted Marketing Campaigns To Improve Buyers Experience Dashboard For Personalized Digital Marketing Kpis Diagrams PDF
This slide showcases dashboard that can help organization to measure the KPIs after implementing personalized marketing campaigns. Its key elements are lead breakdown, web user to lead, lead to trial, leads by region and google analtics web traffic If you are looking for a format to display your unique thoughts, then the professionally designed Targeted Marketing Campaigns To Improve Buyers Experience Dashboard For Personalized Digital Marketing Kpis Diagrams PDF is the one for you. You can use it as a Google Slides template or a PowerPoint template. Incorporate impressive visuals, symbols, images, and other charts. Modify or reorganize the text boxes as you desire. Experiment with shade schemes and font pairings. Alter, share or cooperate with other people on your work. Download Targeted Marketing Campaigns To Improve Buyers Experience Dashboard For Personalized Digital Marketing Kpis Diagrams PDF and find out how to give a successful presentation. Present a perfect display to your team and make your presentation unforgettable.
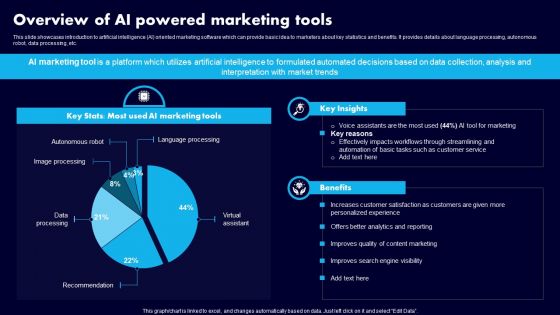
Overview Of AI Powered Marketing Tools Ppt Outline Diagrams PDF
This slide showcases introduction to artificial intelligence AI oriented marketing software which can provide basic idea to marketers about key statistics and benefits. It provides details about language processing, autonomous robot, data processing, etc. The Overview Of AI Powered Marketing Tools Ppt Outline Diagrams PDF is a compilation of the most recent design trends as a series of slides. It is suitable for any subject or industry presentation, containing attractive visuals and photo spots for businesses to clearly express their messages. This template contains a variety of slides for the user to input data, such as structures to contrast two elements, bullet points, and slides for written information. Slidegeeks is prepared to create an impression.
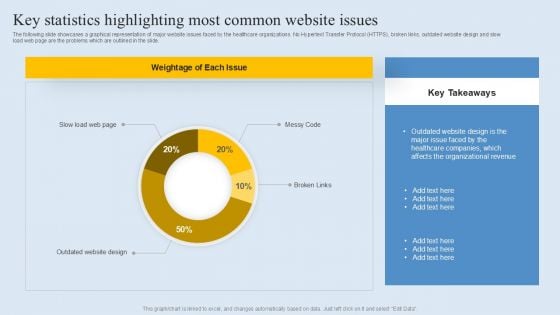
Key Statistics Highlighting Most Common Website Issues Diagrams PDF
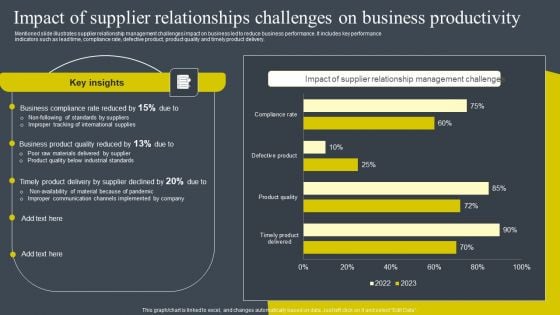
Impact Of Supplier Relationships Challenges On Business Productivity Diagrams PDF
Mentioned slide illustrates supplier relationship management challenges impact on business led to reduce business performance. It includes key performance indicators such as lead time, compliance rate, defective product, product quality and timely product delivery. The Impact Of Supplier Relationships Challenges On Business Productivity Diagrams PDF is a compilation of the most recent design trends as a series of slides. It is suitable for any subject or industry presentation, containing attractive visuals and photo spots for businesses to clearly express their messages. This template contains a variety of slides for the user to input data, such as structures to contrast two elements, bullet points, and slides for written information. Slidegeeks is prepared to create an impression.
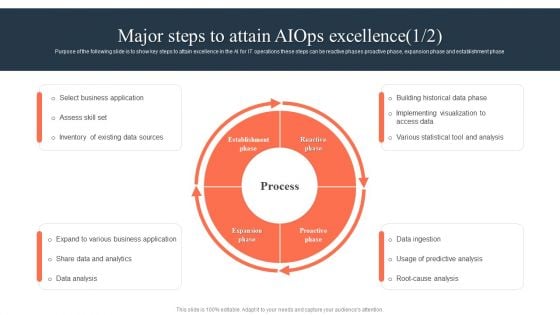
Ml And Big Data In Information Technology Processes Major Steps To Attain Aiops Excellence Summary PDF
Purpose of the following slide is to show key steps to attain excellence in the AI for IT operations these steps can be reactive phases proactive phase, expansion phase and establishment phase The Ml And Big Data In Information Technology Processes Major Steps To Attain Aiops Excellence Summary PDF is a compilation of the most recent design trends as a series of slides. It is suitable for any subject or industry presentation, containing attractive visuals and photo spots for businesses to clearly express their messages. This template contains a variety of slides for the user to input data, such as structures to contrast two elements, bullet points, and slides for written information. Slidegeeks is prepared to create an impression.
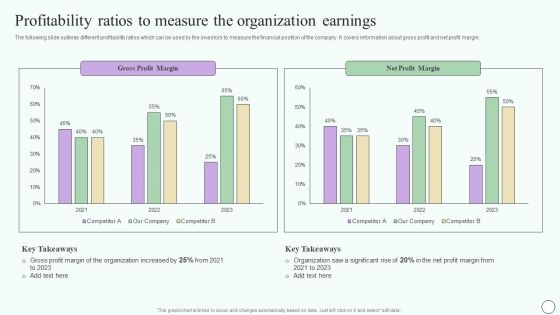
Estimating Business Overall Profitability Ratios To Measure The Organization Earnings Themes PDF
The following slide outlines different profitability ratios which can be used by the investors to measure the financial position of the company. It covers information about gross profit and net profit margin. The Estimating Business Overall Profitability Ratios To Measure The Organization Earnings Themes PDF is a compilation of the most recent design trends as a series of slides. It is suitable for any subject or industry presentation, containing attractive visuals and photo spots for businesses to clearly express their messages. This template contains a variety of slides for the user to input data, such as structures to contrast two elements, bullet points, and slides for written information. Slidegeeks is prepared to create an impression.
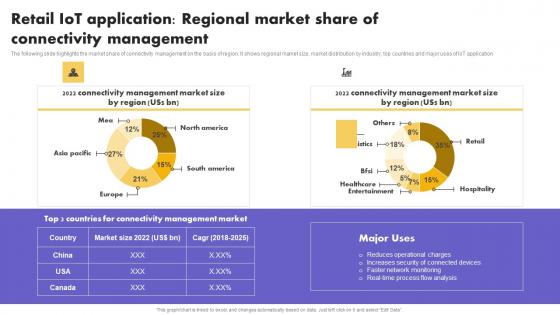
IoT Application In Global Retail IoT Application Regional Market Share Diagrams Pdf
The following slide highlights the market share of connectivity management on the basis of region. It shows regional market size, market distribution by industry, top countries and major uses of IoT application.The IoT Application In Global Retail IoT Application Regional Market Share Diagrams Pdf is a compilation of the most recent design trends as a series of slides. It is suitable for any subject or industry presentation, containing attractive visuals and photo spots for businesses to clearly express their messages. This template contains a variety of slides for the user to input data, such as structures to contrast two elements, bullet points, and slides for written information. Slidegeeks is prepared to create an impression. The following slide highlights the market share of connectivity management on the basis of region. It shows regional market size, market distribution by industry, top countries and major uses of IoT application
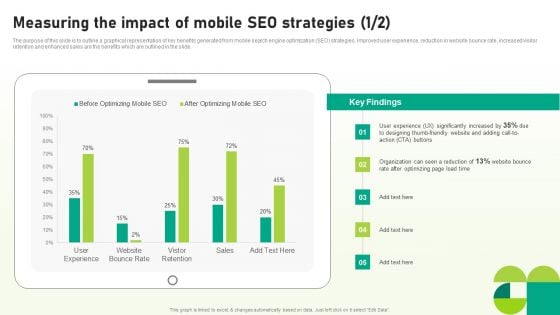
Utilizing SEO To Boost Customer Measuring The Impact Of Mobile SEO Strategies Diagrams PDF
The purpose of this slide is to outline a graphical representation of key benefits generated from mobile search engine optimization SEO strategies. Improved user experience, reduction in website bounce rate, increased visitor retention and enhanced sales are the benefits which are outlined in the slide. Explore a selection of the finest Utilizing SEO To Boost Customer Measuring The Impact Of Mobile SEO Strategies Diagrams PDF here. With a plethora of professionally designed and pre-made slide templates, you can quickly and easily find the right one for your upcoming presentation. You can use our Utilizing SEO To Boost Customer Measuring The Impact Of Mobile SEO Strategies Diagrams PDF to effectively convey your message to a wider audience. Slidegeeks has done a lot of research before preparing these presentation templates. The content can be personalized and the slides are highly editable. Grab templates today from Slidegeeks.
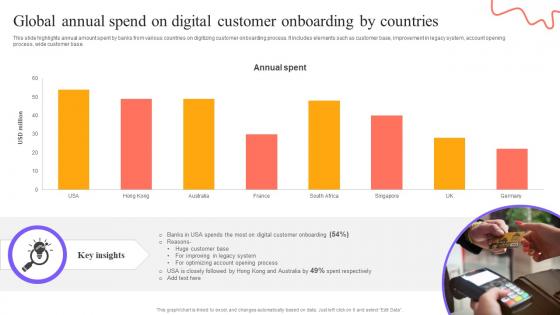
Digital Approach To Client Global Annual Spend On Digital Customer Onboarding
This slide highlights annual amount spent by banks from various countries on digitizing customer onboarding process. It includes elements such as customer base, improvement in legacy system, account opening process, wide customer base. The Digital Approach To Client Global Annual Spend On Digital Customer Onboarding is a compilation of the most recent design trends as a series of slides. It is suitable for any subject or industry presentation, containing attractive visuals and photo spots for businesses to clearly express their messages. This template contains a variety of slides for the user to input data, such as structures to contrast two elements, bullet points, and slides for written information. Slidegeeks is prepared to create an impression. This slide highlights annual amount spent by banks from various countries on digitizing customer onboarding process. It includes elements such as customer base, improvement in legacy system, account opening process, wide customer base.
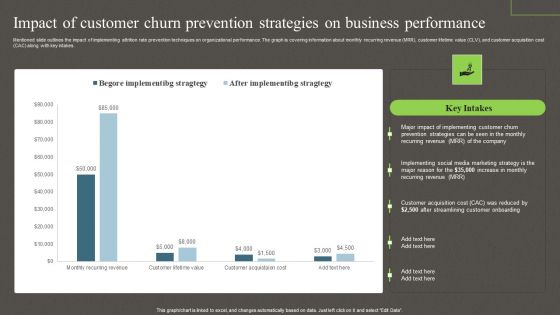
Impact Of Customer Churn Prevention Strategies On Business Performance Ppt PowerPoint Presentation Diagram Images PDF
Mentioned slide outlines the impact of implementing attrition rate prevention techniques on organizational performance. The graph is covering information about monthly recurring revenue MRR, customer lifetime value CLV, and customer acquisition cost CAC along with key intakes. The Impact Of Customer Churn Prevention Strategies On Business Performance Ppt PowerPoint Presentation Diagram Images PDF is a compilation of the most recent design trends as a series of slides. It is suitable for any subject or industry presentation, containing attractive visuals and photo spots for businesses to clearly express their messages. This template contains a variety of slides for the user to input data, such as structures to contrast two elements, bullet points, and slides for written information. Slidegeeks is prepared to create an impression.
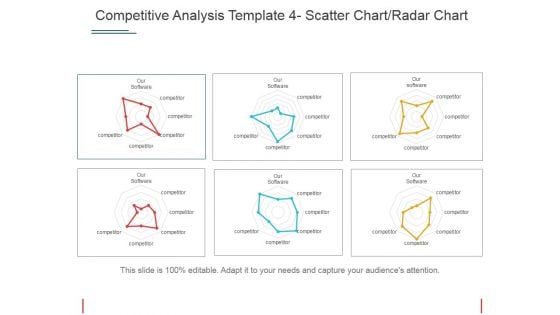
Competitive Analysis Scatter Chart Radar Chart Ppt PowerPoint Presentation Portfolio Templates
This is a competitive analysis scatter chart radar chart ppt powerpoint presentation portfolio templates. This is a eight stage process. The stages in this process are users interface, data import, example, pricing, support.
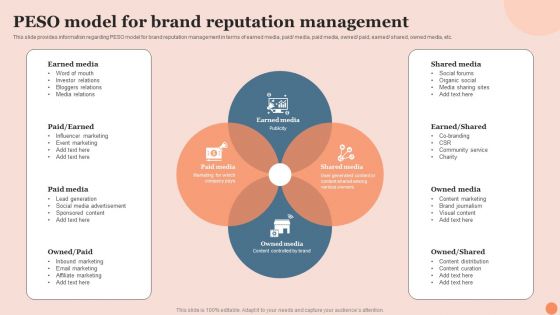
Techniques To Elevate Brand Visibility PESO Model For Brand Reputation Management Demonstration PDF
This slide provides information regarding PESO model for brand reputation management in terms of earned media, paid or media, paid media, owned or paid, earned or shared, owned media, etc. The Techniques To Elevate Brand Visibility PESO Model For Brand Reputation Management Demonstration PDF is a compilation of the most recent design trends as a series of slides. It is suitable for any subject or industry presentation, containing attractive visuals and photo spots for businesses to clearly express their messages. This template contains a variety of slides for the user to input data, such as structures to contrast two elements, bullet points, and slides for written information. Slidegeeks is prepared to create an impression.

Performance Indicators For Successful Client Onboarding Themes PDF
This slide showcases KPIs that showcases success of user onboarding. Major KPIs included are customer engagement, retention and count, average response time, completion and free trial conversion rate. If you are looking for a format to display your unique thoughts, then the professionally designed Performance Indicators For Successful Client Onboarding Themes PDF is the one for you. You can use it as a Google Slides template or a PowerPoint template. Incorporate impressive visuals, symbols, images, and other charts. Modify or reorganize the text boxes as you desire. Experiment with shade schemes and font pairings. Alter, share or cooperate with other people on your work. Download Performance Indicators For Successful Client Onboarding Themes PDF and find out how to give a successful presentation. Present a perfect display to your team and make your presentation unforgettable.
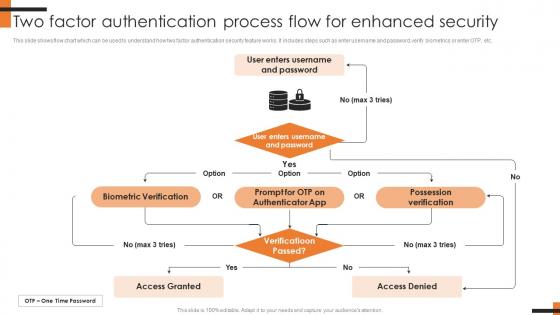
Two Factor Authentication Process Flow For Comprehensive Smartphone Banking Diagrams Pdf
This slide shows flow chart which can be used to understand how two factor authentication security feature works. It includes steps such as enter username and password, verify biometrics or enter OTP, etc. The Two Factor Authentication Process Flow For Comprehensive Smartphone Banking Diagrams Pdf is a compilation of the most recent design trends as a series of slides. It is suitable for any subject or industry presentation, containing attractive visuals and photo spots for businesses to clearly express their messages. This template contains a variety of slides for the user to input data, such as structures to contrast two elements, bullet points, and slides for written information. Slidegeeks is prepared to create an impression. This slide shows flow chart which can be used to understand how two factor authentication security feature works. It includes steps such as enter username and password, verify biometrics or enter OTP, etc.
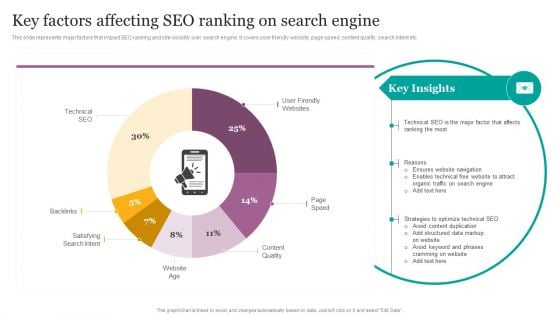
Key Factors Affecting SEO Ranking On Search Engine Ppt Infographics Diagrams PDF
This slide represents major factors that impact SEO ranking and site visibility over search engine. It covers user friendly website, page speed, content quality, search intent etc. If you are looking for a format to display your unique thoughts, then the professionally designed Key Factors Affecting SEO Ranking On Search Engine Ppt Infographics Diagrams PDF is the one for you. You can use it as a Google Slides template or a PowerPoint template. Incorporate impressive visuals, symbols, images, and other charts. Modify or reorganize the text boxes as you desire. Experiment with shade schemes and font pairings. Alter, share or cooperate with other people on your work. Download Key Factors Affecting SEO Ranking On Search Engine Ppt Infographics Diagrams PDF and find out how to give a successful presentation. Present a perfect display to your team and make your presentation unforgettable.

Impact Of Marketing Strategies On Business Performance Ppt PowerPoint Presentation Diagram Lists PDF
The following slide showcases the positive outcome of marketing strategies on companys performance. Post-implementing marketing strategies company recorded significant increase in brand awareness rate, sales and profit, market share, and customer retention rate. The Impact Of Marketing Strategies On Business Performance Ppt PowerPoint Presentation Diagram Lists PDF is a compilation of the most recent design trends as a series of slides. It is suitable for any subject or industry presentation, containing attractive visuals and photo spots for businesses to clearly express their messages. This template contains a variety of slides for the user to input data, such as structures to contrast two elements, bullet points, and slides for written information. Slidegeeks is prepared to create an impression.
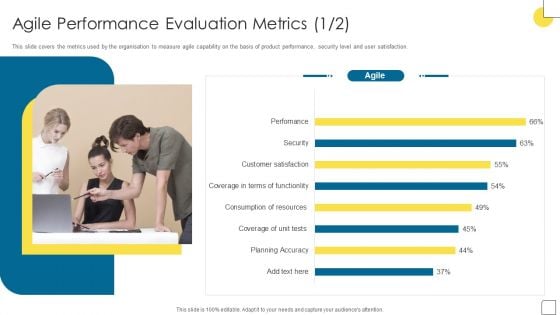
Agile Software Programming Module For IT Agile Performance Evaluation Metrics Diagrams PDF
This slide covers the metrics used by the organisation to measure agile capability on the basis of product performance, security level and user satisfaction. Presenting this PowerPoint presentation, titled Agile Software Programming Module For IT Agile Performance Evaluation Metrics Diagrams PDF, with topics curated by our researchers after extensive research. This editable presentation is available for immediate download and provides attractive features when used. Download now and captivate your audience. Presenting this Agile Software Programming Module For IT Agile Performance Evaluation Metrics Diagrams PDF. Our researchers have carefully researched and created these slides with all aspects taken into consideration. This is a completely customizable Agile Software Programming Module For IT Agile Performance Evaluation Metrics Diagrams PDF that is available for immediate downloading. Download now and make an impact on your audience. Highlight the attractive features available with our PPTs.
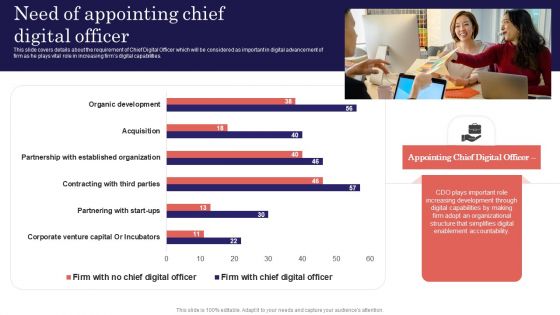
Digitalized Business Checklist Need Of Appointing Chief Digital Officer Diagrams PDF
This slide covers details about the requirement of Chief Digital Officer which will be considered as important in digital advancement of firm as he plays vital role in increasing firms digital capabilities. The Digitalized Business Checklist Need Of Appointing Chief Digital Officer Diagrams PDF is a compilation of the most recent design trends as a series of slides. It is suitable for any subject or industry presentation, containing attractive visuals and photo spots for businesses to clearly express their messages. This template contains a variety of slides for the user to input data, such as structures to contrast two elements, bullet points, and slides for written information. Slidegeeks is prepared to create an impression.
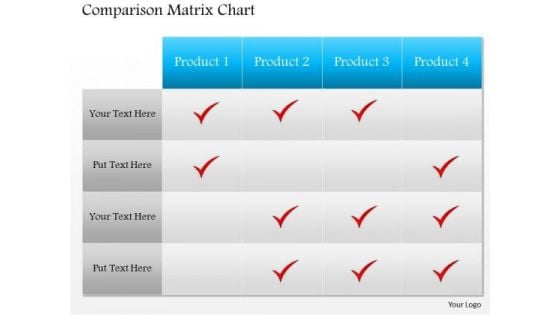
Business Framework Template Comparison Matrix PowerPoint Presentation
This business diagram displays framework for comparison chart. It contains matrix chart for comparison of four products. This diagram enables the users to create their own display of the required processes in an easy way.
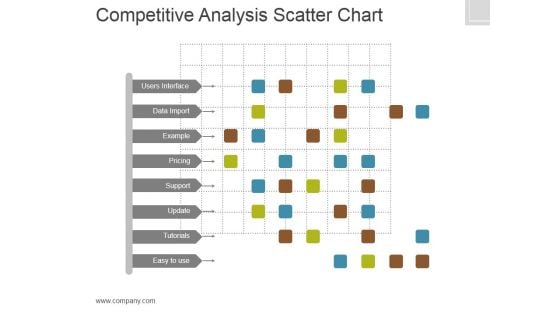
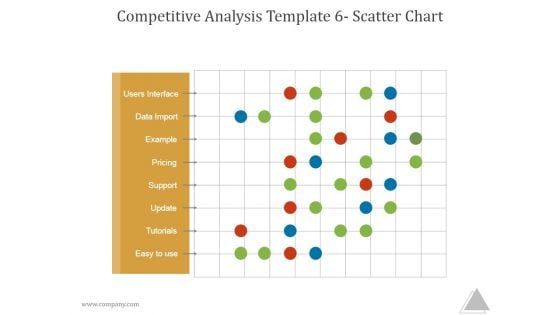
Competitive Analysis Template 6 Scatter Chart Ppt PowerPoint Presentation Slides
This is a competitive analysis template 6 scatter chart ppt powerpoint presentation slides. This is a eight stage process. The stages in this process are users interface, data import, example, pricing, support, update, tutorials, easy to use, table.
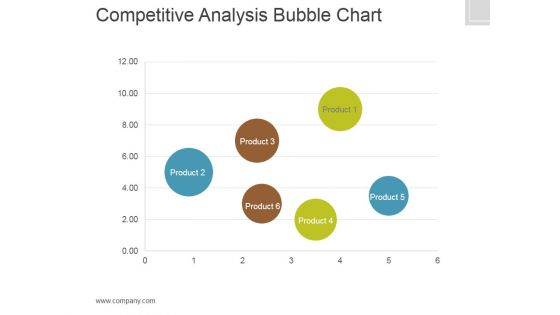
Competitive Analysis Template 7 Bubble Chart Ppt PowerPoint Presentation Deck
This is a competitive analysis template 7 bubble chart ppt powerpoint presentation deck. This is a six stage process. The stages in this process are users interface, data import, example, pricing, support, update, tutorials, easy to use, table.
Competitive Analysis Template 6 Scatter Chart Ppt PowerPoint Presentation Shapes
This is a competitive analysis template 6 scatter chart ppt powerpoint presentation shapes. This is a one stage process. The stages in this process are users interface, data import, example, pricing, support update, tutorials, easy to use.
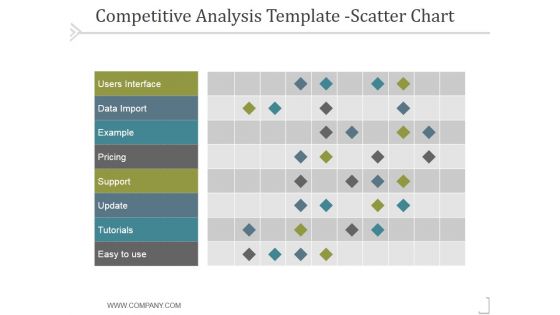
Competitive Analysis Scatter Chart Template 2 Ppt PowerPoint Presentation Files
This is a competitive analysis scatter chart template 2 ppt powerpoint presentation files. This is a nine stage process. The stages in this process are users interface, data import, example, pricing, support, update.
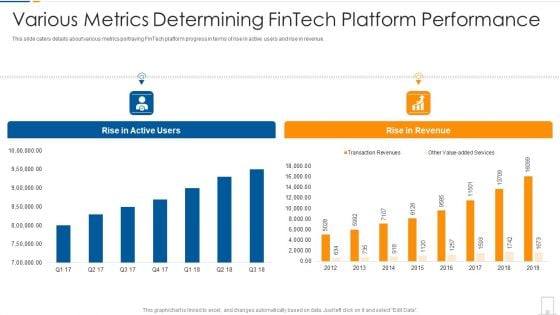
Various Metrics Determining Fintech Platform Performance Themes PDF
This slide caters details about various metrics portraying FinTech platform progress in terms of rise in active users and rise in revenue. Deliver an awe inspiring pitch with this creative various metrics determining fintech platform performance themes pdf bundle. Topics like various metrics determining fintech platform performance can be discussed with this completely editable template. It is available for immediate download depending on the needs and requirements of the user.
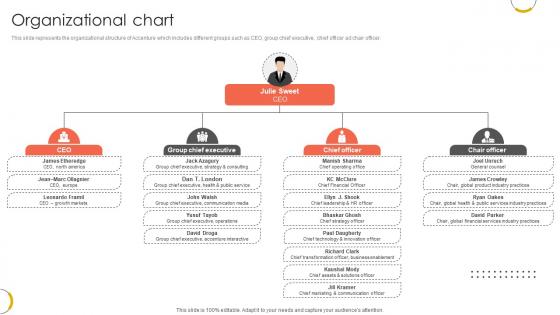
Organizational Chart Professional Services And Technology Consulting Ppt Example CP SS V
This slide represents the organizational structure of Accenture which includes different groups such as CEO, group chief executive, chief officer ad chair officer. The Organizational Chart Professional Services And Technology Consulting Ppt Example CP SS V is a compilation of the most recent design trends as a series of slides. It is suitable for any subject or industry presentation, containing attractive visuals and photo spots for businesses to clearly express their messages. This template contains a variety of slides for the user to input data, such as structures to contrast two elements, bullet points, and slides for written information. Slidegeeks is prepared to create an impression. This slide represents the organizational structure of Accenture which includes different groups such as CEO, group chief executive, chief officer ad chair officer.
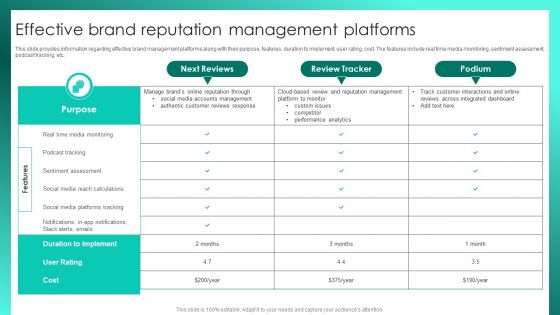
Successful Brand Management Effective Brand Reputation Management Platforms Themes PDF
This slide provides information regarding effective brand management platforms along with their purpose, features, duration to implement, user rating, cost. The features include real time media monitoring, sentiment assessment, podcast tracking, etc. Are you searching for a Successful Brand Management Effective Brand Reputation Management Platforms Themes PDF that is uncluttered, straightforward, and original Its easy to edit, and you can change the colors to suit your personal or business branding. For a presentation that expresses how much effort youve put in, this template is ideal With all of its features, including tables, diagrams, statistics, and lists, its perfect for a business plan presentation. Make your ideas more appealing with these professional slides. Download Successful Brand Management Effective Brand Reputation Management Platforms Themes PDF from Slidegeeks today.
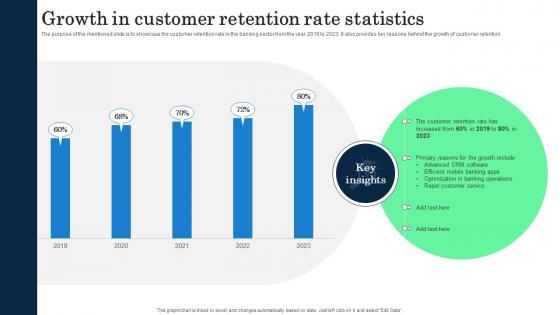
Growth In Customer Retention Rate Statistics Incorporating Banking Operational Growth
The purpose of the mentioned slide is to showcase the customer retention rate in the banking sector from the year 2019 to 2023. it also provides key reasons behind the growth of customer retention. The Growth In Customer Retention Rate Statistics Incorporating Banking Operational Growth is a compilation of the most recent design trends as a series of slides. It is suitable for any subject or industry presentation, containing attractive visuals and photo spots for businesses to clearly express their messages. This template contains a variety of slides for the user to input data, such as structures to contrast two elements, bullet points, and slides for written information. Slidegeeks is prepared to create an impression. The purpose of the mentioned slide is to showcase the customer retention rate in the banking sector from the year 2019 to 2023. it also provides key reasons behind the growth of customer retention

Personalization Strategies For Customer Journey On Website Themes PDF
The slide showcases personalization of different components of website throughout the visitor journey. Its key elements are visitor enters on landing page, user explores and add product to cart and customer proceeds for checkout Find highly impressive Personalization Strategies For Customer Journey On Website Themes PDF on Slidegeeks to deliver a meaningful presentation. You can save an ample amount of time using these presentation templates. No need to worry to prepare everything from scratch because Slidegeeks experts have already done a huge research and work for you. You need to download Personalization Strategies For Customer Journey On Website Themes PDF for your upcoming presentation. All the presentation templates are 100 percent editable and you can change the color and personalize the content accordingly. Download now
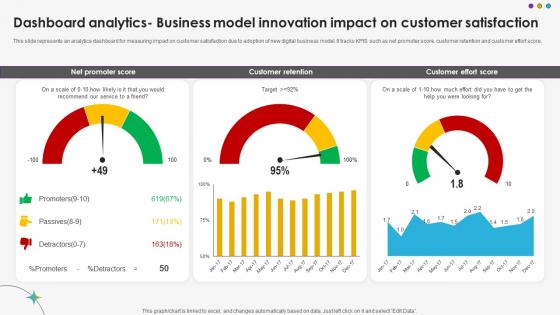
Dashboard Analytics Business Model Innovation Impact On Customer Satisfaction DT SS V
This slide represents an analytics dashboard for measuring impact on customer satisfaction due to adoption of new digital business model. It tracks KPIS such as net promoter score, customer retention and customer effort score.The Dashboard Analytics Business Model Innovation Impact On Customer Satisfaction DT SS V is a compilation of the most recent design trends as a series of slides. It is suitable for any subject or industry presentation, containing attractive visuals and photo spots for businesses to clearly express their messages. This template contains a variety of slides for the user to input data, such as structures to contrast two elements, bullet points, and slides for written information. Slidegeeks is prepared to create an impression. This slide represents an analytics dashboard for measuring impact on customer satisfaction due to adoption of new digital business model. It tracks KPIS such as net promoter score, customer retention and customer effort score.
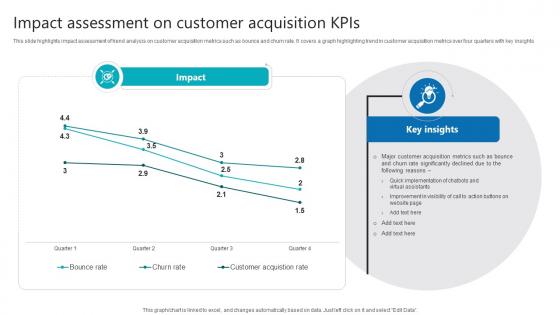
Impact Assessment On Customer Acquisition Kpis Product Analytics Implementation Data Analytics V
This slide highlights impact assessment of trend analysis on customer acquisition metrics such as bounce and churn rate. It covers a graph highlighting trend in customer acquisition metrics over four quarters with key insights The Impact Assessment On Customer Acquisition Kpis Product Analytics Implementation Data Analytics V is a compilation of the most recent design trends as a series of slides. It is suitable for any subject or industry presentation, containing attractive visuals and photo spots for businesses to clearly express their messages. This template contains a variety of slides for the user to input data, such as structures to contrast two elements, bullet points, and slides for written information. Slidegeeks is prepared to create an impression. This slide highlights impact assessment of trend analysis on customer acquisition metrics such as bounce and churn rate. It covers a graph highlighting trend in customer acquisition metrics over four quarters with key insights
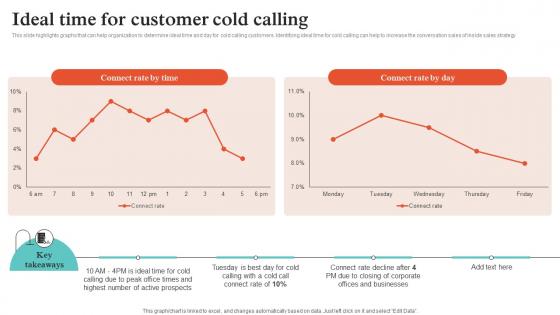
Virtual Sales Strategies Ideal Time For Customer Cold Calling Strategy SS V
This slide highlights graphs that can help organization to determine ideal time and day for cold calling customers. Identifying ideal time for cold calling can help to increase the conversation sales of inside sales strategy. The Virtual Sales Strategies Ideal Time For Customer Cold Calling Strategy SS V is a compilation of the most recent design trends as a series of slides. It is suitable for any subject or industry presentation, containing attractive visuals and photo spots for businesses to clearly express their messages. This template contains a variety of slides for the user to input data, such as structures to contrast two elements, bullet points, and slides for written information. Slidegeeks is prepared to create an impression. This slide highlights graphs that can help organization to determine ideal time and day for cold calling customers. Identifying ideal time for cold calling can help to increase the conversation sales of inside sales strategy.
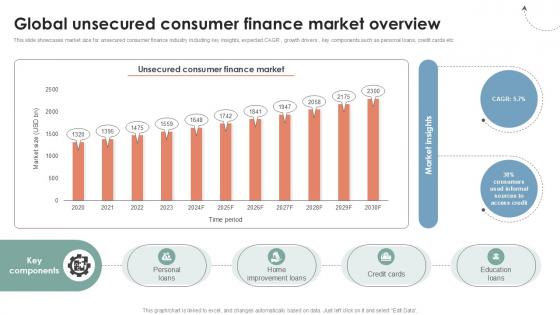
Global Unsecured Consumer Finance Market Overview Ppt Example CRP DK SS V
This slide showcases market size for unsecured consumer finance industry including key insights, expected CAGR , growth drivers , key components such as personal loans, credit cards etc. The Global Unsecured Consumer Finance Market Overview Ppt Example CRP DK SS V is a compilation of the most recent design trends as a series of slides. It is suitable for any subject or industry presentation, containing attractive visuals and photo spots for businesses to clearly express their messages. This template contains a variety of slides for the user to input data, such as structures to contrast two elements, bullet points, and slides for written information. Slidegeeks is prepared to create an impression. This slide showcases market size for unsecured consumer finance industry including key insights, expected CAGR , growth drivers , key components such as personal loans, credit cards etc.
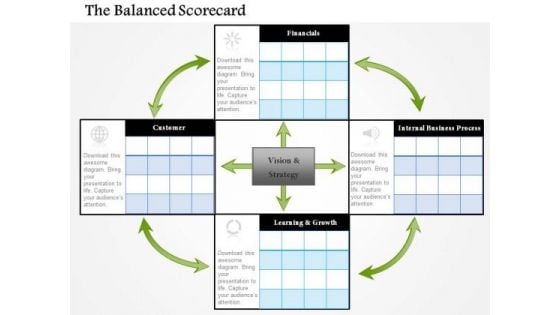
Business Framework The Balanced Scorecard PowerPoint Presentation
This business diagram displays framework for comparison chart. It contains matrix chart for comparison of four products. This diagram enables the users to create their own display of the required processes in an easy way.
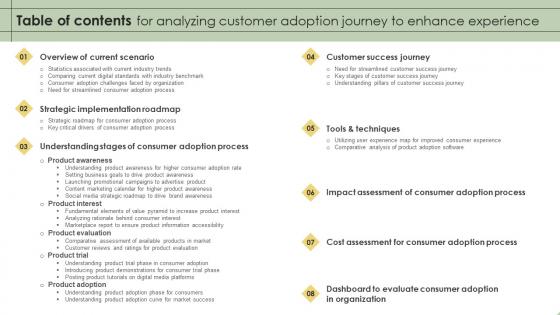
Table Of Contents For Analyzing Customer Adoption Journey To Enhance Experience Diagrams Pdf
The Table Of Contents For Analyzing Customer Adoption Journey To Enhance Experience Diagrams Pdf is a compilation of the most recent design trends as a series of slides. It is suitable for any subject or industry presentation, containing attractive visuals and photo spots for businesses to clearly express their messages. This template contains a variety of slides for the user to input data, such as structures to contrast two elements, bullet points, and slides for written information. Slidegeeks is prepared to create an impression. Our Table Of Contents For Analyzing Customer Adoption Journey To Enhance Experience Diagrams Pdf are topically designed to provide an attractive backdrop to any subject. Use them to look like a presentation pro.
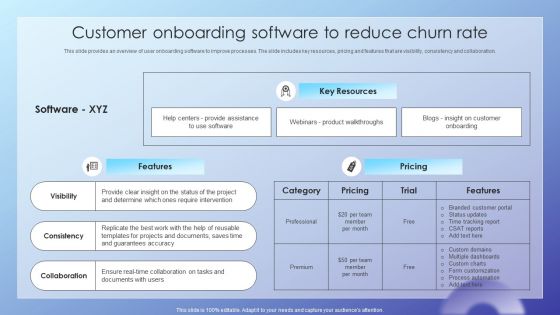
Client Acquisition Journey Plan Customer Onboarding Software To Reduce Themes PDF
This slide provides an overview of user onboarding software to improve processes. The slide includes key resources, pricing and features that are visibility, consistency and collaboration. Whether you have daily or monthly meetings, a brilliant presentation is necessary. Client Acquisition Journey Plan Customer Onboarding Software To Reduce Themes PDF can be your best option for delivering a presentation. Represent everything in detail using Client Acquisition Journey Plan Customer Onboarding Software To Reduce Themes PDF and make yourself stand out in meetings. The template is versatile and follows a structure that will cater to your requirements. All the templates prepared by Slidegeeks are easy to download and edit. Our research experts have taken care of the corporate themes as well. So, give it a try and see the results.

 Home
Home