Users Dashboard
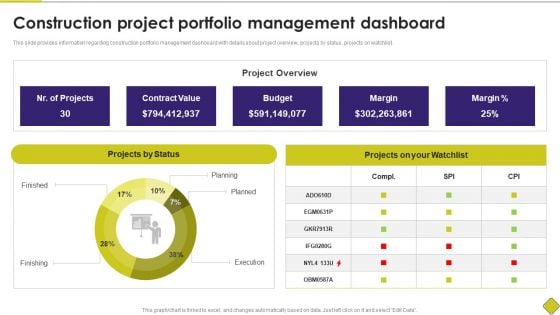
Latest Methodologies Of Construction Construction Project Portfolio Management Dashboard Pictures PDF
This slide provides information regarding construction portfolio management dashboard with details about project overview, projects by status, projects on watchlist. Want to ace your presentation in front of a live audience Our Latest Methodologies Of Construction Construction Project Portfolio Management Dashboard Pictures PDF can help you do that by engaging all the users towards you. Slidegeeks experts have put their efforts and expertise into creating these impeccable powerpoint presentations so that you can communicate your ideas clearly. Moreover, all the templates are customizable, and easy-to-edit and downloadable. Use these for both personal and commercial use.
Strategies For Marketing Dashboard For Tracking Brand Awareness Advertisement Themes PDF
This slide showcases dashboard that can help organization to track results of online advertisement campaigns. Its key components ad impressions, click through rate, cost per conversion, revenue per click, impressions, new users and sessions. From laying roadmaps to briefing everything in detail, our templates are perfect for you. You can set the stage with your presentation slides. All you have to do is download these easy-to-edit and customizable templates. Strategies For Marketing Dashboard For Tracking Brand Awareness Advertisement Themes PDF will help you deliver an outstanding performance that everyone would remember and praise you for. Do download this presentation today.
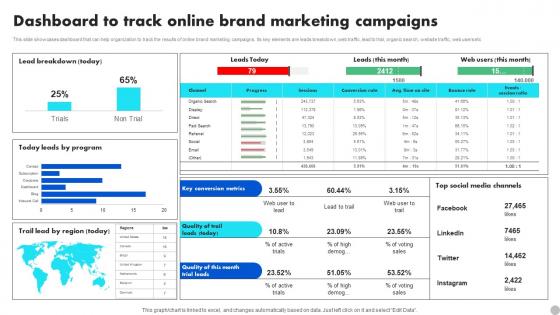
Dashboard To Track Online Brand Marketing Campaigns Brand Diversification Approach Information Pdf
This slide showcases dashboard that can help organization to track the results of online brand marketing campaigns. Its key elements are leads breakdown,web traffic, lead to trial, organic search, website traffic, web users etc. If you are looking for a format to display your unique thoughts, then the professionally designed Dashboard To Track Online Brand Marketing Campaigns Brand Diversification Approach Information Pdf is the one for you. You can use it as a Google Slides template or a PowerPoint template. Incorporate impressive visuals, symbols, images, and other charts. Modify or reorganize the text boxes as you desire. Experiment with shade schemes and font pairings. Alter, share or cooperate with other people on your work. Download Dashboard To Track Online Brand Marketing Campaigns Brand Diversification Approach Information Pdf and find out how to give a successful presentation. Present a perfect display to your team and make your presentation unforgettable. This slide showcases dashboard that can help organization to track the results of online brand marketing campaigns. Its key elements are leads breakdown,web traffic, lead to trial, organic search, website traffic, web users etc.
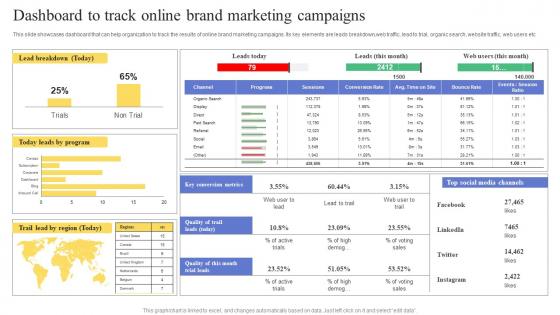
Dashboard To Track Online Brand Marketing Campaigns Maximizing Revenue Using Elements Pdf
This slide showcases dashboard that can help organization to track the results of online brand marketing campaigns. Its key elements are leads breakdown,web traffic, lead to trial, organic search, website traffic, web users etc. If you are looking for a format to display your unique thoughts, then the professionally designed Dashboard To Track Online Brand Marketing Campaigns Maximizing Revenue Using Elements Pdf is the one for you. You can use it as a Google Slides template or a PowerPoint template. Incorporate impressive visuals, symbols, images, and other charts. Modify or reorganize the text boxes as you desire. Experiment with shade schemes and font pairings. Alter, share or cooperate with other people on your work. Download Dashboard To Track Online Brand Marketing Campaigns Maximizing Revenue Using Elements Pdf and find out how to give a successful presentation. Present a perfect display to your team and make your presentation unforgettable. This slide showcases dashboard that can help organization to track the results of online brand marketing campaigns. Its key elements are leads breakdown,web traffic, lead to trial, organic search, website traffic, web users etc.
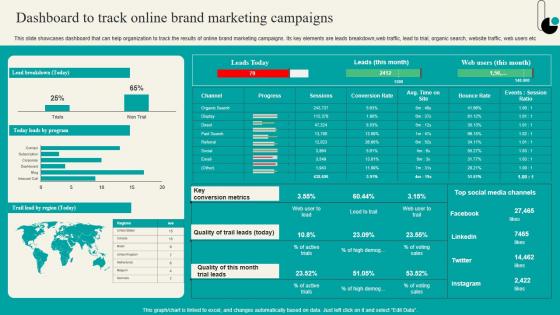
Dashboard To Track Online Brand Marketing Strategic Marketing Plan Themes PDF
This slide showcases dashboard that can help organization to track the results of online brand marketing campaigns. Its key elements are leads breakdown,web traffic, lead to trial, organic search, website traffic, web users etc. If you are looking for a format to display your unique thoughts, then the professionally designed Dashboard To Track Online Brand Marketing Strategic Marketing Plan Themes PDF is the one for you. You can use it as a Google Slides template or a PowerPoint template. Incorporate impressive visuals, symbols, images, and other charts. Modify or reorganize the text boxes as you desire. Experiment with shade schemes and font pairings. Alter, share or cooperate with other people on your work. Download Dashboard To Track Online Brand Marketing Strategic Marketing Plan Themes PDF and find out how to give a successful presentation. Present a perfect display to your team and make your presentation unforgettable. This slide showcases dashboard that can help organization to track the results of online brand marketing campaigns. Its key elements are leads breakdown,web traffic, lead to trial, organic search, website traffic, web users etc.
Dashboard To Track Online Brand Marketing Campaigns Launching New Product Brand Icons Pdf
This slide showcases dashboard that can help organization to track the results of online brand marketing campaigns. Its key elements are leads breakdown,web traffic, lead to trial, organic search, website traffic, web users etc If you are looking for a format to display your unique thoughts, then the professionally designed Dashboard To Track Online Brand Marketing Campaigns Launching New Product Brand Icons Pdf is the one for you. You can use it as a Google Slides template or a PowerPoint template. Incorporate impressive visuals, symbols, images, and other charts. Modify or reorganize the text boxes as you desire. Experiment with shade schemes and font pairings. Alter, share or cooperate with other people on your work. Download Dashboard To Track Online Brand Marketing Campaigns Launching New Product Brand Icons Pdf and find out how to give a successful presentation. Present a perfect display to your team and make your presentation unforgettable. This slide showcases dashboard that can help organization to track the results of online brand marketing campaigns. Its key elements are leads breakdown,web traffic, lead to trial, organic search, website traffic, web users etc
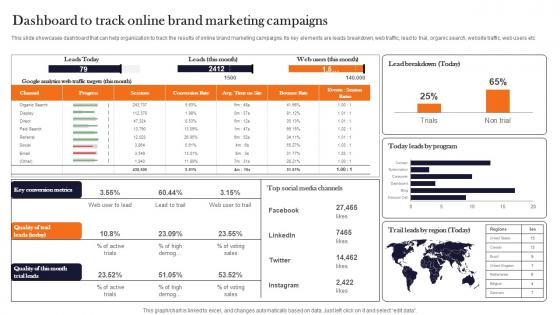
Dashboard To Track Online Brand Marketing Product Advertising And Positioning Graphics Pdf
This slide showcases dashboard that can help organization to track the results of online brand marketing campaigns. Its key elements are leads breakdown, web traffic, lead to trial, organic search, website traffic, web users etc. If you are looking for a format to display your unique thoughts, then the professionally designed Dashboard To Track Online Brand Marketing Product Advertising And Positioning Graphics Pdf is the one for you. You can use it as a Google Slides template or a PowerPoint template. Incorporate impressive visuals, symbols, images, and other charts. Modify or reorganize the text boxes as you desire. Experiment with shade schemes and font pairings. Alter, share or cooperate with other people on your work. Download Dashboard To Track Online Brand Marketing Product Advertising And Positioning Graphics Pdf and find out how to give a successful presentation. Present a perfect display to your team and make your presentation unforgettable. This slide showcases dashboard that can help organization to track the results of online brand marketing campaigns. Its key elements are leads breakdown, web traffic, lead to trial, organic search, website traffic, web users etc.

Omnichannel Banking Services Platform Dashboard To Track Customers Account Statements Pictures PDF
This slide covers overview of customers account based on different bank products used by customers. It includes elements such as statements for cash and loan accounts, credit cards, expense and budget analysis, bill payments, etc. Want to ace your presentation in front of a live audience Our Omnichannel Banking Services Platform Dashboard To Track Customers Account Statements Pictures PDF can help you do that by engaging all the users towards you. Slidegeeks experts have put their efforts and expertise into creating these impeccable powerpoint presentations so that you can communicate your ideas clearly. Moreover, all the templates are customizable, and easy to edit and downloadable. Use these for both personal and commercial use.

Improving Brand Mentions For Customer Reputation Management Dashboard To Manage Professional PDF
This slide provides information regarding reputation management to monitor brands status in terms of brand review summary, listing score, competition, listing accuracy, etc. Want to ace your presentation in front of a live audience Our Improving Brand Mentions For Customer Reputation Management Dashboard To Manage Professional PDF can help you do that by engaging all the users towards you. Slidegeeks experts have put their efforts and expertise into creating these impeccable powerpoint presentations so that you can communicate your ideas clearly. Moreover, all the templates are customizable, and easy-to-edit and downloadable. Use these for both personal and commercial use.
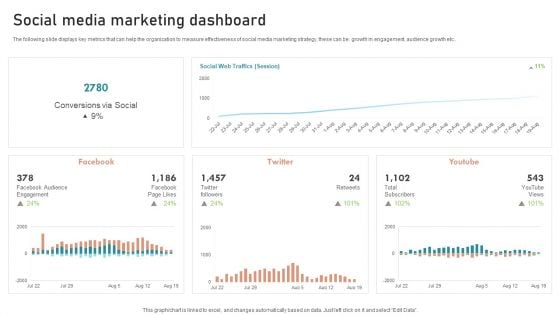
B2B And B2C Startups Marketing Mix Strategies Social Media Marketing Dashboard Download PDF
The following slide displays key metrics that can help the organization to measure effectiveness of social media marketing strategy, these can be growth in engagement, audience growth etc. Want to ace your presentation in front of a live audience Our B2B And B2C Startups Marketing Mix Strategies Social Media Marketing Dashboard Download PDF can help you do that by engaging all the users towards you. Slidegeeks experts have put their efforts and expertise into creating these impeccable powerpoint presentations so that you can communicate your ideas clearly. Moreover, all the templates are customizable, and easy to edit and downloadable. Use these for both personal and commercial use.

Implementing Digital Marketing Dashboard To Measure Performance Of Social Media Professional PDF
This following slide displays the key metrics that can help an organization to measure effectiveness of social media strategies. These can be leads generated, leads by region, web traffic targets etc. Want to ace your presentation in front of a live audience Our Implementing Digital Marketing Dashboard To Measure Performance Of Social Media Professional PDF can help you do that by engaging all the users towards you. Slidegeeks experts have put their efforts and expertise into creating these impeccable powerpoint presentations so that you can communicate your ideas clearly. Moreover, all the templates are customizable, and easy-to-edit and downloadable. Use these for both personal and commercial use.
Retargeting Strategies To Improve Sales Dashboard For Tracking Facebook Retargeting Campaign Background PDF
This slide covers metrics for analysing the results of Facebook retargeting campaign. It includes KPIs such as ad spend, cost per click, click-through rate, ad reach, post engagement, ad clicks, ad impressions, link clicks, etc. Want to ace your presentation in front of a live audience Our Retargeting Strategies To Improve Sales Dashboard For Tracking Facebook Retargeting Campaign Background PDF can help you do that by engaging all the users towards you.. Slidegeeks experts have put their efforts and expertise into creating these impeccable powerpoint presentations so that you can communicate your ideas clearly. Moreover, all the templates are customizable, and easy-to-edit and downloadable. Use these for both personal and commercial use.
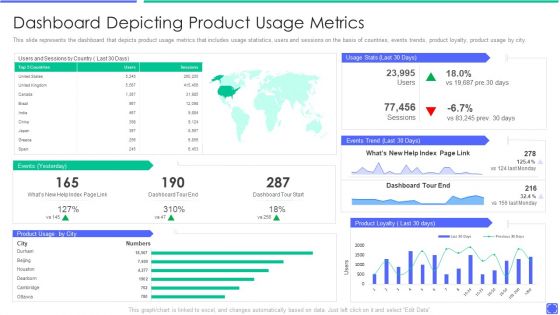
Best Techniques To Enhance New Product Management Efficiency Dashboard Depicting Product Rules PDF
This slide represents the dashboard that depicts product usage metrics that includes usage statistics, users and sessions on the basis of countries, events trends, product loyalty, product usage by city. Deliver and pitch your topic in the best possible manner with this best techniques to enhance new product management efficiency comparing product metrics themes pdf. Use them to share invaluable insights on costs associated with product development stages and impress your audience. This template can be altered and modified as per your expectations. So, grab it now.
Company Event Communication Dashboard For Tracking Event Gross Revenue Themes PDF
This slide covers metrics for analyzing gross revenue generated throughout the event. It includes a graphical and tabular representation of revenue generated via promo codes and tracking links. Want to ace your presentation in front of a live audience Our Company Event Communication Dashboard For Tracking Event Gross Revenue Themes PDF can help you do that by engaging all the users towards you.. Slidegeeks experts have put their efforts and expertise into creating these impeccable powerpoint presentations so that you can communicate your ideas clearly. Moreover, all the templates are customizable, and easy-to-edit and downloadable. Use these for both personal and commercial use.
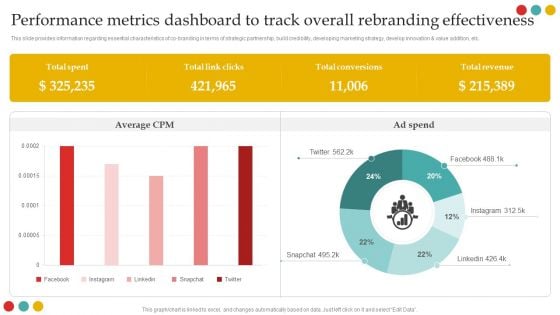
Successful Rebranding Guide Performance Metrics Dashboard To Track Overall Rebranding Effectiveness Guidelines PDF
This slide provides information regarding essential characteristics of co-branding in terms of strategic partnership, build credibility, developing marketing strategy, develop innovation value addition, etc.Want to ace your presentation in front of a live audience Our Successful Rebranding Guide Performance Metrics Dashboard To Track Overall Rebranding Effectiveness Guidelines PDF can help you do that by engaging all the users towards you. Slidegeeks experts have put their efforts and expertise into creating these impeccable powerpoint presentations so that you can communicate your ideas clearly. Moreover, all the templates are customizable, and easy-to-edit and downloadable. Use these for both personal and commercial use.
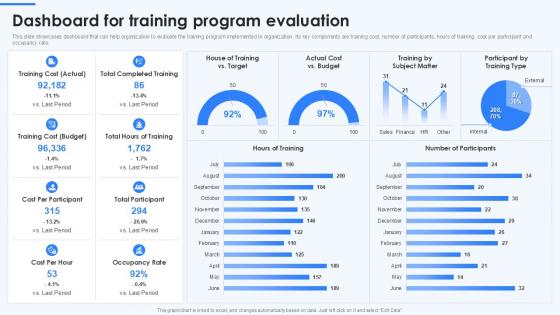
Dashboard For Training Program Evaluation On Job Employee Training Program For Skills
The Dashboard For Training Program Evaluation On Job Employee Training Program For Skills is a compilation of the most recent design trends as a series of slides. It is suitable for any subject or industry presentation, containing attractive visuals and photo spots for businesses to clearly express their messages. This template contains a variety of slides for the user to input data, such as structures to contrast two elements, bullet points, and slides for written information. Slidegeeks is prepared to create an impression. Our Dashboard for Training Program Evaluation on Job Employee Training Program for Skills shall offer a graphical representation providing insights to measure the effectiveness of an organizations training initiatives. This particular slide captures such important performance metrics such as the cost associated with training, number of participants, total hours undertaken in the training program, per participant cost, and occupation rate that help evaluate the entire program conducted.
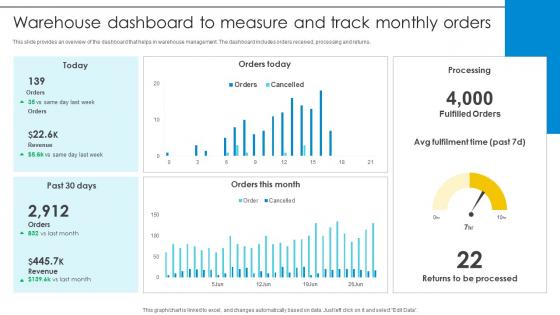
Warehouse Dashboard To Measure And Track Monthly Orders Optimizing Inventory Management IoT SS V
This slide provides an overview of the dashboard that helps in warehouse management. The dashboard includes orders received, processing and returns. Want to ace your presentation in front of a live audience Our Warehouse Dashboard To Measure And Track Monthly Orders Optimizing Inventory Management IoT SS V can help you do that by engaging all the users towards you. Slidegeeks experts have put their efforts and expertise into creating these impeccable powerpoint presentations so that you can communicate your ideas clearly. Moreover, all the templates are customizable, and easy-to-edit and downloadable. Use these for both personal and commercial use. This slide provides an overview of the dashboard that helps in warehouse management. The dashboard includes orders received, processing and returns.
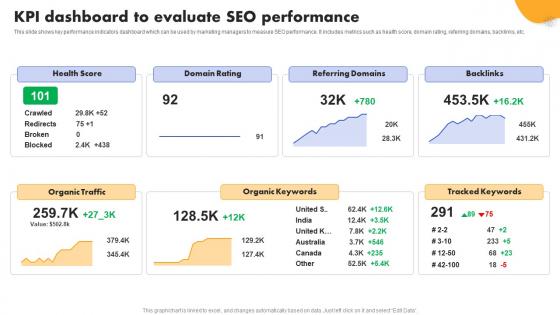
SEO Strategy To Improve KPI Dashboard To Evaluate SEO Performance Strategy SS V
This slide shows key performance indicators dashboard which can be used by marketing managers to measure SEO performance. It includes metrics such as health score, domain rating, referring domains, backlinks, etc. Want to ace your presentation in front of a live audience Our SEO Strategy To Improve KPI Dashboard To Evaluate SEO Performance Strategy SS V can help you do that by engaging all the users towards you. Slidegeeks experts have put their efforts and expertise into creating these impeccable powerpoint presentations so that you can communicate your ideas clearly. Moreover, all the templates are customizable, and easy-to-edit and downloadable. Use these for both personal and commercial use. This slide shows key performance indicators dashboard which can be used by marketing managers to measure SEO performance. It includes metrics such as health score, domain rating, referring domains, backlinks, etc.
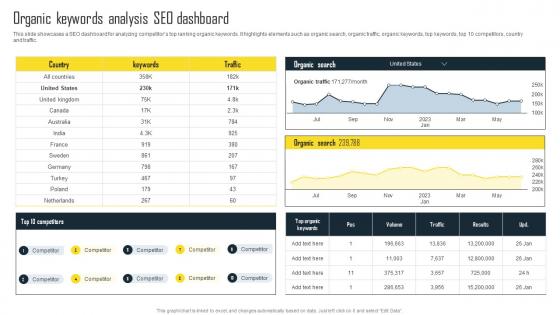
Organic Keywords Analysis SEO Dashboard Efficient Plan For Conducting Competitor Diagrams Pdf
This slide showcases a SEO dashboard for analyzing competitors top ranking organic keywords. It highlights elements such as organic search, organic traffic, organic keywords, top keywords, top 10 competitors, country and traffic. Want to ace your presentation in front of a live audience Our Organic Keywords Analysis SEO Dashboard Efficient Plan For Conducting Competitor Diagrams Pdf can help you do that by engaging all the users towards you. Slidegeeks experts have put their efforts and expertise into creating these impeccable powerpoint presentations so that you can communicate your ideas clearly. Moreover, all the templates are customizable, and easy-to-edit and downloadable. Use these for both personal and commercial use. This slide showcases a SEO dashboard for analyzing competitors top ranking organic keywords. It highlights elements such as organic search, organic traffic, organic keywords, top keywords, top 10 competitors, country and traffic.
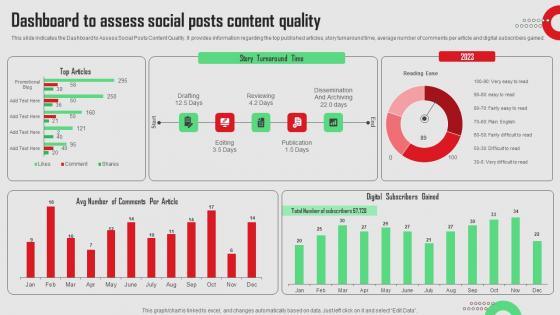
Dashboard To Assess Social Posts Content Quality Social Media Platforms Performance Designs Pdf
This slide indicates the Dashboard to Assess Social Posts Content Quality. It provides information regarding the top published articles, story turnaround time, average number of comments per article and digital subscribers gained.Want to ace your presentation in front of a live audience Our Dashboard To Assess Social Posts Content Quality Social Media Platforms Performance Designs Pdf can help you do that by engaging all the users towards you.. Slidegeeks experts have put their efforts and expertise into creating these impeccable powerpoint presentations so that you can communicate your ideas clearly. Moreover, all the templates are customizable, and easy-to-edit and downloadable. Use these for both personal and commercial use. This slide indicates the Dashboard to Assess Social Posts Content Quality. It provides information regarding the top published articles, story turnaround time, average number of comments per article and digital subscribers gained.
Smart Attendance Tracking Systems Dashboard Impact Of IoT Technology On Education IoT SS V
Following slide highlights dashboard to monitor and track student attendance by using Io enabled asset tracking devices. It includes indicators such as overtime, statistics, source, exceptions, pending requests, etc. Want to ace your presentation in front of a live audience Our Smart Attendance Tracking Systems Dashboard Impact Of IoT Technology On Education IoT SS V can help you do that by engaging all the users towards you. Slidegeeks experts have put their efforts and expertise into creating these impeccable powerpoint presentations so that you can communicate your ideas clearly. Moreover, all the templates are customizable, and easy-to-edit and downloadable. Use these for both personal and commercial use. Following slide highlights dashboard to monitor and track student attendance by using Io enabled asset tracking devices. It includes indicators such as overtime, statistics, source, exceptions, pending requests, etc.
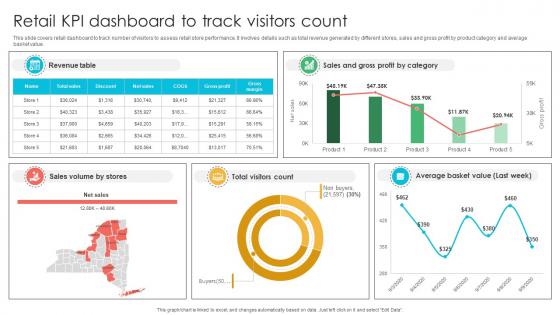
Marketing Strategies For Effective Retail KPI Dashboard To Track Visitors Count
This slide covers retail dashboard to track number of visitors to assess retail store performance. It involves details such as total revenue generated by different stores, sales and gross profit by product category and average basket value. Want to ace your presentation in front of a live audience Our Marketing Strategies For Effective Retail KPI Dashboard To Track Visitors Count can help you do that by engaging all the users towards you. Slidegeeks experts have put their efforts and expertise into creating these impeccable powerpoint presentations so that you can communicate your ideas clearly. Moreover, all the templates are customizable, and easy-to-edit and downloadable. Use these for both personal and commercial use. This slide covers retail dashboard to track number of visitors to assess retail store performance. It involves details such as total revenue generated by different stores, sales and gross profit by product category and average basket value.

Company Profit And Loss Dashboard With Income Statement Strategic Approaches To Corporate Financial
This slide provides a KPI dashboard that enables an organization to track revenue, expenses, and profit incurred in a specific period. It includes gross profit margin, OPEX ratio, operating profit margin, and net profit margin. Want to ace your presentation in front of a live audience Our Company Profit And Loss Dashboard With Income Statement Strategic Approaches To Corporate Financial can help you do that by engaging all the users towards you. Slidegeeks experts have put their efforts and expertise into creating these impeccable powerpoint presentations so that you can communicate your ideas clearly. Moreover, all the templates are customizable, and easy-to-edit and downloadable. Use these for both personal and commercial use. This slide provides a KPI dashboard that enables an organization to track revenue, expenses, and profit incurred in a specific period. It includes gross profit margin, OPEX ratio, operating profit margin, and net profit margin.
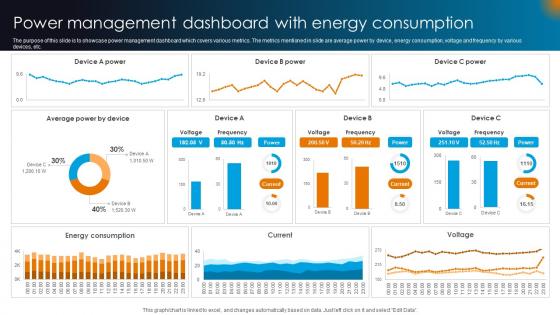
Integrating AI With IoT Power Management Dashboard With Energy Consumption IoT SS V
The purpose of this slide is to showcase power management dashboard which covers various metrics. The metrics mentioned in slide are average power by device, energy consumption, voltage and frequency by various devices, etc. Want to ace your presentation in front of a live audience Our Integrating AI With IoT Power Management Dashboard With Energy Consumption IoT SS V can help you do that by engaging all the users towards you. Slidegeeks experts have put their efforts and expertise into creating these impeccable powerpoint presentations so that you can communicate your ideas clearly. Moreover, all the templates are customizable, and easy-to-edit and downloadable. Use these for both personal and commercial use. The purpose of this slide is to showcase power management dashboard which covers various metrics. The metrics mentioned in slide are average power by device, energy consumption, voltage and frequency by various devices, etc.
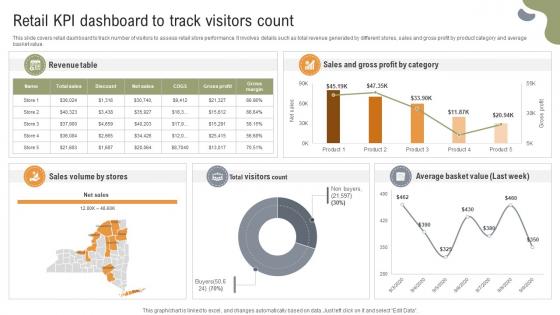
Implementing Strategies To Enhance Retail KPI Dashboard To Track Visitors Count
This slide covers retail dashboard to track number of visitors to assess retail store performance. It involves details such as total revenue generated by different stores, sales and gross profit by product category and average basket value. Want to ace your presentation in front of a live audience Our Implementing Strategies To Enhance Retail KPI Dashboard To Track Visitors Count can help you do that by engaging all the users towards you. Slidegeeks experts have put their efforts and expertise into creating these impeccable powerpoint presentations so that you can communicate your ideas clearly. Moreover, all the templates are customizable, and easy-to-edit and downloadable. Use these for both personal and commercial use. This slide covers retail dashboard to track number of visitors to assess retail store performance. It involves details such as total revenue generated by different stores, sales and gross profit by product category and average basket value.
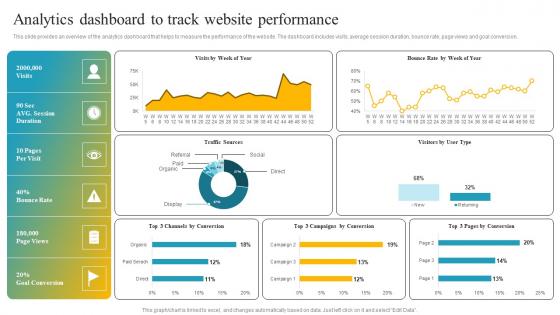
Effective Customer Engagement With Direct Response Analytics Dashboard To Track Template Pdf
This slide provides an overview of the analytics dashboard that helps to measure the performance of the website. The dashboard includes visits, average session duration, bounce rate, page views and goal conversion. Want to ace your presentation in front of a live audience Our Effective Customer Engagement With Direct Response Analytics Dashboard To Track Template Pdf can help you do that by engaging all the users towards you. Slidegeeks experts have put their efforts and expertise into creating these impeccable powerpoint presentations so that you can communicate your ideas clearly. Moreover, all the templates are customizable, and easy-to-edit and downloadable. Use these for both personal and commercial use. This slide provides an overview of the analytics dashboard that helps to measure the performance of the website. The dashboard includes visits, average session duration, bounce rate, page views and goal conversion.
Augmented Intelligence Tools And Applications IT Augmented Intelligence Information Tracking Dashboard Introduction PDF
This slide depicts the information tracking dashboard by augmented intelligence model covering the data analysis. Data analysis includes image analysis, storage size, new users on the cloud platform, etc. Presenting this PowerPoint presentation, titled Augmented Intelligence Tools And Applications IT Augmented Intelligence Information Tracking Dashboard Introduction PDF, with topics curated by our researchers after extensive research. This editable presentation is available for immediate download and provides attractive features when used. Download now and captivate your audience. Presenting this Augmented Intelligence Tools And Applications IT Augmented Intelligence Information Tracking Dashboard Introduction PDF. Our researchers have carefully researched and created these slides with all aspects taken into consideration. This is a completely customizable Augmented Intelligence Tools And Applications IT Augmented Intelligence Information Tracking Dashboard Introduction PDF that is available for immediate downloading. Download now and make an impact on your audience. Highlight the attractive features available with our PPTs.
Augmented Intelligence Information Tracking Dashboard Ppt PowerPoint Presentation File Ideas PDF
This slide depicts the information tracking dashboard by augmented intelligence model covering the data analysis. Data analysis includes image analysis, storage size, new users on the cloud platform, etc. Presenting this PowerPoint presentation, titled Augmented Intelligence Information Tracking Dashboard Ppt PowerPoint Presentation File Ideas PDF, with topics curated by our researchers after extensive research. This editable presentation is available for immediate download and provides attractive features when used. Download now and captivate your audience. Presenting this Augmented Intelligence Information Tracking Dashboard Ppt PowerPoint Presentation File Ideas PDF. Our researchers have carefully researched and created these slides with all aspects taken into consideration. This is a completely customizable Augmented Intelligence Information Tracking Dashboard Ppt PowerPoint Presentation File Ideas PDF that is available for immediate downloading. Download now and make an impact on your audience. Highlight the attractive features available with our PPTs.
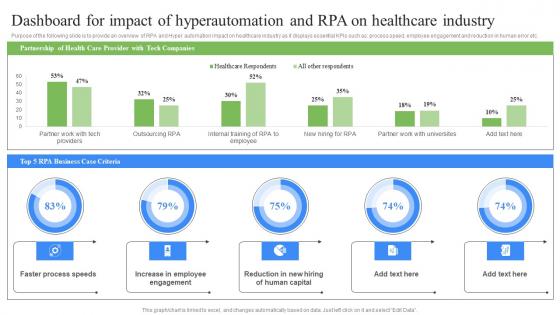
Dashboard For Impact Of Hyperautomation Healthcare RPA Influence On Industries Formats Pdf
Purpose of the following slide is to provide an overview of RPA and Hyper automation impact on healthcare industry as it displays essential KPIs such as process speed, employee engagement and reduction in human error etc. Want to ace your presentation in front of a live audience Our Dashboard For Impact Of Hyperautomation Healthcare RPA Influence On Industries Formats Pdf can help you do that by engaging all the users towards you. Slidegeeks experts have put their efforts and expertise into creating these impeccable powerpoint presentations so that you can communicate your ideas clearly. Moreover, all the templates are customizable, and easy-to-edit and downloadable. Use these for both personal and commercial use. Purpose of the following slide is to provide an overview of RPA and Hyper automation impact on healthcare industry as it displays essential KPIs such as process speed, employee engagement and reduction in human error etc.
Total Productive Management At Workplace Production Process Analytics Dashboard Icons PDF
This slide covers the dashboard of production process analytics dashboard that focuses on process cycle, defect types, completion count, etc. Deliver an awe inspiring pitch with this creative total productive management at workplace production process analytics dashboard icons pdf bundle. Topics like type of defect, process cycle time by user, process time statistics by user can be discussed with this completely editable template. It is available for immediate download depending on the needs and requirements of the user.
Human Augmented Machine Learning IT Augmented Intelligence Information Tracking Dashboard Diagrams PDF
This slide depicts the information tracking dashboard by augmented intelligence model covering the data analysis. Data analysis includes image analysis, storage size, new users on the cloud platform, etc. Get a simple yet stunning designed Human Augmented Machine Learning IT Augmented Intelligence Information Tracking Dashboard Diagrams PDF. It is the best one to establish the tone in your meetings. It is an excellent way to make your presentations highly effective. So, download this PPT today from Slidegeeks and see the positive impacts. Our easy-to-edit Human Augmented Machine Learning IT Augmented Intelligence Information Tracking Dashboard Diagrams PDF can be your go-to option for all upcoming conferences and meetings. So, what are you waiting for. Grab this template today.
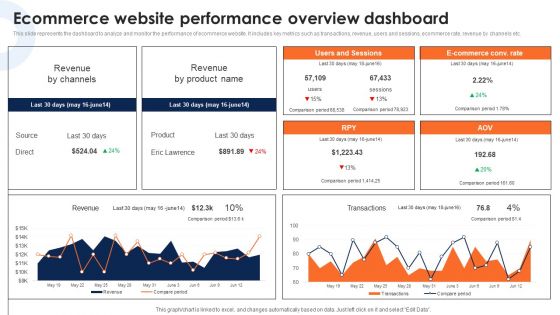
Ecommerce Website Performance Overview Dashboard Deploying Ecommerce Order Management Infographics PDF
This slide represents the dashboard to analyze and monitor the performance of ecommerce website. It includes key metrics such as transactions, revenue, users and sessions, ecommerce rate, revenue by channels etc.If you are looking for a format to display your unique thoughts, then the professionally designed Ecommerce Website Performance Overview Dashboard Deploying Ecommerce Order Management Infographics PDF is the one for you. You can use it as a Google Slides template or a PowerPoint template. Incorporate impressive visuals, symbols, images, and other charts. Modify or reorganize the text boxes as you desire. Experiment with shade schemes and font pairings. Alter, share or cooperate with other people on your work. Download Ecommerce Website Performance Overview Dashboard Deploying Ecommerce Order Management Infographics PDF and find out how to give a successful presentation. Present a perfect display to your team and make your presentation unforgettable.
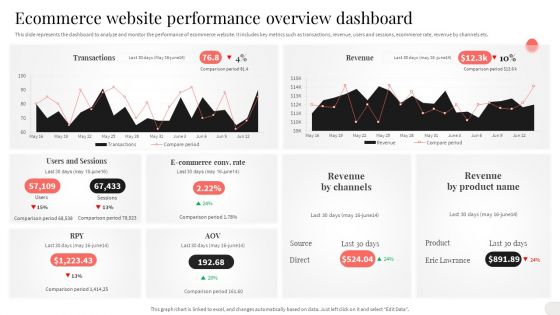
Analyzing And Implementing Effective CMS Ecommerce Website Performance Overview Dashboard Portrait PDF
This slide represents the dashboard to analyze and monitor the performance of ecommerce website. It includes key metrics such as transactions, revenue, users and sessions, ecommerce rate, revenue by channels etc. Here you can discover an assortment of the finest PowerPoint and Google Slides templates. With these templates, you can create presentations for a variety of purposes while simultaneously providing your audience with an eye catching visual experience. Download Analyzing And Implementing Effective CMS Ecommerce Website Performance Overview Dashboard Portrait PDF to deliver an impeccable presentation. These templates will make your job of preparing presentations much quicker, yet still, maintain a high level of quality. Slidegeeks has experienced researchers who prepare these templates and write high quality content for you. Later on, you can personalize the content by editing the Analyzing And Implementing Effective CMS Ecommerce Website Performance Overview Dashboard Portrait PDF.

Analyzing And Deploying Effective CMS Ecommerce Website Performance Overview Dashboard Download PDF
This slide represents the dashboard to analyze and monitor the performance of ecommerce website. It includes key metrics such as transactions, revenue, users and sessions, ecommerce rate, revenue by channels etc. Here you can discover an assortment of the finest PowerPoint and Google Slides templates. With these templates, you can create presentations for a variety of purposes while simultaneously providing your audience with an eye catching visual experience. Download Analyzing And Deploying Effective CMS Ecommerce Website Performance Overview Dashboard Download PDF to deliver an impeccable presentation. These templates will make your job of preparing presentations much quicker, yet still, maintain a high level of quality. Slidegeeks has experienced researchers who prepare these templates and write high quality content for you. Later on, you can personalize the content by editing the Analyzing And Deploying EffAnalyzing And Deploying Effective CMS Ecommerce Website Performance Overview Dashboard Download PDF.
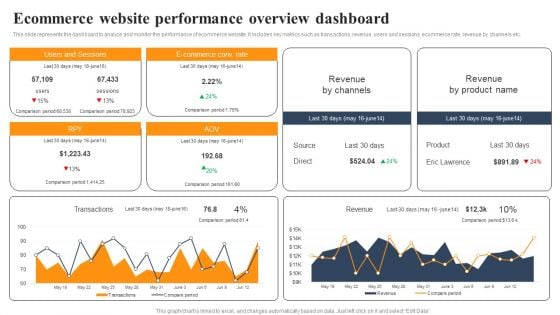
Implementing An Effective Ecommerce Management Framework Ecommerce Website Performance Overview Dashboard Clipart PDF
This slide represents the dashboard to analyze and monitor the performance of ecommerce website. It includes key metrics such as transactions, revenue, users and sessions, ecommerce rate, revenue by channels etc. Find highly impressive Implementing An Effective Ecommerce Management Framework Ecommerce Website Performance Overview Dashboard Clipart PDF on Slidegeeks to deliver a meaningful presentation. You can save an ample amount of time using these presentation templates. No need to worry to prepare everything from scratch because Slidegeeks experts have already done a huge research and work for you. You need to download Implementing An Effective Ecommerce Management Framework Ecommerce Website Performance Overview Dashboard Clipart PDFfor your upcoming presentation. All the presentation templates are 100 percent editable and you can change the color and personalize the content accordingly. Download now
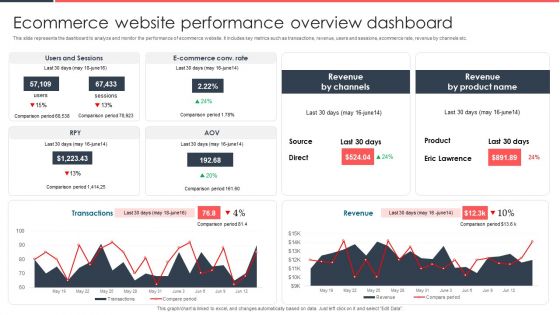
Implementing Management System To Enhance Ecommerce Processes Ecommerce Website Performance Overview Dashboard Slides PDF
This slide represents the dashboard to analyze and monitor the performance of ecommerce website. It includes key metrics such as transactions, revenue, users and sessions, ecommerce rate, revenue by channels etc. Here you can discover an assortment of the finest PowerPoint and Google Slides templates. With these templates, you can create presentations for a variety of purposes while simultaneously providing your audience with an eye catching visual experience. Download Implementing Management System To Enhance Ecommerce Processes Ecommerce Website Performance Overview Dashboard Slides PDF to deliver an impeccable presentation. These templates will make your job of preparing presentations much quicker, yet still, maintain a high level of quality. Slidegeeks has experienced researchers who prepare these templates and write high quality content for you. Later on, you can personalize the content by editing the Implementing Management System To Enhance Ecommerce Processes Ecommerce Website Performance Overview Dashboard Slides PDF.
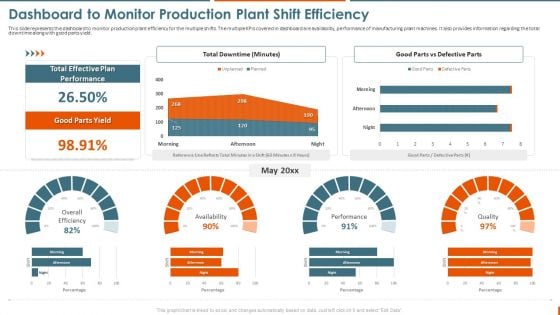
Maintenance Administration Dashboard To Monitor Production Plant Shift Efficiency Diagrams PDF
This slide represents the dashboard to monitor production plant efficiency for the multiple shifts. The multiple KPIs covered in dashboard are availability, performance of manufacturing plant machines. It also provides information regarding the total downtime along with good parts yield. Want to ace your presentation in front of a live audience Our Maintenance Administration Dashboard To Monitor Production Plant Shift Efficiency Diagrams PDF can help you do that by engaging all the users towards you. Slidegeeks experts have put their efforts and expertise into creating these impeccable powerpoint presentations so that you can communicate your ideas clearly. Moreover, all the templates are customizable, and easy-to-edit and downloadable. Use these for both personal and commercial use.
Brand Awareness Strategy Dashboard For Tracking Brand Awareness Advertisement Ideas PDF
This slide showcases dashboard that can help organization to track results of online advertisement campaigns. Its key components ad impressions, click through rate, cost per conversion, revenue per click, impressions, new users and sessions. Get a simple yet stunning designed Brand Awareness Strategy Dashboard For Tracking Brand Awareness Advertisement Ideas PDF. It is the best one to establish the tone in your meetings. It is an excellent way to make your presentations highly effective. So, download this PPT today from Slidegeeks and see the positive impacts. Our easy-to-edit Brand Awareness Strategy Dashboard For Tracking Brand Awareness Advertisement Ideas PDF can be your go-to option for all upcoming conferences and meetings. So, what are you waiting for Grab this template today.
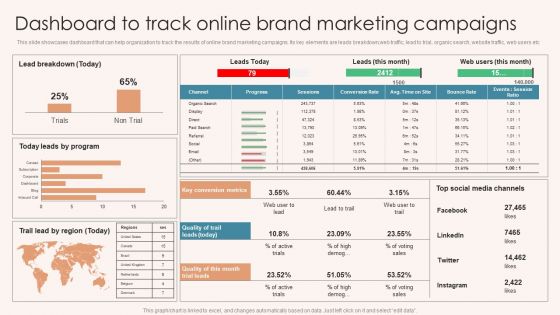
Brand Marketing Strategy Dashboard To Track Online Brand Marketing Campaigns Template PDF
This slide showcases dashboard that can help organization to track the results of online brand marketing campaigns. Its key elements are leads breakdown,web traffic, lead to trial, organic search, website traffic, web users etc. If you are looking for a format to display your unique thoughts, then the professionally designed Brand Marketing Strategy Dashboard To Track Online Brand Marketing Campaigns Template PDF is the one for you. You can use it as a Google Slides template or a PowerPoint template. Incorporate impressive visuals, symbols, images, and other charts. Modify or reorganize the text boxes as you desire. Experiment with shade schemes and font pairings. Alter, share or cooperate with other people on your work. Download Brand Marketing Strategy Dashboard To Track Online Brand Marketing Campaigns Template PDF and find out how to give a successful presentation. Present a perfect display to your team and make your presentation unforgettable.
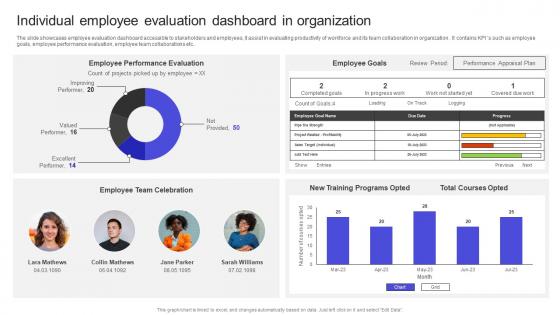
Strategies To Build Meaningful Individual Employee Evaluation Dashboard In Organization Professional Pdf
The slide showcases employee evaluation dashboard accessible to stakeholders and employees, it assist in evaluating productivity of workforce and its team collaboration in organization . It contains KPI s such as employee goals, employee performance evaluation, employee team collaborations etc.. Want to ace your presentation in front of a live audience Our Strategies To Build Meaningful Individual Employee Evaluation Dashboard In Organization Professional Pdf can help you do that by engaging all the users towards you. Slidegeeks experts have put their efforts and expertise into creating these impeccable powerpoint presentations so that you can communicate your ideas clearly. Moreover, all the templates are customizable, and easy-to-edit and downloadable. Use these for both personal and commercial use. The slide showcases employee evaluation dashboard accessible to stakeholders and employees, it assist in evaluating productivity of workforce and its team collaboration in organization . It contains KPI s such as employee goals, employee performance evaluation, employee team collaborations etc..
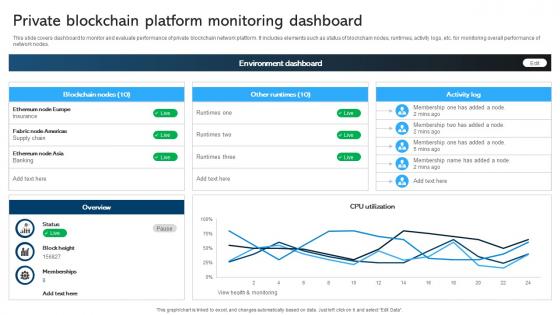
Comprehensive Manual For Private Blockchain Platform Monitoring Dashboard BCT SS V
This slide covers dashboard to monitor and evaluate performance of private blockchain network platform. It includes elements such as status of blockchain nodes, runtimes, activity logs, etc. for monitoring overall performance of network nodes. Want to ace your presentation in front of a live audience Our Comprehensive Manual For Private Blockchain Platform Monitoring Dashboard BCT SS V can help you do that by engaging all the users towards you. Slidegeeks experts have put their efforts and expertise into creating these impeccable powerpoint presentations so that you can communicate your ideas clearly. Moreover, all the templates are customizable, and easy-to-edit and downloadable. Use these for both personal and commercial use. This slide covers dashboard to monitor and evaluate performance of private blockchain network platform. It includes elements such as status of blockchain nodes, runtimes, activity logs, etc. for monitoring overall performance of network nodes.
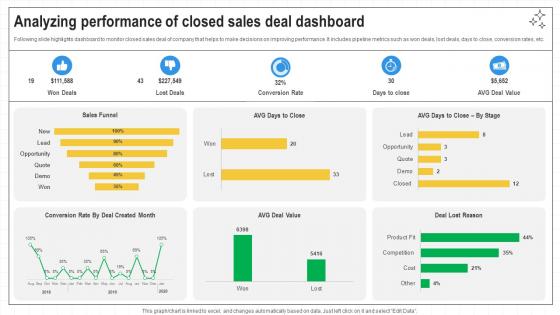
Closing Techniques To Seal Analyzing Performance Of Closed Sales Deal Dashboard SA SS V
Following slide highlights dashboard to monitor closed sales deal of company that helps to make decisions on improving performance. It includes pipeline metrics such as won deals, lost deals, days to close, conversion rates, etc. Want to ace your presentation in front of a live audience Our Closing Techniques To Seal Analyzing Performance Of Closed Sales Deal Dashboard SA SS V can help you do that by engaging all the users towards you. Slidegeeks experts have put their efforts and expertise into creating these impeccable powerpoint presentations so that you can communicate your ideas clearly. Moreover, all the templates are customizable, and easy-to-edit and downloadable. Use these for both personal and commercial use. Following slide highlights dashboard to monitor closed sales deal of company that helps to make decisions on improving performance. It includes pipeline metrics such as won deals, lost deals, days to close, conversion rates, etc.
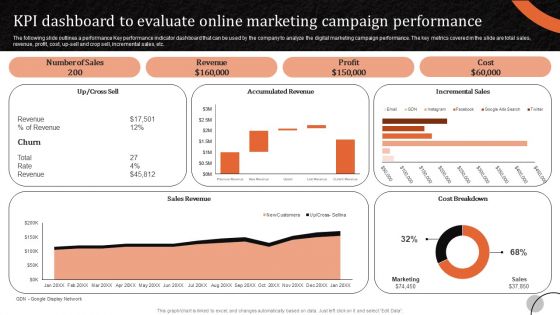
Marketing Tactics To Increase KPI Dashboard To Evaluate Online Marketing Campaign Infographics PDF
The following slide outlines a performance Key performance indicator dashboard that can be used by the company to analyze the digital marketing campaign performance. The key metrics covered in the slide are total sales, revenue, profit, cost, up-sell and crop sell, incremental sales, etc. Want to ace your presentation in front of a live audience Our Marketing Tactics To Increase KPI Dashboard To Evaluate Online Marketing Campaign Infographics PDF can help you do that by engaging all the users towards you. Slidegeeks experts have put their efforts and expertise into creating these impeccable powerpoint presentations so that you can communicate your ideas clearly. Moreover, all the templates are customizable, and easy-to-edit and downloadable. Use these for both personal and commercial use.
Predictive Analytics Methods Predictive Analytics Model Performance Tracking Dashboard Structure PDF
This slide represents the predictive analytics model performance tracking dashboard, and it covers the details of total visitors, total buyers, total products added to the cart, filters by date and category, visitors to clients conversion rate, and so on. Want to ace your presentation in front of a live audience Our Predictive Analytics Methods Predictive Analytics Model Performance Tracking Dashboard Structure PDF can help you do that by engaging all the users towards you. Slidegeeks experts have put their efforts and expertise into creating these impeccable powerpoint presentations so that you can communicate your ideas clearly. Moreover, all the templates are customizable, and easy to edit and downloadable. Use these for both personal and commercial use.
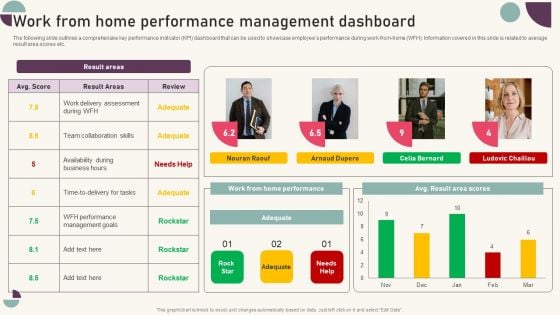
Tactics For Establishing Sustainable Hybrid Work Environment Work From Home Performance Management Dashboard Information PDF
The following slide outlines a comprehensive key performance indicator KPI dashboard that can be used to showcase employees performance during work-from-home WFH. Information covered in this slide is related to average result area scores etc. Want to ace your presentation in front of a live audience Our Tactics For Establishing Sustainable Hybrid Work Environment Work From Home Performance Management Dashboard Information PDF can help you do that by engaging all the users towards you. Slidegeeks experts have put their efforts and expertise into creating these impeccable powerpoint presentations so that you can communicate your ideas clearly. Moreover, all the templates are customizable, and easy to edit and downloadable. Use these for both personal and commercial use.
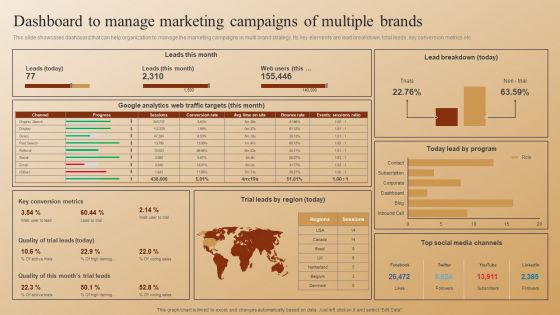
Establishing A Brand Identity For Organizations With Several Brands Dashboard To Manage Marketing Campaigns Sample PDF
This slide showcases dashboard that can help organization to manage the marketing campaigns in multi brand strategy. Its key elements are lead breakdown, total leads, key conversion metrics etc. Its key elements are forecast purchasers, customer acquisition cost and visitors count by landing pages. Want to ace your presentation in front of a live audience Our Establishing A Brand Identity For Organizations With Several Brands Dashboard To Manage Marketing Campaigns Sample PDFcan help you do that by engaging all the users towards you. Slidegeeks experts have put their efforts and expertise into creating these impeccable powerpoint presentations so that you can communicate your ideas clearly. Moreover, all the templates are customizable, and easy-to-edit and downloadable. Use these for both personal and commercial use.
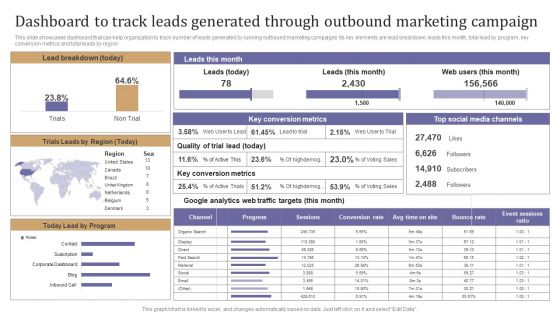
Dashboard To Track Leads Generated Through Outbound Marketing Campaign Slides PDF
This slide showcases dashboard that can help organization to track number of leads generated by running outbound marketing campaigns. Its key elements are lead breakdown, leads this month, total lead by program, key conversion metrics and total leads by region. Want to ace your presentation in front of a live audience Our Dashboard To Track Leads Generated Through Outbound Marketing Campaign Slides PDF can help you do that by engaging all the users towards you. Slidegeeks experts have put their efforts and expertise into creating these impeccable powerpoint presentations so that you can communicate your ideas clearly. Moreover, all the templates are customizable, and easy to edit and downloadable. Use these for both personal and commercial use.
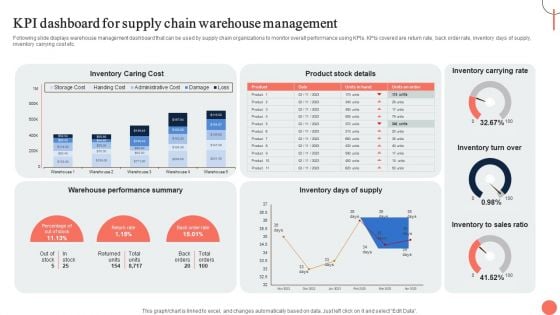
Strategies For Dynamic Supply Chain Agility KPI Dashboard For Supply Chain Warehouse Management Themes PDF
Following slide displays warehouse management dashboard that can be used by supply chain organizations to monitor overall performance using KPIs. KPIs covered are return rate, back order rate, inventory days of supply, inventory carrying cost etc. Want to ace your presentation in front of a live audience Our Strategies For Dynamic Supply Chain Agility KPI Dashboard For Supply Chain Warehouse Management Themes PDF can help you do that by engaging all the users towards you. Slidegeeks experts have put their efforts and expertise into creating these impeccable powerpoint presentations so that you can communicate your ideas clearly. Moreover, all the templates are customizable, and easy to edit and downloadable. Use these for both personal and commercial use.
Job Rotation Plan For Staff Employee Performance Tracking Dashboard After Job Microsoft PDF
This slide showcases dashboard that can help organization to track the performance of employee after implementing job rotation programme. Its key elements are productivity rate, top users and groups etc. This Job Rotation Plan For Staff Employee Performance Tracking Dashboard After Job Microsoft PDFfrom Slidegeeks makes it easy to present information on your topic with precision. It provides customization options, so you can make changes to the colors, design, graphics, or any other component to create a unique layout. It is also available for immediate download, so you can begin using it right away. Slidegeeks has done good research to ensure that you have everything you need to make your presentation stand out. Make a name out there for a brilliant performance.
Kpi Dashboard For Tracking Monthly Personal Finances Ppt Outline Graphics Example PDF
This slide shows dashboard which can be used by individuals to track monthly expenses in order to get better understanding of his or her finances. It includes metrics such as users spending, savings, debt, etc. Welcome to our selection of the Kpi Dashboard For Tracking Monthly Personal Finances Ppt Outline Graphics Example PDF. These are designed to help you showcase your creativity and bring your sphere to life. Planning and Innovation are essential for any business that is just starting out. This collection contains the designs that you need for your everyday presentations. All of our PowerPoints are 100 percent editable, so you can customize them to suit your needs. This multi purpose template can be used in various situations. Grab these presentation templates today.
Techniques To Boost Brand Awareness Dashboard For Tracking Brand Awareness Advertisement Rules PDF
This slide showcases dashboard that can help organization to track results of online advertisement components are ad Its key components are ad impressions, click through rate, cost per conversion, revenue per click, impressions, new users and sessions. Present like a pro with Techniques To Boost Brand Awareness Dashboard For Tracking Brand Awareness Advertisement Rules PDF Create beautiful presentations together with your team, using our easy-to-use presentation slides. Share your ideas in real-time and make changes on the fly by downloading our templates. So whether youre in the office, on the go, or in a remote location, you can stay in sync with your team and present your ideas with confidence. With Slidegeeks presentation got a whole lot easier. Grab these presentations today.
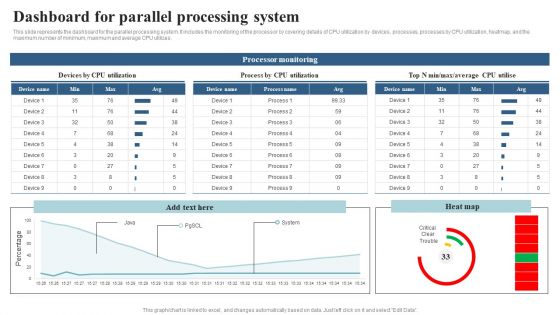
Integrating Parallel Processor System Dashboard For Parallel Processing System Brochure PDF
This slide represents the dashboard for the parallel processing system. It includes the monitoring of the processor by covering details of CPU utilization by devices, processes, processes by CPU utilization, heatmap, and the maximum number of minimum, maximum and average CPU utilizes. Want to ace your presentation in front of a live audience Our Integrating Parallel Processor System Dashboard For Parallel Processing System Brochure PDF can help you do that by engaging all the users towards you.. Slidegeeks experts have put their efforts and expertise into creating these impeccable powerpoint presentations so that you can communicate your ideas clearly. Moreover, all the templates are customizable, and easy-to-edit and downloadable. Use these for both personal and commercial use.
Cognitive Analytics Strategy And Techniques Tracking Essential Virtual Agents Activities Dashboard Template PDF
This slide provides information regarding virtual agents essential activities dashboard in terms of daily number of new conversation, unique users weekly conversations by channel, etc. Do you know about Slidesgeeks Cognitive Analytics Strategy And Techniques Tracking Essential Virtual Agents Activities Dashboard Template PDF These are perfect for delivering any kind od presentation. Using it, create PowerPoint presentations that communicate your ideas and engage audiences. Save time and effort by using our pre designed presentation templates that are perfect for a wide range of topic. Our vast selection of designs covers a range of styles, from creative to business, and are all highly customizable and easy to edit. Download as a PowerPoint template or use them as Google Slides themes.
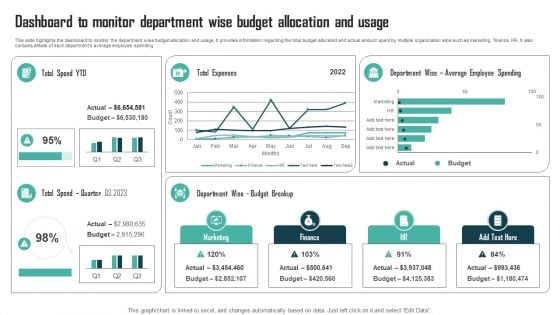
Expenses Management Plan Dashboard To Monitor Department Wise Budget Allocation Clipart PDF
This slide highlights the dashboard to monitor the department wise budget allocation and usage. It provides information regarding the total budget allocated and actual amount spent by multiple organization silos such as marketing, finance, HR. It also contains details of each departments average employee spending. Want to ace your presentation in front of a live audience Our Expenses Management Plan Dashboard To Monitor Department Wise Budget Allocation Clipart PDF can help you do that by engaging all the users towards you. Slidegeeks experts have put their efforts and expertise into creating these impeccable powerpoint presentations so that you can communicate your ideas clearly. Moreover, all the templates are customizable, and easy-to-edit and downloadable. Use these for both personal and commercial use.
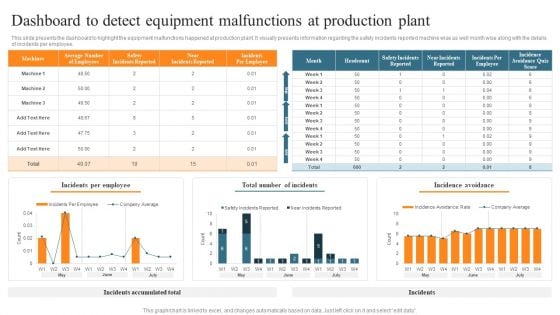
Leveraging Predictive Maintenance To Enhance Production Process Dashboard To Detect Equipment Malfunctions At Production Slides PDF
This slide presents the dashboard to highlight the equipment malfunctions happened at production plant. It visually presents information regarding the safety incidents reported machine wise as well month wise along with the details of incidents per employee. Want to ace your presentation in front of a live audience Our Leveraging Predictive Maintenance To Enhance Production Process Dashboard To Detect Equipment Malfunctions At Production Slides PDF can help you do that by engaging all the users towards you.. Slidegeeks experts have put their efforts and expertise into creating these impeccable powerpoint presentations so that you can communicate your ideas clearly. Moreover, all the templates are customizable, and easy-to-edit and downloadable. Use these for both personal and commercial use.
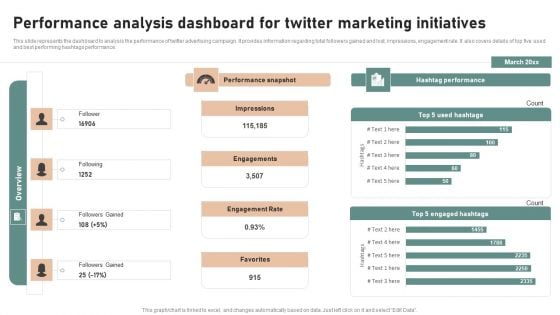
Utilizing Twitter For Social Media Performance Analysis Dashboard For Twitter Marketing Themes PDF
This slide represents the dashboard to analysis the performance of twitter advertising campaign. It provides information regarding total followers gained and lost, impressions, engagement rate. It also covers details of top five used and best performing hashtags performance. Want to ace your presentation in front of a live audience Our Utilizing Twitter For Social Media Performance Analysis Dashboard For Twitter Marketing Themes PDF can help you do that by engaging all the users towards you.. Slidegeeks experts have put their efforts and expertise into creating these impeccable powerpoint presentations so that you can communicate your ideas clearly. Moreover, all the templates are customizable, and easy-to-edit and downloadable. Use these for both personal and commercial use.
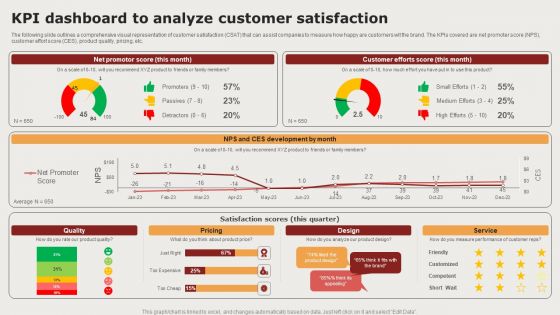
Creating Positioning Techniques For Market Research Kpi Dashboard To Analyze Customer Satisfaction Mockup PDF
The following slide outlines a comprehensive visual representation of customer satisfaction CSAT that can assist companies to measure how happy are customers wit the brand. The KPIs covered are net promoter score NPS, customer effort score CES, product quality, pricing, etc. Want to ace your presentation in front of a live audience Our Creating Positioning Techniques For Market Research Kpi Dashboard To Analyze Customer Satisfaction Mockup PDF can help you do that by engaging all the users towards you. Slidegeeks experts have put their efforts and expertise into creating these impeccable powerpoint presentations so that you can communicate your ideas clearly. Moreover, all the templates are customizable, and easy to edit and downloadable. Use these for both personal and commercial use.
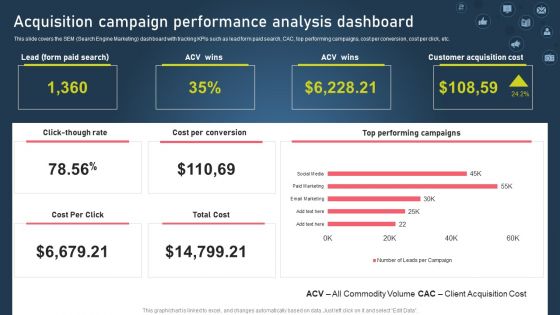
Strategies For Acquiring Online And Offline Clients Acquisition Campaign Performance Analysis Dashboard Elements PDF
This slide covers the client acquisition budget chart for allocating the required resources to a specific channel. It includes marketing channels such as SEO, PPC, social media marketing, event sponsorships, offline marketing, display, and remarketing ads. Want to ace your presentation in front of a live audience. Our Strategies For Acquiring Online And Offline Clients Acquisition Channel Budget Allocation Plan Infographics PDF can help you do that by engaging all the users towards you.. Slidegeeks experts have put their efforts and expertise into creating these impeccable powerpoint presentations so that you can communicate your ideas clearly. Moreover, all the templates are customizable, and easy-to-edit and downloadable. Use these for both personal and commercial use.
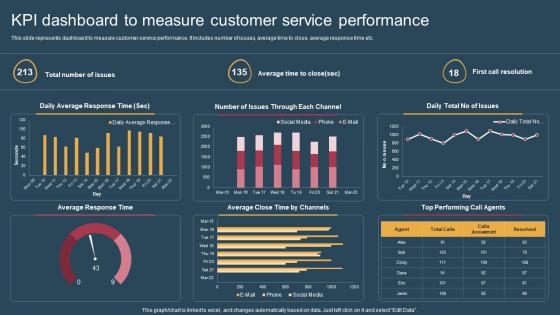
KPI Dashboard To Measure Conversion Of Customer Support Services Graphics Pdf
This slide represents dashboard to measure customer service performance. It includes number of issues, average time to close, average response time etc. Welcome to our selection of the KPI Dashboard To Measure Conversion Of Customer Support Services Graphics Pdf. These are designed to help you showcase your creativity and bring your sphere to life. Planning and Innovation are essential for any business that is just starting out. This collection contains the designs that you need for your everyday presentations. All of our PowerPoints are 100 percent editable, so you can customize them to suit your needs. This multi purpose template can be used in various situations. Grab these presentation templates today. This slide represents dashboard to measure customer service performance. It includes number of issues, average time to close, average response time etc.
Zero Trust Network Access Performance Tracking Dashboard Software Defined Perimeter SDP
This slide represents the performance tracking dashboard for zero trust network access. The purpose of this slide is to showcase the level of request modes, connected users, daily usage of the network, security rating, device risk and threat flow. The Zero Trust Network Access Performance Tracking Dashboard Software Defined Perimeter SDP is a compilation of the most recent design trends as a series of slides. It is suitable for any subject or industry presentation, containing attractive visuals and photo spots for businesses to clearly express their messages. This template contains a variety of slides for the user to input data, such as structures to contrast two elements, bullet points, and slides for written information. Slidegeeks is prepared to create an impression. This slide represents the performance tracking dashboard for zero trust network access. The purpose of this slide is to showcase the level of request modes, connected users, daily usage of the network, security rating, device risk and threat flow.


 Continue with Email

 Home
Home


