Users Dashboard
Industry Analysis For Food Manufacturing Market KPI Dashboard For Tracking Supply Chain Costs Information PDF
This slide represents the KPI Dashboard to track the Multiple Cost Associated with Supply Chain in Food Manufacturing Industry. It includes information regarding Cash to Cash Cycle in days, Carry Cost of Inventory along with details of Net Sales.Deliver an awe inspiring pitch with this creative Industry Analysis For Food Manufacturing Market KPI Dashboard For Tracking Supply Chain Costs Information PDF bundle. Topics like Carrying Inventory, Supply Costs, Supply Chain can be discussed with this completely editable template. It is available for immediate download depending on the needs and requirements of the user.
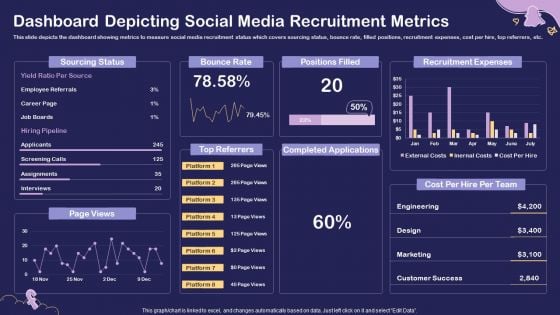
Social Media Hiring For Potential Candidate Dashboard Depicting Social Media Recruitment Structure PDF
This slide depicts the dashboard showing metrics to measure social media recruitment status which covers sourcing status, bounce rate, filled positions, recruitment expenses, cost per hire, top referrers, etc. Deliver an awe inspiring pitch with this creative Social Media Hiring For Potential Candidate Dashboard Depicting Social Media Recruitment Structure PDF bundle. Topics like Sourcing Status, Bounce Rate, Positions Filled, Recruitment Expenses can be discussed with this completely editable template. It is available for immediate download depending on the needs and requirements of the user.
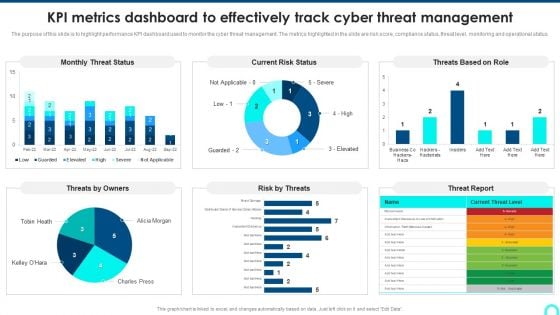
KPI Metrics Dashboard To Effectively Track Cyber Threat Management Demonstration PDF
The purpose of this slide is to highlight performance KPI dashboard used to monitor the cyber threat management. The metrics highlighted in the slide are risk score, compliance status, threat level, monitoring and operational status. Deliver an awe inspiring pitch with this creative KPI Metrics Dashboard To Effectively Track Cyber Threat Management Demonstration PDF bundle. Topics like Threat Status, Current Risk, Threat Report can be discussed with this completely editable template. It is available for immediate download depending on the needs and requirements of the user.
KPI Dashboard For Tracking Supply Chain Costs Ppt Summary Templates PDF
This slide represents the KPI dashboard to track the multiple cost associated with supply chain in food manufacturing industry. It includes information regarding cash to cash cycle in days, carry cost of inventory along with details of net sales. Deliver an awe inspiring pitch with this creative KPI Dashboard For Tracking Supply Chain Costs Ppt Summary Templates PDF bundle. Topics like Supply Chain, Costs vs Sales, Carrying Costs Inventory, Supply Chain Costs can be discussed with this completely editable template. It is available for immediate download depending on the needs and requirements of the user.
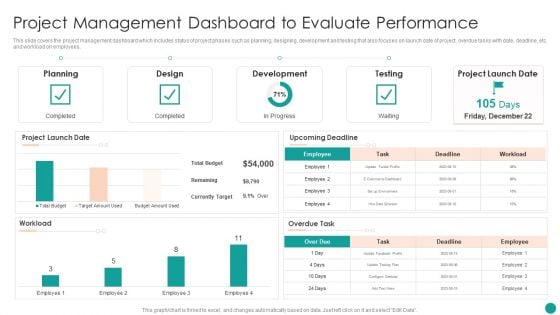
Time Management Techniques For Successful Project Project Management Dashboard To Evaluate Mockup PDF
This slide covers the project management dashboard which includes status of project phases such as planning, designing, development and testing that also focuses on launch date of project, overdue tasks with date, deadline, etc. and workload on employees.Deliver an awe inspiring pitch with this creative Time Management Techniques For Successful Project Project Management Dashboard To Evaluate Mockup PDF bundle. Topics like Development, Project Launch, Upcoming Deadline can be discussed with this completely editable template. It is available for immediate download depending on the needs and requirements of the user.
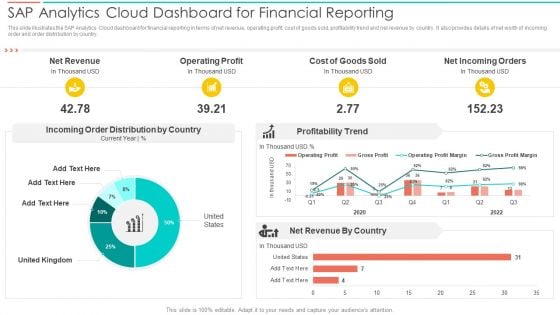
SAC Planning And Implementation SAP Analytics Cloud Dashboard For Financial Reporting Introduction PDF
This slide illustrates the SAP Analytics Cloud dashboard for financial reporting in terms of net revenue, operating profit, cost of goods sold, profitability trend and net revenue by country. It also provides details of net worth of incoming order and order distribution by country. Deliver an awe inspiring pitch with this creative SAC Planning And Implementation SAP Analytics Cloud Dashboard For Financial Reporting Introduction PDF bundle. Topics like Net Revenue, Operating Profit, Cost Goods Sold can be discussed with this completely editable template. It is available for immediate download depending on the needs and requirements of the user.
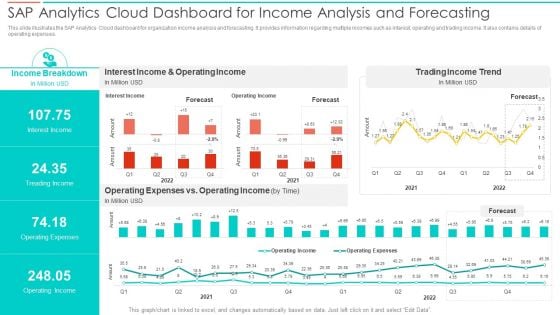
SAC Planning And Implementation SAP Analytics Cloud Dashboard For Income Analysis Summary PDF
This slide illustrates the SAP Analytics Cloud dashboard for organization income analysis and forecasting. It provides information regarding multiple incomes such as interest, operating and trading income. It also contains details of operating expenses. Deliver an awe inspiring pitch with this creative SAC Planning And Implementation SAP Analytics Cloud Dashboard For Income Analysis Summary PDF bundle. Topics like Income Breakdown, Interest Income, Operating Income, Trading Income Trend can be discussed with this completely editable template. It is available for immediate download depending on the needs and requirements of the user.
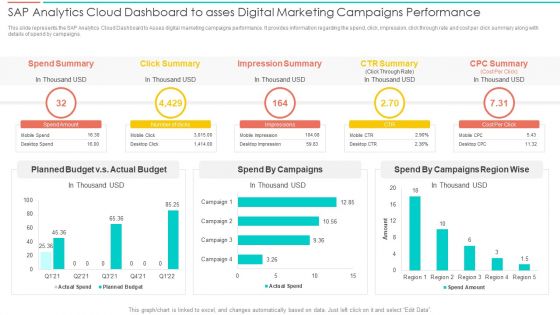
SAC Planning And Implementation SAP Analytics Cloud Dashboard To Asses Digital Marketing Pictures PDF
This slide represents the SAP Analytics Cloud Dashboard to Asses digital marketing campaigns performance. It provides information regarding the spend, click, impression, click through rate and cost per click summary along with details of spend by campaigns. Deliver an awe inspiring pitch with this creative SAC Planning And Implementation SAP Analytics Cloud Dashboard To Asses Digital Marketing Pictures PDF bundle. Topics like Spend Summary, Click Summary, Impression Summary, CTR Summary can be discussed with this completely editable template. It is available for immediate download depending on the needs and requirements of the user.
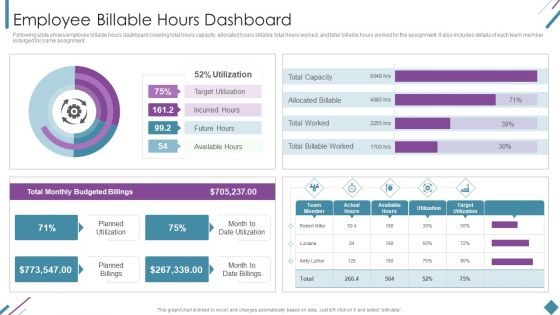
Metrics To Measure Business Performance Employee Billable Hours Dashboard Diagrams PDF
Following slide shows employee billable hours dashboard covering total hours capacity, allocated hours billable, total hours worked, and total billable hours worked for the assignment. It also includes details of each team member indulged for same assignment. Deliver an awe inspiring pitch with this creative Metrics To Measure Business Performance Employee Billable Hours Dashboard Diagrams PDF bundle. Topics like Total Monthly, Budgeted Billings, Planned Utilization can be discussed with this completely editable template. It is available for immediate download depending on the needs and requirements of the user.
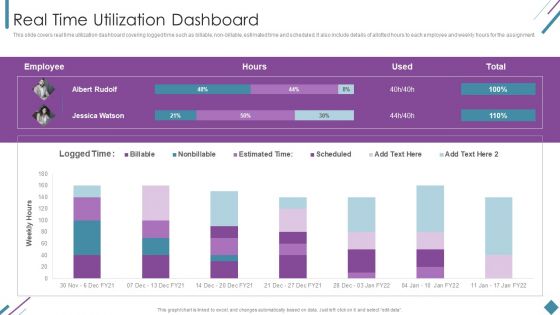
Metrics To Measure Business Performance Real Time Utilization Dashboard Topics PDF
This slide covers real time utilization dashboard covering logged time such as billable, non-billable, estimated time and scheduled. It also include details of allotted hours to each employee and weekly hours for the assignment. Deliver an awe inspiring pitch with this creative Metrics To Measure Business Performance Real Time Utilization Dashboard Topics PDF bundle. Topics like Weekly Hours, Employee, Estimated Time can be discussed with this completely editable template. It is available for immediate download depending on the needs and requirements of the user.
CRM System Deployment Plan CRM Dashboard For Tracking Sales Pipeline Pictures PDF
This slide covers the CRM KPI dashboard for monitoring lead status in the sales funnel. It includes metrics such as open pipeline value, open pipeline by product package, pipeline value forecast, etc. Deliver an awe inspiring pitch with this creative CRM System Deployment Plan CRM Dashboard For Tracking Sales Pipeline Pictures PDF bundle. Topics like Pipeline Value Forecast, Open Pipeline Value, Branding can be discussed with this completely editable template. It is available for immediate download depending on the needs and requirements of the user.
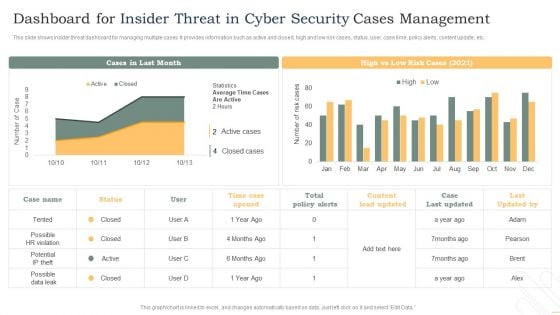
Dashboard For Insider Threat In Cyber Security Cases Management Background PDF
This slide shows insider threat dashboard for managing multiple cases. It provides information such as active and closed, high and low risk cases, status, user, case time, policy alerts, content update, etc. Showcasing this set of slides titled Dashboard For Insider Threat In Cyber Security Cases Management Background PDF. The topics addressed in these templates are Total Policy Alerts, High, Low, Time Case Opened. All the content presented in this PPT design is completely editable. Download it and make adjustments in color, background, font etc. as per your unique business setting.
Precooked Food Industry Analysis KPI Dashboard For Tracking Supply Chain Costs Diagrams PDF
This slide represents the KPI dashboard to track the multiple cost associated with supply chain in food manufacturing industry. It includes information regarding cash to cash cycle in days, carry cost of inventory along with details of net sales.Deliver an awe inspiring pitch with this creative Precooked Food Industry Analysis KPI Dashboard For Tracking Supply Chain Costs Diagrams PDF bundle. Topics like Processing Industry, Food Processing, Manufacturing Industry can be discussed with this completely editable template. It is available for immediate download depending on the needs and requirements of the user.
Implementing CRM To Optimize Dashboard Depicting Customer Retention Analytics Icons PDF
This slide shows the dashboard that depicts customer retention analytics which includes net promoter score, customer loyalty rate, customer lifetime value, customer and revenue churn, monthly recurring revenue growth, etc. Slidegeeks is one of the best resources for PowerPoint templates. You can download easily and regulate Implementing CRM To Optimize Dashboard Depicting Customer Retention Analytics Icons PDF for your personal presentations from our wonderful collection. A few clicks is all it takes to discover and get the most relevant and appropriate templates. Use our Templates to add a unique zing and appeal to your presentation and meetings. All the slides are easy to edit and you can use them even for advertisement purposes.
Essential Retail Store Activities Tracking Dashboard Buyers Preference Management Playbook Background PDF
This slide provides details regarding the dashboard for tracking retail store activities in terms of sales, conversion rate, traffic, average transaction value, recommendations, etc. Deliver and pitch your topic in the best possible manner with this Essential Retail Store Activities Tracking Dashboard Buyers Preference Management Playbook Background PDF. Use them to share invaluable insights on Ensure Staff, Predicted Power, Traffic Today and impress your audience. This template can be altered and modified as per your expectations. So, grab it now.
Improving Buyer Journey Through Strategic Customer Engagement Social Media Engagement Tracking Dashboard Structure PDF
This slide showcases a dashboard highlighting the customer engagement through social sites. it includes KPIs such as total website traffics, site revenue, fans count and followers Find highly impressive Improving Buyer Journey Through Strategic Customer Engagement Social Media Engagement Tracking Dashboard Structure PDF on Slidegeeks to deliver a meaningful presentation. You can save an ample amount of time using these presentation templates. No need to worry to prepare everything from scratch because Slidegeeks experts have already done a huge research and work for you. You need to download Improving Buyer Journey Through Strategic Customer Engagement Social Media Engagement Tracking Dashboard Structure PDF for your upcoming presentation. All the presentation templates are 100 percent editable and you can change the color and personalize the content accordingly. Download now

KPI Dashboard Of Customer And Product Sales Performance Comparison Information PDF
This slide shows the KPI dashboard of client and product sales comparison. It also includes sales by location and total sales. Pitch your topic with ease and precision using this KPI Dashboard Of Customer And Product Sales Performance Comparison Information PDF. This layout presents information on Product Sales, Client Sales, Tim Santana. It is also available for immediate download and adjustment. So, changes can be made in the color, design, graphics or any other component to create a unique layout.
Social Media In Customer Support Social Media Customer Service Tracking Dashboard Structure Pdf
This slide represents the social dashboard for tracking media customer service by covering the total number of requests and requests answered, total revenue, support costs rate to revenue rate, customer satisfaction, the average time to solve an issue, and so on. This Social Media In Customer Support Social Media Customer Service Tracking Dashboard Structure Pdf from Slidegeeks makes it easy to present information on your topic with precision. It provides customization options, so you can make changes to the colors, design, graphics, or any other component to create a unique layout. It is also available for immediate download, so you can begin using it right away. Slidegeeks has done good research to ensure that you have everything you need to make your presentation stand out. Make a name out there for a brilliant performance. This slide represents the social dashboard for tracking media customer service by covering the total number of requests and requests answered, total revenue, support costs rate to revenue rate, customer satisfaction, the average time to solve an issue, and so on.
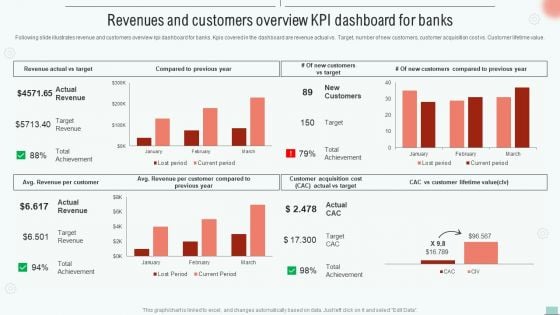
Implementing BPM Tool To Enhance Operational Efficiency Revenues And Customers Overview Kpi Dashboard Rules PDF
Following slide illustrates revenue and customers overview kpi dashboard for banks. Kpis covered in the dashboard are revenue actual vs. Target, number of new customers, customer acquisition cost vs. Customer lifetime value.This Implementing BPM Tool To Enhance Operational Efficiency Revenues And Customers Overview Kpi Dashboard Rules PDF is perfect for any presentation, be it in front of clients or colleagues. It is a versatile and stylish solution for organizing your meetings. The Implementing BPM Tool To Enhance Operational Efficiency Revenues And Customers Overview Kpi Dashboard Rules PDF features a modern design for your presentation meetings. The adjustable and customizable slides provide unlimited possibilities for acing up your presentation. Slidegeeks has done all the homework before launching the product for you. So, do not wait, grab the presentation templates today.
Maximizing Brand Growth With Umbrella Branding Activities Activity Tracking Dashboard For Umbrella Brand Icons PDF
This slide provides information regarding activities tracking dashboard for umbrella brand in terms of customer retention, market share, etc. Create an editable Maximizing Brand Growth With Umbrella Branding Activities Activity Tracking Dashboard For Umbrella Brand Icons PDF that communicates your idea and engages your audience. Whether youre presenting a business or an educational presentation, pre designed presentation templates help save time. Maximizing Brand Growth With Umbrella Branding Activities Activity Tracking Dashboard For Umbrella Brand Icons PDF is highly customizable and very easy to edit, covering many different styles from creative to business presentations. Slidegeeks has creative team members who have crafted amazing templates. So, go and get them without any delay.
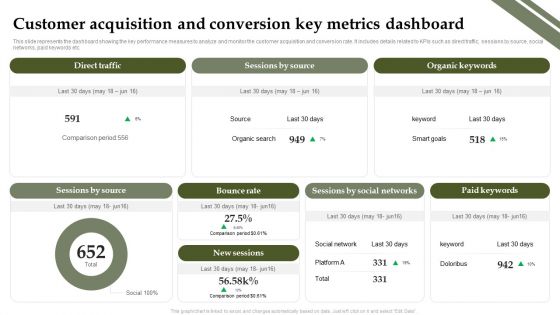
Analyzing And Deploying Effective CMS Customer Acquisition And Conversion Key Metrics Dashboard Infographics PDF
This slide represents the dashboard showing the key performance measures to analyze and monitor the customer acquisition and conversion rate. It includes details related to KPIs such as direct traffic, sessions by source, social networks, paid keywords etc. Presenting this PowerPoint presentation, titled Analyzing And Deploying Effective CMS Customer Acquisition And Conversion Key Metrics Dashboard Infographics PDF, with topics curated by our researchers after extensive research. This editable presentation is available for immediate download and provides attractive features when used. Download now and captivate your audience. Presenting this Analyzing And Deploying Effective CMS Customer Acquisition And Conversion Key Metrics Dashboard Infographics PDF. Our researchers have carefully researched and created these slides with all aspects taken into consideration. This is a completely customizable Analyzing And Deploying Effective CMS Customer Acquisition And Conversion Key Metrics Dashboard Infographics PDF that is available for immediate downloading. Download now and make an impact on your audience. Highlight the attractive features available with our PPTs.
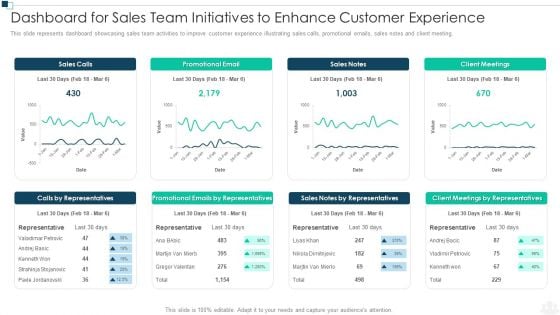
Dashboard For Sales Team Initiatives To Enhance Customer Experience Formats PDF
This slide represents dashboard showcasing sales team activities to improve customer experience illustrating sales calls, promotional emails, sales notes and client meeting. Pitch your topic with ease and precision using this dashboard for sales team initiatives to enhance customer experience formats pdf. This layout presents information on sales calls, promotional email, sales notes. It is also available for immediate download and adjustment. So, changes can be made in the color, design, graphics or any other component to create a unique layout.

Analyzing And Implementing Effective CMS Customer Acquisition And Conversion Key Metrics Dashboard Professional PDF
This slide represents the dashboard showing the key performance measures to analyze and monitor the customer acquisition and conversion rate. It includes details related to KPIs such as direct traffic, sessions by source, social networks, paid keywords etc. Presenting this PowerPoint presentation, titled Analyzing And Implementing Effective CMS Customer Acquisition And Conversion Key Metrics Dashboard Professional PDF, with topics curated by our researchers after extensive research. This editable presentation is available for immediate download and provides attractive features when used. Download now and captivate your audience. Presenting this Analyzing And Implementing Effective CMS Customer Acquisition And Conversion Key Metrics Dashboard Professional PDF. Our researchers have carefully researched and created these slides with all aspects taken into consideration. This is a completely customizable Analyzing And Implementing Effective CMS Customer Acquisition And Conversion Key Metrics Dashboard Professional PDF that is available for immediate downloading. Download now and make an impact on your audience. Highlight the attractive features available with our PPTs.
Optimizing Client Lead Handling Inbound Lead Performance Tracking Dashboard Pictures Pdf
This slide covers the KPI dashboard for evaluating inbound lead performance. It includes metrics such as lead to opportunity ratio, opportunity to win ratio, lead conversion ratio, inbound leads, and leads in the sales funnel. If you are looking for a format to display your unique thoughts, then the professionally designed Optimizing Client Lead Handling Inbound Lead Performance Tracking Dashboard Pictures Pdf is the one for you. You can use it as a Google Slides template or a PowerPoint template. Incorporate impressive visuals, symbols, images, and other charts. Modify or reorganize the text boxes as you desire. Experiment with shade schemes and font pairings. Alter, share or cooperate with other people on your work. Download Optimizing Client Lead Handling Inbound Lead Performance Tracking Dashboard Pictures Pdf and find out how to give a successful presentation. Present a perfect display to your team and make your presentation unforgettable. This slide covers the KPI dashboard for evaluating inbound lead performance. It includes metrics such as lead to opportunity ratio, opportunity to win ratio, lead conversion ratio, inbound leads, and leads in the sales funnel.
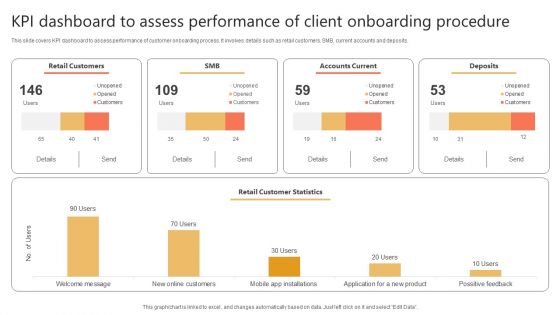
Kpi Dashboard To Assess Performance Of Client Onboarding Procedure Designs PDF
This slide covers KPI dashboard to assess performance of customer onboarding process. It involves details such as retail customers, SMB, current accounts and deposits. Showcasing this set of slides titled Kpi Dashboard To Assess Performance Of Client Onboarding Procedure Designs PDF. The topics addressed in these templates are Retail Customers, Accounts Current, Deposits. All the content presented in this PPT design is completely editable. Download it and make adjustments in color, background, font etc. as per your unique business setting.
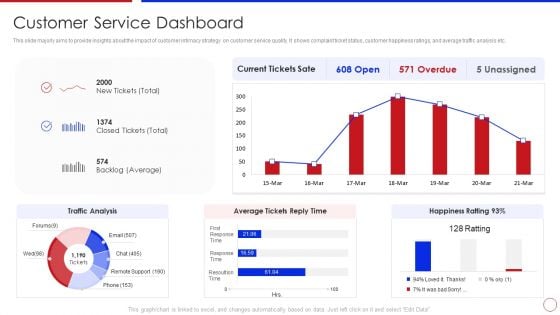
Strategy To Enhance Buyer Intimacy Customer Service Dashboard Ppt Outline Shapes PDF
This slide majorly aims to provide insights about the impact of customer intimacy strategy on customer service quality. It shows complaint ticket status, customer happiness ratings, and average traffic analysis etc. Deliver and pitch your topic in the best possible manner with this strategy to enhance buyer intimacy customer service dashboard ppt outline shapes pdf. Use them to share invaluable insights on customer service dashboard and impress your audience. This template can be altered and modified as per your expectations. So, grab it now.
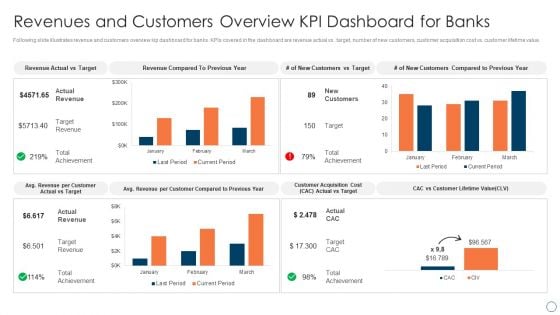
BPM Tools Application To Increase Revenues And Customers Overview KPI Dashboard For Banks Clipart PDF
Following slide illustrates revenue and customers overview kip dashboard for banks. KPIs covered in the dashboard are revenue actual vs. target, number of new customers, customer acquisition cost vs. customer lifetime value. Get a simple yet stunning designed BPM Tools Application To Increase Revenues And Customers Overview KPI Dashboard For Banks Clipart PDF. It is the best one to establish the tone in your meetings. It is an excellent way to make your presentations highly effective. So, download this PPT today from Slidegeeks and see the positive impacts. Our easy-to-edit BPM Tools Application To Increase Revenues And Customers Overview KPI Dashboard For Banks Clipart PDF can be your go-to option for all upcoming conferences and meetings. So, what are you waiting for Grab this template today.
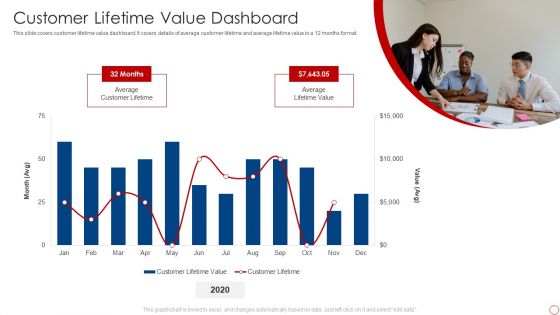
Kpis For Evaluating Business Sustainability Customer Lifetime Value Dashboard Clipart PDF
This slide covers customer lifetime value dashboard. It covers details of average customer lifetime and average lifetime value in a 12 months format. Deliver and pitch your topic in the best possible manner with this Kpis For Evaluating Business Sustainability Customer Lifetime Value Dashboard Clipart PDF. Use them to share invaluable insights on Average Customer Lifetime, Average Lifetime Value and impress your audience. This template can be altered and modified as per your expectations. So, grab it now.
Cognitive Computing Action Plan Tracking Customer Data Insights Dashboard Ppt Infographics Graphic Tips PDF
This slide provides information regarding customer data insights dashboard in terms of average churn risk, segments, high earner, highly engaged customers, etc. Deliver and pitch your topic in the best possible manner with this cognitive computing action plan tracking customer data insights dashboard ppt infographics graphic tips pdf. Use them to share invaluable insights on median lifetime spend, average churm risk, brand affinities and impress your audience. This template can be altered and modified as per your expectations. So, grab it now.
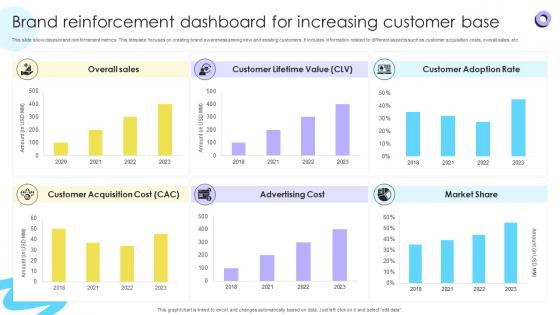
Brand Reinforcement Dashboard For Increasing Encouraging Repetitive Customer Purchase Ppt Presentation
This slide showcases brand reinforcement metrics. This template focuses on creating brand awareness among new and existing customers. It includes information related to different aspects such as customer acquisition costs, overall sales, etc. Slidegeeks is one of the best resources for PowerPoint templates. You can download easily and regulate Brand Reinforcement Dashboard For Increasing Encouraging Repetitive Customer Purchase Ppt Presentation for your personal presentations from our wonderful collection. A few clicks is all it takes to discover and get the most relevant and appropriate templates. Use our Templates to add a unique zing and appeal to your presentation and meetings. All the slides are easy to edit and you can use them even for advertisement purposes. This slide showcases brand reinforcement metrics. This template focuses on creating brand awareness among new and existing customers. It includes information related to different aspects such as customer acquisition costs, overall sales, etc.
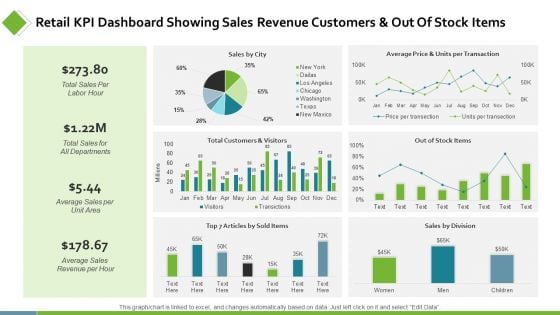
Retail KPI Dashboard Showing Sales Revenue Customers Ppt PowerPoint Presentation Show Background Designs
This is a retail kpi dashboard showing sales revenue customers ppt powerpoint presentation show background designs. This is a six stage process. The stages in this process are finance, analysis, business, investment, marketing.

Techniques To Optimize UX Customer Support Service Analysis Dashboard Template PDF
This slide exhibits customer service dashboard to improve visibility. The dashboard includes resolved and active cases, incoming cases by subject, priority, SLA status and age, CSAT and escalated case volume. Crafting an eye-catching presentation has never been more straightforward. Let your presentation shine with this tasteful yet straightforward Techniques To Optimize UX Customer Support Service Analysis Dashboard Template PDF template. It offers a minimalistic and classy look that is great for making a statement. The colors have been employed intelligently to add a bit of playfulness while still remaining professional. Construct the ideal Techniques To Optimize UX Customer Support Service Analysis Dashboard Template PDF that effortlessly grabs the attention of your audience Begin now and be certain to wow your customers.
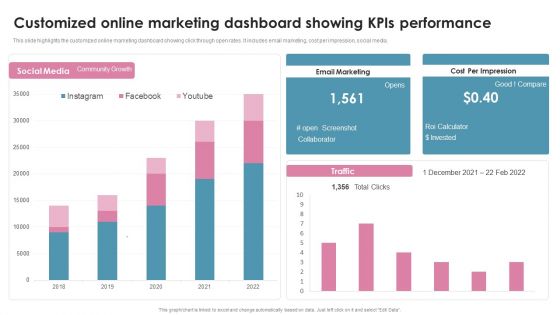
Customized Online Marketing Dashboard Showing Kpis Performance Ppt Portfolio Guidelines PDF
This slide highlights the customized online marketing dashboard showing click through open rates. It includes email marketing, cost per impression, social media. Showcasing this set of slides titled Customized Online Marketing Dashboard Showing Kpis Performance Ppt Portfolio Guidelines PDF. The topics addressed in these templates are Email Marketing, Cost Per Impression, ROI Calculator. All the content presented in this PPT design is completely editable. Download it and make adjustments in color, background, font etc. as per your unique business setting.
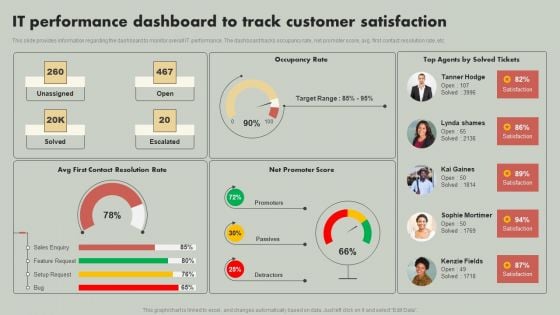
IT Reducing Costs And Management Tips IT Performance Dashboard To Track Customer Satisfaction Graphics PDF
This slide provides information regarding the dashboard to monitor overall IT performance. The dashboard tracks occupancy rate, net promoter score, avg. first contact resolution rate, etc. Formulating a presentation can take up a lot of effort and time, so the content and message should always be the primary focus. The visuals of the PowerPoint can enhance the presenters message, so our IT Reducing Costs And Management Tips IT Performance Dashboard To Track Customer Satisfaction Graphics PDF was created to help save time. Instead of worrying about the design, the presenter can concentrate on the message while our designers work on creating the ideal templates for whatever situation is needed. Slidegeeks has experts for everything from amazing designs to valuable content, we have put everything into IT Reducing Costs And Management Tips IT Performance Dashboard To Track Customer Satisfaction Graphics PDF
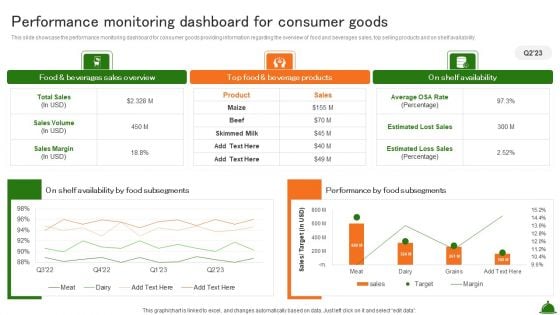
Performance Monitoring Dashboard For Consumer Goods Industry Analysis Of Food Infographics PDF
This slide showcase the performance monitoring dashboard for consumer goods providing information regarding the overview of food and beverages sales, top selling products and on shelf availability.There are so many reasons you need a Performance Monitoring Dashboard For Consumer Goods Industry Analysis Of Food Infographics PDF. The first reason is you can not spend time making everything from scratch, Thus, Slidegeeks has made presentation templates for you too. You can easily download these templates from our website easily.
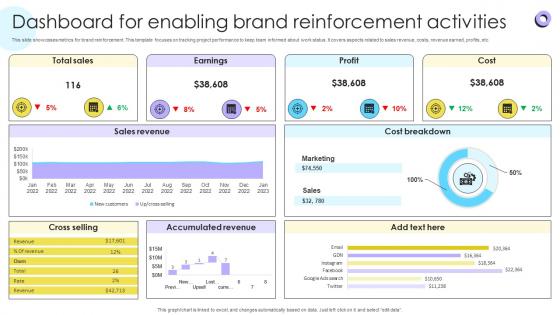
Dashboard For Enabling Brand Reinforcement Encouraging Repetitive Customer Purchase Ppt Slide
This slide showcases metrics for brand reinforcement. This template focuses on tracking project performance to keep team informed about work status. It covers aspects related to sales revenue, costs, revenue earned, profits, etc. From laying roadmaps to briefing everything in detail, our templates are perfect for you. You can set the stage with your presentation slides. All you have to do is download these easy-to-edit and customizable templates. Dashboard For Enabling Brand Reinforcement Encouraging Repetitive Customer Purchase Ppt Slide will help you deliver an outstanding performance that everyone would remember and praise you for. Do download this presentation today. This slide showcases metrics for brand reinforcement. This template focuses on tracking project performance to keep team informed about work status. It covers aspects related to sales revenue, costs, revenue earned, profits, etc.
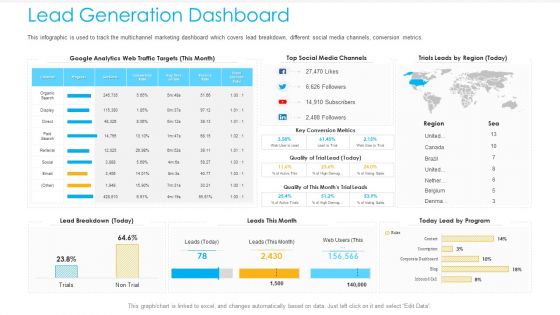
Unified Business To Consumer Marketing Strategy Lead Generation Dashboard Template PDF
This infographic is used to track the multichannel marketing dashboard which covers lead breakdown, different social media channels, conversion metrics.Deliver and pitch your topic in the best possible manner with this unified business to consumer marketing strategy lead generation dashboard template pdf. Use them to share invaluable insights on key conversion metrics, today lead by program, leads this month and impress your audience. This template can be altered and modified as per your expectations. So, grab it now.
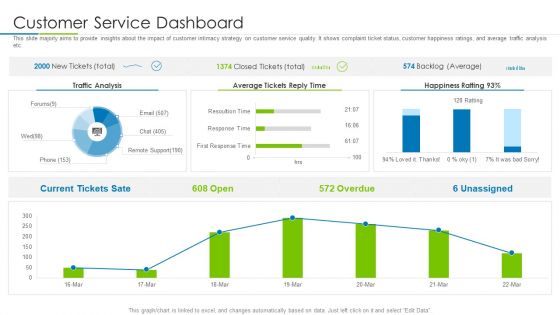
Customer Rapport Strategy To Build Loyal Client Base Customer Service Dashboard Diagrams PDF
This slide majorly aims to provide insights about the impact of customer intimacy strategy on customer service quality. It shows complaint ticket status, customer happiness ratings, and average traffic analysis etc. Deliver and pitch your topic in the best possible manner with this customer rapport strategy to build loyal client base customer service dashboard diagrams pdf. Use them to share invaluable insights on customer service dashboard and impress your audience. This template can be altered and modified as per your expectations. So, grab it now.
Online Business Client Experience Improvement Strategy Playbook Ecommerce Website Performance Tracking Dashboard Slides PDF
This slide provides information regarding ecommerce website performance tracking dashboard addressing page views, website conversions, etc. Deliver and pitch your topic in the best possible manner with this Online Business Client Experience Improvement Strategy Playbook Ecommerce Website Performance Tracking Dashboard Slides PDF. Use them to share invaluable insights on Organic Search, Bounce Rate, Customer Conversions Rate and impress your audience. This template can be altered and modified as per your expectations. So, grab it now.
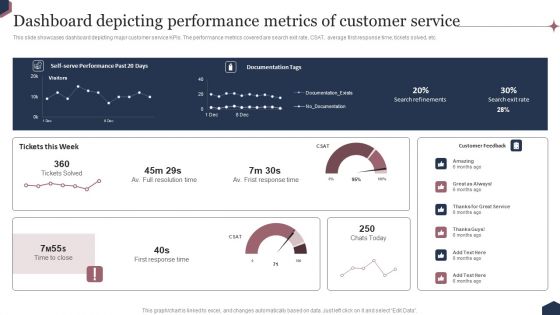
Enhance Customer Engagement Through After Sales Activities Dashboard Depicting Performance Metrics Formats PDF
This slide showcases dashboard depicting major customer service KPIs. The performance metrics covered are search exit rate, CSAT, average first response time, tickets solved, etc. There are so many reasons you need a Enhance Customer Engagement Through After Sales Activities Dashboard Depicting Performance Metrics Formats PDF. The first reason is you can not spend time making everything from scratch, Thus, Slidegeeks has made presentation templates for you too. You can easily download these templates from our website easily.
Modifying Banking Functionalities Dashboard Tracking Customer Activities And Revenue Generated Portrait PDF
This slide contains dashboard that will allow bank to track the customer activities in terms of new customer acquired, customer acquisition cost and overall revenue generated. Deliver and pitch your topic in the best possible manner with this enhancing financial institution operations dashboard tracking customer activities and revenue generated microsoft pdf. Use them to share invaluable insights on target, revenue, value, achievement and impress your audience. This template can be altered and modified as per your expectations. So, grab it now.

Refurbishing The Product Advertising Plan Customer Satisfaction Dashboard Medium Ppt Slides Professional PDF
Following slide covers customer satisfaction dashboard. Metrics included to measure the satisfaction are net promoter score, customer effort score and customer satisfaction scores.Deliver and pitch your topic in the best possible manner with this refurbishing the product advertising plan customer satisfaction dashboard medium ppt slides professional pdf. Use them to share invaluable insights on net promoter score, net effort score, quality and impress your audience. This template can be altered and modified as per your expectations. So, grab it now.
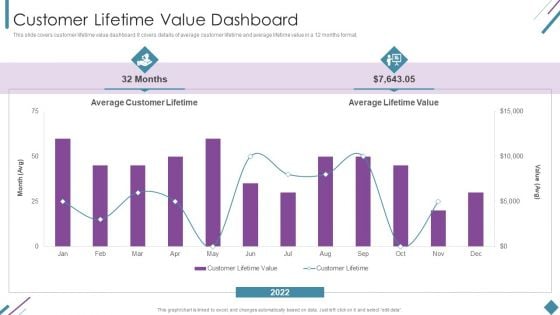
Metrics To Measure Business Performance Customer Lifetime Value Dashboard Slides PDF
This slide covers customer lifetime value dashboard. It covers details of average customer lifetime and average lifetime value in a 12 months format. Deliver and pitch your topic in the best possible manner with this Metrics To Measure Business Performance Customer Lifetime Value Dashboard Slides PDF. Use them to share invaluable insights on Average Customer Lifetime, Average Lifetime Value, 2022 and impress your audience. This template can be altered and modified as per your expectations. So, grab it now.
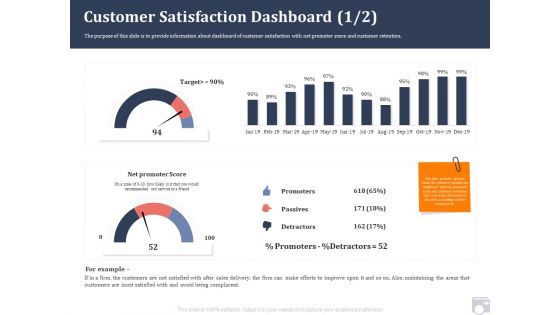
Market Share By Category Customer Satisfaction Dashboard Areas Ppt Ideas Designs Download PDF
The purpose of this slide is to provide information about dashboard of customer satisfaction with net promoter score and customer retention. Deliver and pitch your topic in the best possible manner with this market share by category customer satisfaction dashboard areas ppt ideas designs download pdf. Use them to share invaluable insights on promoters, passives, detractors, target and impress your audience. This template can be altered and modified as per your expectations. So, grab it now.
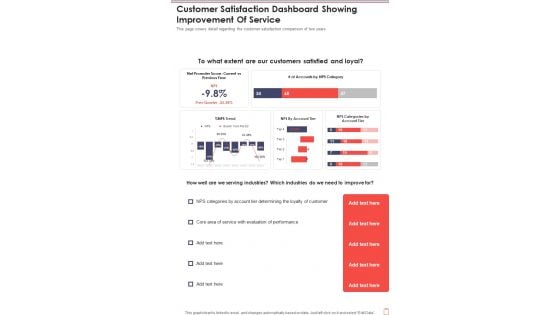
Customer Satisfaction Dashboard Showing Improvement Of Service Template 290 One Pager Documents
This page covers detail regarding the customer satisfaction comparison of two years. Presenting you a fantastic Customer Satisfaction Dashboard Showing Improvement Of Service Template 290 One Pager Documents. This piece is crafted on hours of research and professional design efforts to ensure you have the best resource. It is completely editable and its design allow you to rehash its elements to suit your needs. Get this Customer Satisfaction Dashboard Showing Improvement Of Service Template 290 One Pager Documents A4 One-pager now.

Customer Relationship Management Dashboard CRM Technology Implementation And Applications Professional PDF
This is a customer relationship management dashboard crm technology implementation and applications professional pdf template with various stages. Focus and dispense information on four stages using this creative set, that comes with editable features. It contains large content boxes to add your information on topics like technologies initiatives to improve customer relationship, crm implementation, crm application dashboard, crm assessment. You can also showcase facts, figures, and other relevant content using this PPT layout. Grab it now.
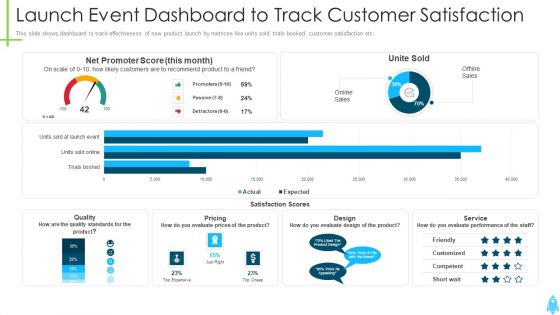
Product Kick Off Strategy Launch Event Dashboard To Track Customer Satisfaction Professional PDF
This slide shows dashboard to track effectiveness of new product launch by metrices like units sold, trials booked, customer satisfaction etc. Deliver and pitch your topic in the best possible manner with this product kick off strategy launch event dashboard to track customer satisfaction professional pdf. Use them to share invaluable insights on quality, pricing, design, service, performance and impress your audience. This template can be altered and modified as per your expectations. So, grab it now.
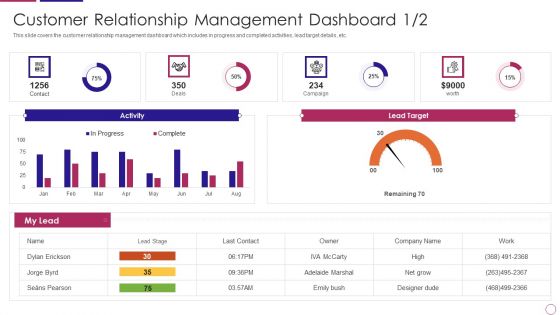
PRM To Streamline Business Processes Customer Relationship Management Dashboard Activity Themes PDF
This slide covers the customer relationship management dashboard which includes in progress and completed activities, lead target details, etc. Deliver and pitch your topic in the best possible manner with this prm to streamline business processes customer relationship management dashboard activity themes pdf. Use them to share invaluable insights on activity, lead target, campaign and impress your audience. This template can be altered and modified as per your expectations. So, grab it now.
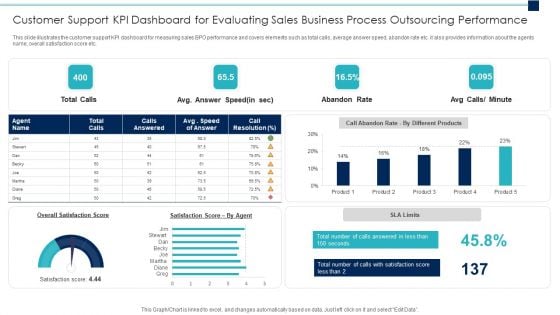
Customer Support Kpi Dashboard For Evaluating Sales Business Process Outsourcing Performance Slides PDF
Pitch your topic with ease and precision using this customer support kpi dashboard for evaluating sales business process outsourcing performance slides pdf. This layout presents information on customer support kpi dashboard for evaluating sales business process outsourcing performance. It is also available for immediate download and adjustment. So, changes can be made in the color, design, graphics or any other component to create a unique layout.
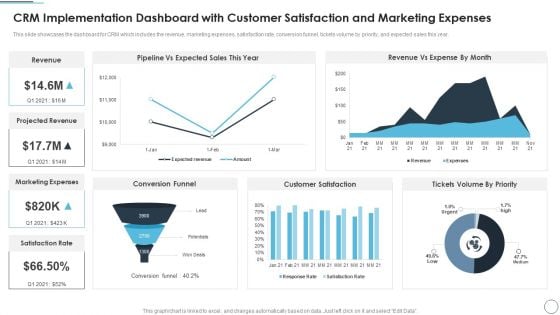
CRM Implementation Dashboard With Customer Satisfaction And Marketing Expenses Formats PDF
This slide showcases the dashboard for CRM which includes the revenue, marketing expenses, satisfaction rate, conversion funnel, tickets volume by priority, and expected sales this year.Deliver and pitch your topic in the best possible manner with this CRM Implementation Dashboard With Customer Satisfaction And Marketing Expenses Formats PDF Use them to share invaluable insights on Revenue Vs Expense, Customer Satisfaction, Conversion Funnel and impress your audience. This template can be altered and modified as per your expectations. So, grab it now.
Strategic Brand Management Customer Tracking Dashboard To Monitor Brand Loyalty Mockup PDF
This slide provides information brand loyalty tracking dashboard in order to monitor customer engagement, average revenues, new vs. returning visitors performance, etc. Deliver and pitch your topic in the best possible manner with this Strategic Brand Management Customer Tracking Dashboard To Monitor Brand Loyalty Mockup PDF. Use them to share invaluable insights on Avg Revenue, Visit Frequency, Returning Visitors, Value Comparison and impress your audience. This template can be altered and modified as per your expectations. So, grab it now.

Customer Relationship Management Lifecycle Analytics Dashboard With Sales Record Brochure PDF
This slide signifies the customer relationship management analytics dashboard. It covers information about sales record by different representative, total products sold, sales by different month, etc.Pitch your topic with ease and precision using this Customer Relationship Management Lifecycle Analytics Dashboard With Sales Record Brochure PDF. This layout presents information on Sales Record, Representative, Total Items. It is also available for immediate download and adjustment. So, changes can be made in the color, design, graphics or any other component to create a unique layout.
CRM Pipeline Administration Customer Deal Tracking In Sales Pipeline Dashboard Ppt Inspiration Template PDF
This slide covers information regarding dashboard for tracking various customer deals in sales pipeline. From laying roadmaps to briefing everything in detail, our templates are perfect for you. You can set the stage with your presentation slides. All you have to do is download these easy-to-edit and customizable templates. CRM Pipeline Administration Customer Deal Tracking In Sales Pipeline Dashboard Ppt Inspiration Template PDF will help you deliver an outstanding performance that everyone would remember and praise you for. Do download this presentation today.
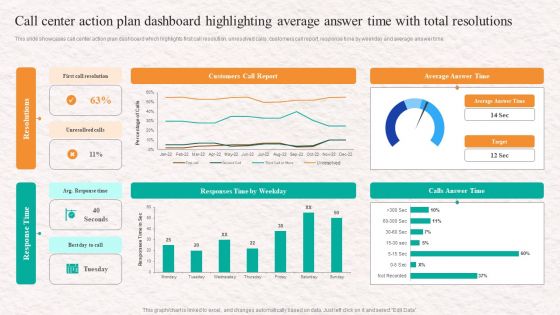
Customer Service Agent Performance Call Center Action Plan Dashboard Highlighting Designs PDF
This slide showcases call center action plan dashboard which highlights first call resolution, unresolved calls, customers call report, response time by weekday and average answer time. There are so many reasons you need a Customer Service Agent Performance Call Center Action Plan Dashboard Highlighting Designs PDF. The first reason is you cant spend time making everything from scratch, Thus, Slidegeeks has made presentation templates for you too. You can easily download these templates from our website easily.
Icon For Activity Management And Revenue Customer Relationship Management Dashboard Slides PDF
Persuade your audience using this Icon For Activity Management And Revenue Customer Relationship Management Dashboard Slides PDF. This PPT design covers three stages, thus making it a great tool to use. It also caters to a variety of topics including Icon For Activity Management, Revenue Customer Relationship, Management Dashboard. Download this PPT design now to present a convincing pitch that not only emphasizes the topic but also showcases your presentation skills.
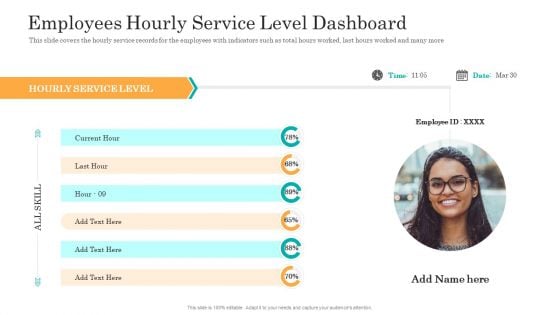
Consumer Complaint Handling Process Employees Hourly Service Level Dashboard Ppt Summary Inspiration PDF
This slide covers the hourly service records for the employees with indicators such as total hours worked, last hours worked and many more. Deliver and pitch your topic in the best possible manner with this consumer complaint handling process employees hourly service level dashboard ppt summary inspiration pdf. Use them to share invaluable insights on employees hourly service level dashboard and impress your audience. This template can be altered and modified as per your expectations. So, grab it now.
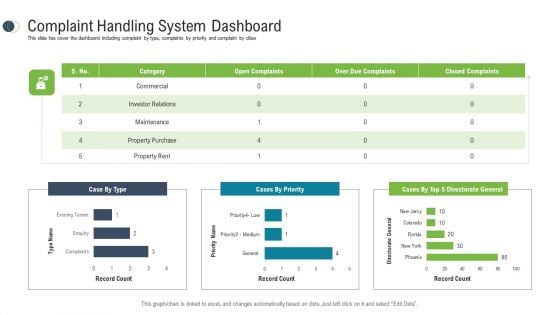
Consumer Complaint Procedure Complaint Handling System Dashboard Ppt Ideas Example File PDF
This slide has cover the dashboard including complaint by type, complaints by priority and complaint by cities. Deliver and pitch your topic in the best possible manner with this consumer complaint procedure complaint handling system dashboard ppt ideas example file pdf. Use them to share invaluable insights on commercial, investor relations, property purchase, cases by priority, property rent and impress your audience. This template can be altered and modified as per your expectations. So, grab it now.
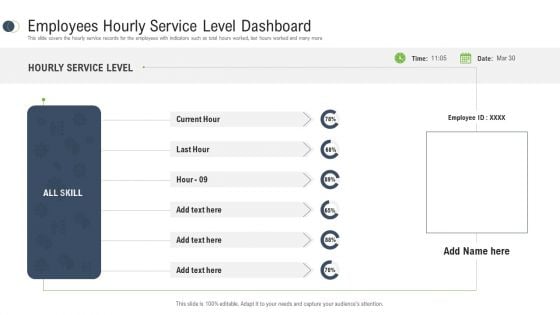
Consumer Complaint Procedure Employees Hourly Service Level Dashboard Ppt Infographics Professional PDF
This slide covers the hourly service records for the employees with indicators such as total hours worked, last hours worked and many more. Deliver and pitch your topic in the best possible manner with this consumer complaint procedure employees hourly service level dashboard ppt infographics professional pdf. Use them to share invaluable insights on employees hourly service level dashboard, hourly service level, skill and impress your audience. This template can be altered and modified as per your expectations. So, grab it now.
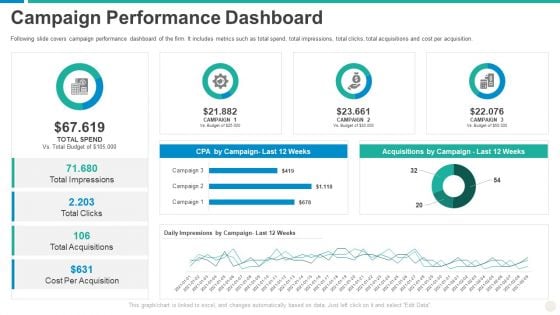
Establishing Successful Brand Strategy To Captivate Consumers Campaign Performance Dashboard Background PDF
Following slide covers campaign performance dashboard of the firm. It includes metrics such as total spend, total impressions, total clicks, total acquisitions and cost per acquisition. Deliver and pitch your topic in the best possible manner with this establishing successful brand strategy to captivate consumers campaign performance dashboard background pdf. Use them to share invaluable insights on campaign, acquisitions, budget, cost and impress your audience. This template can be altered and modified as per your expectations. So, grab it now.
Consumer Journey Mapping Techniques Dashboard For Tracking Website Performance Graphics PDF
This slide covers the KPI dashboard for analyzing the company website. It includes metrics such as conversions, conversion rate, sessions, stickiness, bounce rate, engagement, etc. Showcasing this set of slides titled Consumer Journey Mapping Techniques Dashboard For Tracking Website Performance Graphics PDF. The topics addressed in these templates are Bounce Rate, Organic, Conversions Rate. All the content presented in this PPT design is completely editable. Download it and make adjustments in color, background, font etc. as per your unique business setting.


 Continue with Email

 Home
Home


