Users Dashboard
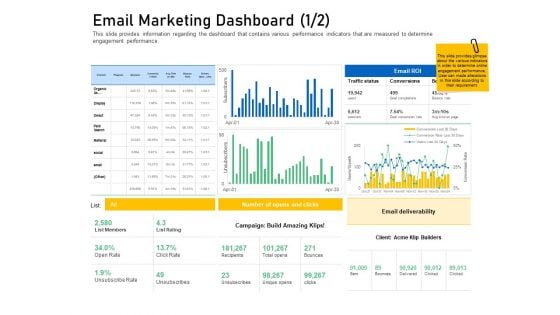
Enhancing Customer Engagement Digital Platform Email Marketing Dashboard Click Information PDF
Deliver and pitch your topic in the best possible manner with this enhancing customer engagement digital platform email marketing dashboard click information pdf. Use them to share invaluable insights on campaign, traffic status, social, organic, paid search and impress your audience. This template can be altered and modified as per your expectations. So, grab it now.
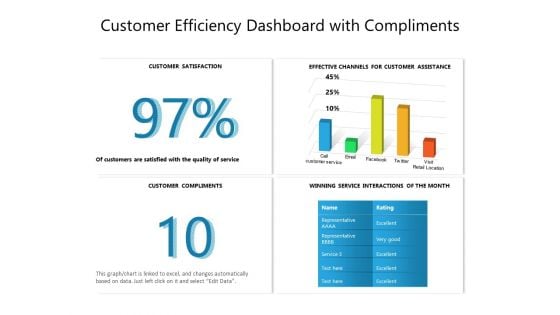
Customer Efficiency Dashboard With Compliments Ppt PowerPoint Presentation File Formats PDF
Pitch your topic with ease and precision using this customer efficiency dashboard with compliments ppt powerpoint presentation file formats pdf. This layout presents information on service, effective, interactions. It is also available for immediate download and adjustment. So, changes can be made in the color, design, graphics or any other component to create a unique layout.
Enhancing Financial Institution Operations Dashboard Tracking Customer Activities And Revenue Generated Microsoft PDF
Deliver and pitch your topic in the best possible manner with this enhancing financial institution operations dashboard tracking customer activities and revenue generated microsoft pdf. Use them to share invaluable insights on target, revenue, value, achievement and impress your audience. This template can be altered and modified as per your expectations. So, grab it now.
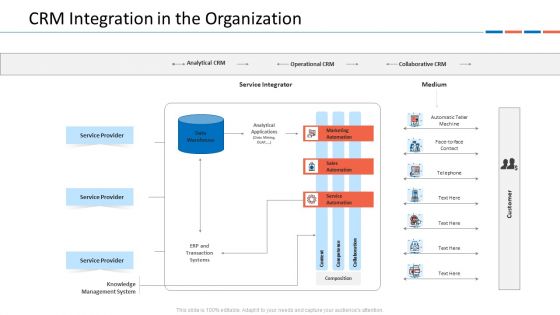
Customer Relationship Management Dashboard CRM Integration In The Organization Structure PDF
Deliver and pitch your topic in the best possible manner with this customer relationship management dashboard crm integration in the organization structure pdf. Use them to share invaluable insights on service provider, knowledge management system, erp and transaction systems, service integrator and impress your audience. This template can be altered and modified as per your expectations. So, grab it now.
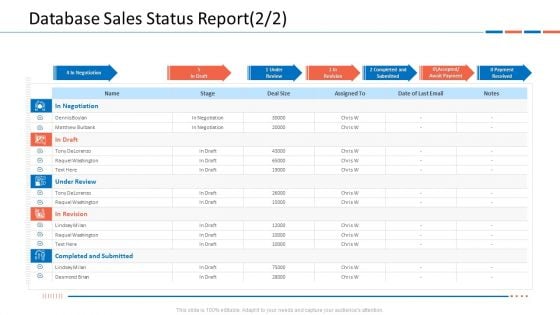
Customer Relationship Management Dashboard Database Sales Status Report Size Introduction PDF
Deliver and pitch your topic in the best possible manner with this customer relationship management dashboard database sales status report size introduction pdf. Use them to share invaluable insights on in negotiation, under review, in revision, completed and submitted, desmond brian and impress your audience. This template can be altered and modified as per your expectations. So, grab it now.
Customer Attrition Rate Dashboard For IBN Outsourcing Company Ppt Icon PDF
Deliver and pitch your topic in the best possible manner with this customer attrition rate dashboard for ibn outsourcing company ppt icon pdf. Use them to share invaluable insights on operational efficiency 2021, product service adoption rate 2021, annual growth rate 2021 and impress your audience. This template can be altered and modified as per your expectations. So, grab it now.
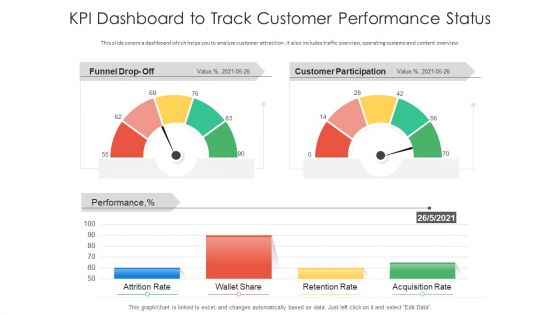
Kpi Dashboard To Track Customer Performance Status Ppt PowerPoint Presentation Inspiration Shapes PDF
Pitch your topic with ease and precision using this kpi dashboard to track customer performance status ppt powerpoint presentation inspiration shapes pdf. This layout presents information on attrition rate, wallet share, retention rate. It is also available for immediate download and adjustment. So, changes can be made in the color, design, graphics or any other component to create a unique layout.
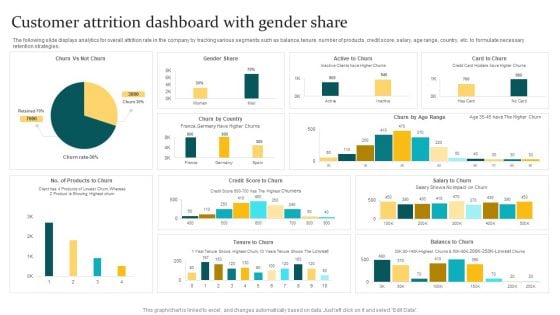
Customer Attrition Dashboard With Gender Share Ppt PowerPoint Presentation Gallery Slide Download PDF
Pitch your topic with ease and precision using this Customer Attrition Dashboard With Gender Share Ppt PowerPoint Presentation Gallery Slide Download PDF. This layout presents information on Gender Share, Product Showing, Shows Highest. It is also available for immediate download and adjustment. So, changes can be made in the color, design, graphics or any other component to create a unique layout.
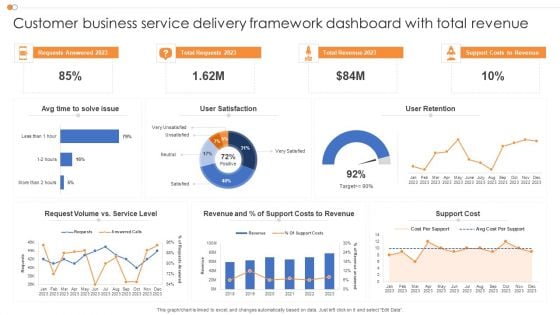
Customer Business Service Delivery Framework Dashboard With Total Revenue Structure PDF
Pitch your topic with ease and precision using this Customer Business Service Delivery Framework Dashboard With Total Revenue Structure PDF. This layout presents information on Requests Answered, Total Requests, Total Revenue. It is also available for immediate download and adjustment. So, changes can be made in the color, design, graphics or any other component to create a unique layout.
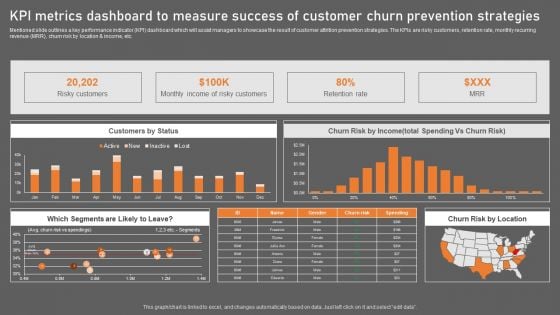
KPI Metrics Dashboard To Measure Success Of Customer Churn Prevention Strategies Structure PDF
There are so many reasons you need a KPI Metrics Dashboard To Measure Success Of Customer Churn Prevention Strategies Structure PDF. The first reason is you can not spend time making everything from scratch, Thus, Slidegeeks has made presentation templates for you too. You can easily download these templates from our website easily.

Step 7 Monitor Analytics Implementation For Inventory Using Dashboard Data Analytics SS V
This slide provides a dashboard highlighting inventory performance aimed at helping businesses streamline operations. It covers details on sales orders, invoices, order value, invoice amount, YTD invoice value and sales growth. Welcome to our selection of the Step 7 Monitor Analytics Implementation For Inventory Using Dashboard Data Analytics SS V. These are designed to help you showcase your creativity and bring your sphere to life. Planning and Innovation are essential for any business that is just starting out. This collection contains the designs that you need for your everyday presentations. All of our PowerPoints are 100 percent editable, so you can customize them to suit your needs. This multi-purpose template can be used in various situations. Grab these presentation templates today. This slide provides a dashboard highlighting inventory performance aimed at helping businesses streamline operations. It covers details on sales orders, invoices, order value, invoice amount, YTD invoice value and sales growth.
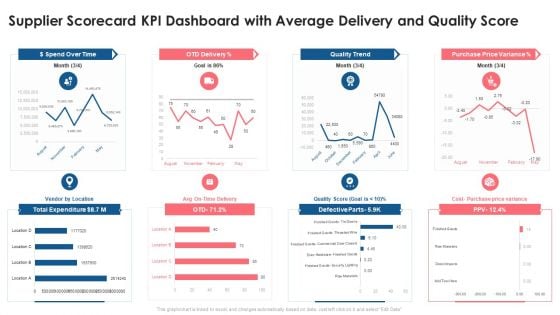
Supplier Scorecard Supplier Scorecard KPI Dashboard With Average Delivery And Quality Score Introduction PDF
This graph or chart is linked to excel, and changes automatically based on data. Just left click on it and select Edit Data. Deliver an awe inspiring pitch with this creative supplier scorecard supplier scorecard kpi dashboard with average delivery and quality score introduction pdf bundle. Topics like dollar spend over time, otd delivery, quality trend, purchase price variance, total expenditure can be discussed with this completely editable template. It is available for immediate download depending on the needs and requirements of the user.
Virtual WAN Architecture SD WAN Network Performance Tracking Dashboard Designs PDF
This slide represents the SD-WAN network performance tracking dashboard. The purpose of this slide is to demonstrate the performance of the SD-WAN network. The main components include control status, site health, transport interface distribution, WAN edge inventory, edge health, and so on. Crafting an eye-catching presentation has never been more straightforward. Let your presentation shine with this tasteful yet straightforward Virtual WAN Architecture SD WAN Network Performance Tracking Dashboard Designs PDF template. It offers a minimalistic and classy look that is great for making a statement. The colors have been employed intelligently to add a bit of playfulness while still remaining professional. Construct the ideal Virtual WAN Architecture SD WAN Network Performance Tracking Dashboard Designs PDF that effortlessly grabs the attention of your audience Begin now and be certain to wow your customers.
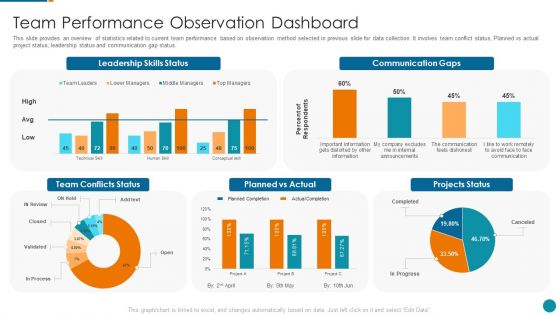
Strategic Procedure To Improve Employee Efficiency Team Performance Observation Dashboard Formats PDF
This slide provides an overview of statistics related to current team performance based on observation method selected in previous slide for data collection. It involves team conflict status, Planned vs actual project status, leadership status and communication gap status.Deliver an awe inspiring pitch with this creative strategic procedure to improve employee efficiency team performance observation dashboard formats pdf bundle. Topics like leadership skills status, communication gaps, planned vs actual can be discussed with this completely editable template. It is available for immediate download depending on the needs and requirements of the user.
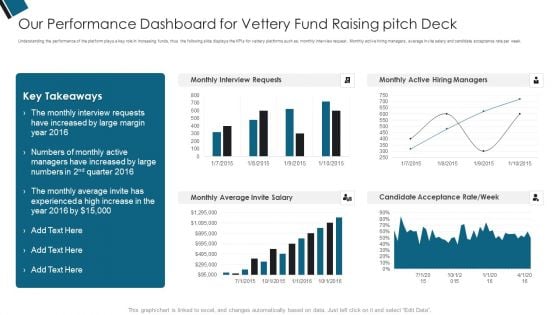
Our Performance Dashboard For Vettery Fund Raising Pitch Deck Ppt PowerPoint Presentation Professional Background PDF
Understanding the performance of the platform plays a key role in increasing funds, thus the following slide displays the KPIs for vettery platforms such as monthly interview request , Monthly active hiring managers, average invite salary and candidate acceptance rate per week. Deliver an awe inspiring pitch with this creative Our Performance Dashboard For Vettery Fund Raising Pitch Deck Ppt PowerPoint Presentation Professional Background PDF bundle. Topics like Monthly Interview, Managers Increased, Experienced A High can be discussed with this completely editable template. It is available for immediate download depending on the needs and requirements of the user.
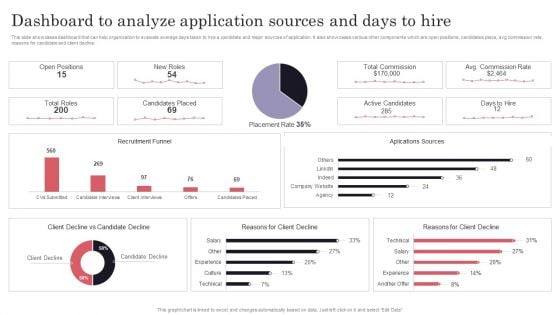
Developing Recruitment Dashboard To Analyze Application Sources And Days To Hire Clipart PDF
This slide showcases dashboard that can help organization to evaluate average days taken to hire a candidate and major sources of application. It also showcases various other components which are open positions, candidates place, avg commission rate, reasons for candidate and client decline. Get a simple yet stunning designed Developing Recruitment Dashboard To Analyze Application Sources And Days To Hire Clipart PDF. It is the best one to establish the tone in your meetings. It is an excellent way to make your presentations highly effective. So, download this PPT today from Slidegeeks and see the positive impacts. Our easy-to-edit Developing Recruitment Dashboard To Analyze Application Sources And Days To Hire Clipart PDF can be your go-to option for all upcoming conferences and meetings. So, what are you waiting for Grab this template today.
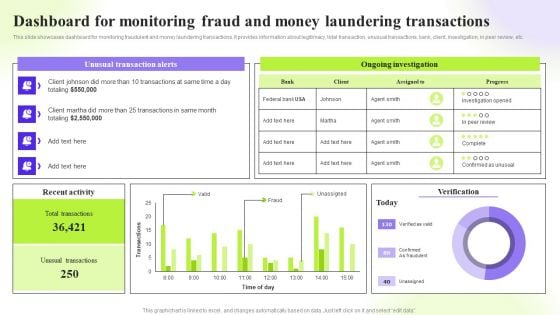
Techniques To Monitor Transactions Dashboard For Monitoring Fraud And Money Laundering Demonstration PDF
This slide showcases dashboard for monitoring fraudulent and money laundering transactions. It provides information about legitimacy, total transaction, unusual transactions, bank, client, investigation, in peer review, etc. Whether you have daily or monthly meetings, a brilliant presentation is necessary. Techniques To Monitor Transactions Dashboard For Monitoring Fraud And Money Laundering Demonstration PDF can be your best option for delivering a presentation. Represent everything in detail using Techniques To Monitor Transactions Dashboard For Monitoring Fraud And Money Laundering Demonstration PDF and make yourself stand out in meetings. The template is versatile and follows a structure that will cater to your requirements. All the templates prepared by Slidegeeks are easy to download and edit. Our research experts have taken care of the corporate themes as well. So, give it a try and see the results.
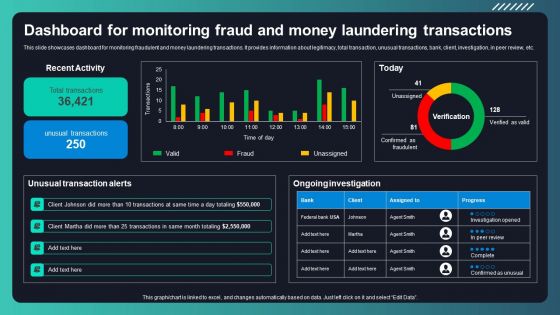
Deploying AML Transaction Monitoring Dashboard For Monitoring Fraud And Money Rules PDF
This slide showcases dashboard for monitoring fraudulent and money laundering transactions. It provides information about legitimacy, total transaction, unusual transactions, bank, client, investigation, in peer review, etc. Do you have an important presentation coming up Are you looking for something that will make your presentation stand out from the rest Look no further than Deploying AML Transaction Monitoring Dashboard For Monitoring Fraud And Money Rules PDF. With our professional designs, you can trust that your presentation will pop and make delivering it a smooth process. And with Slidegeeks, you can trust that your presentation will be unique and memorable. So why wait Grab Deploying AML Transaction Monitoring Dashboard For Monitoring Fraud And Money Rules PDF today and make your presentation stand out from the rest.
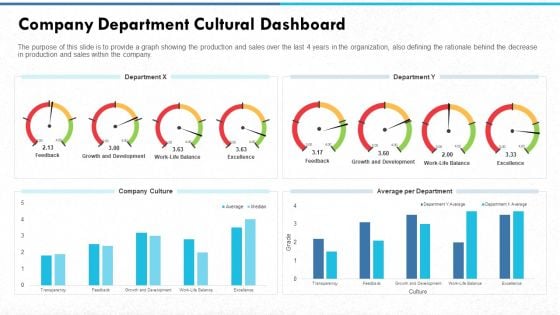
Managing Strong Company Culture In Business Company Department Cultural Dashboard Sample PDF
The purpose of this slide is to provide a graph showing the production and sales over the last 4 years in the organization, also defining the rationale behind the decrease in production and sales within the company. Deliver an awe-inspiring pitch with this creative managing strong company culture in business company department cultural dashboard sample pdf. bundle. Topics like company culture, average per department, department y, department x can be discussed with this completely editable template. It is available for immediate download depending on the needs and requirements of the user.
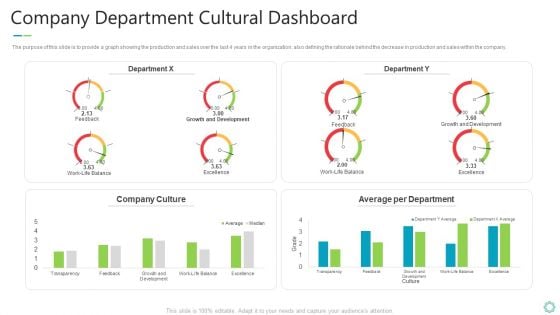
Transforming Organizational Processes And Outcomes Company Department Cultural Dashboard Introduction PDF
The purpose of this slide is to provide a graph showing the production and sales over the last 4 years in the organization, also defining the rationale behind the decrease in production and sales within the company. Deliver an awe inspiring pitch with this creative transforming organizational processes and outcomes company department cultural dashboard introduction pdf bundle. Topics like growth, development, excellence, culture can be discussed with this completely editable template. It is available for immediate download depending on the needs and requirements of the user.

Internal And External Logistics Management Procedure Warehouse Management System WMS Dashboard Grid Slides PDF
The purpose of this slide is to provide a glimpse of the problems faced by our logistic company at present such as fuel costs, lack of technology, government regulations, inventory management etc. Deliver an awe inspiring pitch with this creative internal and external logistics management procedure warehouse management system wms dashboard grid slides pdf bundle. Topics like order status graph, warehouse capacity, transactions today can be discussed with this completely editable template. It is available for immediate download depending on the needs and requirements of the user.
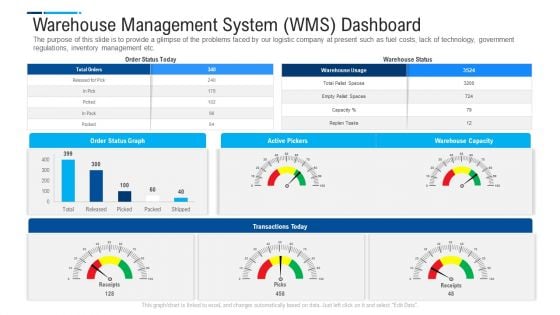
Internal And External Logistics Management Procedure Warehouse Management System WMS Dashboard Download PDF
The purpose of this slide is to provide a glimpse of the problems faced by our logistic company at present such as fuel costs, lack of technology, government regulations, inventory management etc. Deliver an awe inspiring pitch with this creative internal and external logistics management procedure warehouse management system wms dashboard download pdf bundle. Topics like inbound functions, outbound functions, lines processed can be discussed with this completely editable template. It is available for immediate download depending on the needs and requirements of the user.
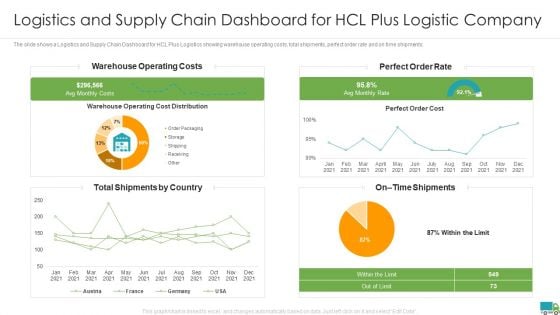
Generating Logistics Value Business Logistics And Supply Chain Dashboard For Hcl Plus Logistic Company Microsoft PDF
The slide shows a Logistics and Supply Chain Dashboard for HCL Plus Logistics showing warehouse operating costs, total shipments, perfect order rate and on time shipments. Deliver an awe inspiring pitch with this creative generating logistics value business latest logistic technologies that can form unique valuable proposition pictures pdf bundle. Topics like warehouse operating costs, perfect order rate, total shipments by country can be discussed with this completely editable template. It is available for immediate download depending on the needs and requirements of the user.
Sales Process Catalogue Template Sales Management Activities Tracking Dashboard Summary PDF
This slide provides information regarding various metrics catered to track sales team performance in terms of average revenue per account, win rate, NPS, along with sales representative performance tracking through number of opportunities created, lead response time, etc. Deliver an awe inspiring pitch with this creative sales process catalogue template sales management activities tracking dashboard summary pdf bundle. Topics like sales pipeline, sales activity by sales rep, sales pipeline by sales rep, closed business, month over month growth, forecast by month can be discussed with this completely editable template. It is available for immediate download depending on the needs and requirements of the user.
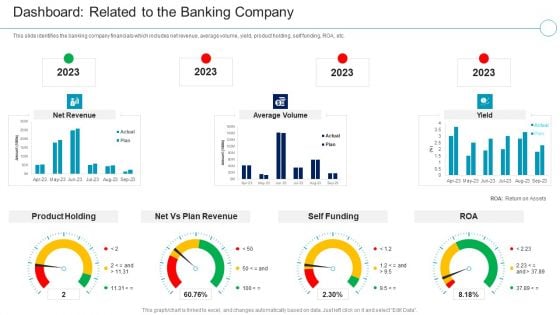
Financial Services Enterprise Transformation Dashboard Related To The Banking Company Information PDF
This slide shows the company financials Total Branches and Total R and D Expenses of ABC Bank. It includes the financials before the implementation of strategies for the years 2019 to 2023 with key notes.Deliver an awe inspiring pitch with this creative Financial Services Enterprise Transformation Dashboard Related To The Banking Company Information PDF bundle. Topics like Company Financials Before The Implementation Of Strategies can be discussed with this completely editable template. It is available for immediate download depending on the needs and requirements of the user.
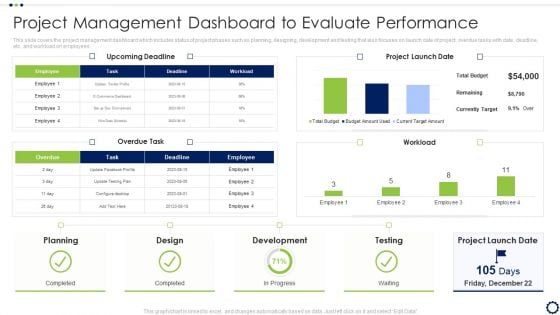
Coordinating Distinct Activities For Effective Project Time Management Project Management Dashboard Clipart PDF
This slide focuses on project communication plan to maintain transparency across project activities which covers communication method, goal, owner, frequency and audience that will help project team to remain updated regarding project progress.Deliver an awe inspiring pitch with this creative Coordinating Distinct Activities For Effective Project Time Management Project Management Dashboard Clipart PDF bundle. Topics like Upcoming Deadline, Currently Target, Development can be discussed with this completely editable template. It is available for immediate download depending on the needs and requirements of the user.
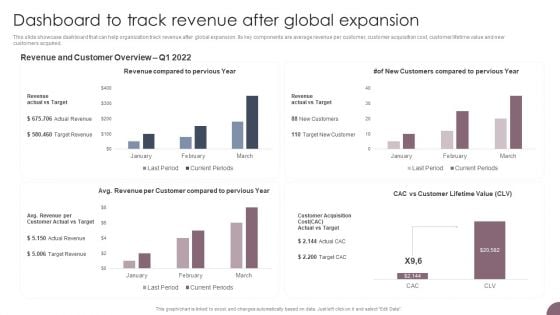
International Business Extension Dashboard To Track Revenue After Global Expansion Introduction PDF
This slide showcase dashboard that can help organization track revenue after global expansion. Its key components are average revenue per customer, customer acquisition cost, customer lifetime value and new customers acquired. Crafting an eye-catching presentation has never been more straightforward. Let your presentation shine with this tasteful yet straightforward International Business Extension Dashboard To Track Revenue After Global Expansion Introduction PDF template. It offers a minimalistic and classy look that is great for making a statement. The colors have been employed intelligently to add a bit of playfulness while still remaining professional. Construct the ideal International Business Extension Dashboard To Track Revenue After Global Expansion Introduction PDF that effortlessly grabs the attention of your audience Begin now and be certain to wow your customers.
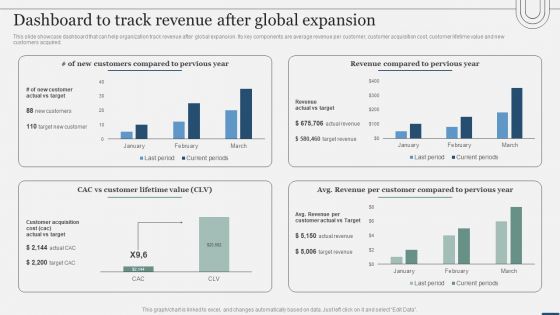
Assessing International Market Dashboard To Track Revenue After Global Expansion Template PDF
This slide showcase dashboard that can help organization track revenue after global expansion. Its key components are average revenue per customer, customer acquisition cost, customer lifetime value and new customers acquired. Crafting an eye-catching presentation has never been more straightforward. Let your presentation shine with this tasteful yet straightforward Assessing International Market Dashboard To Track Revenue After Global Expansion Template PDF template. It offers a minimalistic and classy look that is great for making a statement. The colors have been employed intelligently to add a bit of playfulness while still remaining professional. Construct the ideal Assessing International Market Dashboard To Track Revenue After Global Expansion Template PDF that effortlessly grabs the attention of your audience Begin now and be certain to wow your customers.
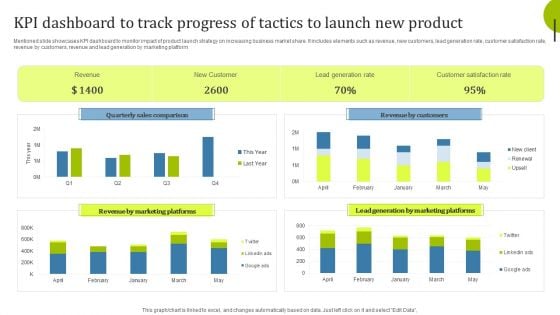
Kpi Dashboard To Track Progress Of Tactics To Launch New Product Infographics PDF
Mentioned slide showcases KPI dashboard to monitor impact of product launch strategy on increasing business market share. It includes elements such as revenue, new customers, lead generation rate, customer satisfaction rate, revenue by customers, revenue and lead generation by marketing platform. Showcasing this set of slides titled Kpi Dashboard To Track Progress Of Tactics To Launch New Product Infographics PDF. The topics addressed in these templates are Quarterly Sales Comparison, Revenue Marketing, Revenue Customers. All the content presented in this PPT design is completely editable. Download it and make adjustments in color, background, font etc. as per your unique business setting.
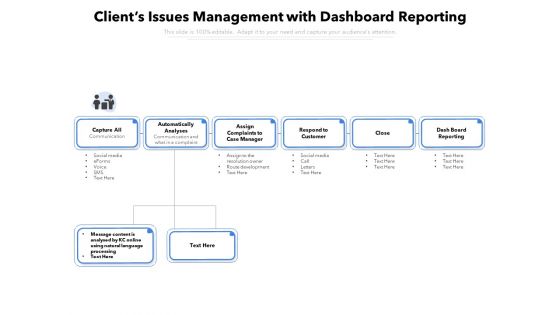
Clients Issues Management With Dashboard Reporting Ppt PowerPoint Presentation File Example PDF
Presenting this set of slides with name clients issues management with dashboard reporting ppt powerpoint presentation file example pdf. The topics discussed in these slides are analyses, processing, assign. This is a completely editable PowerPoint presentation and is available for immediate download. Download now and impress your audience.
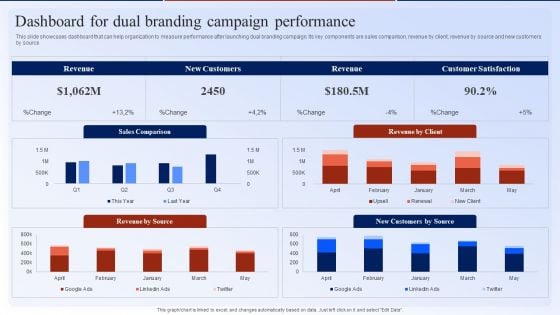
Dashboard For Dual Branding Campaign Performance Dual Branding Marketing Campaign Diagrams PDF
This slide showcases dashboard that can help organization to measure performance after launching dual branding campaign. Its key components are sales comparison, revenue by client, revenue by source and new customers by source. Here you can discover an assortment of the finest PowerPoint and Google Slides templates. With these templates, you can create presentations for a variety of purposes while simultaneously providing your audience with an eye-catching visual experience. Download Dashboard For Dual Branding Campaign Performance Dual Branding Marketing Campaign Diagrams PDF to deliver an impeccable presentation. These templates will make your job of preparing presentations much quicker, yet still, maintain a high level of quality. Slidegeeks has experienced researchers who prepare these templates and write high-quality content for you. Later on, you can personalize the content by editing the Dashboard For Dual Branding Campaign Performance Dual Branding Marketing Campaign Diagrams PDF.
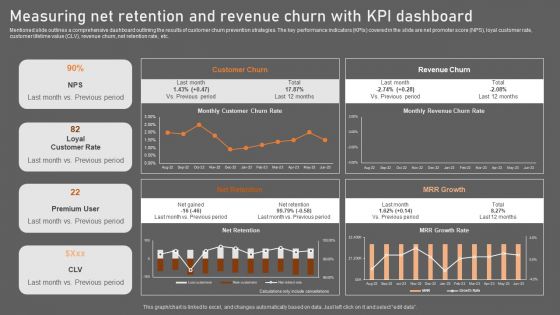
Measuring Net Retention And Revenue Churn With KPI Dashboard Introduction PDF
Mentioned slide outlines a comprehensive dashboard outlining the results of customer churn prevention strategies. The key performance indicators KPIs covered in the slide are net promoter score NPS, loyal customer rate, customer lifetime value CLV, revenue churn, net retention rate, etc. Do you have to make sure that everyone on your team knows about any specific topic I yes, then you should give Measuring Net Retention And Revenue Churn With KPI Dashboard Introduction PDF a try. Our experts have put a lot of knowledge and effort into creating this impeccable Measuring Net Retention And Revenue Churn With KPI Dashboard Introduction PDF. You can use this template for your upcoming presentations, as the slides are perfect to represent even the tiniest detail. You can download these templates from the Slidegeeks website and these are easy to edit. So grab these today.
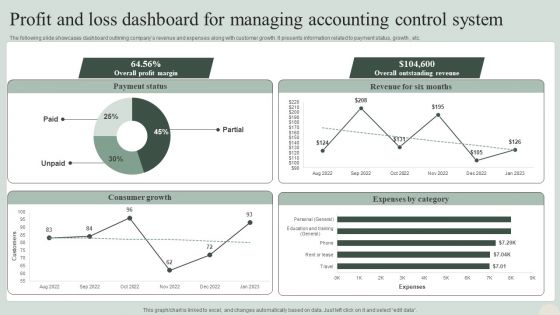
Profit And Loss Dashboard For Managing Accounting Control System Information PDF
The following slide showcases dashboard outlining companys revenue and expenses along with customer growth. It presents information related to payment status, growth , etc. Pitch your topic with ease and precision using this Profit And Loss Dashboard For Managing Accounting Control System Information PDF. This layout presents information on Consumer Growth, Expenses By Category, Overall Outstanding Revenue. It is also available for immediate download and adjustment. So, changes can be made in the color, design, graphics or any other component to create a unique layout.
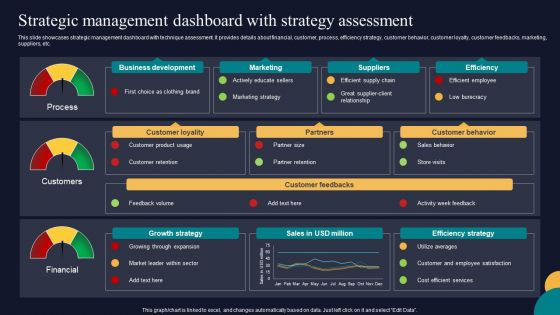
Strategic Management Dashboard With Strategy Assessment Tactics To Gain Sustainable Competitive Edge Pictures PDF
This slide showcases strategic management dashboard with technique assessment. It provides details about financial, customer, process, efficiency strategy, customer behavior, customer loyalty, customer feedbacks, marketing, suppliers, etc. Formulating a presentation can take up a lot of effort and time, so the content and message should always be the primary focus. The visuals of the PowerPoint can enhance the presenters message, so our Strategic Management Dashboard With Strategy Assessment Tactics To Gain Sustainable Competitive Edge Pictures PDF was created to help save time. Instead of worrying about the design, the presenter can concentrate on the message while our designers work on creating the ideal templates for whatever situation is needed. Slidegeeks has experts for everything from amazing designs to valuable content, we have put everything into Strategic Management Dashboard With Strategy Assessment Tactics To Gain Sustainable Competitive Edge Pictures PDF.
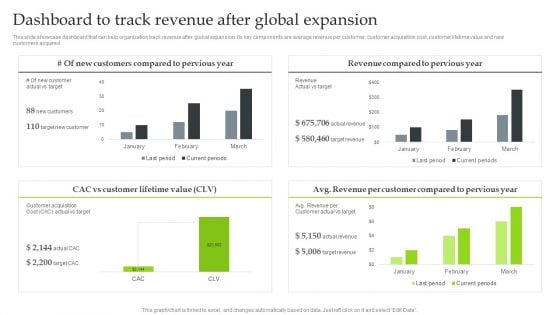
Expansion Strategic Plan Dashboard To Track Revenue After Global Expansion Rules PDF
This slide showcase dashboard that can help organization track revenue after global expansion. Its key components are average revenue per customer, customer acquisition cost, customer lifetime value and new customers acquired. Create an editable Expansion Strategic Plan Dashboard To Track Revenue After Global Expansion Rules PDF that communicates your idea and engages your audience. Whether youre presenting a business or an educational presentation, pre-designed presentation templates help save time. Expansion Strategic Plan Dashboard To Track Revenue After Global Expansion Rules PDF is highly customizable and very easy to edit, covering many different styles from creative to business presentations. Slidegeeks has creative team members who have crafted amazing templates. So, go and get them without any delay.
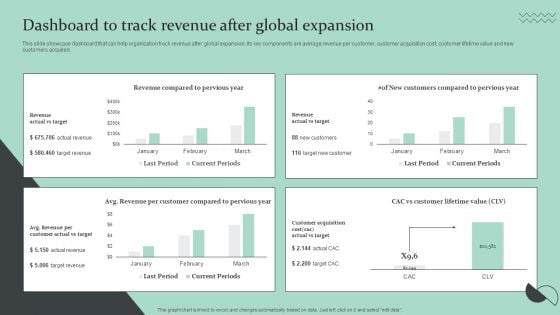
Strategic Global Expansion Business Plan Dashboard To Track Revenue After Global Expansion Topics PDF
This slide showcase dashboard that can help organization track revenue after global expansion. Its key components are average revenue per customer, customer acquisition cost, customer lifetime value and new customers acquired. Here you can discover an assortment of the finest PowerPoint and Google Slides templates. With these templates, you can create presentations for a variety of purposes while simultaneously providing your audience with an eye catching visual experience. Download Strategic Global Expansion Business Plan Dashboard To Track Revenue After Global Expansion Topics PDF to deliver an impeccable presentation. These templates will make your job of preparing presentations much quicker, yet still, maintain a high level of quality. Slidegeeks has experienced researchers who prepare these templates and write high quality content for you. Later on, you can personalize the content by editing the Strategic Global Expansion Business Plan Dashboard To Track Revenue After Global Expansion Topics PDF.
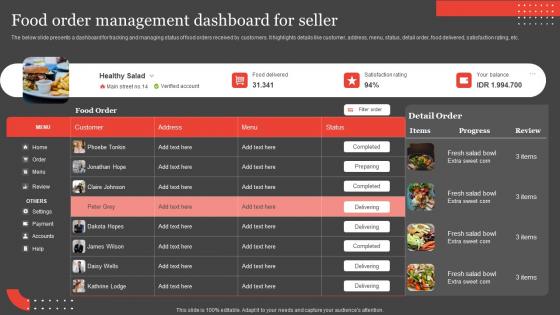
International Food Delivery Market Food Order Management Dashboard For Seller Graphics Pdf
The below slide presents a dashboard for tracking and managing status of food orders received by customers. It highlights details like customer, address, menu, status, detail order, food delivered, satisfaction rating, etc. Coming up with a presentation necessitates that the majority of the effort goes into the content and the message you intend to convey. The visuals of a PowerPoint presentation can only be effective if it supplements and supports the story that is being told. Keeping this in mind our experts created International Food Delivery Market Food Order Management Dashboard For Seller Graphics Pdf to reduce the time that goes into designing the presentation. This way, you can concentrate on the message while our designers take care of providing you with the right template for the situation. The below slide presents a dashboard for tracking and managing status of food orders received by customers. It highlights details like customer, address, menu, status, detail order, food delivered, satisfaction rating, etc.

Multiple Point Of Sale System Dashboard Depicting Restaurants Daily Performance Mockup PDF
This Slide represents point of sale system dashboard depicting restaurants daily performance which can be beneficial for eateries to manage their regular sales. It includes information about sales, expenditure, menu, customer data, bookings and reports. Persuade your audience using this Multiple Point Of Sale System Dashboard Depicting Restaurants Daily Performance Mockup PDF. This PPT design covers four stages, thus making it a great tool to use. It also caters to a variety of topics including Expenditure, Sales, Customer Data. Download this PPT design now to present a convincing pitch that not only emphasizes the topic but also showcases your presentation skills.
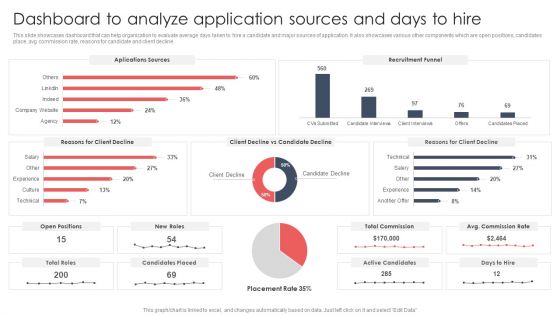
Screening And Staffing Dashboard To Analyze Application Sources And Days To Hire Sample PDF
This slide showcases dashboard that can help organization to evaluate average days taken to hire a candidate and major sources of application. It also showcases various other components which are open positions, candidates place, avg commission rate, reasons for candidate and client decline. From laying roadmaps to briefing everything in detail, our templates are perfect for you. You can set the stage with your presentation slides. All you have to do is download these easy-to-edit and customizable templates. Screening And Staffing Dashboard To Analyze Application Sources And Days To Hire Sample PDF will help you deliver an outstanding performance that everyone would remember and praise you for. Do download this presentation today.
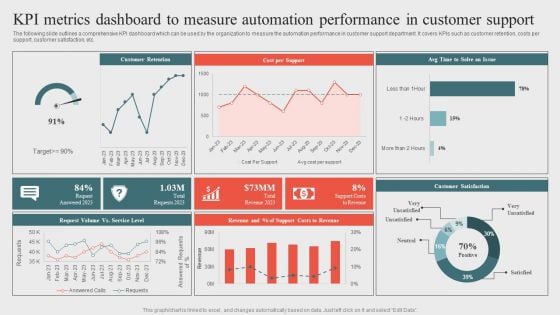
Kpi Metrics Dashboard To Measure Automation Performanceoptimizing Business Processes Through Automation Download PDF
The following slide outlines a comprehensive KPI dashboard which can be used by the organization to measure the automation performance in customer support department. It covers KPIs such as customer retention, costs per support, customer satisfaction, etc. Get a simple yet stunning designed Kpi Metrics Dashboard To Measure Automation Performanceoptimizing Business Processes Through Automation Download PDF. It is the best one to establish the tone in your meetings. It is an excellent way to make your presentations highly effective. So, download this PPT today from Slidegeeks and see the positive impacts. Our easy to edit Kpi Metrics Dashboard To Measure Automation Performanceoptimizing Business Processes Through Automation Download PDF can be your go to option for all upcoming conferences and meetings. So, what are you waiting for Grab this template today.
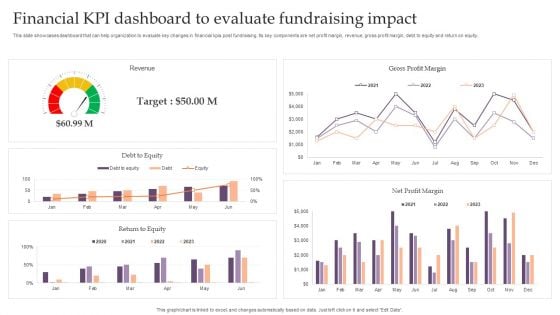
Assessing Debt And Equity Fundraising Alternatives For Business Growth Financial KPI Dashboard To Evaluate Infographics PDF
This slide showcases dashboard that can help organization to evaluate key changes in financial kpis post fundraising. Its key components are net profit margin, revenue, gross profit margin, debt to equity and return on equity. This Assessing Debt And Equity Fundraising Alternatives For Business Growth Financial KPI Dashboard To Evaluate Infographics PDF is perfect for any presentation, be it in front of clients or colleagues. It is a versatile and stylish solution for organizing your meetings. TheAssessing Debt And Equity Fundraising Alternatives For Business Growth Financial KPI Dashboard To Evaluate Infographics PDF features a modern design for your presentation meetings. The adjustable and customizable slides provide unlimited possibilities for acing up your presentation. Slidegeeks has done all the homework before launching the product for you. So, do not wait, grab the presentation templates today
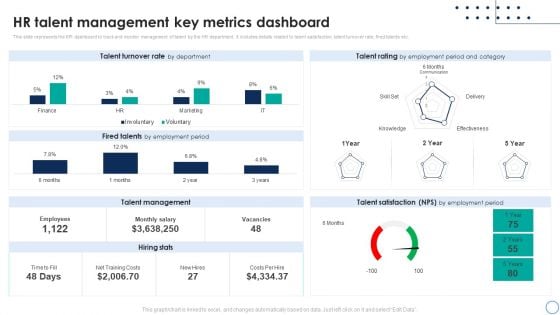
Business Analytics Application HR Talent Management Key Metrics Dashboard Rules PDF
This slide represents the KPI dashboard to track and monitor management of talent by the HR department. It includes details related to talent satisfaction, talent turnover rate, fired talents etc. This Business Analytics Application HR Talent Management Key Metrics Dashboard Rules PDF is perfect for any presentation, be it in front of clients or colleagues. It is a versatile and stylish solution for organizing your meetings. The Business Analytics Application HR Talent Management Key Metrics Dashboard Rules PDF features a modern design for your presentation meetings. The adjustable and customizable slides provide unlimited possibilities for acing up your presentation. Slidegeeks has done all the homework before launching the product for you. So, dont wait, grab the presentation templates today.
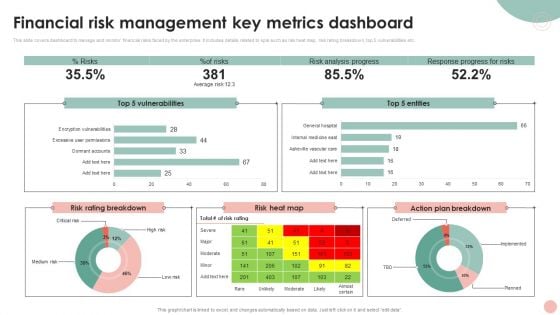
Company Risk Assessment Plan Financial Risk Management Key Metrics Dashboard Brochure PDF
This slide covers dashboard to manage and monitor financial risks faced by the enterprise. It includes details related to kpis such as risk heat map, risk rating breakdown, top 5 vulnerabilities etc. Crafting an eye catching presentation has never been more straightforward. Let your presentation shine with this tasteful yet straight forward Company Risk Assessment Plan Financial Risk Management Key Metrics Dashboard Brochure PDF template. It offers a minimalistic and classy look that is great for making a statement. The colors have been employed intelligently to add a bit of playfulness while still remaining professional. Construct the ideal Company Risk Assessment Plan Financial Risk Management Key Metrics Dashboard Brochure PDF that effortlessly grabs the attention of your audience. Begin now and be certain to wow your customers.
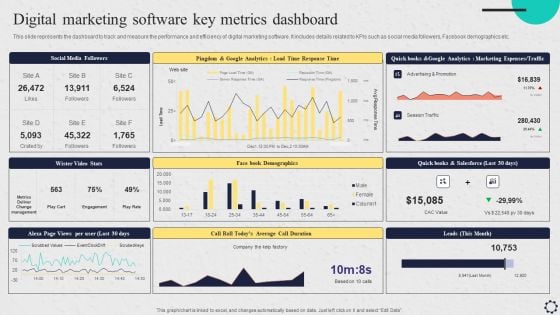
Software Implementation Strategy Digital Marketing Software Key Metrics Dashboard Template PDF
This slide represents the dashboard to track and measure the performance and efficiency of digital marketing software. It includes details related to KPIs such as social media followers, Facebook demographics etc. Crafting an eye catching presentation has never been more straightforward. Let your presentation shine with this tasteful yet straightforward Software Implementation Strategy Digital Marketing Software Key Metrics Dashboard Template PDF template. It offers a minimalistic and classy look that is great for making a statement. The colors have been employed intelligently to add a bit of playfulness while still remaining professional. Construct the idealSoftware Implementation Strategy Digital Marketing Software Key Metrics Dashboard Template PDF that effortlessly grabs the attention of your audience Begin now and be certain to wow your customers.
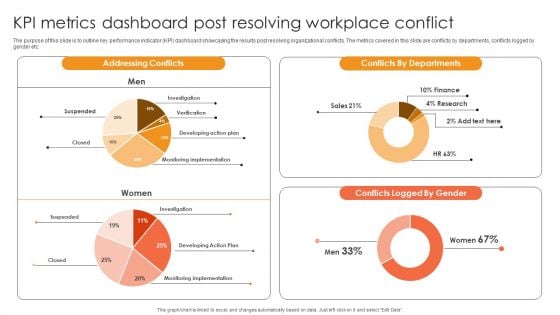
Kpi Metrics Dashboard Post Resolving Workplace Conflict Ppt Inspiration Graphics Download PDF
The purpose of this slide is to outline key performance indicator KPI dashboard showcasing the results post resolving organizational conflicts. The metrics covered in this slide are conflicts by departments, conflicts logged by gender etc. This Kpi Metrics Dashboard Post Resolving Workplace Conflict Ppt Inspiration Graphics Download PDF is perfect for any presentation, be it in front of clients or colleagues. It is a versatile and stylish solution for organizing your meetings. The Kpi Metrics Dashboard Post Resolving Workplace Conflict Ppt Inspiration Graphics Download PDF features a modern design for your presentation meetings. The adjustable and customizable slides provide unlimited possibilities for acing up your presentation. Slidegeeks has done all the homework before launching the product for you. So, do not wait, grab the presentation templates today

KPI Dashboard To Track Marketing Return On Investment Performance Background PDF
This slide shows key performance indicators dashboard to measure the performs of marketing campaign. It includes metrics such as campaign score, standard customers, growth rate, campaign income, etc. Showcasing this set of slides titled KPI Dashboard To Track Marketing Return On Investment Performance Background PDF. The topics addressed in these templates are Customer Distribution, Standard Customers, Growth Rate. All the content presented in this PPT design is completely editable. Download it and make adjustments in color, background, font etc. as per your unique business setting.
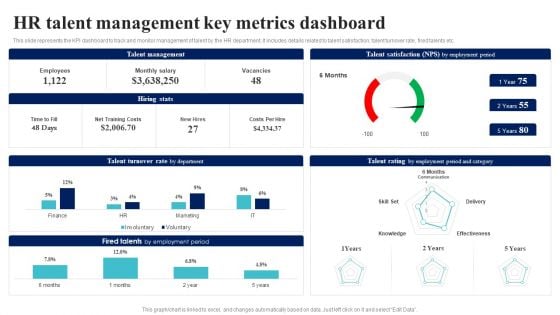
BI Implementation To Enhance Hiring Process Hr Talent Management Key Metrics Dashboard Brochure PDF
This slide represents the KPI dashboard to track and monitor management of talent by the HR department. It includes details related to talent satisfaction, talent turnover rate, fired talents etc.This BI Implementation To Enhance Hiring Process Hr Talent Management Key Metrics Dashboard Brochure PDF is perfect for any presentation, be it in front of clients or colleagues. It is a versatile and stylish solution for organizing your meetings. The BI Implementation To Enhance Hiring Process Hr Talent Management Key Metrics Dashboard Brochure PDF features a modern design for your presentation meetings. The adjustable and customizable slides provide unlimited possibilities for acing up your presentation. Slidegeeks has done all the homework before launching the product for you. So, do not wait, grab the presentation templates today.
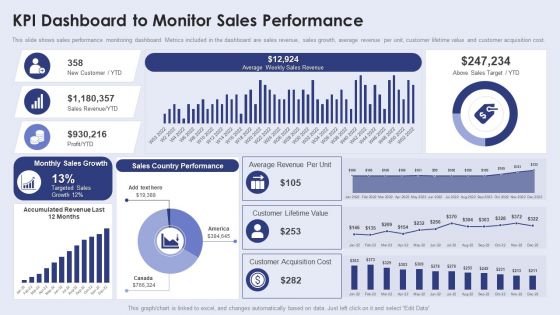
Creating New Product Launch Campaign Strategy Kpi Dashboard To Monitor Sales Performance Introduction PDF
This slide shows sales performance monitoring dashboard. Metrics included in the dashboard are sales revenue, sales growth, average revenue per unit, customer lifetime value and customer acquisition cost. This modern and well arranged Creating New Product Launch Campaign Strategy Kpi Dashboard To Monitor Sales Performance Introduction PDF provides lots of creative possibilities. It is very simple to customize and edit with the Powerpoint Software. Just drag and drop your pictures into the shapes. All facets of this template can be edited with Powerpoint no extra software is necessary. Add your own material, put your images in the places assigned for them, adjust the colors, and then you can show your slides to the world, with an animated slide included.
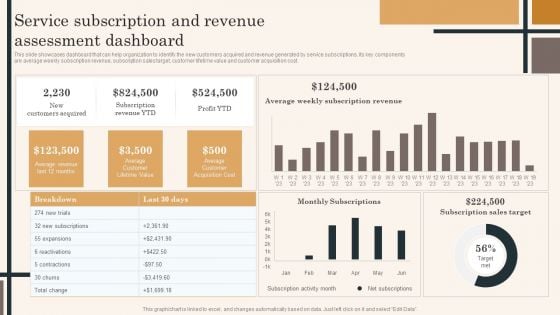
Edtech Service Launch And Promotion Plan Service Subscription And Revenue Assessment Dashboard Topics PDF
This slide showcases dashboard that can help organization to identify the new customers acquired and revenue generated by service subscriptions. Its key components are average weekly subscription revenue, subscription sales target, customer lifetime value and customer acquisition cost. Whether you have daily or monthly meetings, a brilliant presentation is necessary. Edtech Service Launch And Promotion Plan Service Subscription And Revenue Assessment Dashboard Topics PDF can be your best option for delivering a presentation. Represent everything in detail using Edtech Service Launch And Promotion Plan Service Subscription And Revenue Assessment Dashboard Topics PDF and make yourself stand out in meetings. The template is versatile and follows a structure that will cater to your requirements. All the templates prepared by Slidegeeks are easy to download and edit. Our research experts have taken care of the corporate themes as well. So, give it a try and see the results.
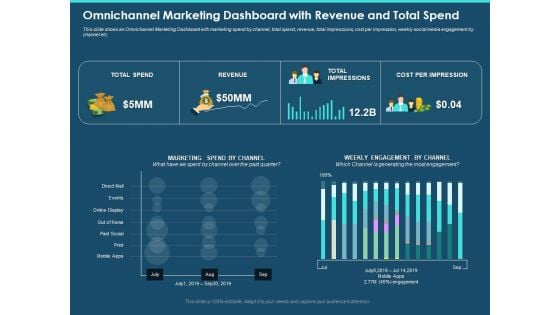
Cross Channel Marketing Plan For Clients Omnichannel Marketing Dashboard With Revenue And Total Spend Slides PDF
Presenting this set of slides with name cross channel marketing plan for clients omnichannel marketing dashboard with revenue and total spend slides pdf. The topics discussed in these slides are direct mall, events, online display, paid social. This is a completely editable PowerPoint presentation and is available for immediate download. Download now and impress your audience.
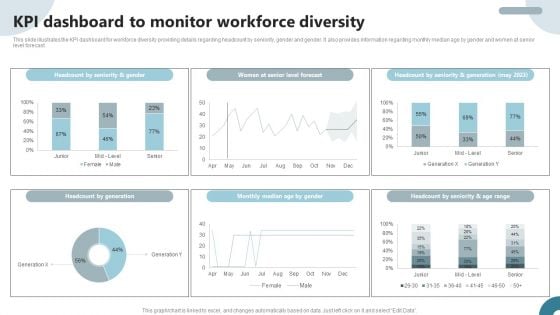
Strategies To Deploy Diversity In Workplace KPI Dashboard To Monitor Workforce Diversity Infographics PDF
This slide illustrates the KPI dashboard for workforce diversity providing details regarding headcount by seniority, gender and gender. It also provides information regarding monthly median age by gender and women at senior level forecast. Crafting an eye-catching presentation has never been more straightforward. Let your presentation shine with this tasteful yet straightforward Strategies To Deploy Diversity In Workplace KPI Dashboard To Monitor Workforce Diversity Infographics PDF template. It offers a minimalistic and classy look that is great for making a statement. The colors have been employed intelligently to add a bit of playfulness while still remaining professional. Construct the ideal Strategies To Deploy Diversity In Workplace KPI Dashboard To Monitor Workforce Diversity Infographics PDF that effortlessly grabs the attention of your audience Begin now and be certain to wow your customers.
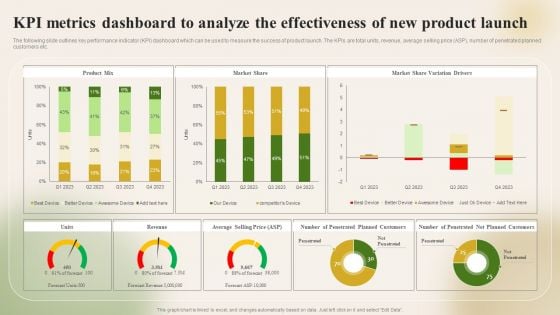
KPI Metrics Dashboard To Analyze The Effectiveness Of New Introducing New Food Pictures PDF
The following slide outlines key performance indicator KPI dashboard which can be used to measure the success of product launch. The KPIs are total units, revenue, average selling price ASP, number of penetrated planned customers etc. Make sure to capture your audiences attention in your business displays with our gratis customizable KPI Metrics Dashboard To Analyze The Effectiveness Of New Introducing New Food Pictures PDF. These are great for business strategies, office conferences, capital raising or task suggestions. If you desire to acquire more customers for your tech business and ensure they stay satisfied, create your own sales presentation with these plain slides.
You Tube Advertising Campaign Performance Analytics Dashboard Ppt Icon Diagrams PDF
This slide represents dashboard showing analytics of performance of you tube marketing campaign. It includes data related to no. of visitors, qualified leads, customers and annual recurring revenue, lifetime value, gross volume etc generated through the campaign. Showcasing this set of slides titled You Tube Advertising Campaign Performance Analytics Dashboard Ppt Icon Diagrams PDF. The topics addressed in these templates are Monthly Recurring Revenue, Bounce Rate, Customer Churn Rate. All the content presented in this PPT design is completely editable. Download it and make adjustments in color, background, font etc. as per your unique business setting.

Prevention Of Information KPI Dashboard To Monitor Cyber Security Performance Information PDF
The purpose of this slide is to highlight key performance indicator KPI dashboard which can be used to track the performance of organization cyber security. The KPI metrics covered in the slide are asset type control, control issues by standard AND regulation etc. This Prevention Of Information KPI Dashboard To Monitor Cyber Security Performance Information PDF is perfect for any presentation, be it in front of clients or colleagues. It is a versatile and stylish solution for organizing your meetings. The Prevention Of Information KPI Dashboard To Monitor Cyber Security Performance Information PDF features a modern design for your presentation meetings. The adjustable and customizable slides provide unlimited possibilities for acing up your presentation. Slidegeeks has done all the homework before launching the product for you. So, dont wait, grab the presentation templates today
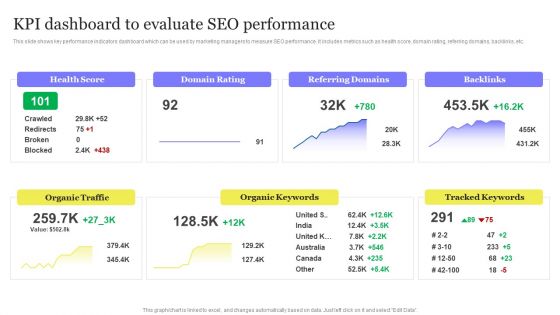
Enhancing Digital Visibility Using SEO Content Strategy KPI Dashboard To Evaluate SEO Performance Diagrams PDF
This slide shows key performance indicators dashboard which can be used by marketing managers to measure SEO performance. It includes metrics such as health score, domain rating, referring domains, backlinks, etc. This Enhancing Digital Visibility Using SEO Content Strategy KPI Dashboard To Evaluate SEO Performance Diagrams PDF is perfect for any presentation, be it in front of clients or colleagues. It is a versatile and stylish solution for organizing your meetings. The Enhancing Digital Visibility Using SEO Content Strategy KPI Dashboard To Evaluate SEO Performance Diagrams PDF features a modern design for your presentation meetings. The adjustable and customizable slides provide unlimited possibilities for acing up your presentation. Slidegeeks has done all the homework before launching the product for you. So, do not wait, grab the presentation templates today
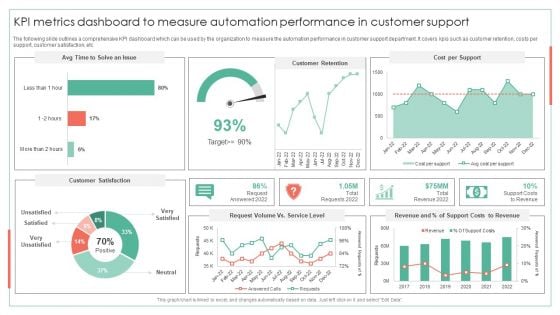
KPI Metrics Dashboard To Measure Automation Performance Achieving Operational Efficiency Guidelines PDF
The following slide outlines a comprehensive KPI dashboard which can be used by the organization to measure the automation performance in customer support department. It covers kpis such as customer retention, costs per support, customer satisfaction, etcDeliver and pitch your topic in the best possible manner with this KPI Metrics Dashboard To Measure Automation Performance Achieving Operational Efficiency Guidelines PDF. Use them to share invaluable insights on Customer Retention, Cost Per Support, Request Volume and impress your audience. This template can be altered and modified as per your expectations. So, grab it now.
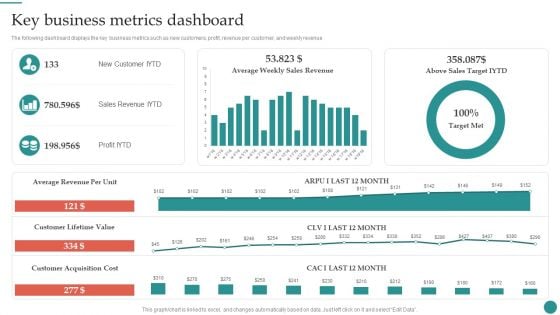
Key Business Metrics Dashboard Company Process Administration And Optimization Playbook Infographics PDF
The following dashboard displays the key business metrics such as new customers, profit, revenue per customer, and weekly revenue. Slidegeeks is here to make your presentations a breeze with Key Business Metrics Dashboard Company Process Administration And Optimization Playbook Infographics PDF With our easy-to-use and customizable templates, you can focus on delivering your ideas rather than worrying about formatting. With a variety of designs to choose from, you are sure to find one that suits your needs. And with animations and unique photos, illustrations, and fonts, you can make your presentation pop. So whether you are giving a sales pitch or presenting to the board, make sure to check out Slidegeeks first.
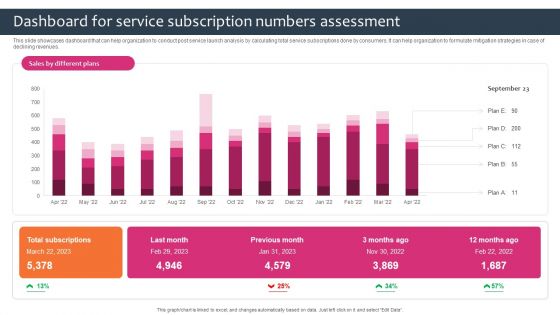
Promotion Sales Techniques For New Service Introduction Dashboard For Service Subscription Pictures PDF
This slide showcases dashboard that can help organization to conduct post service launch analysis by calculating total service subscriptions done by consumers. It can help organization to formulate mitigation strategies in case of declining revenues. Do you have to make sure that everyone on your team knows about any specific topic I yes, then you should give Promotion Sales Techniques For New Service Introduction Dashboard For Service Subscription Pictures PDF a try. Our experts have put a lot of knowledge and effort into creating this impeccable Promotion Sales Techniques For New Service Introduction Dashboard For Service Subscription Pictures PDF. You can use this template for your upcoming presentations, as the slides are perfect to represent even the tiniest detail. You can download these templates from the Slidegeeks website and these are easy to edit. So grab these today.
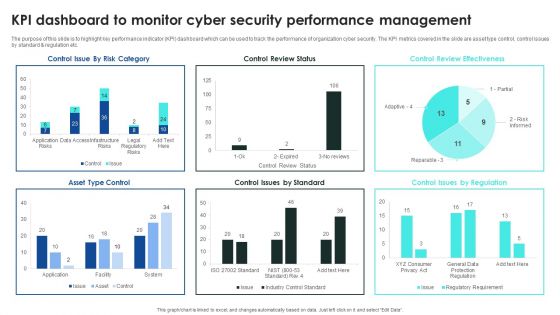
Implementing Cybersecurity Awareness Program To Prevent Attacks KPI Dashboard To Monitor Cyber Security Introduction PDF
The purpose of this slide is to highlight key performance indicator KPI dashboard which can be used to track the performance of organization cyber security. The KPI metrics covered in the slide are asset type control, control issues by standard and regulation etc. This Implementing Cybersecurity Awareness Program To Prevent Attacks KPI Dashboard To Monitor Cyber Security Introduction PDF is perfect for any presentation, be it in front of clients or colleagues. It is a versatile and stylish solution for organizing your meetings. The Implementing Cybersecurity Awareness Program To Prevent Attacks KPI Dashboard To Monitor Cyber Security Introduction PDF features a modern design for your presentation meetings. The adjustable and customizable slides provide unlimited possibilities for acing up your presentation. Slidegeeks has done all the homework before launching the product for you. So, do not wait, grab the presentation templates today
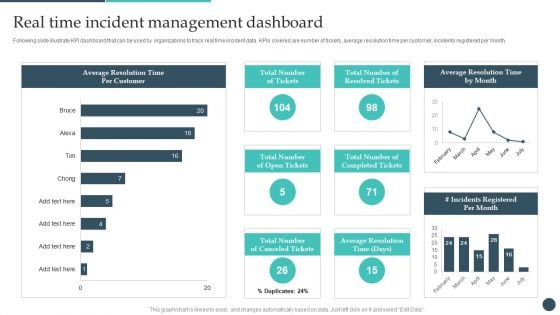
Safety Breach Response Playbook Real Time Incident Management Dashboard Formats PDF
Following slide illustrate KPI dashboard that can be used by organizations to track real time incident data. KPIs covered are number of tickets, average resolution time per customer, incidents registered per month. Find highly impressive Safety Breach Response Playbook Real Time Incident Management Dashboard Formats PDF on Slidegeeks to deliver a meaningful presentation. You can save an ample amount of time using these presentation templates. No need to worry to prepare everything from scratch because Slidegeeks experts have already done a huge research and work for you. You need to download Safety Breach Response Playbook Real Time Incident Management Dashboard Formats PDF for your upcoming presentation. All the presentation templates are 100 percent editable and you can change the color and personalize the content accordingly. Download now.


 Continue with Email

 Home
Home


