Value And Benefit
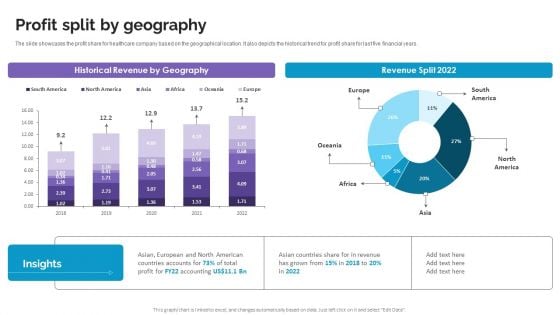
Profit Split By Geography Life Science And Healthcare Solutions Company Profile Graphics PDF
The slide showcases the profit share for healthcare company based on the geographical location. It also depicts the historical trend for profit share for last five financial years. If your project calls for a presentation, then Slidegeeks is your go-to partner because we have professionally designed, easy-to-edit templates that are perfect for any presentation. After downloading, you can easily edit Profit Split By Geography Life Science And Healthcare Solutions Company Profile Graphics PDF and make the changes accordingly. You can rearrange slides or fill them with different images. Check out all the handy templates
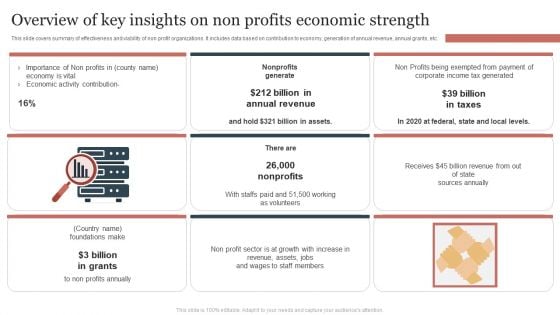
Overview Of Key Insights On Non Profits Economic Strength Summary PDF
This slide covers summary of effectiveness and viability of non profit organizations. It includes data based on contribution to economy, generation of annual revenue, annual grants, etc. Presenting Overview Of Key Insights On Non Profits Economic Strength Summary PDF to dispense important information. This template comprises threestages. It also presents valuable insights into the topics including Annual Revenue, Billion In Taxes, Non Profits. This is a completely customizable PowerPoint theme that can be put to use immediately. So, download it and address the topic impactfully.
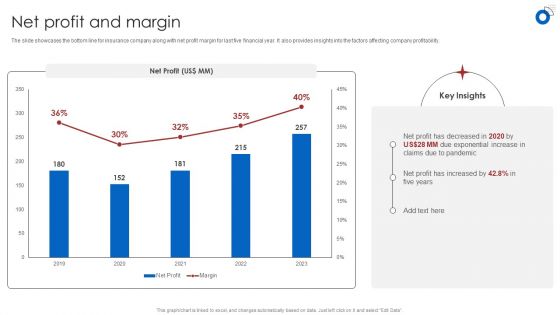
Insurance Business Financial Analysis Net Profit And Margin Ppt Gallery Ideas PDF
The slide showcases the bottom line for insurance company along with net profit margin for last five financial year. It also provides insights into the factors affecting company profitability. Make sure to capture your audiences attention in your business displays with our gratis customizable Insurance Business Financial Analysis Net Profit And Margin Ppt Gallery Ideas PDF. These are great for business strategies, office conferences, capital raising or task suggestions. If you desire to acquire more customers for your tech business and ensure they stay satisfied, create your own sales presentation with these plain slides.
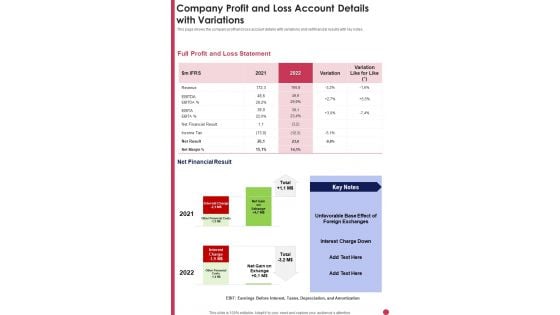
Company Profit And Loss Account Details With Variations Template 280 One Pager Documents
This page shows the company profit and loss account details with variations and net financial results with key notes. Presenting you an exemplary Company Profit And Loss Account Details With Variations Template 280 One Pager Documents. Our one-pager comprises all the must-have essentials of an inclusive document. You can edit it with ease, as its layout is completely editable. With such freedom, you can tweak its design and other elements to your requirements. Download this Company Profit And Loss Account Details With Variations Template 280 One Pager Documents brilliant piece now.
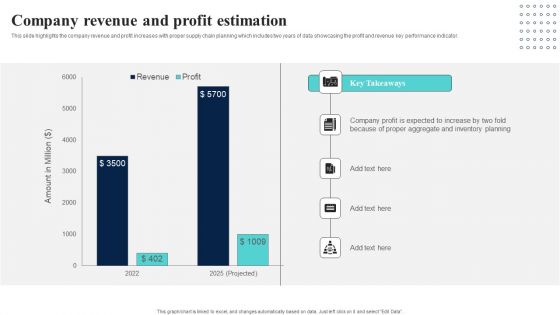
Supply Network Planning And Administration Tactics Company Revenue And Profit Estimation Summary PDF
This slide highlights the company revenue and profit increases with proper supply chain planning which includes two years of data showcasing the profit and revenue key performance indicator. Take your projects to the next level with our ultimate collection of Supply Network Planning And Administration Tactics Company Revenue And Profit Estimation Summary PDF. Slidegeeks has designed a range of layouts that are perfect for representing task or activity duration, keeping track of all your deadlines at a glance. Tailor these designs to your exact needs and give them a truly corporate look with your own brand colors they will make your projects stand out from the rest.
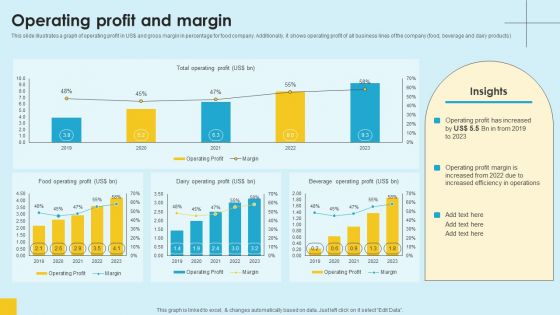
Food Company Financial Performance Summary Operating Profit And Margin Topics PDF
This slide illustrates a graph of operating profit in US dollar and gross margin in percentage for food company. Additionally, it shows operating profit of all business lines of the company food, beverage and dairy products. Find a pre-designed and impeccable Food Company Financial Performance Summary Operating Profit And Margin Topics PDF. The templates can ace your presentation without additional effort. You can download these easy-to-edit presentation templates to make your presentation stand out from others. So, what are you waiting for Download the template from Slidegeeks today and give a unique touch to your presentation.
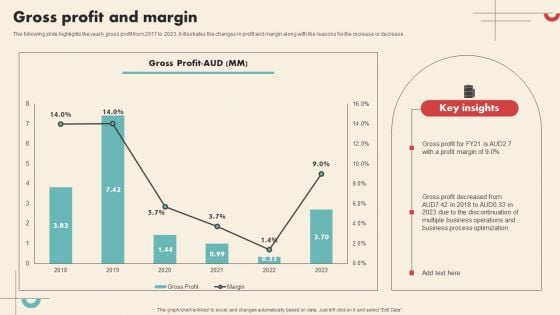
Data Driven Marketing Solutions Firm Company Profile Gross Profit And Margin Information PDF
The following slide highlights the yearly gross profit from 2017 to 2023. it illustrates the changes in profit and margin along with the reasons for the increase or decrease Make sure to capture your audiences attention in your business displays with our gratis customizable Data Driven Marketing Solutions Firm Company Profile Gross Profit And Margin Information PDF. These are great for business strategies, office conferences, capital raising or task suggestions. If you desire to acquire more customers for your tech business and ensure they stay satisfied, create your own sales presentation with these plain slides.
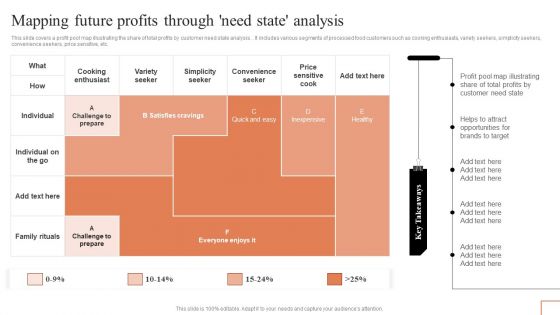
Comprehensive Guide To Manage Brand Portfolio Mapping Future Profits Through Need State Analysis Introduction PDF
This slide covers a profit pool map illustrating the share of total profits by customer need state analysis. . It includes various segments of processed food customers such as cooking enthusiasts, variety seekers, simplicity seekers, convenience seekers, price sensitive, etc. There are so many reasons you need a Comprehensive Guide To Manage Brand Portfolio Mapping Future Profits Through Need State Analysis Introduction PDF. The first reason is you can not spend time making everything from scratch, Thus, Slidegeeks has made presentation templates for you too. You can easily download these templates from our website easily.
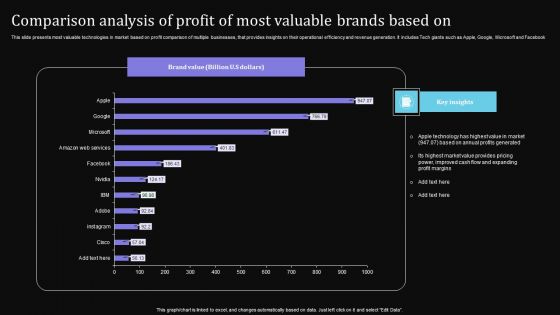
Comparison Analysis Of Profit Of Most Valuable Brands Based On Pictures PDF
This slide presents most valuable technologies in market based on profit comparison of multiple businesses, that provides insights on their operational efficiency and revenue generation. It includes Tech giants such as Apple, Google, Microsoft and Facebook. Showcasing this set of slides titled Comparison Analysis Of Profit Of Most Valuable Brands Based On Pictures PDF. The topics addressed in these templates are Apple Technology, Annual Profits Generated, Improved Cash Flow. All the content presented in this PPT design is completely editable. Download it and make adjustments in color, background, font etc. as per your unique business setting.

Tools To Identify Market Opportunities For Business Growth Distribution Strategy Options Direct Guidelines PDF
This is a tools to identify market opportunities for business growth distribution strategy options direct guidelines pdf. template with various stages. Focus and dispense information on three stages using this creative set, that comes with editable features. It contains large content boxes to add your information on topics like direct, indirect, hybrid, mail order selling, internet selling, wholesalers, retailers, intermediaries. You can also showcase facts, figures, and other relevant content using this PPT layout. Grab it now.
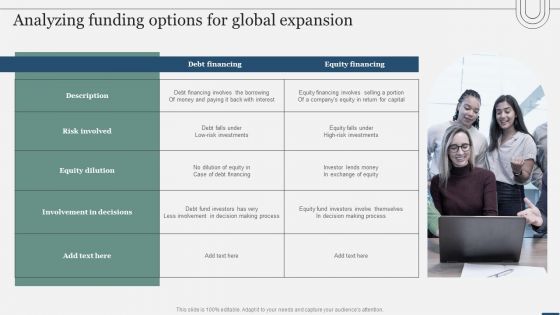
Assessing International Market Analyzing Funding Options For Global Expansion Guidelines PDF
Present like a pro with Assessing International Market Analyzing Funding Options For Global Expansion Guidelines PDF Create beautiful presentations together with your team, using our easy-to-use presentation slides. Share your ideas in real-time and make changes on the fly by downloading our templates. So whether youre in the office, on the go, or in a remote location, you can stay in sync with your team and present your ideas with confidence. With Slidegeeks presentation got a whole lot easier. Grab these presentations today.

Target With Darts Profit Success PowerPoint Templates And PowerPoint Themes 0212
Microsoft Powerpoint Templates and Background with target with darts Present like a pro with our Target With Darts Profit Success PowerPoint Templates And PowerPoint Themes 0212. You will come out on top.

Profit Chart On Blackboard Success PowerPoint Templates And PowerPoint Themes 0412
Microsoft Powerpoint Templates and Background with business chart on blackboard Force an outcome with our Profit Chart On Blackboard Success PowerPoint Templates And PowerPoint Themes 0412. Try us out and see what a difference our templates make.

E Business Finance Computer Profit PowerPoint Templates And PowerPoint Themes 1012
E Business Finance Computer Profit PowerPoint Templates And PowerPoint Themes 1012-Create visually stunning and define your PPT Presentations in a unique and inspiring manner using our above template which contains a graphic of pc with business or profits growth bar graph. This image has been professionally designed to emphasize the business concept. Present your views using our innovative slides and be assured of leaving a lasting impression. This image has been conceived to enable you to emphatically communicate your ideas in your Global Business PPT presentations.-E Business Finance Computer Profit PowerPoint Templates And PowerPoint Themes 1012-This PowerPoint template can be used for presentations relating to-Business graph with arrow, technology, computer, business, finance, arrows Bash on ahead with bold conviction. Have no fear with our E Business Finance Computer Profit PowerPoint Templates And PowerPoint Themes 1012.
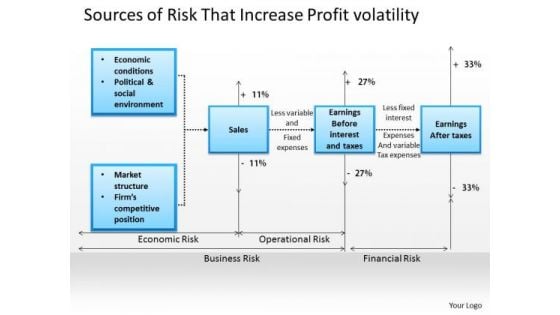
Business Framework Sources Of Risk That Increase Profit Volatility 2 PowerPoint Presentation
This PPT shows the sources of risk that increases profit volatility. This business framework power point template has been designed with graphic of text boxes in flow chart style. Use this PPT for business and marketing related topics.
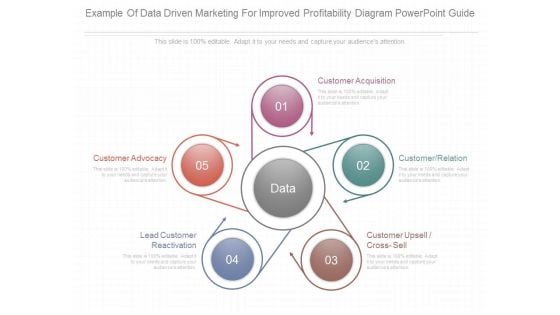
Example Of Data Driven Marketing For Improved Profitability Diagram Powerpoint Guide
This is a example of data driven marketing for improved profitability diagram powerpoint guide. This is a five stage process. The stages in this process are customer acquisition, customer relation, customer upsell cross sell, lead customer reactivation, customer advocacy.
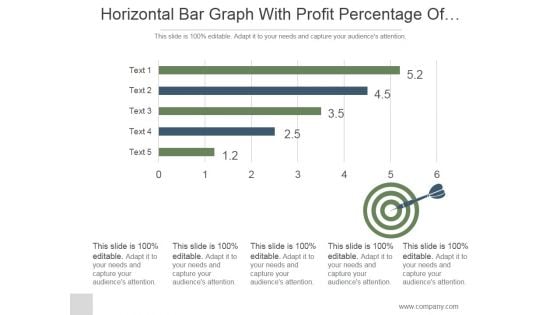
Horizontal Bar Graph With Profit Percentage Of Company Ppt PowerPoint Presentation Shapes
This is a horizontal bar graph with profit percentage of company ppt powerpoint presentation shapes. This is a five stage process. The stages in this process are business, strategy, marketing, analysis, slide bar, target.
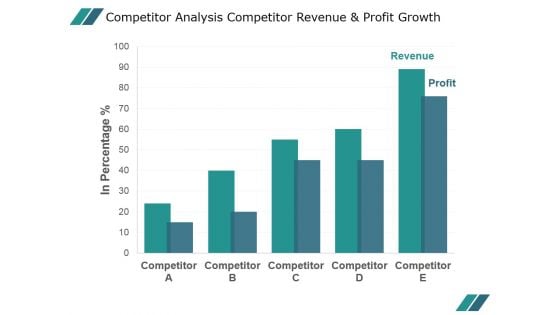
Competitor Analysis Competitor Revenue And Profit Growth Ppt PowerPoint Presentation Slide Download
This is a competitor analysis competitor revenue and profit growth ppt powerpoint presentation slide download. This is a five stage process. The stages in this process are business, marketing, management, finance, growth.
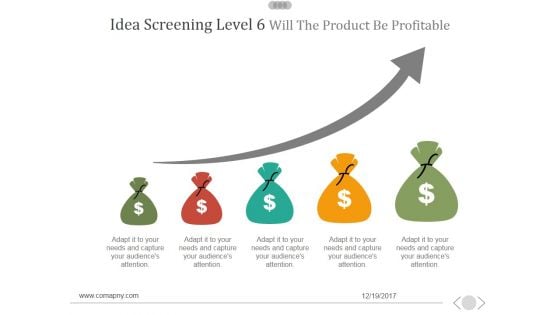
Idea Screening Level 6 Will The Product Be Profitable Ppt PowerPoint Presentation Ideas
This is a idea screening level 6 will the product be profitable ppt powerpoint presentation ideas. This is a five stage process. The stages in this process are business, marketing, success, currency, finance.
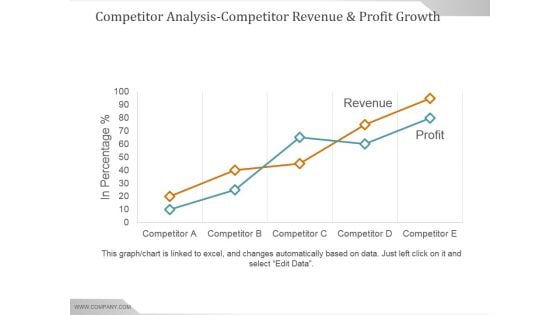
Competitor Analysis Competitor Revenue And Profit Growth Ppt PowerPoint Presentation Example 2015
This is a competitor analysis competitor revenue and profit growth ppt powerpoint presentation example 2015. This is a five stage process. The stages in this process are business, strategy, marketing, analysis, growth strategy.
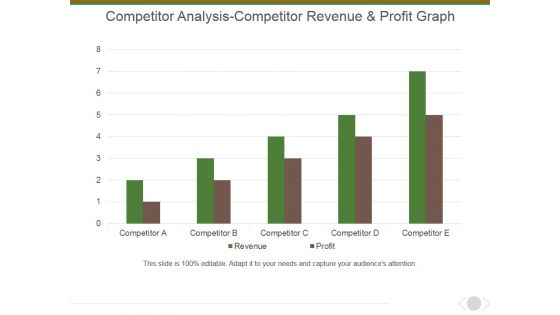
Competitor Analysis Competitor Revenue And Profit Graph Ppt PowerPoint Presentation Gallery Vector
This is a competitor analysis competitor revenue and profit graph ppt powerpoint presentation gallery vector. This is a five stage process. The stages in this process are bar graph, marketing, management, business, presentation.
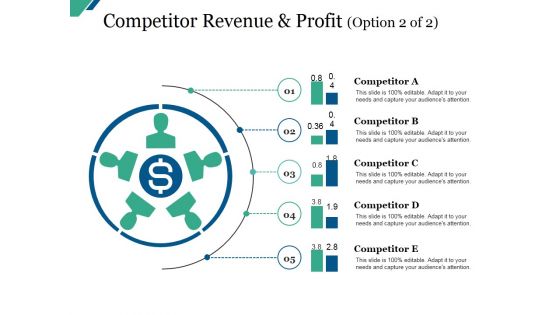
Competitor Revenue And Profit Template 1 Ppt PowerPoint Presentation Professional Slides
This is a competitor revenue and profit template 1 ppt powerpoint presentation professional slides. This is a five stage process. The stages in this process are business, marketing, circle, process, finance.
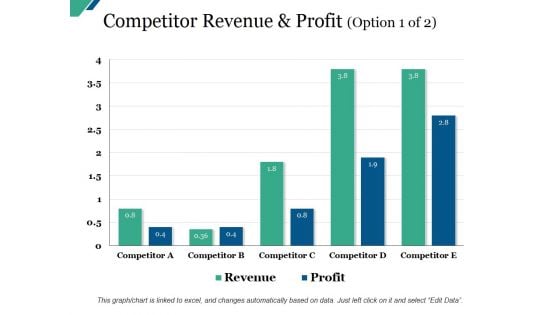
Competitor Revenue And Profit Template Ppt PowerPoint Presentation Model Design Inspiration
This is a competitor revenue and profit template ppt powerpoint presentation model design inspiration. This is a five stage process. The stages in this process are business, marketing, graph, success, growth.
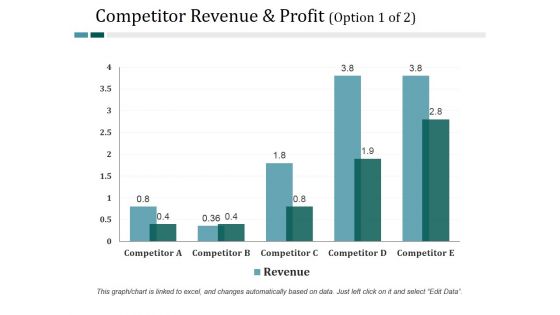
Competitor Revenue And Profit Template 1 Ppt PowerPoint Presentation Professional Example File
This is a competitor revenue and profit template 1 ppt powerpoint presentation professional example file. This is a five stage process. The stages in this process are business, finance, marketing, strategy, analysis, growth.
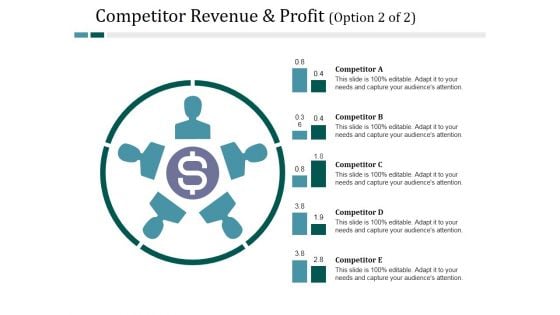
Competitor Revenue And Profit Template 2 Ppt PowerPoint Presentation Styles Examples
This is a competitor revenue and profit template 2 ppt powerpoint presentation styles examples. This is a five stage process. The stages in this process are business, process, management, strategy, competitor.
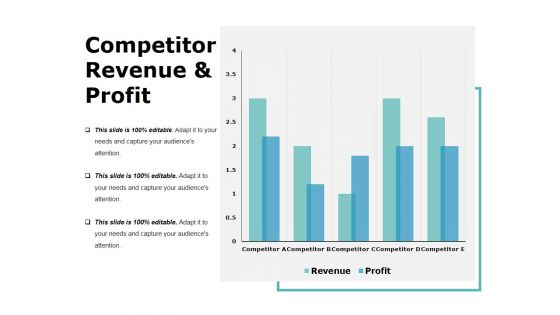
Competitor Revenue And Profit Template 1 Ppt PowerPoint Presentation Layouts Display
This is a competitor revenue and profit template 1 ppt powerpoint presentation layouts display. This is a five stage process. The stages in this process are business, bar graph, finance, marketing, analysis.
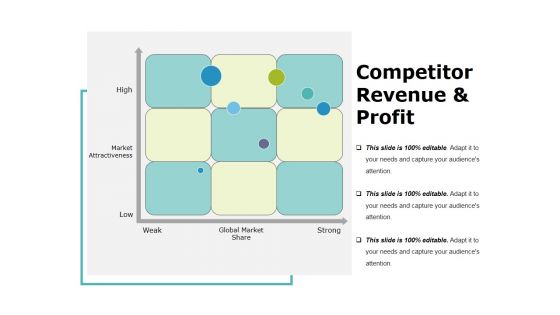
Competitor Revenue And Profit Template 2 Ppt PowerPoint Presentation Infographics Styles
This is a competitor revenue and profit template 2 ppt powerpoint presentation infographics styles. This is a three stage process. The stages in this process are high, market attractiveness, low, weak, global market share, strong.
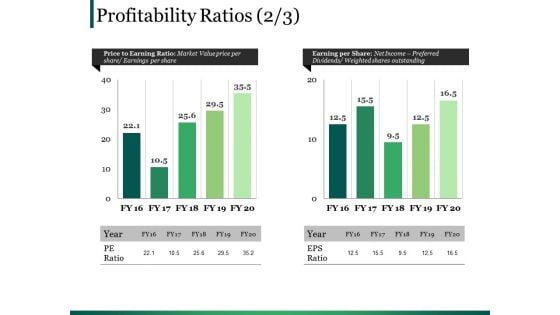
Profitability Ratios Template 4 Ppt PowerPoint Presentation Infographic Template Clipart Images
This is a profitability ratios template 4 ppt powerpoint presentation infographic template clipart images. This is a two stage process. The stages in this process are business, marketing, bar, finance, planning.
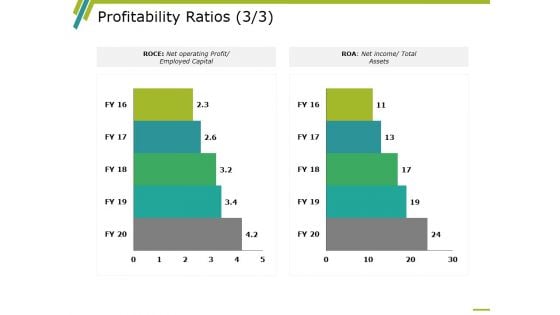
Profitability Ratios Template 5 Ppt PowerPoint Presentation Infographic Template Clipart Images
This is a profitability ratios template 5 ppt powerpoint presentation infographic template clipart images. This is a two stage process. The stages in this process are business, marketing, graph, roce, roa.
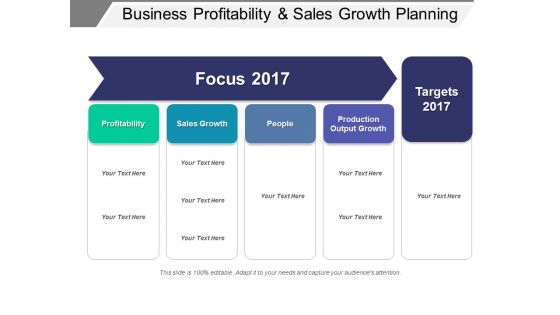
Business Profitability And Sales Growth Planning Ppt PowerPoint Presentation Inspiration Ideas
This is a business profitability and sales growth planning ppt powerpoint presentation inspiration ideas. This is a five stage process. The stages in this process are attention, focus area, target area.
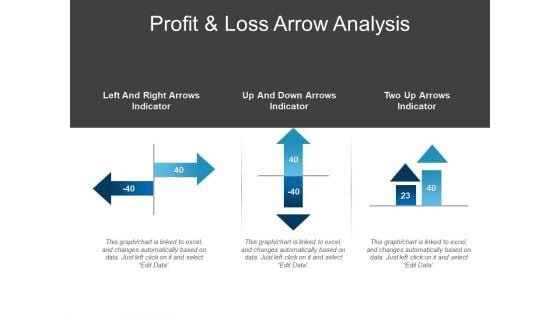
Profit And Loss Arrow Analysis Ppt PowerPoint Presentation Infographic Template Model
This is a profit and loss arrow analysis ppt powerpoint presentation infographic template model. This is a three stage process. The stages in this process are comparison chart, comparison table, comparison matrix.

Investment Planning Factors Economy Trade Profit Ppt PowerPoint Presentation Ideas Slide
This is a investment planning factors economy trade profit ppt powerpoint presentation ideas slide. This is a eight stage process. The stages in this process are financial management, wealth management, investment management.
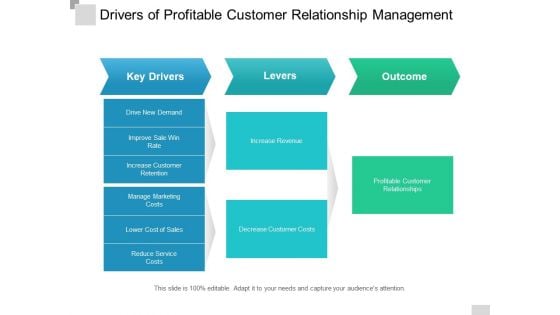
Drivers Of Profitable Customer Relationship Management Ppt PowerPoint Presentation Inspiration Example Topics
This is a drivers of profitable customer relationship management ppt powerpoint presentation inspiration example topics. This is a three stage process. The stages in this process are decision tree, decision point, driver diagram.
Profit And Loss Management With Dollars Ppt PowerPoint Presentation Portfolio Microsoft
This is a profit and loss management with dollars ppt powerpoint presentation portfolio microsoft. This is a four stage process. The stages in this process are revenue cycle, revenue circle.
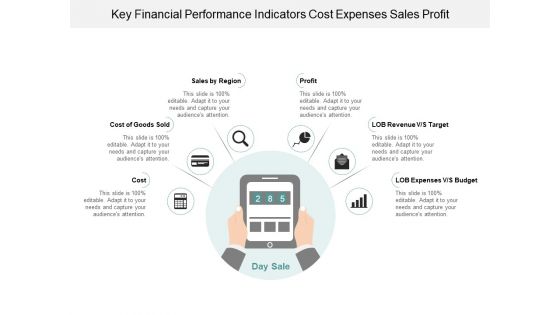
Key Financial Performance Indicators Cost Expenses Sales Profit Ppt Powerpoint Presentation Infographic Template Graphic Images
This is a key financial performance indicators cost expenses sales profit ppt powerpoint presentation infographic template graphic images. This is a six stage process. The stages in this process are dashboard, kpi, metrics.
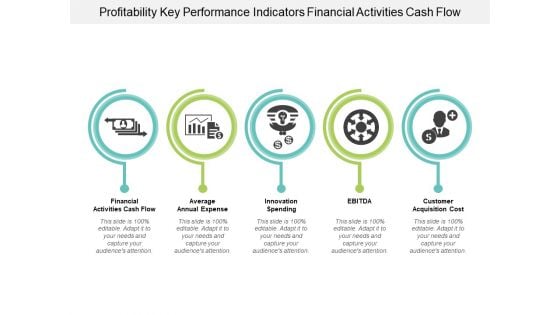
Profitability Key Performance Indicators Financial Activities Cash Flow Ppt Powerpoint Presentation Portfolio Clipart Images
This is a profitability key performance indicators financial activities cash flow ppt powerpoint presentation portfolio clipart images. This is a five stage process. The stages in this process are dashboard, kpi, metrics.
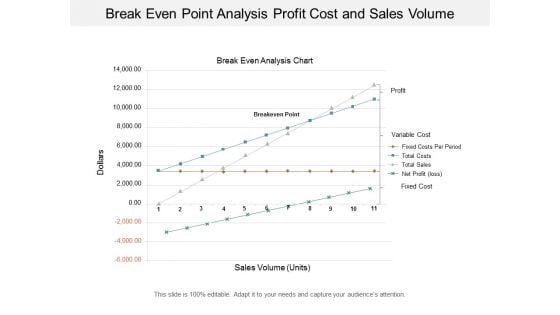
break even point analysis profit cost and sales volume ppt powerpoint presentation ideas graphics download
This is a break even point analysis profit cost and sales volume ppt powerpoint presentation ideas graphics download. This is a four stage process. The stages in this process are break even point,break even analysis,break even level.
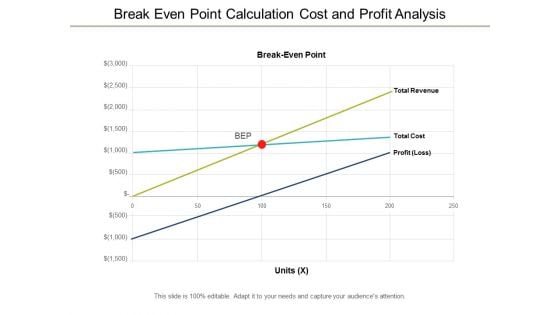
break even point calculation cost and profit analysis ppt powerpoint presentation outline graphics download
This is a break even point calculation cost and profit analysis ppt powerpoint presentation outline graphics download. This is a stage process. The stages in this process are break even point,break even analysis,break even level.
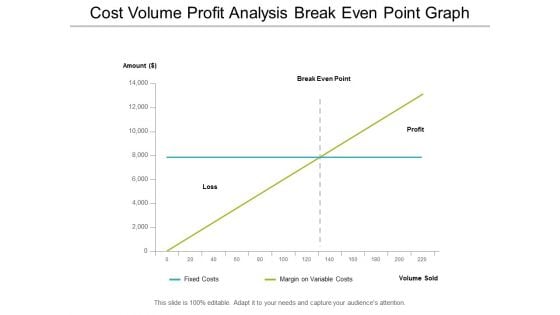
cost volume profit analysis break even point graph ppt powerpoint presentation professional shapes
This is a cost volume profit analysis break even point graph ppt powerpoint presentation professional shapes. This is a four stage process. The stages in this process are break even point,break even analysis,break even level.
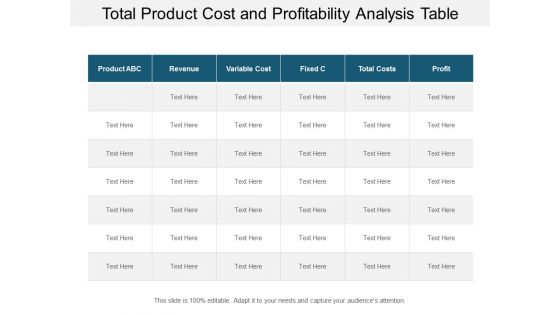
total product cost and profitability analysis table ppt powerpoint presentation summary grid
This is a total product cost and profitability analysis table ppt powerpoint presentation summary grid. This is a six stage process. The stages in this process are break even point,break even analysis,break even level.
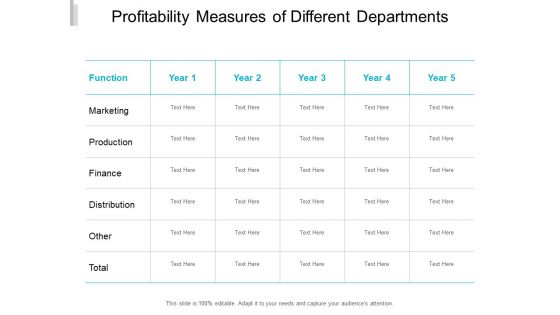
Profitability Measures Of Different Departments Ppt PowerPoint Presentation Infographic Template Images
This is a profitability measures of different departments ppt powerpoint presentation infographic template images. This is a five stage process. The stages in this process are product distribution, distribution system, numeric distribution.
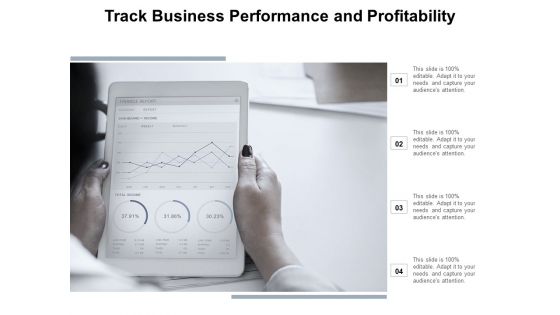
Track Business Performance And Profitability Ppt Powerpoint Presentation File Master Slide
This is a track business performance and profitability ppt powerpoint presentation file master slide. This is a four stage process. The stages in this process are business metrics, business kpi, business dashboard.
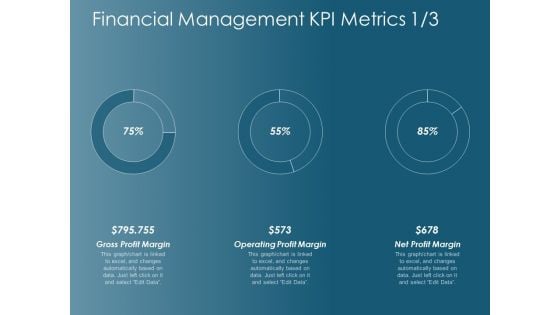
Financial Management Kpi Metrics Operating Profit Margin Ppt Powerpoint Presentation Infographic Template Images
This is a financial management kpi metrics operating profit margin ppt powerpoint presentation infographic template images. This is a three stage process. The stages in this process are finance, marketing, management, investment, analysis.
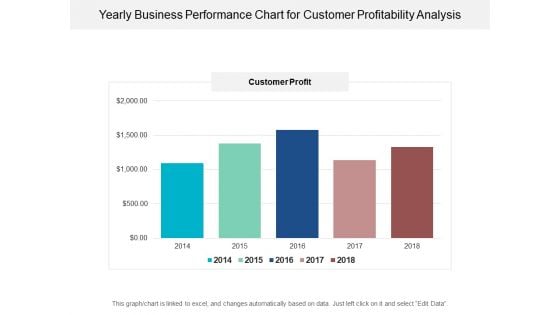
Yearly Business Performance Chart For Customer Profitability Analysis Ppt PowerPoint Presentation Ideas Picture
This is a yearly business performance chart for customer profitability analysis ppt powerpoint presentation ideas picture. This is a five stage process. The stages in this process are financial analysis, quantitative, statistical modelling.
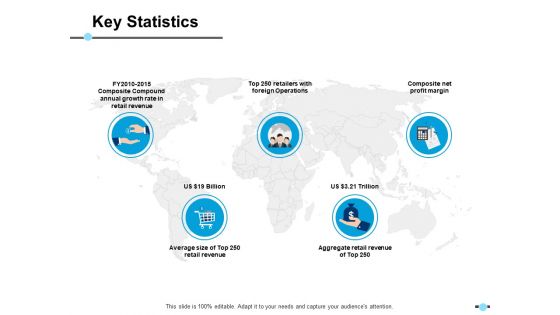
Key Statistics Composite Net Profit Margin Ppt PowerPoint Presentation Show Slides
This is a key statistics composite net profit margin ppt powerpoint presentation show slides. This is a five stage process. The stages in this process are business, location, strategy, analysis, marketing.

Dollar Signs With Growing Up Arrow For Profit Growth Ppt PowerPoint Presentation Layouts Examples
This is a dollar signs with growing up arrow for profit growth ppt powerpoint presentation layouts examples. This is a four stage process. The stages in this process are growth, increase sales, increase revenue.
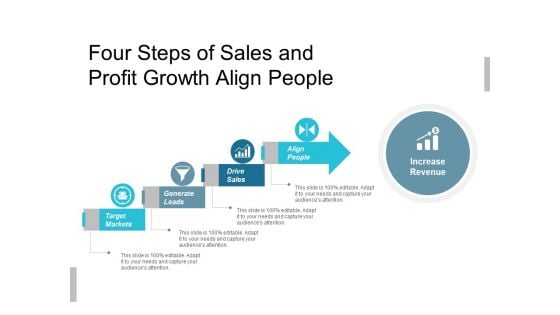
Four Steps Of Sales And Profit Growth Align People Ppt PowerPoint Presentation Infographic Template Deck
This is a four steps of sales and profit growth align people ppt powerpoint presentation infographic template deck. This is a four stage process. The stages in this process are growth, increase sales, increase revenue.
Profit And Financial Growth Arrow With Dollar Signs Ppt PowerPoint Presentation Icon Topics
This is a profit and financial growth arrow with dollar signs ppt powerpoint presentation icon topics. This is a three stage process. The stages in this process are growth, increase sales, increase revenue.
Profit Growth Bar Graph With Rising Arrow And Dollar Sign Ppt PowerPoint Presentation Icon Designs
This is a profit growth bar graph with rising arrow and dollar sign ppt powerpoint presentation icon designs. This is a five stage process. The stages in this process are growth, increase sales, increase revenue.
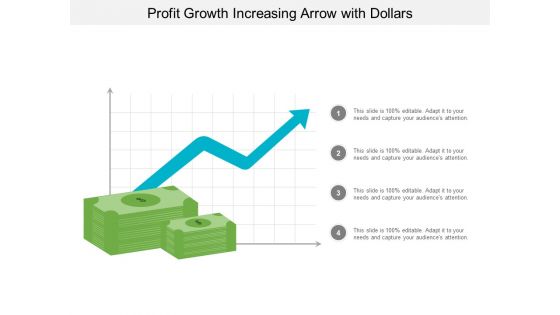
Profit Growth Increasing Arrow With Dollars Ppt PowerPoint Presentation Model Outfit
This is a profit growth increasing arrow with dollars ppt powerpoint presentation model outfit. This is a four stage process. The stages in this process are growth, increase sales, increase revenue.
Waterfall Chart Showing Effective Pricing And Profitability Insight Ppt PowerPoint Presentation Icon Graphics
This is a waterfall chart showing effective pricing and profitability insight ppt powerpoint presentation icon graphics. This is a seven stage process. The stages in this process are sales waterfall, waterfall chart, business.
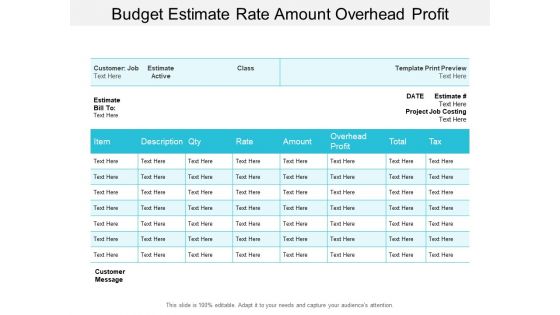
Budget Estimate Rate Amount Overhead Profit Ppt PowerPoint Presentation Infographics Design Ideas
This is a budget estimate rate amount overhead profit ppt powerpoint presentation infographics design ideas. This is a two stage process. The stages in this process are estimate, guess, evaluate.

Product Sales Report Dashboard For Profit Margin Analysis Ppt PowerPoint Presentation Ideas Slide Portrait
This is a product sales report dashboard for profit margin analysis ppt powerpoint presentation ideas slide portrait. This is a four stage process. The stages in this process are business analytics, ba, organizations data.
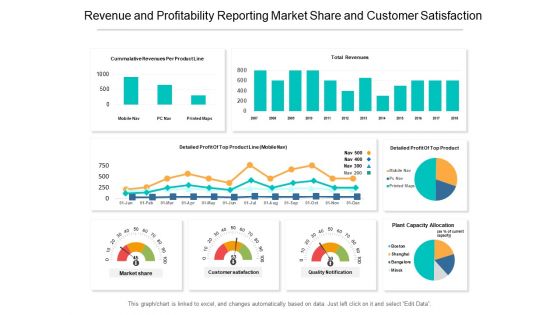
Revenue And Profitability Reporting Market Share And Customer Satisfaction Ppt PowerPoint Presentation Styles Format Ideas
This is a revenue and profitability reporting market share and customer satisfaction ppt powerpoint presentation styles format ideas. This is a four stage process. The stages in this process are business analytics, ba, organizations data.
Quarterly Financial Report With Expenses And Gross Profit Ppt PowerPoint Presentation Ideas Icons
This is a quarterly financial report with expenses and gross profit ppt powerpoint presentation ideas icons. This is a five stage process. The stages in this process are accounting review, accounting report, accounting statement.

Three Stages Of Business Innovation With Profit And Time Ppt Powerpoint Presentation Inspiration Slides
This is a three stages of business innovation with profit and time ppt powerpoint presentation inspiration slides. This is a three stage process. The stages in this process are.
Five Steps With Icons For Profitability Analysis Ppt Powerpoint Presentation Portfolio Backgrounds
This is a five steps with icons for profitability analysis ppt powerpoint presentation portfolio backgrounds. This is a five stage process. The stages in this process are 7 point infographic, 7 steps infographic, 7 stages infographic.
Profit Progress Sales Growth Vector Icon Ppt Powerpoint Presentation Pictures Graphics
This is a profit progress sales growth vector icon ppt powerpoint presentation pictures graphics. This is a stage process. The stages in this process are increase icon, improved icon, growth icon.
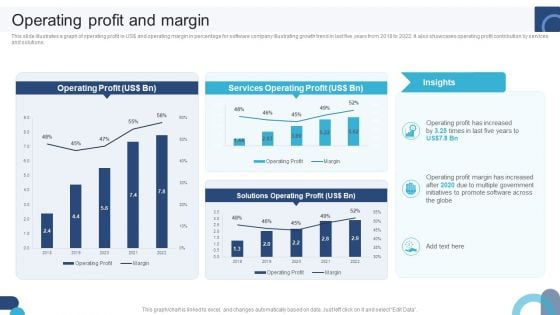
Digital Application Software Development Business Profile Operating Profit And Margin Professional PDF
This slide illustrates a graph of operating profit in US dollar and operating margin in percentage for software company illustrating growth trend in last five years from 2018 to 2022. It also showcases operating profit contribution by services and solutions. Explore a selection of the finest Digital Application Software Development Business Profile Operating Profit And Margin Professional PDF here. With a plethora of professionally designed and pre-made slide templates, you can quickly and easily find the right one for your upcoming presentation. You can use our Digital Application Software Development Business Profile Operating Profit And Margin Professional PDF to effectively convey your message to a wider audience. Slidegeeks has done a lot of research before preparing these presentation templates. The content can be personalized and the slides are highly editable. Grab templates today from Slidegeeks.
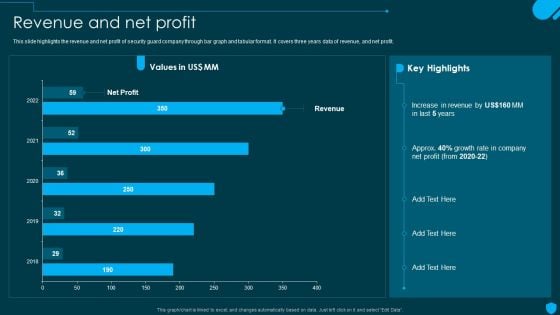
Security And Human Resource Services Business Profile Revenue And Net Profit Designs PDF
This slide highlights the revenue and net profit of security guard company through bar graph and tabular format. It covers three years data of revenue, and net profit. Explore a selection of the finest Security And Human Resource Services Business Profile Revenue And Net Profit Designs PDF here. With a plethora of professionally designed and pre-made slide templates, you can quickly and easily find the right one for your upcoming presentation. You can use our Security And Human Resource Services Business Profile Revenue And Net Profit Designs PDF to effectively convey your message to a wider audience. Slidegeeks has done a lot of research before preparing these presentation templates. The content can be personalized and the slides are highly editable. Grab templates today from Slidegeeks.


 Continue with Email

 Home
Home


