Value Icon
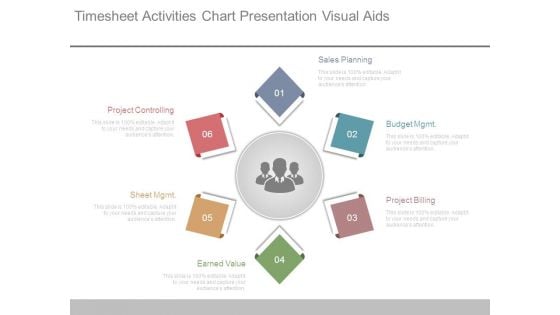
Timesheet Activities Chart Presentation Visual Aids
This is a timesheet activities chart presentation visual aids. This is a six stage process. The stages in this process are sales planning, budget mgmt, project billing, earned value, sheet mgmt, project controlling.
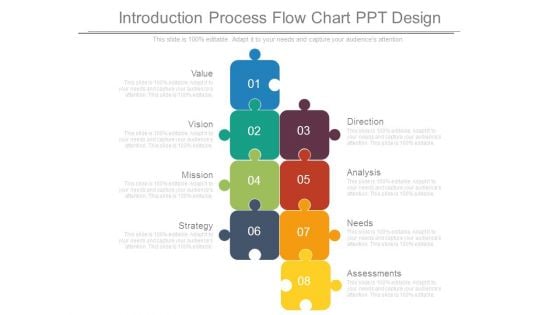
Introduction Process Flow Chart Ppt Design
This is a introduction process flow chart ppt design. This is a eight stage process. The stages in this process are value, vision, mission, strategy, assessments, needs, analysis, direction.
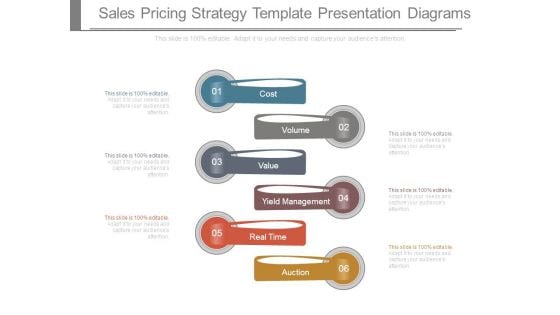
Sales Pricing Strategy Template Presentation Diagrams
This is a sales pricing strategy template presentation diagrams. This is a six stage process. The stages in this process are cost, volume, value, yield management, real time, auction.
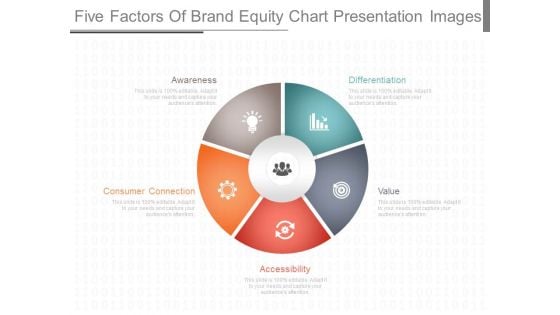
Five Factors Of Brand Equity Chart Presentation Images
This is a five factors of brand equity chart presentation images. This is a five stage process. The stages in this process are awareness, differentiation, consumer connection, accessibility, value. \n \n \n \n \n \n \n \n \n \n
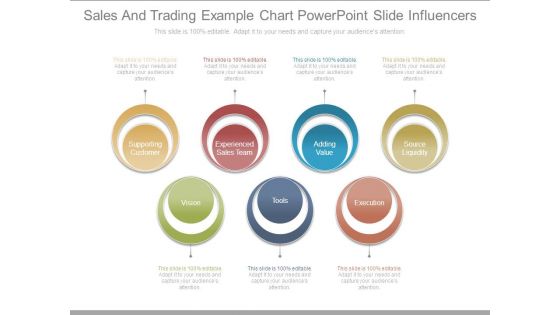
Sales And Trading Example Chart Powerpoint Slide Influencers
This is a sales and trading example chart powerpoint slide influencers. This is a seven stage process. The stages in this process are supporting customer, experienced sales team, adding value, source liquidity, vision, tools, execution.
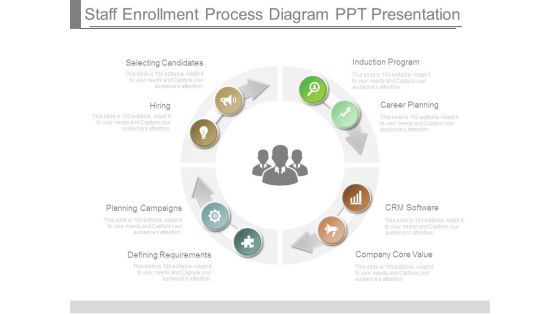
Staff Enrollment Process Diagram Ppt Presentation
This is a staff enrollment process diagram ppt presentation. This is a four stage process. The stages in this process are selecting candidates, hiring, planning campaigns, defining requirements, company core value, crm software, career planning, induction program.
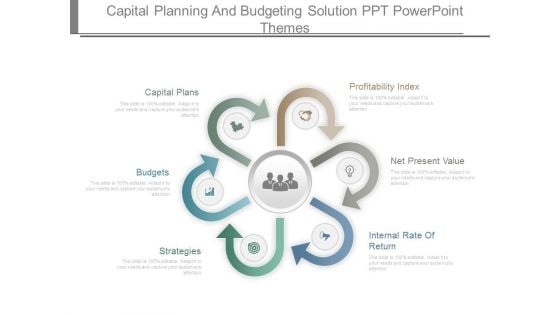
Capital Planning And Budgeting Solution Ppt Powerpoint Themes
This is a capital planning and budgeting solution ppt powerpoint themes. This is a six stage process. The stages in this process are profitability index, net present value, internal rate of return, strategies, budgets, capital plans.
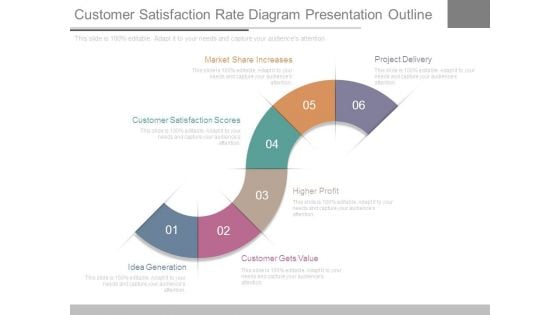
Customer Satisfaction Rate Diagram Presentation Outline
This is a customer satisfaction rate diagram presentation outline. This is a six stage process. The stages in this process are idea generation, customer gets value, higher profit, customer satisfaction scores, market share increases, project delivery.
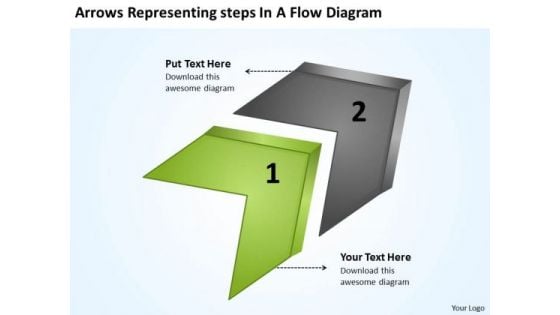
Arrows Representing Steps Flow Diagram Chart Creator Online PowerPoint Templates
We present our arrows representing steps flow diagram chart creator online PowerPoint templates.Download our Leadership PowerPoint Templates because our creative template will lay down your views. Use our Busines PowerPoint Templates because you should explain the process by which you intend to right it. Download and present our Arrows PowerPoint Templates because they pinpoint the core values of your organisation. Use our Process and Flows PowerPoint Templates because getting it done may not be enough. Present our Shapes PowerPoint Templates because this slide demonstrates how they contribute to the larger melting pot.Use these PowerPoint slides for presentations relating to 3d, Abstract, Around, Arrows, Blue, Border, Business, Center, Circle, Circular, Concept, Connections, Copy, Curve, Cycle, Directions, Distribution, Illustration, Management, Middle, Objects, Pieces, Plan, Pointing, Process, Recycle, Rounded, Shadows, Space, System. The prominent colors used in the PowerPoint template are Green, Gray, Black. Customers tell us our arrows representing steps flow diagram chart creator online PowerPoint templates are Efficacious. You can be sure our Arrows PowerPoint templates and PPT Slides are Detailed. Presenters tell us our arrows representing steps flow diagram chart creator online PowerPoint templates are Fun. Professionals tell us our Arrows PowerPoint templates and PPT Slides are Chic. Presenters tell us our arrows representing steps flow diagram chart creator online PowerPoint templates are Chic. Professionals tell us our Border PowerPoint templates and PPT Slides are Romantic. Take all factors into account. Take a cue from our Arrows Representing Steps Flow Diagram Chart Creator Online PowerPoint Templates.
Steady Aim Success PowerPoint Themes And PowerPoint Slides 0611
Microsoft PowerPoint Theme and Slide with a steady aim at a target Our Steady Aim Success PowerPoint Themes And PowerPoint Slides 0611 give exceptional value. You will be amazed at the awesome returns.

Cross Religion PowerPoint Themes And PowerPoint Slides 0711
Microsoft PowerPoint Theme and Slide with crucifix and sheet music Our Cross Religion PowerPoint Themes And PowerPoint Slides 0711 give exceptional value. You will be amazed at the awesome returns.
Atmospheric Pollution Concept Nature PowerPoint Templates And PowerPoint Themes 0812
Atmospheric Pollution Concept Nature PowerPoint Templates And PowerPoint Themes 0812-Microsoft Powerpoint Templates and Background with atmospheric pollution Our Atmospheric Pollution Concept Nature PowerPoint Templates And PowerPoint Themes 0812 give exceptional value. You will be amazed at the awesome returns.
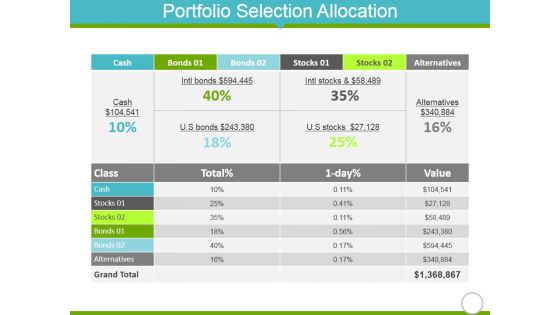
Portfolio Selection Allocation Template 2 Ppt PowerPoint Presentation Gallery Themes
This is a portfolio selection allocation template 2 ppt powerpoint presentation gallery themes. This is a two stage process. The stages in this process are cash, bonds, stocks, alternatives, value.

Cost Performance Index Ppt PowerPoint Presentation Infographics Themes
This is a cost performance index ppt powerpoint presentation infographics themes. This is a two stage process. The stages in this process are cost performance index, ev term, value, finance.
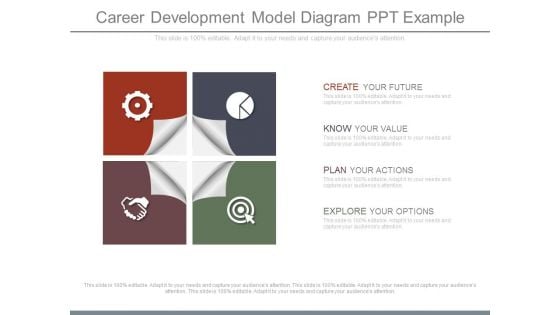
Career Development Model Diagram Ppt Example
This is a career development model diagram ppt example. This is a four stage process. The stages in this process are create your future, know your value, plan your actions, explore your options.
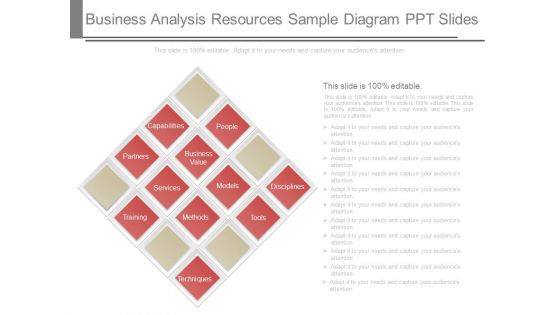
Business Analysis Resources Sample Diagram Ppt Slides
This is a business analysis resources sample diagram ppt slides. This is a one stage process. The stages in this process are people, disciplines, capabilities, business value, models, tools, partners, services, methods, training, techniques.
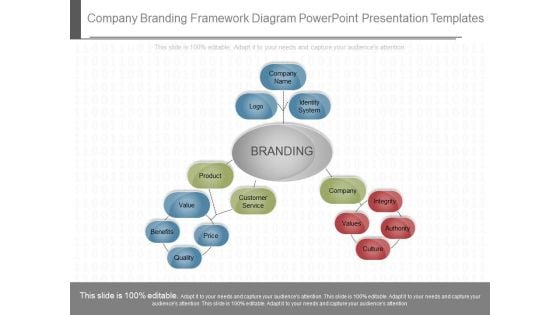
Company Branding Framework Diagram Powerpoint Presentation Templates
This is a company branding framework diagram powerpoint presentation templates. This is a one stage process. The stages in this process are company name, logo, identity system, branding, product, customer service, value, price, benefits, quality, company, integrity, authority, culture.
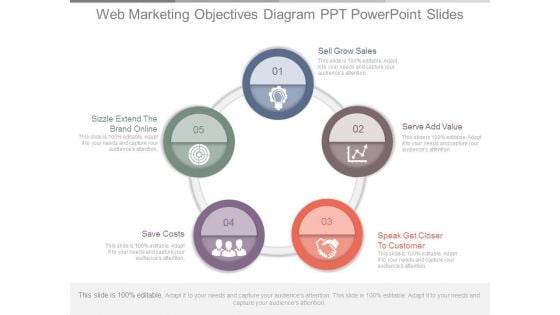
Web Marketing Objectives Diagram Ppt Powerpoint Slides
This is a web marketing objectives diagram ppt powerpoint slides. This is a five stage process. The stages in this process are sell grow sales, serve add value, speak get closer to customer, save costs, sizzle extend the brand online.
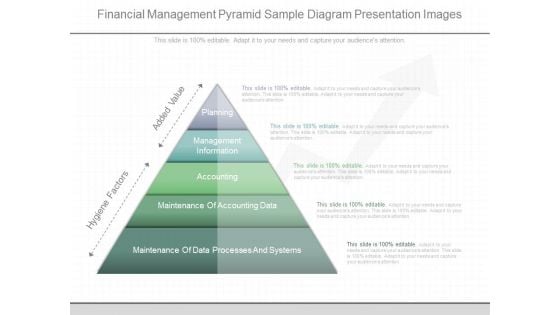
Financial Management Pyramid Sample Diagram Presentation Images
This is a financial management pyramid sample diagram presentation images. This is a five stage process. The stages in this process are planning, management information, accounting, maintenance of accounting data, maintenance of data processes and systems, hygiene factors, added value.
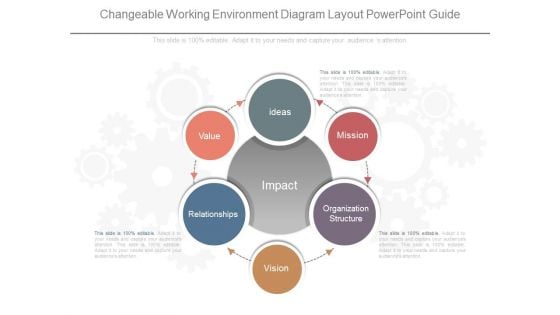
Changeable Working Environment Diagram Layout Powerpoint Guide
This is a changeable working environment diagram layout powerpoint guide. This is a three stage process. The stages in this process are ideas, mission, organization structure, vision, relationships, value.

Strategic Alignment And Business Contribution Diagram Summary
This is a strategic alignment and business contribution diagram summary. This is a eight stage process. The stages in this process are strategic alignment, business contribution, risk impact, complexity, business value, likelihood of success, direction, velocity, uncertainty, do ability.
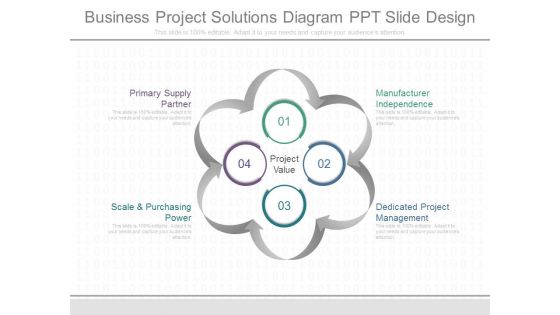
Business Project Solutions Diagram Ppt Slide Design
This is a business project solutions diagram ppt slide design. This is a four stage process. The stages in this process are primary supply partner, scale and purchasing power, project value, manufacturer independence, dedicated project management.
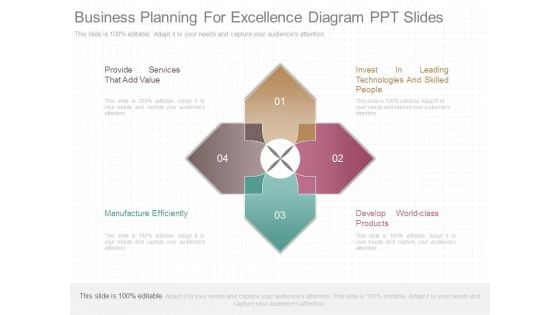
Business Planning For Excellence Diagram Ppt Slides
This is a business planning for excellence diagram ppt slides. This is a four stage process. The stages in this process are provide services that add value, manufacture efficiently, invest in leading technologies and skilled people, develop world class products.
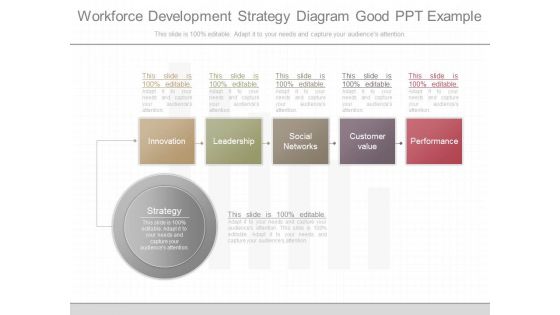
Workforce Development Strategy Diagram Good Ppt Example
This is a workforce development strategy diagram good ppt example. This is a six stage process. The stages in this process are innovation, leadership, social networks, customer value, performance, strategy.
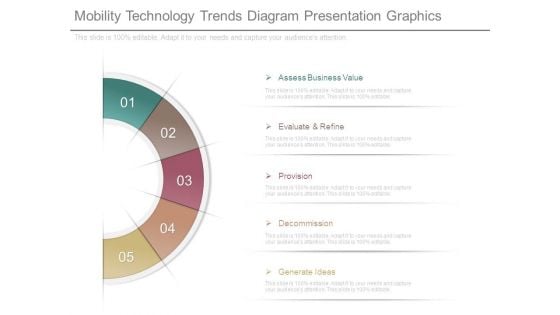
Mobility Technology Trends Diagram Presentation Graphics
This is a Mobility Technology Trends Diagram Presentation Graphics. This is a five stage process. The stages in this process are assess business value, evaluate and refine, provision, decommission, generate ideas.
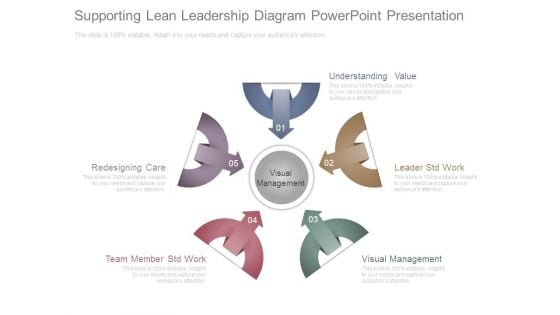
Supporting Lean Leadership Diagram Powerpoint Presentation
This is a supporting lean leadership diagram powerpoint presentation. This is a five stage process. The stages in this process are redesigning care, team member std work, understanding value, visual management, leader std work, visual management.
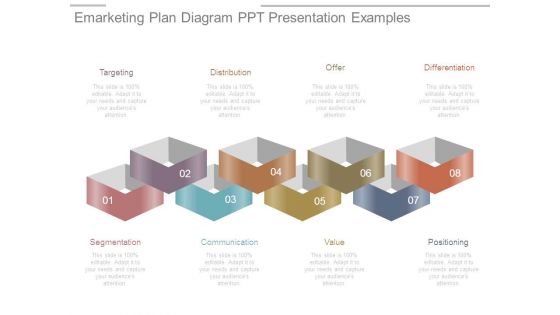
Emarketing Plan Diagram Ppt Presentation Examples
This is a emarketing plan diagram ppt presentation examples. This is a eight stage process. The stages in this process are targeting, distribution, offer, differentiation, segmentation, communication, value, positioning.
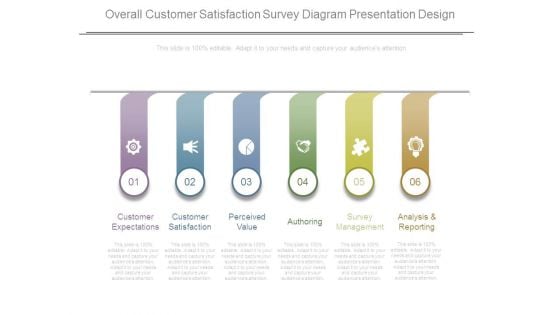
Overall Customer Satisfaction Survey Diagram Presentation Design
This is a overall customer satisfaction survey diagram presentation design. This is a six stage process. The stages in this process are customer expectations, customer satisfaction, perceived value, authoring, survey management, analysis and reporting.
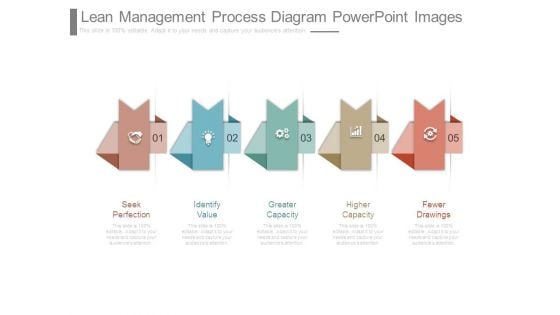
Lean Management Process Diagram Powerpoint Images
This is a lean management process diagram powerpoint images. This is a five stage process. The stages in this process are seek perfection, identify value, greater capacity, higher capacity, fewer drawings.
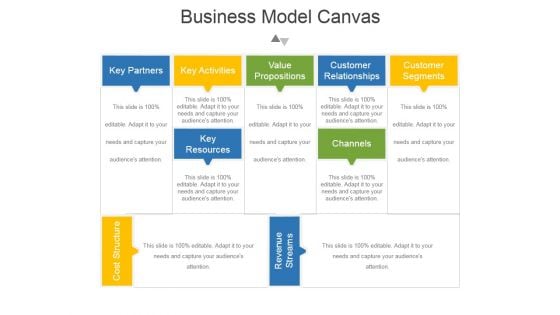
Business Model Canvas Ppt PowerPoint Presentation Diagrams
This is a business model canvas ppt powerpoint presentation diagrams. This is a five stage process. The stages in this process are key partners, key activities, value, propositions, customer, relationships, customer segments, key resources, channels.
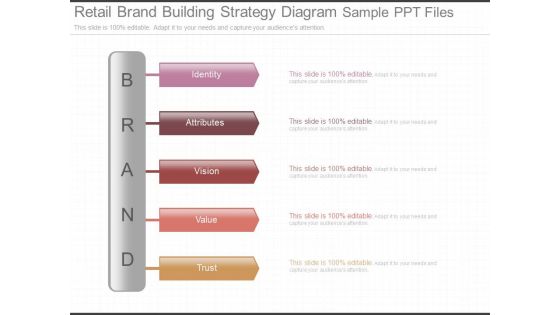
Retail Brand Building Strategy Diagram Sample Ppt Files
This is a retail brand building strategy diagram sample ppt files. This is a five stage process. The stages in this process are brand, identity, attributes, vision, value, trust.
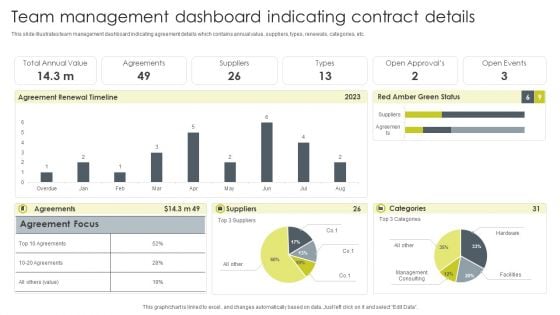
Team Management Dashboard Indicating Contract Details Diagrams PDF
This slide illustrates team management dashboard indicating agreement details which contains annual value, suppliers, types, renewals, categories, etc. Showcasing this set of slides titled Team Management Dashboard Indicating Contract Details Diagrams PDF. The topics addressed in these templates are Suppliers, Agreements, Total Annual Value. All the content presented in this PPT design is completely editable. Download it and make adjustments in color, background, font etc. as per your unique business setting.
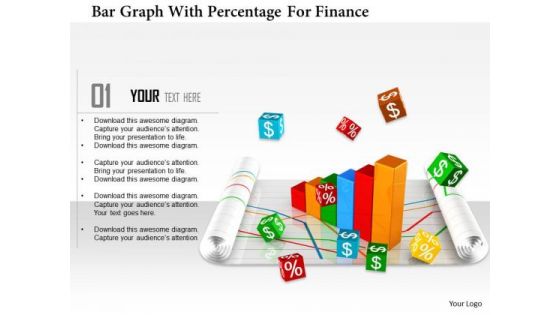
Stock Photo Bar Graph With Percentage For Finance PowerPoint Slide
This Power Point template has been designed with graphic of bar graph and percentage value. This image slide contains the concept of finance and accounting. Use this editable diagram for your business and finance related presentations.
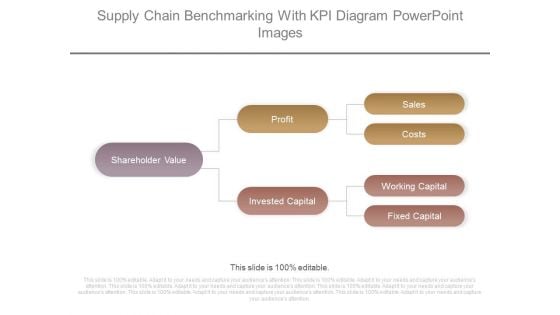
Supply Chain Benchmarking With Kpi Diagram Powerpoint Images
This is a supply chain benchmarking with kpi diagram powerpoint images. This is a three stage process. The stages in this process are shareholder value, profit, invested capital, sales, costs, working capital, fixed capital.
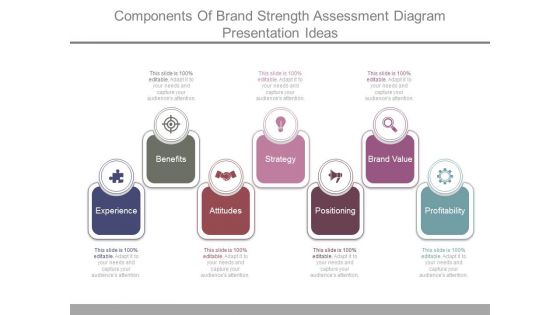
Components Of Brand Strength Assessment Diagram Presentation Ideas
This is a components of brand strength assessment diagram presentation ideas. This is a seven stage process. The stages in this process are benefits, experience, attitudes, strategy, positioning, brand value, profitability.
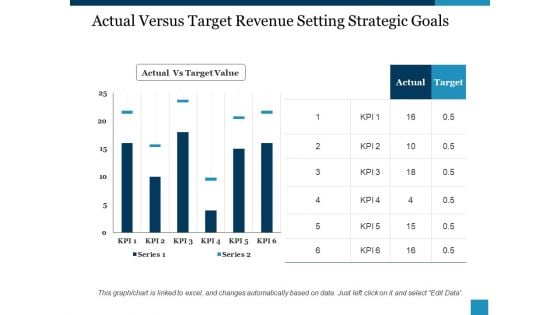
Actual Versus Target Revenue Setting Strategic Goals Ppt PowerPoint Presentation Visual Aids Diagrams
This is a actual versus target revenue setting strategic goals ppt powerpoint presentation visual aids diagrams. This is a six stage process. The stages in this process are actual vs target value, actual, target, kpi, series.
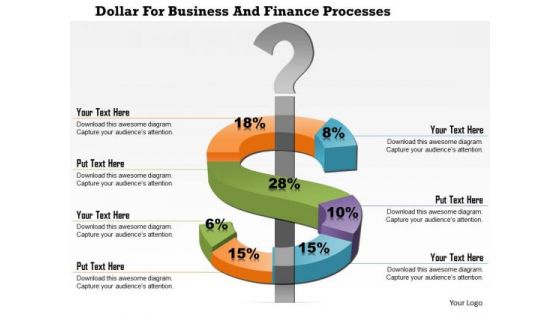
Business Diagram Dollar For Business And Finance Processes Presentation Template
This business diagram displays dollar symbol around a question mark. This diagram depicts change in dollar currency value. Use this slide to make financial and business reports and presentations.
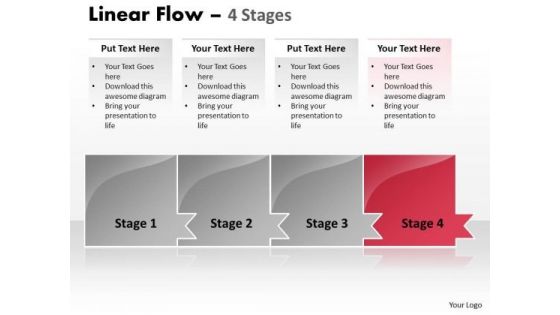
Process Ppt Template Horizontal Model Of 4 Concepts Time Management PowerPoint 5 Graphic
We present our process PPT template horizontal model of 4 concepts time management PowerPoint 5 Graphic. Use our Arrows PowerPoint Templates because; Raise your Company stocks at the Opening Bell. Use our Symbol PowerPoint Templates because, you have analyzed the illness and know the need. Use our Business PowerPoint Templates because; illustrate your chain of ideas focusing on that aspect or resource in order to enhance the quality of your product. Use our Process and flows PowerPoint Templates because, they pinpoint the core values of your organization. Use our Abstract PowerPoint Templates because, you have the entire picture in mind. Use these PowerPoint slides for presentations relating to Abstract, Arrow, Business, Chart, Design, Development, Diagram, Direction, Element, Flow, Flowchart, Graph, Linear, Management, Model, Motion, Organization, Plan, Process, Program, Section, Segment, Set, Sign, Solution, Strategy, Symbol, Technology. The prominent colors used in the PowerPoint template are Red, Gray, and White Exult in the happiness of your performance. Convey your emotions through our Process Ppt Template Horizontal Model Of 4 Concepts Time Management PowerPoint 5 Graphic.
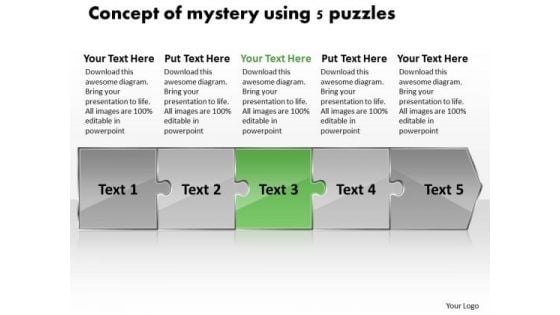
Concept Of Mystery Using 5 Puzzles Program Flowchart PowerPoint Templates
We present our concept of mystery using 5 puzzles program flowchart PowerPoint templates.Use our Puzzles or Jigsaws PowerPoint Templates because,You can Churn the wheels of the brains of your colleagues. Use our Business PowerPoint Templates because, It will demonstrate the strength of character under severe stress. Shine the torch ahead and bring the light to shine on all Use our Shapes PowerPoint Templates because, You can Transmit your passion via our creative templates. Use our Process and Flows PowerPoint Templates because,They pinpoint the core values of your organisation. Use our Abstract PowerPoint Templates because,our template will illustrate what you want to say.Use these PowerPoint slides for presentations relating to Abstract, Action, Attach, Box, Business, Center, Chain, Chart, Color, Communication, Concept, Connection, Cube, Cycle, Data, Diagram, Flow, Globe, Horizontal, Idea, Illustration, Information, Interaction, Jigsaw, Join, Link, Pieces, Process, Puzzle, Relation, Relationship, Shape, Success. The prominent colors used in the PowerPoint template are Green, Gray, Black Our Concept Of Mystery Using 5 Puzzles Program Flowchart PowerPoint Templates are specially created by professionals. They diligently strive to come up with the right vehicle for your thoughts.
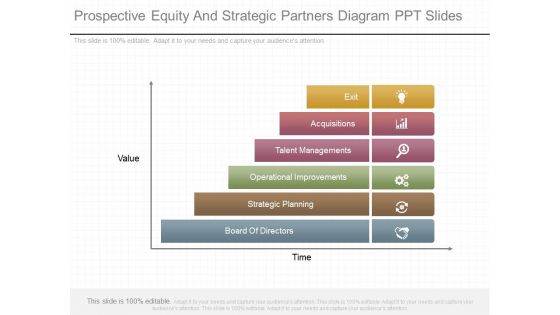
Prospective Equity And Strategic Partners Diagram Ppt Slides
This is a prospective equity and strategic partners diagram ppt slides. This is a six stage process. The stages in this process are value, time, exit, acquisitions, talent managements, operational improvements, strategic planning, board of directors.
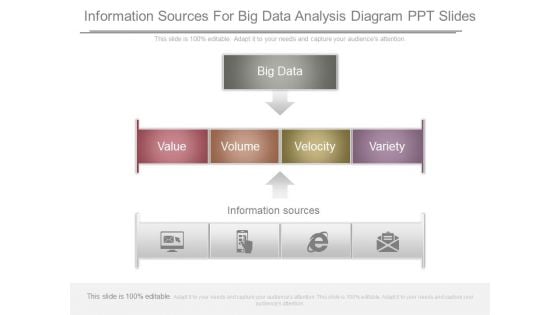
Information Sources For Big Data Analysis Diagram Ppt Slides
This is a information sources for big data analysis diagram ppt slides. This is a three stage process. The stages in this process are big data, value, volume, velocity, variety, information sources.
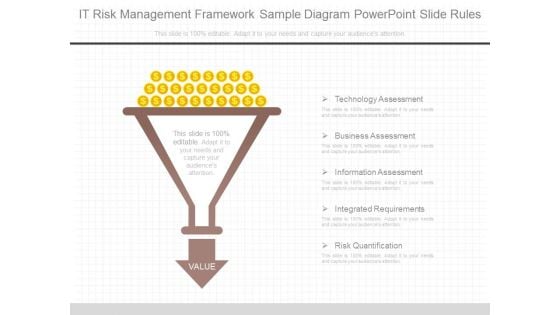
It Risk Management Framework Sample Diagram Powerpoint Slide Rules
This is a it risk management framework sample diagram powerpoint slide rules. This is a two stage process. The stages in this process are technology assessment, business assessment, information assessment, integrated requirements, risk quantification, value.
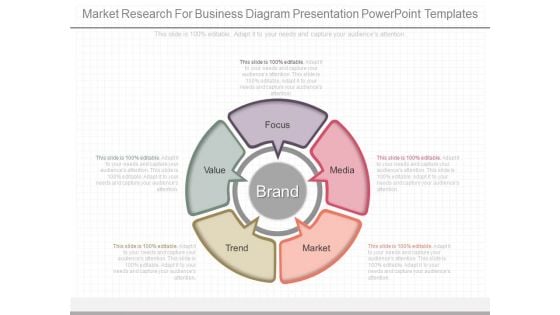
Market Research For Business Diagram Presentation Powerpoint Templates
This is a market research for business diagram presentation powerpoint templates. This is a five stage process. The stages in this process are focus, media, value, brand, trend, market.
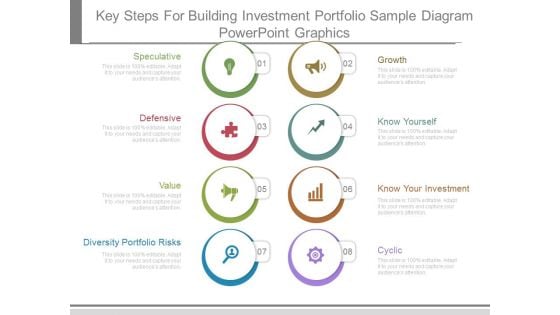
Key Steps For Building Investment Portfolio Sample Diagram Powerpoint Graphics
This is a key steps for building investment portfolio sample diagram powerpoint graphics. This is a eight stage process. The stages in this process are speculative, defensive, value, diversity portfolio risks, growth, know yourself, know your investment, cyclic.
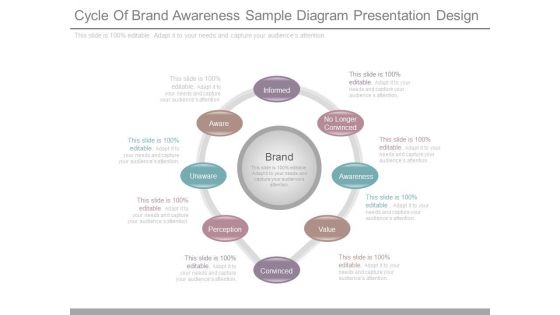
Cycle Of Brand Awareness Sample Diagram Presentation Design
This is a cycle of brand awareness sample diagram presentation design. This is a eight stage process. The stages in this process are informed, aware, unaware, perception, convinced, value, awareness, no longer convinced, brand.
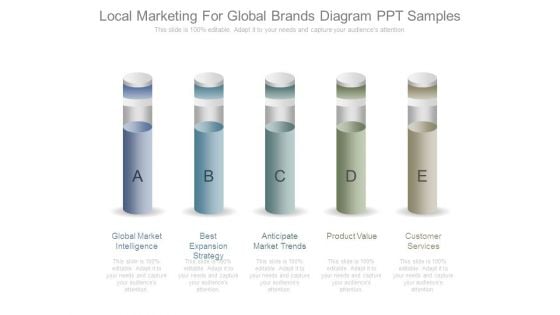
Local Marketing For Global Brands Diagram Ppt Samples
This is a local marketing for global brands diagram ppt samples. This is a five stage process. The stages in this process are global market intelligence, best expansion strategy, anticipate market trends, product value, customer services.
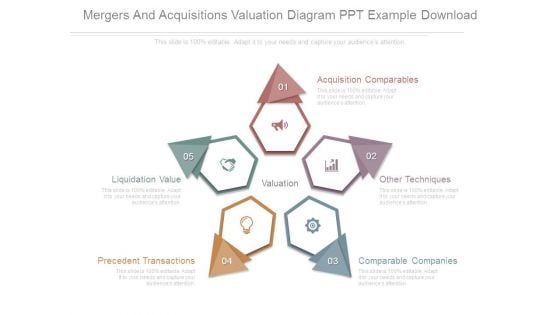
Mergers And Acquisitions Valuation Diagram Ppt Example Download
This is a mergers and acquisitions valuation diagram ppt example download. This is a five stage process. The stages in this process are acquisition comparables, other techniques, comparable companies, precedent transactions, liquidation value, valuation.

Shopping Cart With Presents Sales PowerPoint Themes And PowerPoint Slides 0411
Microsoft PowerPoint Theme and Slide with shopping cart with presents Our Shopping Cart With Presents Sales PowerPoint Themes And PowerPoint Slides 0411 give exceptional value. You will be amazed at the awesome returns.
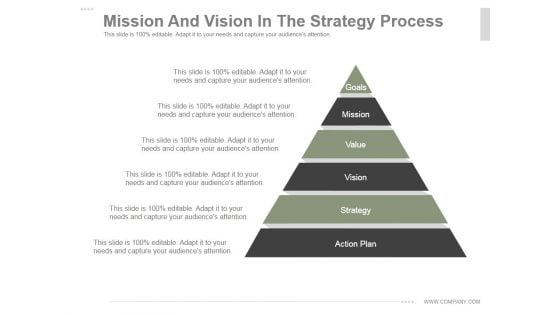
Mission And Vision In The Strategy Process Ppt PowerPoint Presentation Diagrams
This is a mission and vision in the strategy process ppt powerpoint presentation diagrams. This is a six stage process. The stages in this process are goals, mission, value, vision, strategy, action plan.
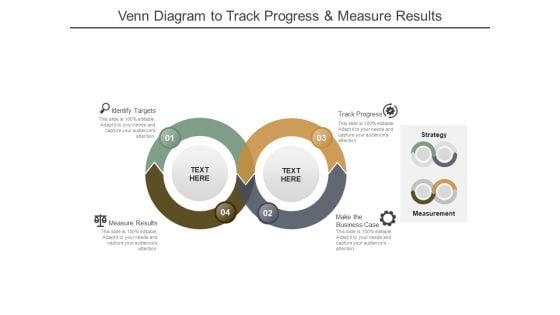
Venn Diagram To Track Progress And Measure Results Ppt PowerPoint Presentation Inspiration Slides
This is a venn diagram to track progress and measure results ppt powerpoint presentation inspiration slides. This is a four stage process. The stages in this process are hared value, shared merit, shared worth.
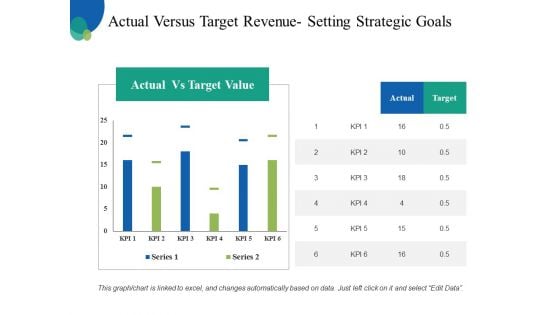
Actual Versus Target Revenue Setting Strategic Goals Ppt PowerPoint Presentation Ideas Elements
This is a actual versus target revenue setting strategic goals ppt powerpoint presentation ideas elements. This is a two stage process. The stages in this process are actual vs target value, actual, target, business, planning.
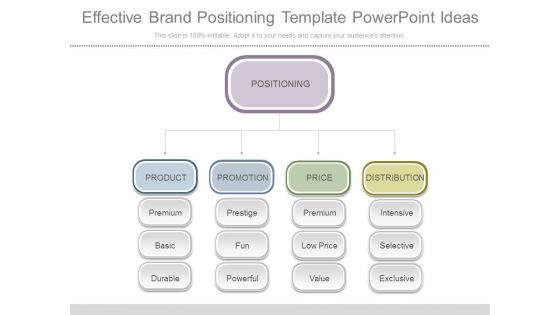
Effective Brand Positioning Template Powerpoint Ideas
This is a effective brand positioning template powerpoint ideas. This is a four stage process. The stages in this process are positioning, product, promotion, price, distribution, premium, prestige, intensive, selective, low price, fun, basic, durable, powerful, value, exclusive.
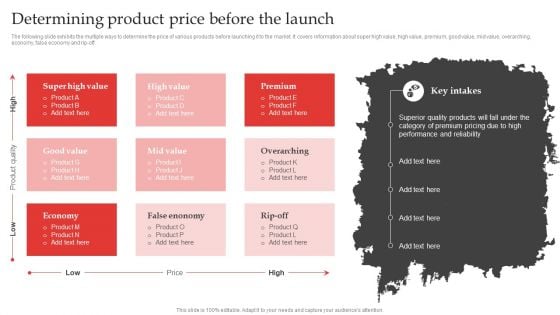
Red Ocean Technique Overcoming Competition Determining Product Price Before The Launch Inspiration PDF
The following slide exhibits the multiple ways to determine the price of various products before launching it to the market. It covers information about super high value, high value, premium, good value, mid value, overarching, economy, false economy and rip-off. Get a simple yet stunning designed Red Ocean Technique Overcoming Competition Determining Product Price Before The Launch Inspiration PDF. It is the best one to establish the tone in your meetings. It is an excellent way to make your presentations highly effective. So, download this PPT today from Slidegeeks and see the positive impacts. Our easy-to-edit Red Ocean Technique Overcoming Competition Determining Product Price Before The Launch Inspiration PDF can be your go-to option for all upcoming conferences and meetings. So, what are you waiting for. Grab this template today.
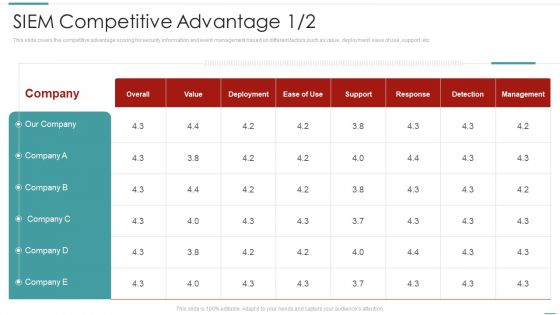
Risk Recognition Automation Siem Competitive Advantage Ppt Layouts Themes PDF
This slide covers the competitive advantage scoring for security information and event management based on different factors such as value, deployment, ease of use, support, etc. Deliver and pitch your topic in the best possible manner with this risk recognition automation siem competitive advantage ppt layouts themes pdf. Use them to share invaluable insights on value, support, response, detection, management and impress your audience. This template can be altered and modified as per your expectations. So, grab it now.
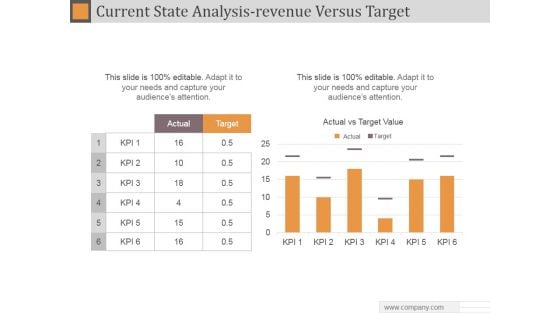
Current State Analysis Revenue Versus Target Ppt PowerPoint Presentation Background Designs
This is a current state analysis revenue versus target ppt powerpoint presentation background designs. This is a six stage process. The stages in this process are actual, target, actual vs target value.
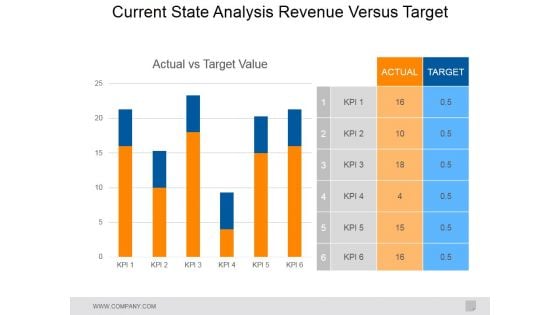
Current State Analysis Revenue Versus Target Ppt PowerPoint Presentation Model Smartart
This is a current state analysis revenue versus target ppt powerpoint presentation model smartart. This is a two stage process. The stages in this process are actual, target, actual vs target value.
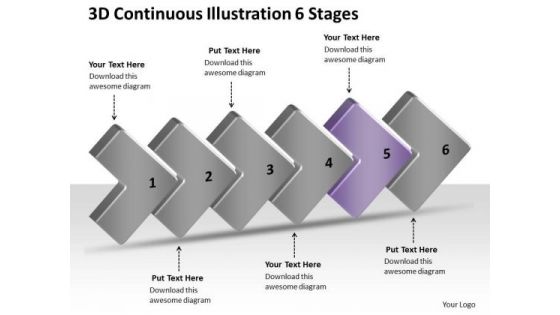
3d Continuous Illustration 6 Stages Ppt Make Flow Chart PowerPoint Slides
We present our 3d continuous illustration 6 stages ppt make flow chart PowerPoint Slides. Use our Arrows PowerPoint Templates because; Reaffirm to your team your faith in maintaining the highest ethical standards. Use our Marketing PowerPoint Templates because, now fire the arrows to emblazon the desired path by which you will achieve anticipated results. Use our Success PowerPoint Templates because, Profit fairly earned is what you believe in. Use our Process and Flows PowerPoint Templates because, Build on your foundation or prepare for change ahead to enhance the future. Use our Business PowerPoint Templates because, they pinpoint the core values of your organization. Use these PowerPoint slides for presentations relating to Algorithm, Arrow, Arrows, Block, Business, Chart, Connection, Design, Development, Diagram, Direction, Element, Flow, Flowchart, Graph, Kind, Linear, Management, Of, Organization, Process, Program, Section, Segment, Set, Sign, Solution, Strategy, Symbol. The prominent colors used in the PowerPoint template are Purple, Gray, and Black Attract the creme-de-la-creme with our 3d Continuous Illustration 6 Stages Ppt Make Flow Chart PowerPoint Slides. Give the elite an exclusive experience.
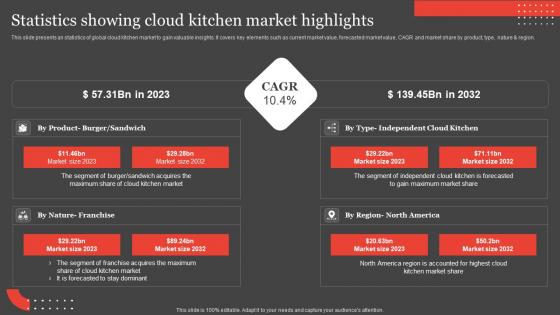
International Food Delivery Market Statistics Showing Cloud Kitchen Market Guidelines Pdf
This slide presents an statistics of global cloud kitchen market to gain valuable insights. It covers key elements such as current market value, forecasted market value, CAGR and market share by product, type, nature and region. Do you know about Slidesgeeks International Food Delivery Market Statistics Showing Cloud Kitchen Market Guidelines Pdf These are perfect for delivering any kind od presentation. Using it, create PowerPoint presentations that communicate your ideas and engage audiences. Save time and effort by using our pre-designed presentation templates that are perfect for a wide range of topic. Our vast selection of designs covers a range of styles, from creative to business, and are all highly customizable and easy to edit. Download as a PowerPoint template or use them as Google Slides themes. This slide presents an statistics of global cloud kitchen market to gain valuable insights. It covers key elements such as current market value, forecasted market value, CAGR and market share by product, type, nature and region.
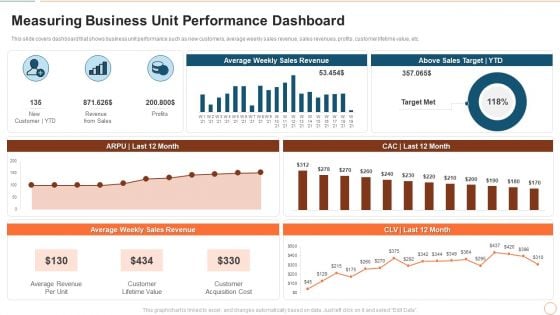
Illustrating Product Leadership Plan Incorporating Innovative Techniques Measuring Business Unit Professional PDF
This slide covers dashboard that shows business unit performance such as new customers, average weekly sales revenue, sales revenues, profits, customer lifetime value, etc. Deliver an awe inspiring pitch with this creative illustrating product leadership plan incorporating innovative techniques measuring business unit professional pdf bundle. Topics like average revenue per unit, customer lifetime value, customer acquisition cost can be discussed with this completely editable template. It is available for immediate download depending on the needs and requirements of the user.
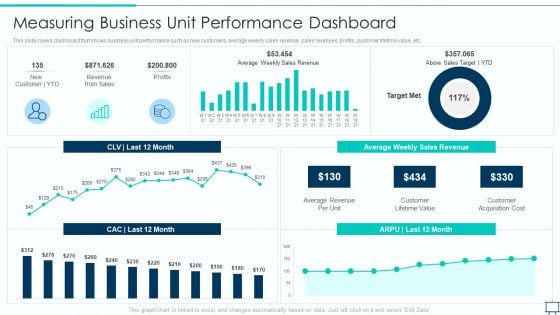
Formulating Competitive Plan Of Action For Effective Product Leadership Measuring Business Unit Slides PDF
This slide covers dashboard that shows business unit performance such as new customers, average weekly sales revenue, sales revenues, profits, customer lifetime value, etc. Deliver an awe inspiring pitch with this creative formulating competitive plan of action for effective product leadership measuring business unit slides pdf bundle. Topics like average revenue per unit, customer lifetime value, customer acquisition cost can be discussed with this completely editable template. It is available for immediate download depending on the needs and requirements of the user.

 Home
Home