Value Icon
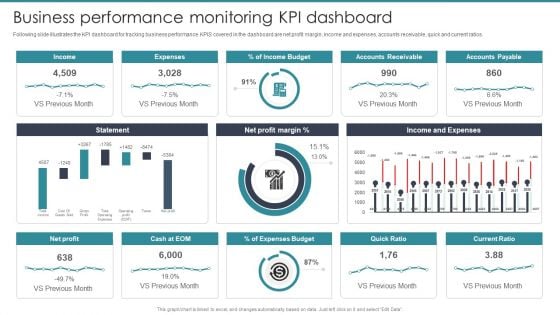
Guide To Mergers And Acquisitions Business Performance Monitoring KPI Dashboard Designs PDF
Following slide illustrates the KPI dashboard for tracking business performance. KPIS covered in the dashboard are net profit margin, income and expenses, accounts receivable, quick and current ratios. Here you can discover an assortment of the finest PowerPoint and Google Slides templates. With these templates, you can create presentations for a variety of purposes while simultaneously providing your audience with an eye catching visual experience. Download Guide To Mergers And Acquisitions Business Performance Monitoring KPI Dashboard Designs PDF to deliver an impeccable presentation. These templates will make your job of preparing presentations much quicker, yet still, maintain a high level of quality. Slidegeeks has experienced researchers who prepare these templates and write high quality content for you. Later on, you can personalize the content by editing the Guide To Mergers And Acquisitions Business Performance Monitoring KPI Dashboard Designs PDF.
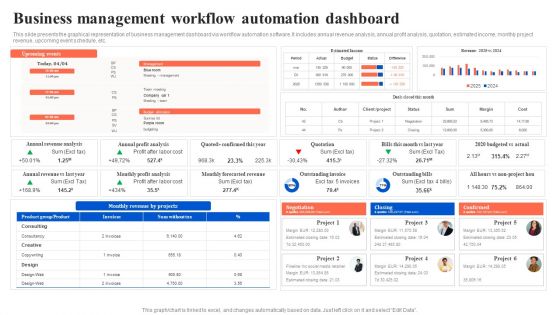
Workflow Automation For Optimizing Organizational Processes Business Management Workflow Infographics PDF
This slide presents the graphical representation of business management dashboard via workflow automation software. It includes annual revenue analysis, annual profit analysis, quotation, estimated income, monthly project revenue, upcoming event schedule, etc. Here you can discover an assortment of the finest PowerPoint and Google Slides templates. With these templates, you can create presentations for a variety of purposes while simultaneously providing your audience with an eye catching visual experience. Download Workflow Automation For Optimizing Organizational Processes Business Management Workflow Infographics PDF to deliver an impeccable presentation. These templates will make your job of preparing presentations much quicker, yet still, maintain a high level of quality. Slidegeeks has experienced researchers who prepare these templates and write high quality content for you. Later on, you can personalize the content by editing the Workflow Automation For Optimizing Organizational Processes Business Management Workflow Infographics PDF.
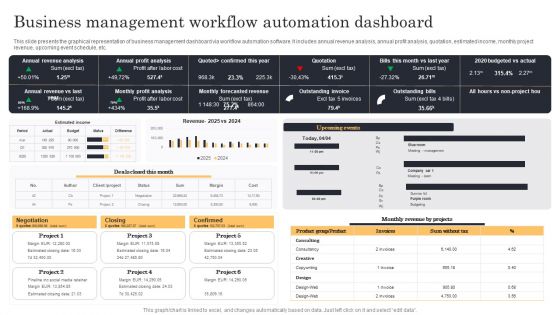
Streamlining Manufacturing Processes With Workflow Automation Business Management Workflow Automation Dashboard Portrait PDF
This slide presents the graphical representation of business management dashboard via workflow automation software. It includes annual revenue analysis, annual profit analysis, quotation, estimated income, monthly project revenue, upcoming event schedule, etc. Slidegeeks is one of the best resources for PowerPoint templates. You can download easily and regulate Streamlining Manufacturing Processes With Workflow Automation Business Management Workflow Automation Dashboard Portrait PDF for your personal presentations from our wonderful collection. A few clicks is all it takes to discover and get the most relevant and appropriate templates. Use our Templates to add a unique zing and appeal to your presentation and meetings. All the slides are easy to edit and you can use them even for advertisement purposes.
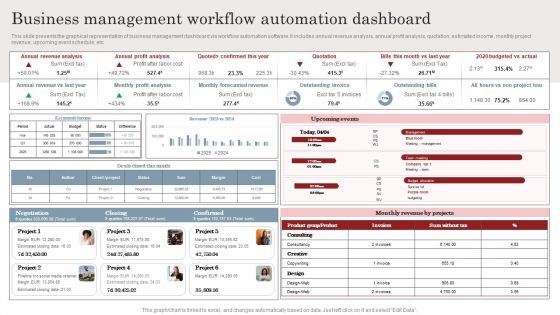
Business Management Workflow Automation Dashboard Ppt Styles Format Ideas PDF
This slide presents the graphical representation of business management dashboard via workflow automation software. It includes annual revenue analysis, annual profit analysis, quotation, estimated income, monthly project revenue, upcoming event schedule, etc. Presenting this PowerPoint presentation, titled Business Management Workflow Automation Dashboard Ppt Styles Format Ideas PDF, with topics curated by our researchers after extensive research. This editable presentation is available for immediate download and provides attractive features when used. Download now and captivate your audience. Presenting this Business Management Workflow Automation Dashboard Ppt Styles Format Ideas PDF. Our researchers have carefully researched and created these slides with all aspects taken into consideration. This is a completely customizable Business Management Workflow Automation Dashboard Ppt Styles Format Ideas PDF that is available for immediate downloading. Download now and make an impact on your audience. Highlight the attractive features available with our PPTs.
Business Management Workflow Automation Dashboard Pictures PDF
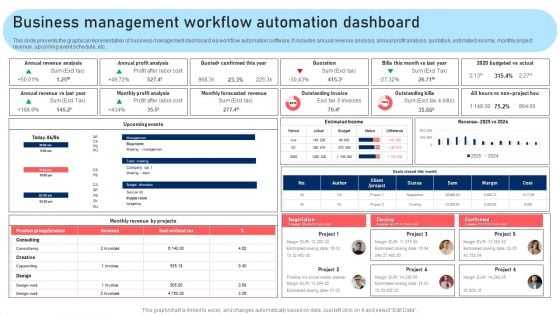
This slide presents the graphical representation of business management dashboard via workflow automation software. It includes annual revenue analysis, annual profit analysis, quotation, estimated income, monthly project revenue, upcoming event schedule, etc. Coming up with a presentation necessitates that the majority of the effort goes into the content and the message you intend to convey. The visuals of a PowerPoint presentation can only be effective if it supplements and supports the story that is being told. Keeping this in mind our experts created Business Management Workflow Automation Dashboard Pictures PDF to reduce the time that goes into designing the presentation. This way, you can concentrate on the message while our designers take care of providing you with the right template for the situation.
Guide To Healthcare Services Administration KPI Dashboard To Analyze Performance Healthcare Financial Demonstration PDF
Pandl Kpis Tabular Form Ppt PowerPoint Presentation Visual Aids
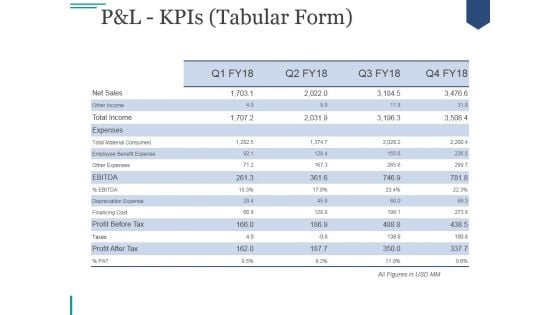
This is a pandl kpis tabular form ppt powerpoint presentation visual aids. This is a four stage process. The stages in this process are revenue, cogs, operating profit, net profit.
Pandl Kpis Tabular Form Ppt PowerPoint Presentation Summary Layout
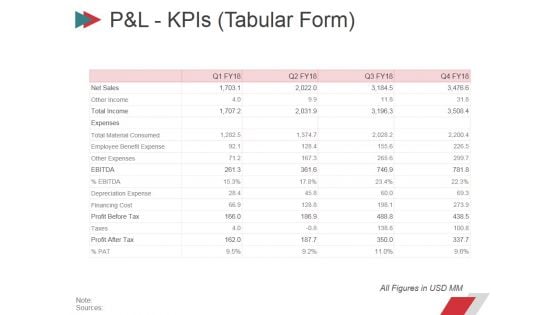
This is a pandl kpis tabular form ppt powerpoint presentation summary layout. This is a four stage process. The stages in this process are revenue, cogs, operating profit, net profit.
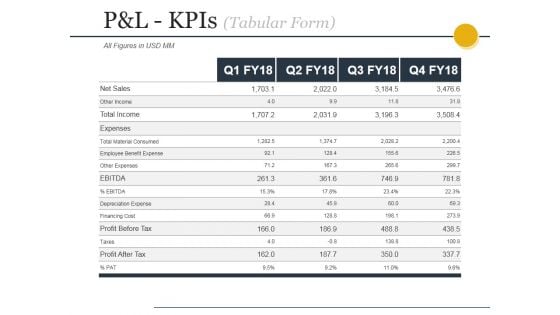
Pandl Kpis Tabular Form Ppt PowerPoint Presentation File Design Templates
This is a pandl kpis tabular form ppt powerpoint presentation file design templates. This is a four stage process. The stages in this process are revenue, cogs, operating profit, net profit.
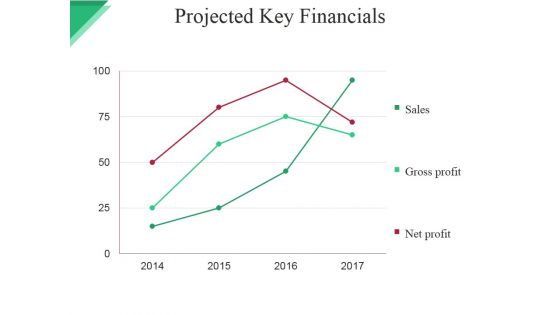
Projected Key Financials Template Ppt PowerPoint Presentation File Graphic Images
This is a projected key financials template ppt powerpoint presentation file graphic images. This is a four stage process. The stages in this process are sales, gross profit, net profit.
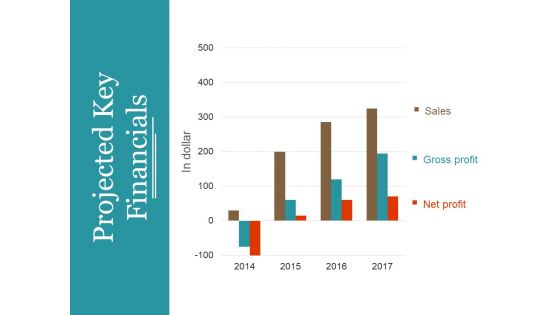
Projected Key Financials Template 1 Ppt PowerPoint Presentation Summary Professional
This is a projected key financials template 1 ppt powerpoint presentation summary professional. This is a three stage process. The stages in this process are in dollar, sales, gross profit, net profit, graph, year.
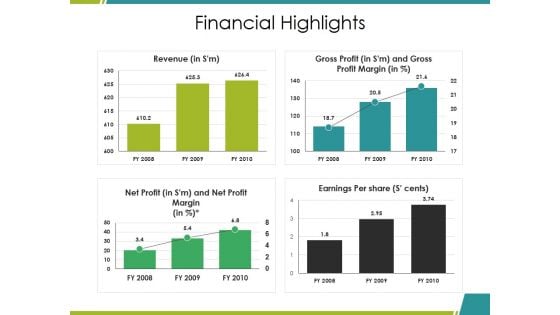
Financial Highlights Ppt PowerPoint Presentation Ideas Graphics Download
This is a financial highlights ppt powerpoint presentation ideas graphics download. This is a four stage process. The stages in this process are revenue, gross profit, net profit, earnings per share, bar graph.
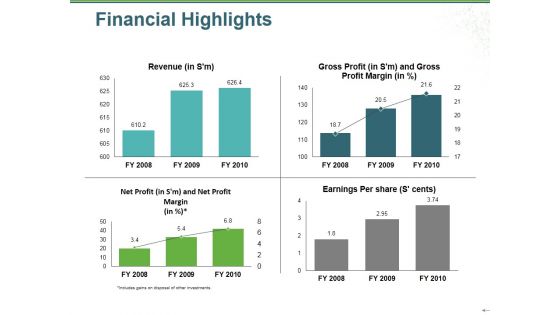
Financial Highlights Ppt PowerPoint Presentation Gallery Graphics Example
This is a financial highlights ppt powerpoint presentation gallery graphics example. This is a four stage process. The stages in this process are revenue, gross profit, net profit, earnings per share, bar graph.
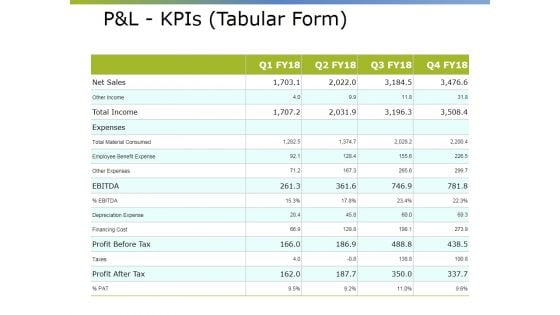
Pandl Kpis Tabular Form Ppt PowerPoint Presentation Pictures Visual Aids
This is a pandl kpis tabular form ppt powerpoint presentation pictures visual aids. This is a four stage process. The stages in this process are revenue, operating profit, cogs, net profit.
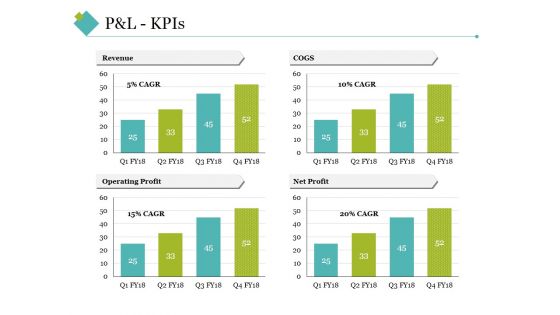
P And L Kpis Template 2 Ppt PowerPoint Presentation Inspiration Grid
This is a p and l kpis template 2 ppt powerpoint presentation inspiration grid. This is a four stage process. The stages in this process are revenue, cogs, operating profit, net profit.
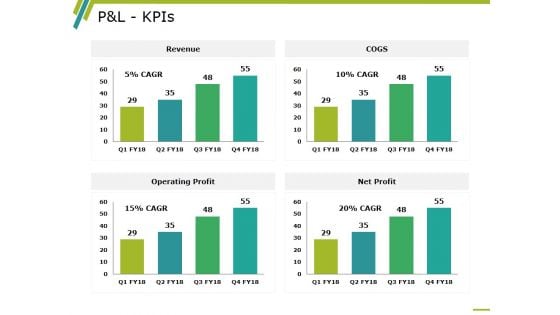
P And L Kpis Template 2 Ppt PowerPoint Presentation Professional Information
This is a p and l kpis template 2 ppt powerpoint presentation professional information. This is a four stage process. The stages in this process are revenue, operating profit, cogs, net profit, business.
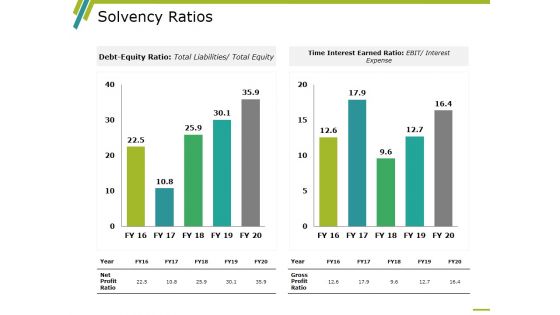
Solvency Ratios Template 1 Ppt PowerPoint Presentation Layouts Graphics Design
This is a solvency ratios template 1 ppt powerpoint presentation layouts graphics design. This is a two stage process. The stages in this process are time interest earned ratio, debt equity ratio, gross profit ratio, net profit ratio, year.
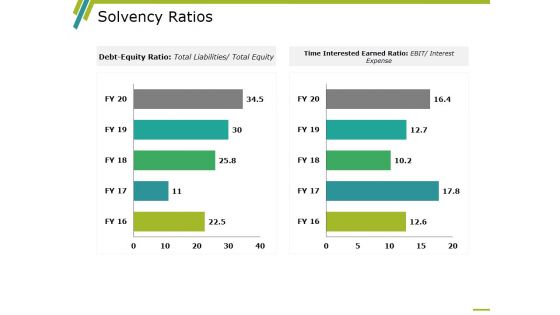
Solvency Ratios Template 2 Ppt PowerPoint Presentation Layouts Layouts
This is a solvency ratios template 2 ppt powerpoint presentation layouts layouts. This is a two stage process. The stages in this process are time interest earned ratio, debt equity ratio, gross profit ratio, net profit ratio, year.
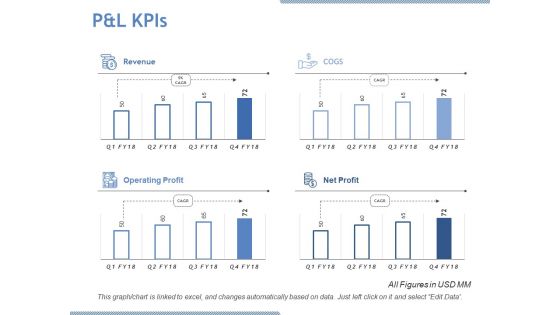
P And L Kpis Ppt PowerPoint Presentation Designs Download
This is a p and l kpis ppt powerpoint presentation designs download. This is a four stage process. The stages in this process are revenue, cogs, operating profit, net profit.
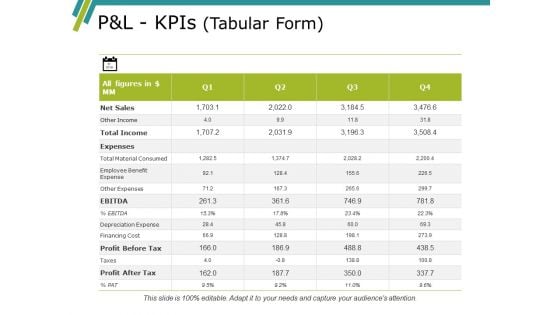
Pandl Kpis Template Ppt PowerPoint Presentation Gallery Summary
This is a pandl kpis template ppt powerpoint presentation gallery summary. This is a four stage process. The stages in this process are revenue, cogs, operating profit, net profit.
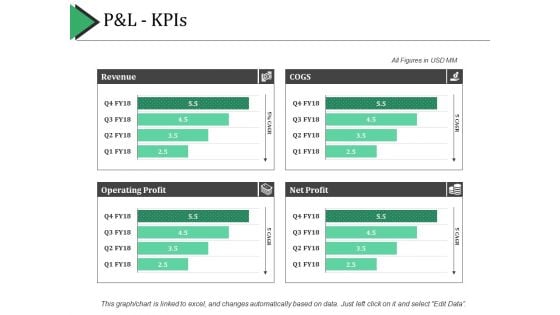
P And L Kpis Ppt PowerPoint Presentation Show Example Introduction
This is a p and l kpis ppt powerpoint presentation show example introduction. This is a four stage process. The stages in this process are revenue, cogs, net profit, operating profit.
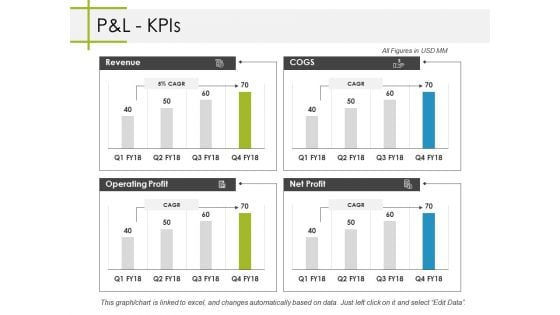
Pandl Kpis Ppt PowerPoint Presentation Professional Backgrounds
This is a pandl kpis ppt powerpoint presentation professional backgrounds. This is a four stage process. The stages in this process are business, revenue, operating profit, cogs, net profit.
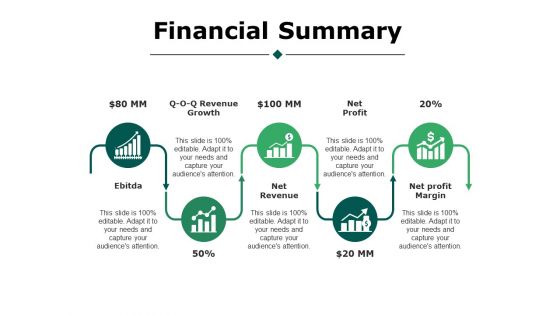
Financial Summary Ppt PowerPoint Presentation Styles Portfolio
This is a financial summary ppt powerpoint presentation styles portfolio. This is a five stage process. The stages in this process are business, ebitda, revenue growth, net revenue, net profit, net profit margin.
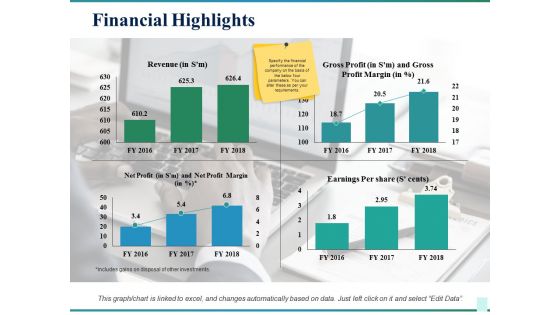
Financial Highlights Ppt PowerPoint Presentation Infographic Template Slide Download
This is a financial highlights ppt powerpoint presentation infographic template slide download. This is a four stage process. The stages in this process are business, revenue, gross profit, earnings per share, net profit, marketing.
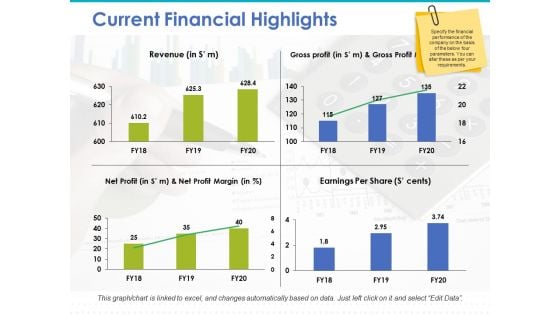
Current Financial Highlights Ppt PowerPoint Presentation Professional Slide Download
This is a current financial highlights ppt powerpoint presentation professional slide download. This is a four stage process. The stages in this process are revenue, gross profit, net profit, earnings per share.
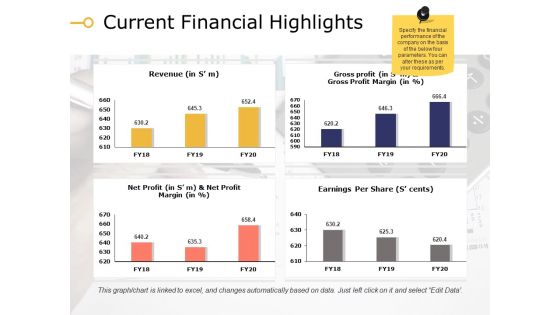
Current Financial Highlights Ppt PowerPoint Presentation File Demonstration
This is a current financial highlights ppt powerpoint presentation show example. This is a four stage process. The stages in this process are revenue, net profit, earnings per share, gross profit.
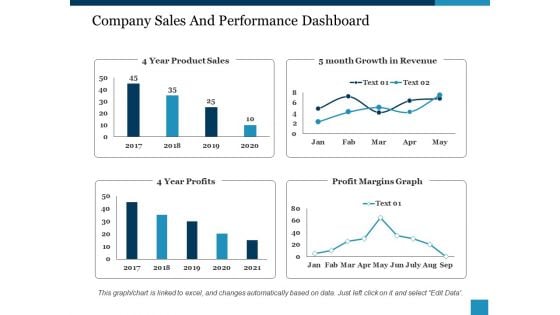
Company Sales And Performance Dashboard Ppt PowerPoint Presentation Show Structure
This is a company sales and performance dashboard ppt powerpoint presentation show structure. This is a four stage process. The stages in this process are year product sales, month growth in revenue, profit margins graph, year profits.

Effective Staff Performance Optimization Techniques Workforce Appraisal Status Monitoring Themes PDF
The following slide depicts the overview of employee appraisal tracking summary to align goals and system. It includes key elements such as stages, employee ID, name, feedback status pending, done, due etc. From laying roadmaps to briefing everything in detail, our templates are perfect for you. You can set the stage with your presentation slides. All you have to do is download these easy to edit and customizable templates. Effective Staff Performance Optimization Techniques Workforce Appraisal Status Monitoring Themes PDF will help you deliver an outstanding performance that everyone would remember and praise you for. Do download this presentation today.

Statistics On Business And Customer Expectations From Robotic Process Automation Chatbot Themes PDF
This slide presents statistics on business and customer expectations from RPA chatbot, helpful in determining how their goals coincide and relate to each other. It includes customer expectations such as fast replies and business expectations such as generating leads. Pitch your topic with ease and precision using this Statistics On Business And Customer Expectations From Robotic Process Automation Chatbot Themes PDF. This layout presents information on Online Shopping Trends, E-Commerce, Competitive Advantage, Business Expectations. It is also available for immediate download and adjustment. So, changes can be made in the color, design, graphics or any other component to create a unique layout.
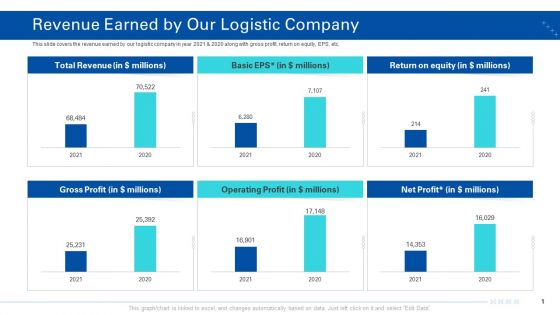
Transporting Company Revenue Earned By Our Logistic Company Ppt Model Deck PDF
This slide covers the revenue earned by our logistic company in year 2021 and 2020 along with gross profit, return on equity, EPS, etc.Deliver and pitch your topic in the best possible manner with this transporting company revenue earned by our logistic company ppt model deck pdf. Use them to share invaluable insights on gross profit, total revenue, operating profit and impress your audience. This template can be altered and modified as per your expectations. So, grab it now.
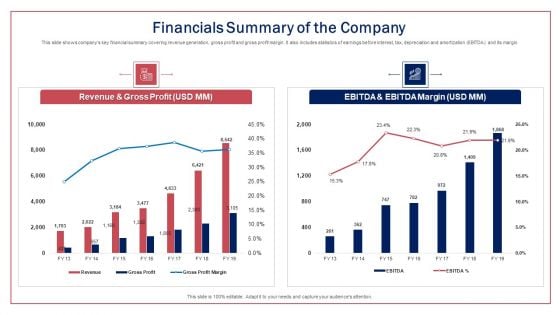
Financials Summary Of The Company Ppt Model Portfolio PDF
This slide shows companys key financial summary covering revenue generation, gross profit and gross profit margin. It also includes statistics of earnings before interest, tax, depreciation and amortization EBITDA and its margin.Deliver an awe-inspiring pitch with this creative financials summary of the company ppt model portfolio pdf. bundle. Topics like revenue and gross profit, ebbtide and ebbtide margin can be discussed with this completely editable template. It is available for immediate download depending on the needs and requirements of the user.
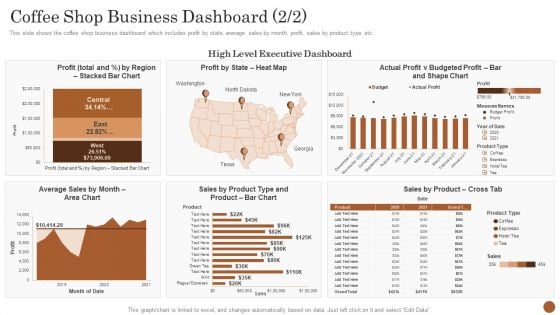
Business Model Opening Restaurant Coffee Shop Business Dashboard Inspiration PDF
This slide shows the coffee shop business dashboard which includes profit by state, average sales by month, profit, sales by product type, etc. Deliver and pitch your topic in the best possible manner with this business model opening restaurant coffee shop business dashboard inspiration pdf. Use them to share invaluable insights on profit v budgeted, average sales, sales by product and impress your audience. This template can be altered and modified as per your expectations. So, grab it now.
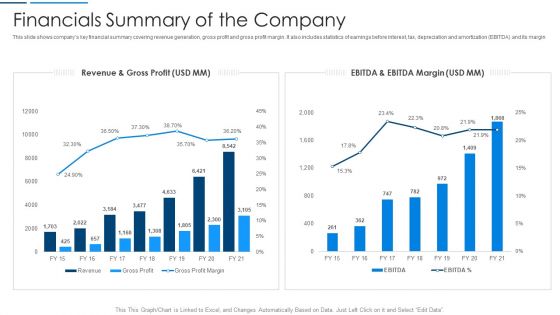
Information Technology Transformation Organization Financials Summary Of The Company Structure PDF
This slide shows companys key financial summary covering revenue generation, gross profit and gross profit margin. It also includes statistics of earnings before interest, tax, depreciation and amortization EBITDA and its margin Deliver an awe inspiring pitch with this creative information technology transformation organization financials summary of the company structure pdf bundle. Topics like gross profit, revenue, ebitda margin can be discussed with this completely editable template. It is available for immediate download depending on the needs and requirements of the user.
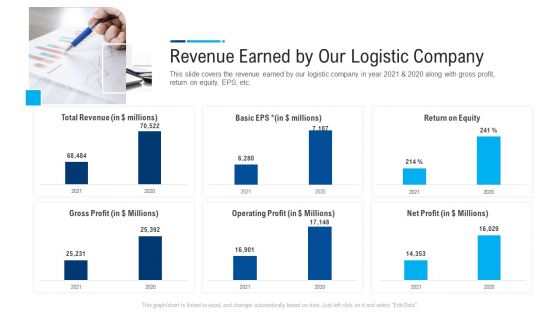
Internal And External Logistics Management Procedure Revenue Earned By Our Logistic Company Infographics PDF
This slide covers the revenue earned by our logistic company in year 2021 and 2020 along with gross profit, return on equity, EPS, etc. Deliver an awe inspiring pitch with this creative internal and external logistics management procedure revenue earned by our logistic company infographics pdf bundle. Topics like total revenue, gross profit, operating profit, return on equity can be discussed with this completely editable template. It is available for immediate download depending on the needs and requirements of the user.
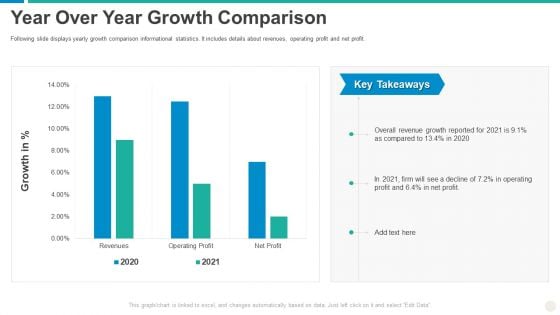
Establishing Successful Brand Strategy To Captivate Consumers Year Over Year Growth Comparison Professional PDF
Following slide displays yearly growth comparison informational statistics. It includes details about revenues, operating profit and net profit. Deliver an awe inspiring pitch with this creative establishing successful brand strategy to captivate consumers year over year growth comparison professional pdf bundle. Topics like operating profit, revenue, growth can be discussed with this completely editable template. It is available for immediate download depending on the needs and requirements of the user.
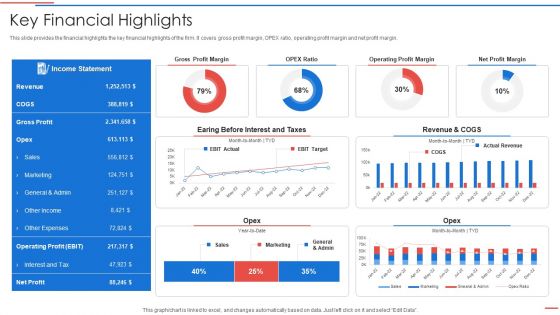
Due Diligence Process In Merger And Acquisition Agreement Key Financial Highlights Inspiration PDF
This slide provides the financial highlights the key financial highlights of the firm. It covers gross profit margin, OPEX ratio, operating profit margin and net profit margin. Deliver and pitch your topic in the best possible manner with this due diligence process in merger and acquisition agreement key financial highlights inspiration pdf Use them to share invaluable insights on key financial highlights and impress your audience. This template can be altered and modified as per your expectations. So, grab it now.
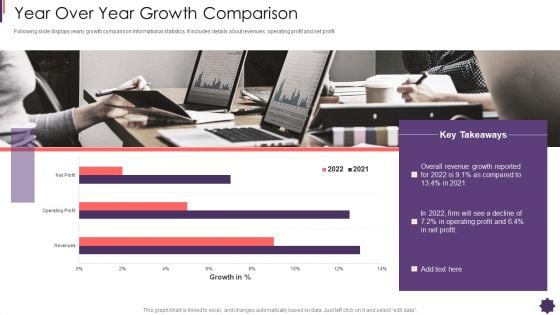
Year Over Year Growth Comparison Brand Techniques Structure Designs PDF
Following slide displays yearly growth comparison informational statistics. It includes details about revenues, operating profit and net profit. Deliver an awe inspiring pitch with this creative year over year growth comparison brand techniques structure designs pdf bundle. Topics like revenue, growth, profit can be discussed with this completely editable template. It is available for immediate download depending on the needs and requirements of the user.
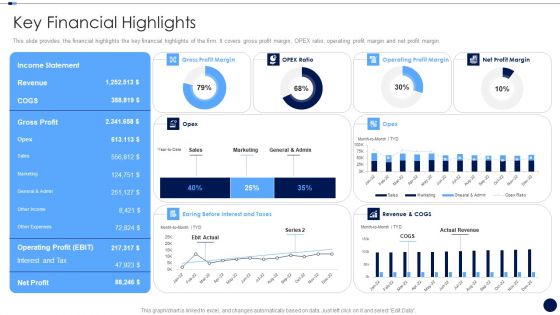
Merger And Acquisition Due Diligence Checklist Key Financial Highlights Brochure PDF
This slide provides the financial highlights the key financial highlights of the firm. It covers gross profit margin, OPEX ratio, operating profit margin and net profit margin. Deliver and pitch your topic in the best possible manner with this merger and acquisition due diligence checklist key financial highlights brochure pdf Use them to share invaluable insights on key products and services and impress your audience. This template can be altered and modified as per your expectations. So, grab it now.
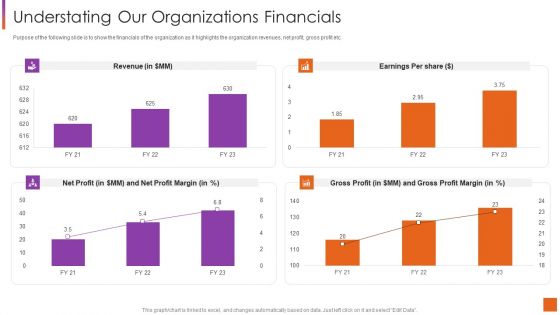
Investor Pitch Deck For Software Development Understating Our Organizations Financials Introduction PDF
Purpose of the following slide is to show the financials of the organization as it highlights the organization revenues, net profit, gross profit etc. Deliver and pitch your topic in the best possible manner with this Investor Pitch Deck For Software Development Understating Our Organizations Financials Introduction PDF. Use them to share invaluable insights on Revenue, Profit Margin, Earnings Share and impress your audience. This template can be altered and modified as per your expectations. So, grab it now.
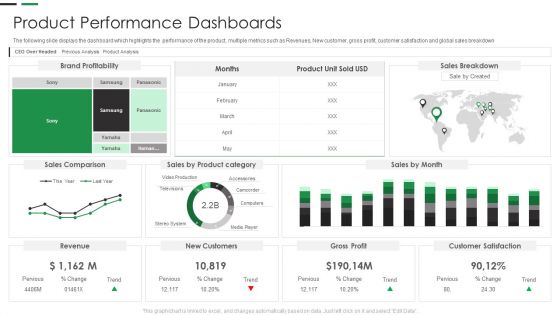
Evaluating New Commodity Impact On Market Product Performance Dashboards Template PDF
The following slide displays the dashboard which highlights the performance of the product, multiple metrics such as Revenues, New customer, gross profit, customer satisfaction and global sales breakdown Deliver and pitch your topic in the best possible manner with this Evaluating New Commodity Impact On Market Product Performance Dashboards Template PDF Use them to share invaluable insights on Brand Profitability, Customer Satisfaction, Gross Profit and impress your audience. This template can be altered and modified as per your expectations. So, grab it now.
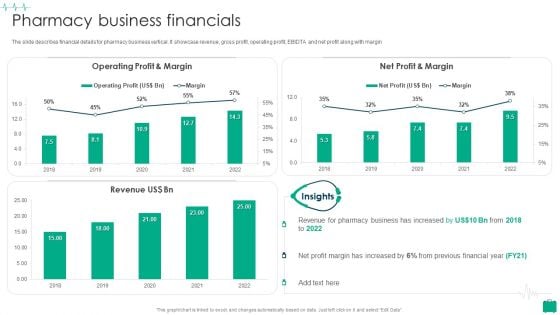
Healthcare Services Company Profile Pharmacy Business Financials Portrait PDF
The slide describes financial details for pharmacy business vertical. It showcase revenue, gross profit, operating profit, EBIDTA and net profit along with margin.Deliver and pitch your topic in the best possible manner with this Healthcare Services Company Profile Pharmacy Business Financials Portrait PDF Use them to share invaluable insights on Revenue Pharmacy, Margin Has Increased, Previous Financial and impress your audience. This template can be altered and modified as per your expectations. So, grab it now.
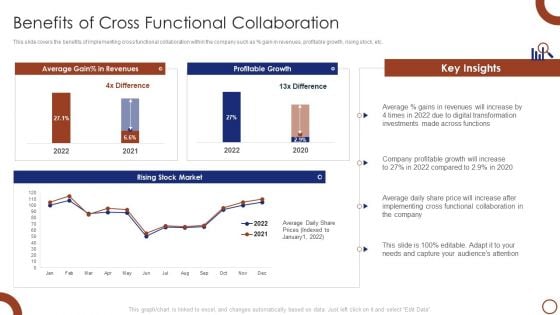
Teams Collaboration Benefits Of Cross Functional Collaboration Microsoft PDF
This slide covers the benefits of implementing cross functional collaboration within the company such as persent gain in revenues, profitable growth, rising stock, etc.Deliver an awe inspiring pitch with this creative Teams Collaboration Benefits Of Cross Functional Collaboration Microsoft PDF bundle. Topics like Profitable Growth, Digital Transformation, Company Profitable can be discussed with this completely editable template. It is available for immediate download depending on the needs and requirements of the user.
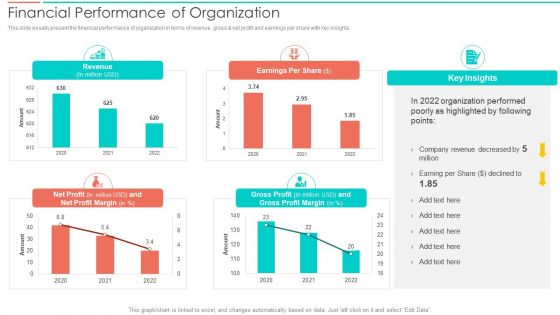
SAC Planning And Implementation Financial Performance Of Organization Background PDF
This slide visually present the financial performance of organization in terms of revenue, gross and net profit and earnings per share with key insights. Deliver an awe inspiring pitch with this creative SAC Planning And Implementation Financial Performance Of Organization Background PDF bundle. Topics like Revenue, Earnings Per Share, Net Profit, Gross Profit can be discussed with this completely editable template. It is available for immediate download depending on the needs and requirements of the user.
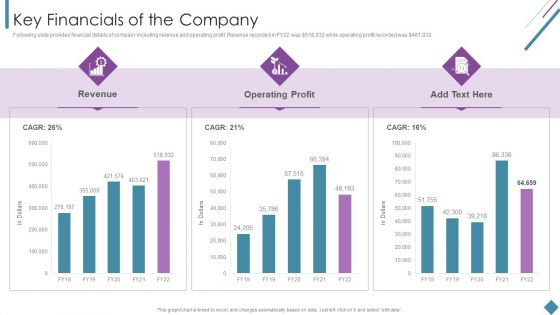
Metrics To Measure Business Performance Key Financials Of The Company Elements PDF
Following slide provides financial details of company including revenue and operating profit. Revenue recorded in FY22 was dollar 518,932 while operating profit recorded was dollar 481,932. Deliver an awe inspiring pitch with this creative Metrics To Measure Business Performance Key Financials Of The Company Elements PDF bundle. Topics like Revenue, Operating Profit can be discussed with this completely editable template. It is available for immediate download depending on the needs and requirements of the user.
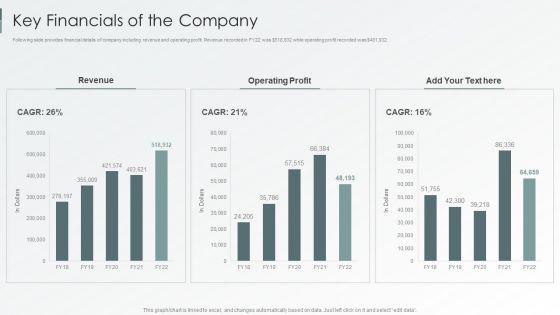
Enterprise Sustainability Performance Metrics Key Financials Of The Company Rules PDF
Following slide provides financial details of company including revenue and operating profit. Revenue recorded in FY22 was dollar518,932 while operating profit recorded was dollar481,932.Deliver an awe inspiring pitch with this creative Enterprise Sustainability Performance Metrics Key Financials Of The Company Rules PDF bundle. Topics like Operating, Profit, Revenue can be discussed with this completely editable template. It is available for immediate download depending on the needs and requirements of the user.
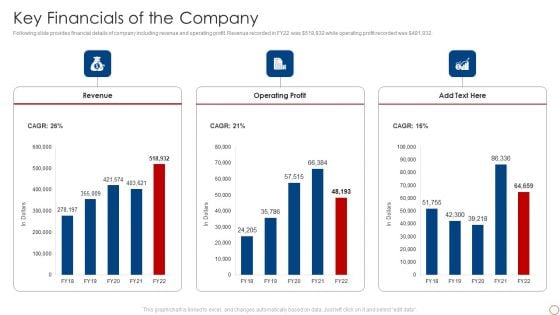
Kpis For Evaluating Business Sustainability Key Financials Of The Company Rules PDF
Following slide provides financial details of company including revenue and operating profit. Revenue recorded in FY22 was dollar 518,932 while operating profit recorded was dollar 481,932. Deliver and pitch your topic in the best possible manner with this Kpis For Evaluating Business Sustainability Financial Performance Indicator Dashboard Demonstration PDF. Use them to share invaluable insights on Revenue, Operating Profit and impress your audience. This template can be altered and modified as per your expectations. So, grab it now.
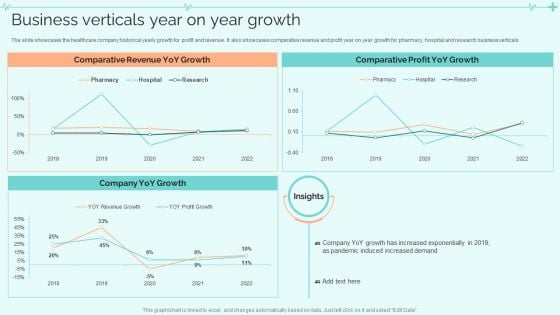
Clinical Services Company Profile Business Verticals Year On Year Growth Graphics PDF
The slide showcases the healthcare company historical yearly growth for profit and revenue. It also showcases comparative revenue and profit year on year growth for pharmacy, hospital and research business verticals. Deliver an awe inspiring pitch with this creative Clinical Services Company Profile Business Verticals Year On Year Growth Graphics PDF bundle. Topics like Comparative Revenue, Comparative Profit, Increased Demand can be discussed with this completely editable template. It is available for immediate download depending on the needs and requirements of the user.
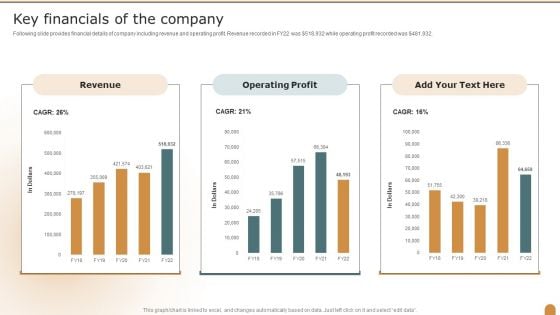
Key Financials Of The Company Company Performance Evaluation Using KPI Rules PDF
Following slide provides financial details of company including revenue and operating profit. Revenue recorded in FY22 was doller 518,932 while operating profit recorded was doller 481,932. Deliver an awe inspiring pitch with this creative Key Financials Of The Company Company Performance Evaluation Using KPI Rules PDF bundle. Topics like Revenue, Operating Profit, Company can be discussed with this completely editable template. It is available for immediate download depending on the needs and requirements of the user.
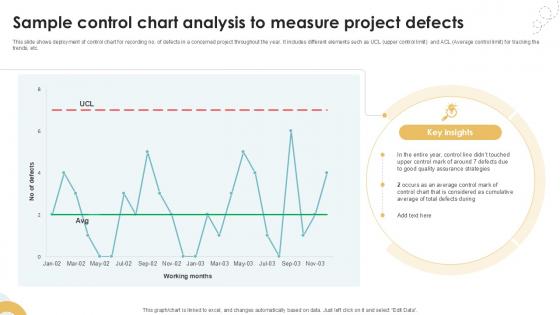
Sample Control Chart Analysis To Measure Project Executing Quality Ppt Sample PM SS V
This slide shows deployment of control chart for recording no. of defects in a concerned project throughout the year. It includes different elements such as UCL upper control limit and ACL Average control limit for tracking the trends, etc. Do you have an important presentation coming up Are you looking for something that will make your presentation stand out from the rest Look no further than Sample Control Chart Analysis To Measure Project Executing Quality Ppt Sample PM SS V. With our professional designs, you can trust that your presentation will pop and make delivering it a smooth process. And with Slidegeeks, you can trust that your presentation will be unique and memorable. So why wait Grab Sample Control Chart Analysis To Measure Project Executing Quality Ppt Sample PM SS V today and make your presentation stand out from the rest This slide shows deployment of control chart for recording no. of defects in a concerned project throughout the year. It includes different elements such as UCL upper control limit and ACL Average control limit for tracking the trends, etc.

3d Man With Red Puzzles PowerPoint Templates And PowerPoint Themes 1012
3D Man With Red Puzzles PowerPoint Templates And PowerPoint Themes 1012-Create visually stunning Microsoft office PPT Presentations with our above template consists of 3d small person holding over red jigsaw puzzle piece. This image represents the concept of found a solution and way out. The ideas and plans are on your finger tips. Now imprint them on the minds of your audience via our slides. This template imitates business strategy, opportunities, leadership and teamwork etc.-3D Man With Red Puzzles PowerPoint Templates And PowerPoint Themes 1012-This PowerPoint template can be used for presentations relating to-Man with red puzzle piece, success, business, metaphor, people, finance Our 3d Man With Red Puzzles PowerPoint Templates And PowerPoint Themes 1012 are faithful servants. They will put in all possible effort for you.
Question Mark In The Box Business PowerPoint Templates And PowerPoint Themes 1112
Question Mark In The Box Business PowerPoint Templates And PowerPoint Themes 1112-Use our Boxes PowerPoint Templates because; Ring them out loud with your brilliant ideas. Use our Cubes PowerPoint Templates because, you understand how each drives the next to motor the entire sequence. Use our Business PowerPoint Templates because, Pinpoint the critical paths and areas in your process and set the timelines for their completion. Use our Signs PowerPoint Templates because; Show them how to churn out fresh ideas. Use our Communication PowerPoint Templates because, Feel the buzz as they comprehend your plan to get the entire act together-Question Mark In The Box Business PowerPoint Templates And PowerPoint Themes 1112-This PowerPoint template can be used for presentations relating to-Question mark springing out of a box, Symbol, Boxes, Signs, Metaphor, Abstract Our Question Mark In The Box Business PowerPoint Templates And PowerPoint Themes 1112 are faithful servants. They will put in all possible effort for you.
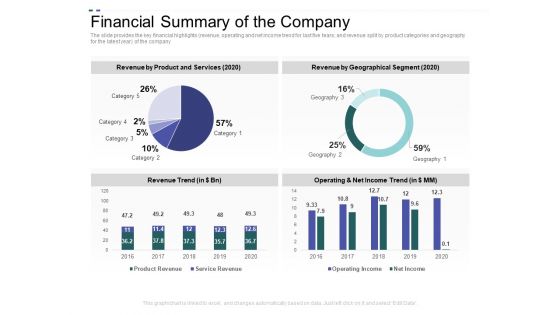
Crowd Sourced Equity Funding Pitch Deck Financial Summary Of The Company Ppt File Demonstration PDF
The slide provides the key financial highlights revenue, operating and net income trend for last five tears and revenue split by product categories and geography for the latest year of the company. Deliver and pitch your topic in the best possible manner with this crowd sourced equity funding pitch deck financial summary of the company ppt file demonstration pdf. Use them to share invaluable insights on revenue trend, operating and net income trend, revenue by geographical segment, revenue by product and services and impress your audience. This template can be altered and modified as per your expectations. So, grab it now.
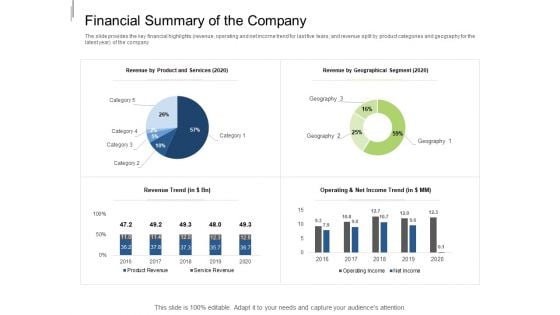
Equity Crowdfunding Pitch Deck Financial Summary Of The Company Ppt Layouts Examples PDF
The slide provides the key financial highlights revenue, operating and net income trend for last five tears and revenue split by product categories and geography for the latest year of the company. Deliver and pitch your topic in the best possible manner with this equity crowdfunding pitch deck financial summary of the company ppt layouts examples pdf. Use them to share invaluable insights on revenue trend, operating and net income trend, revenue by geographical segment, revenue by product and services and impress your audience. This template can be altered and modified as per your expectations. So, grab it now.
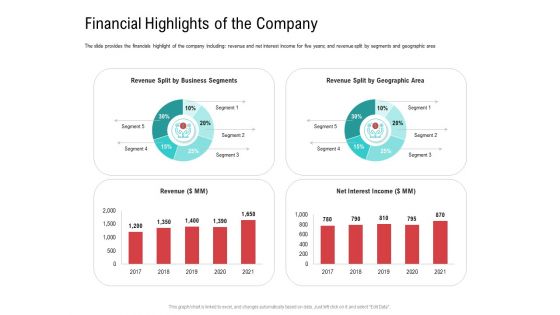
Investor Pitch Deck Collect Funding Spot Market Financial Highlights Of The Company Demonstration PDF
The slide provides the financials highlight of the company including revenue and net interest income for five years and revenue split by segments and geographic area. Deliver and pitch your topic in the best possible manner with this investor pitch deck collect funding spot market financial highlights of the company demonstration pdf. Use them to share invaluable insights on revenue, net interest income business segments, revenue split by geographic area and impress your audience. This template can be altered and modified as per your expectations. So, grab it now.
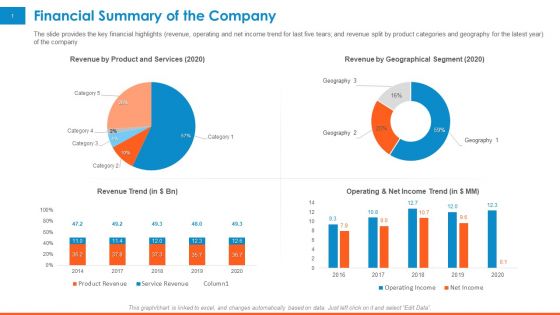
Raising Company Capital From Public Funding Sources Financial Summary Of The Company Graphics PDF
The slide provides the key financial highlights revenue, operating and net income trend for last five tears and revenue split by product categories and geography for the latest year of the company. Deliver an awe-inspiring pitch with this creative raising company capital from public funding sources financial summary of the company graphics pdf bundle. Topics like revenue product and services 2020, revenue geographical segment 2020, revenue trend, operating and net income trend can be discussed with this completely editable template. It is available for immediate download depending on the needs and requirements of the user.
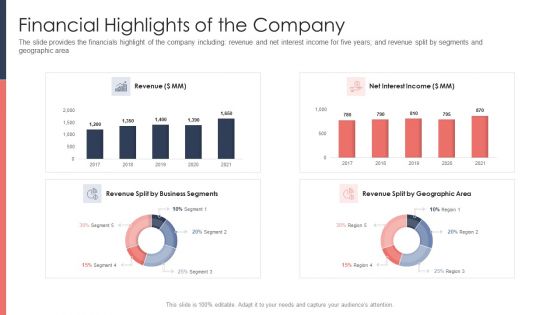
Pitch Deck For Fundraising From Post Market Financing Financial Highlights Of The Company Microsoft PDF
The slide provides the financials highlight of the company including revenue and net interest income for five years and revenue split by segments and geographic area Deliver and pitch your topic in the best possible manner with this pitch deck for fundraising from post market financing financial highlights of the company microsoft pdf. Use them to share invaluable insights on revenue split by business segments, revenue split by geographic area, net interest income and impress your audience. This template can be altered and modified as per your expectations. So, grab it now.
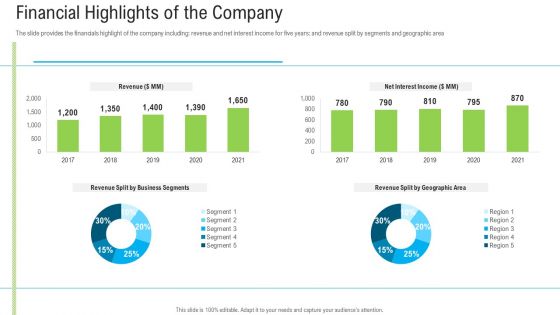
Pitch Deck To Raise Funding From Secondary Market Financial Highlights Of The Company Sample PDF
The slide provides the financials highlight of the company including revenue and net interest income for five years and revenue split by segments and geographic area. Deliver and pitch your topic in the best possible manner with this pitch deck to raise funding from secondary market financial highlights of the company sample pdf. Use them to share invaluable insights on revenue, net interest income, financial highlights of the company and impress your audience. This template can be altered and modified as per your expectations. So, grab it now.
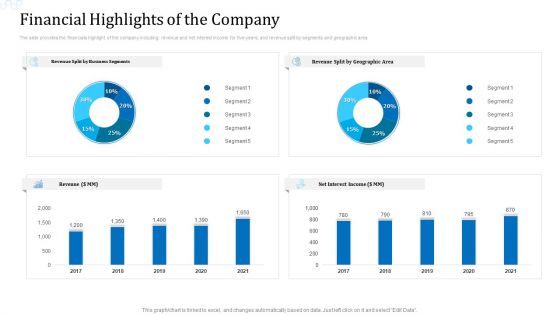
Investor Deck For Procuring Funds From Money Market Financial Highlights Of The Company Template PDF
The slide provides the financials highlight of the company including revenue and net interest income for five years and revenue split by segments and geographic area. Deliver an awe inspiring pitch with this creative investor deck for procuring funds from money market financial highlights of the company template pdf bundle. Topics like revenue split by business segments, revenue split by geographic area, net interest income, revenue can be discussed with this completely editable template. It is available for immediate download depending on the needs and requirements of the user.
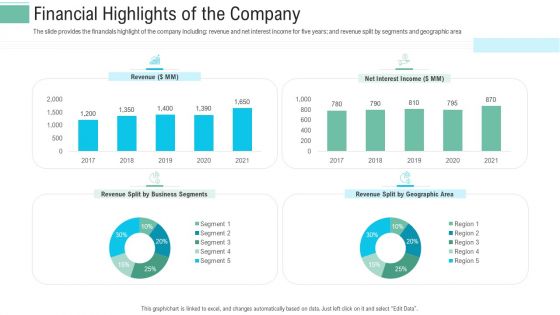
Pitch Presentation Raise Money Spot Market Financial Highlights Of The Company Formats PDF
The slide provides the financials highlight of the company including revenue and net interest income for five years and revenue split by segments and geographic area. Deliver an awe-inspiring pitch with this creative pitch presentation raise money spot market financial highlights of the company formats pdf bundle. Topics like net interest income, revenue split by business segments, revenue split by geographic area can be discussed with this completely editable template. It is available for immediate download depending on the needs and requirements of the user.
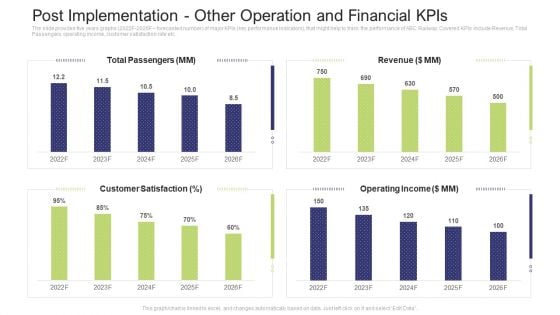
Post Implementation Other Operation And Financial Kpis Summary PDF
The slide provides five years graphs 2022F to 2026F forecasted number of major KPIs key performance indicators, that might help to track the performance of ABC Railway. Covered KPIs include Revenue, Total Passengers, operating income, customer satisfaction rate etc.Deliver and pitch your topic in the best possible manner with this post implementation other operation and financial KPIs summary pdf. Use them to share invaluable insights on total passengers, operating income, revenue, 2022 to 2026 and impress your audience. This template can be altered and modified as per your expectations. So, grab it now.


 Continue with Email

 Home
Home


