Value Icon

Gold Charts With Copy Space Marketing PowerPoint Templates And PowerPoint Backgrounds 0311
Microsoft PowerPoint Template and Background with gold charts Our Gold Charts With Copy Space Marketing PowerPoint Templates And PowerPoint Backgrounds 0311 will be your best buy. The value of your thoughts will definitely appreciate.
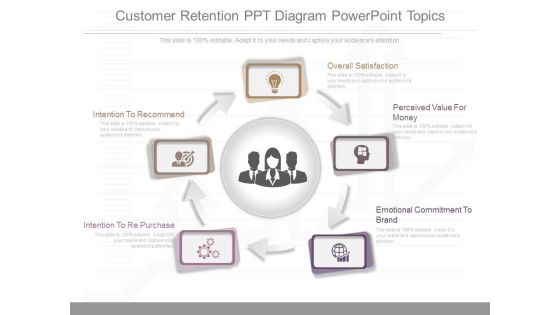
Customer Retention Ppt Diagram Powerpoint Topics
This is a customer retention ppt diagram powerpoint topics. This is a five stage process. The stages in this process are intention to recommend, intention to re purchase, overall satisfaction, perceived value for money, emotional commitment to brand.
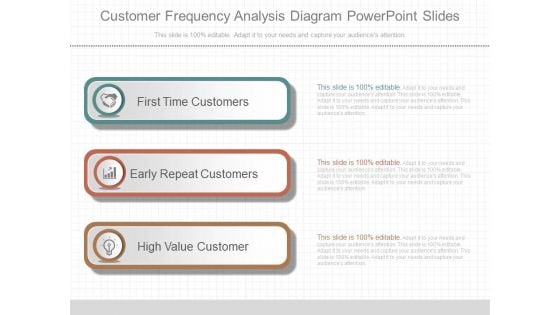
Customer Frequency Analysis Diagram Powerpoint Slides
This is a customer frequency analysis diagram powerpoint slides. This is a three stage process. The stages in this process are first time customers, early repeat customers, high value customer.
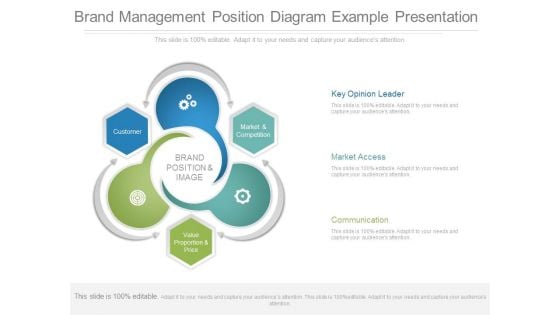
Brand Management Position Diagram Example Presentation
This is a brand management position diagram example presentation. This is a three stage process. The stages in this process are brand position and image, customer, value proportion and price, market and competition, key opinion leader, market access, communication.
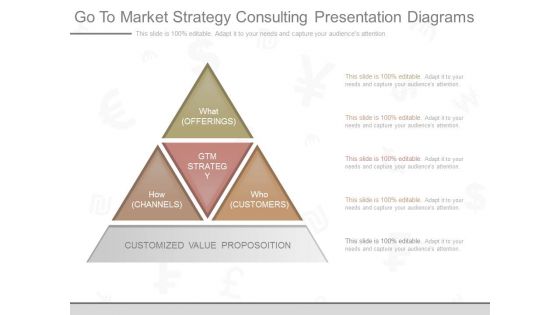
Go To Market Strategy Consulting Presentation Diagrams
This is a go to market strategy consulting presentation diagrams. This is a four stage process. The stages in this process are what offerings, gtm strategy, how channels, gtm strategy, who customers, customized value proposoition.\n\n\n\n\n\n\n\n\n\n\n\n

Business Management Models Diagram Powerpoint Slide Backgrounds
This is a business management models diagram powerpoint slide backgrounds. This is a seven stage process. The stages in this process are freemium, direct sales, subscription, value added reseller, franchise, sourcing, bricks and clicks, business models.\n\n\n\n\n\n
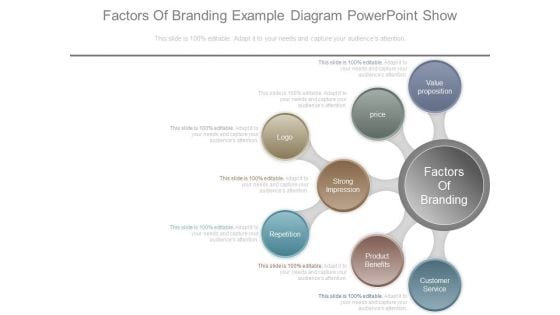
Factors Of Branding Example Diagram Powerpoint Show
This is factors of branding example diagram powerpoint show. This is a seven stage process. The stages in this process are value proposition, factors of branding, strong impression, repetition, product benefits, customer service, price, logo.
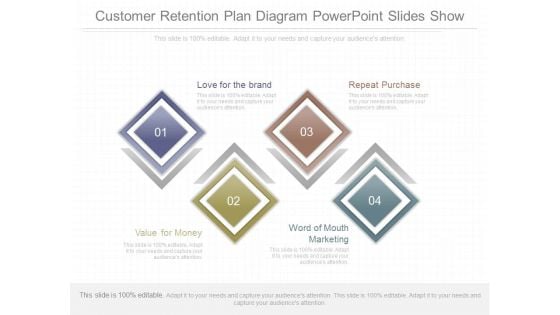
Customer Retention Plan Diagram Powerpoint Slides Show
This is a customer retention plan diagram powerpoint slides show. This is a four stage process. The stages in this process are love for the brand, repeat purchase, word of mouth marketing, value for money.
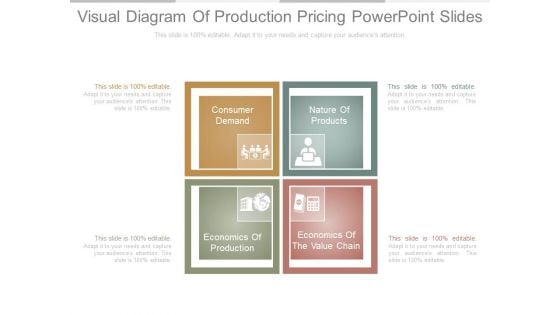
Visual Diagram Of Production Pricing Powerpoint Slides
This is a visual diagram of production pricing powerpoint slides. This is a four stage process. The stages in this process are consumer demand, nature of products, economics of the value chain, economics of production.
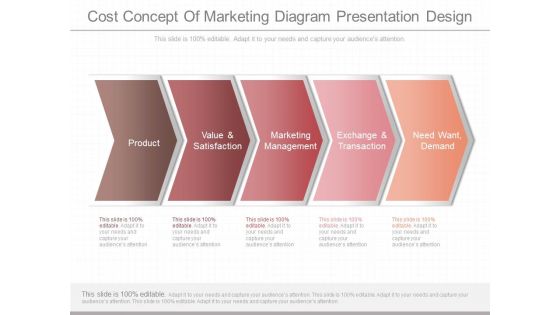
Cost Concept Of Marketing Diagram Presentation Design
This is a cost concept of marketing diagram presentation design. This is a five stage process. The stages in this process are product, value and satisfaction, marketing management, exchange and transaction, need want, demand.
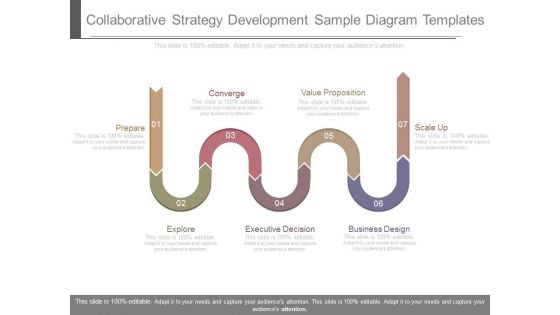
Collaborative Strategy Development Sample Diagram Templates
This is a collaborative strategy development sample diagram templates. This is a seven stage process. The stages in this process are prepare, explore, converge, executive decision, value proposition, business design, scale up.
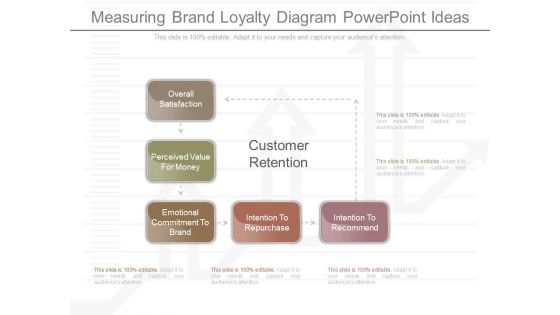
Measuring Brand Loyalty Diagram Powerpoint Ideas
This is a measuring brand loyalty diagram powerpoint ideas. This is a five stage process. The stages in this process are customer retention, overall satisfaction, perceived value for money, emotional commitment to brand, intention to repurchase, intention to recommend.
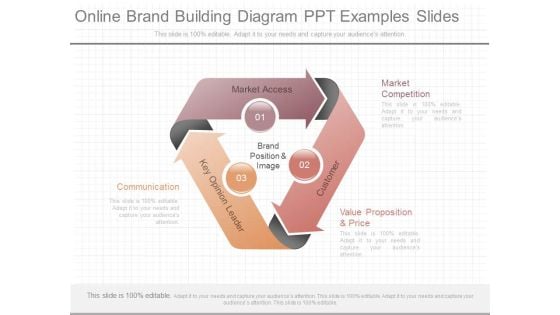
Online Brand Building Diagram Ppt Examples Slides
This is a online brand building diagram ppt examples slides. This is a three stage process. The stages in this process are market competition, value proposition and price, communication, market access, key opinion leader, customer, brand position and image.
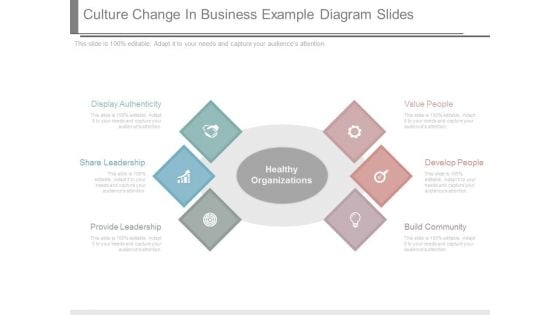
Culture Change In Business Example Diagram Slides
This is a culture change in business example diagram slides. This is a six stage process. The stages in this process are healthy organizations, display authenticity, share leadership, provide leadership, value people, develop people, build community.
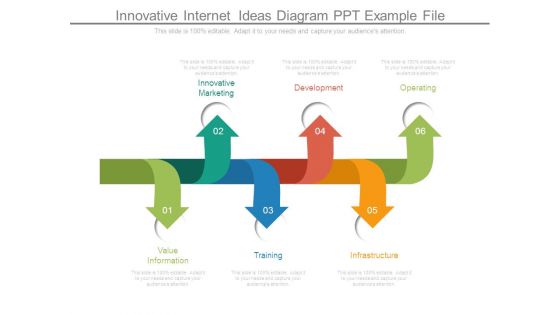
Innovative Internet Ideas Diagram Ppt Example File
This is a innovative internet ideas diagram ppt example file. This is a six stage process. The stages in this process are innovative marketing, development, operating, value information, training, infrastructure.
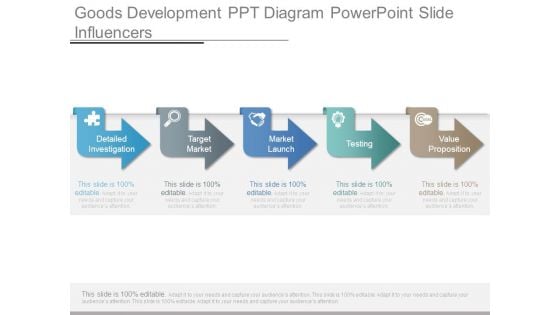
Goods Development Ppt Diagram Powerpoint Slide Influencers
This is a goods development ppt diagram powerpoint slide influencers. This is a five stage process. The stages in this process are detailed investigation, target market, market launch, testing, value proposition.
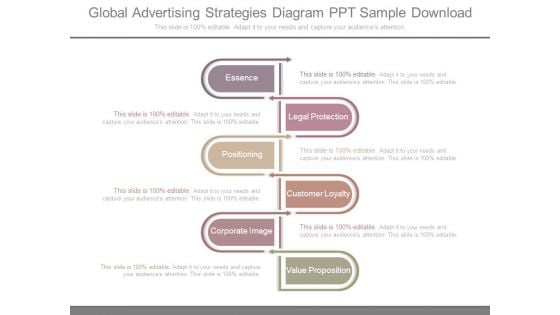
Global Advertising Strategies Diagram Ppt Sample Download
This is a global advertising strategies diagram ppt sample download. This is a six stage process. The stages in this process are essence, legal protection, positioning, customer loyalty, corporate image, value proposition.
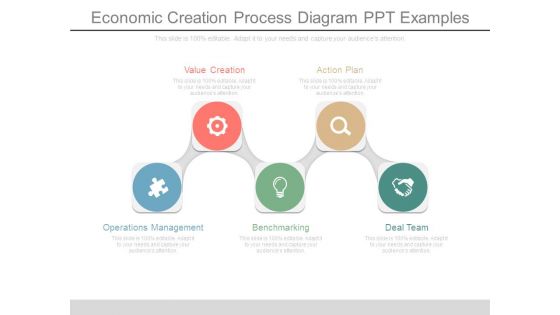
Economic Creation Process Diagram Ppt Examples
This is a e economic creation process diagram ppt examples. This is a five stage process. The stages in this process are value creation, action plan, operations management, benchmarking, deal team.

Cost Evaluation Ppt Diagram Ppt Design
This is a cost evaluation ppt diagram ppt design. This is a five stage process. The stages in this process are system, style, skill, your mission, value to society.
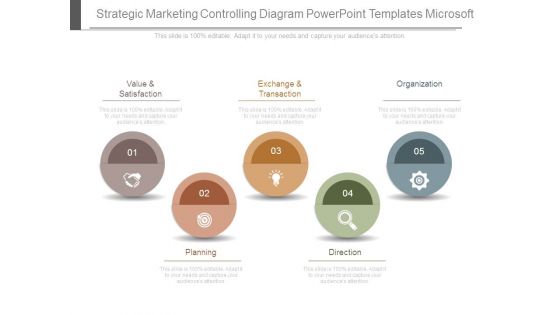
Strategic Marketing Controlling Diagram Powerpoint Templates Microsoft
This is a strategic marketing controlling diagram powerpoint templates microsoft. This is a five stage process. The stages in this process are value and satisfaction, planning, exchange and transaction, direction, organization.
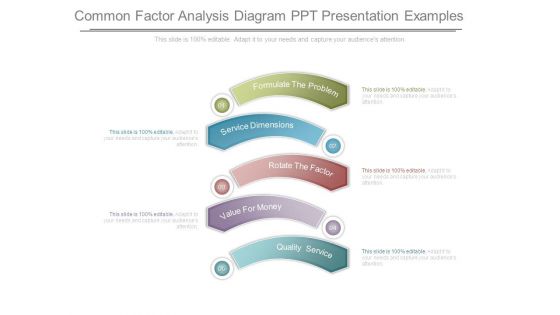
Common Factor Analysis Diagram Ppt Presentation Examples
This is a common factor analysis diagram ppt presentation examples. This is a five stage process. The stages in this process are formulate the problem, service dimensions, rotate the factor, value for money, quality service.

Pricing Methods Diagram Powerpoint Slides Presentation Sample
This is a pricing methods diagram powerpoint slides presentation sample. This is a five stage process. The stages in this process are markup pricing, marketing, value pricing, competition, auction type pricing.
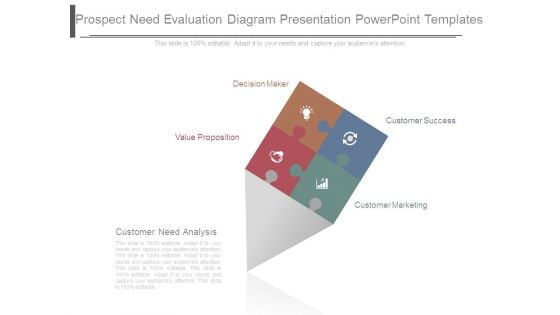
Prospect Need Evaluation Diagram Presentation Powerpoint Templates
This is a prospect need evaluation diagram presentation powerpoint templates. This is a four stage process. The stages in this process are decision maker, value proposition, customer success, customer marketing, customer need analysis.
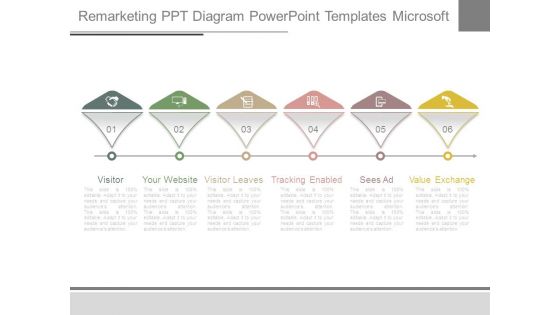
Remarketing Ppt Diagram Powerpoint Templates Microsoft
This is a remarketing ppt diagram powerpoint templates microsoft. This is a six stage process. The stages in this process are visitor, your website, visitor leaves, tracking enabled, sees ad, value exchange.
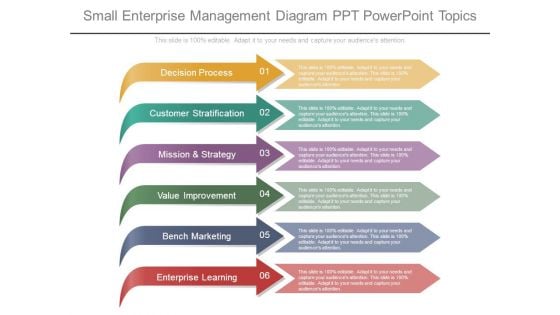
Small Enterprise Management Diagram Ppt Powerpoint Topics
This is a small enterprise management diagram ppt powerpoint topics. This is a six stage process. The stages in this process are decision process, customer stratification, mission and strategy, value improvement, bench marketing, enterprise learning.
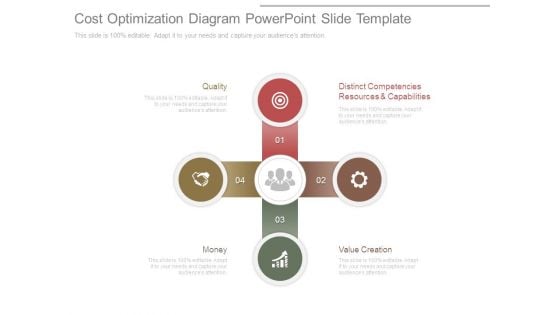
Cost Optimization Diagram Powerpoint Slide Template
This is a cost optimization diagram powerpoint slide template. This is a four stage process. The stages in this process are distinct competencies resources and capabilities, value creation, money, quality.
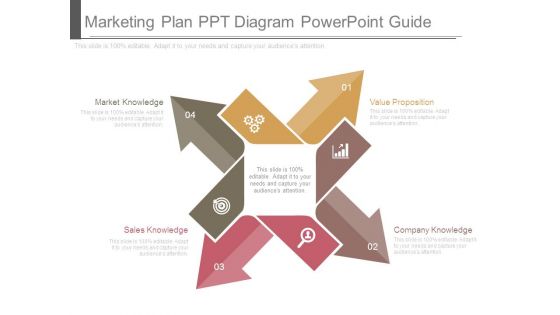
Marketing Plan Ppt Diagram Powerpoint Guide
This is a marketing plan ppt diagram powerpoint guide. This is a four stage process. The stages in this process are market knowledge, sales knowledge, value proposition, company knowledge.
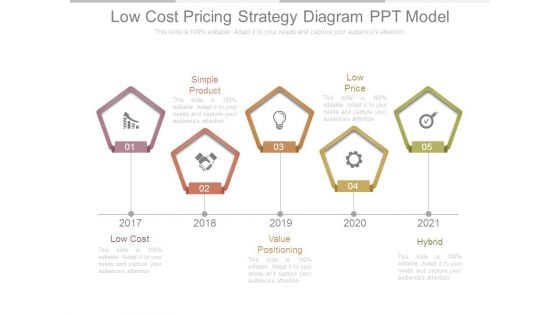
Low Cost Pricing Strategy Diagram Ppt Model
This is a low cost pricing strategy diagram ppt model. This is a five stage process. The stages in this process are simple product, low price, low cost, value positioning, hybrid.
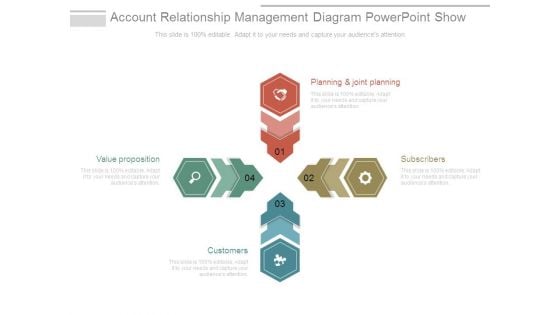
Account Relationship Management Diagram Powerpoint Show
This is a account relationship management diagram powerpoint show. This is a four stage process. The stages in this process are planning and joint planning, subscribers, customers, value proposition.
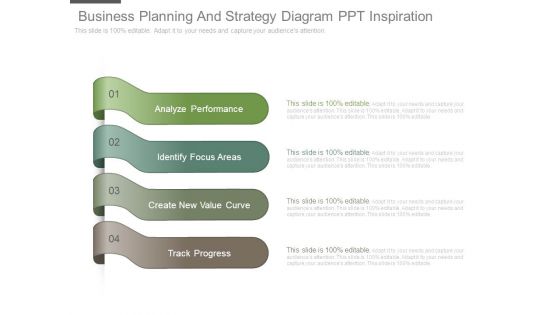
Business Planning And Strategy Diagram Ppt Inspiration
This is a business planning and strategy diagram ppt inspiration. This is a four stage process. The stages in this process are analyze performance, identify focus areas, create new value curve, track progress.
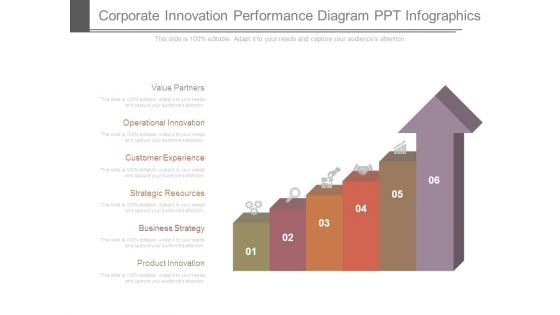
Corporate Innovation Performance Diagram Ppt Infographics
This is a corporate innovation performance diagram ppt infographics. This is a six stage process. The stages in this process are value partners, operational innovation, customer experience, strategic resources, business strategy, product innovation.
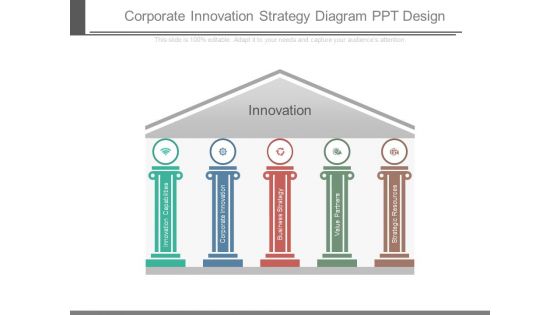
Corporate Innovation Strategy Diagram Ppt Design
This is a corporate innovation strategy diagram ppt design. This is a five stage process. The stages in this process are innovation, innovation capabilities, corporate innovation, business strategy, value partners, strategic resources.
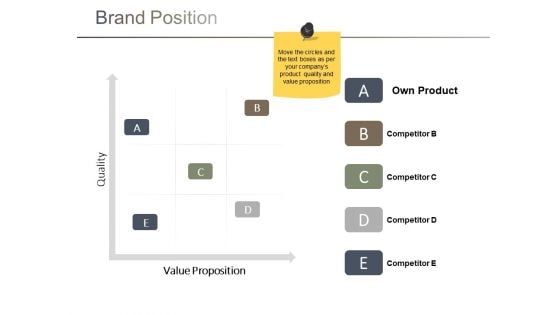
Brand Position Ppt PowerPoint Presentation Diagram Ppt
This is a brand position ppt powerpoint presentation diagram ppt. This is a five stage process. The stages in this process are quality, value proposition, own product, business, marketing.
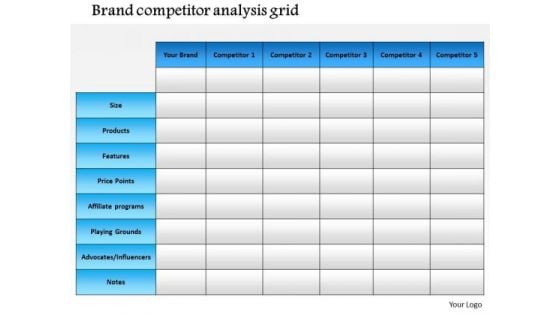
Business Framework Brand Competitor Analysis Grid PowerPoint Presentation
This power point diagram slide has been crafted with graphic of grid. This grid is designed for brand competition analysis. Use this slide for your brand value representation in any business presentations.
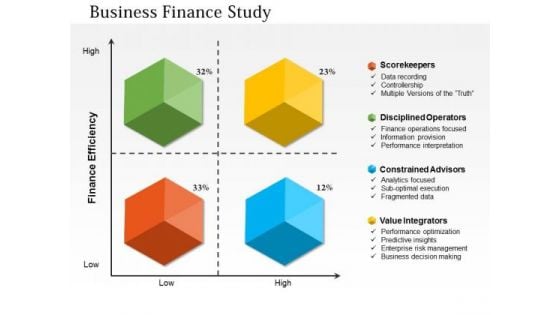
Business Diagram Business Finance Study PowerPoint Ppt Presentation
Our above slide displays business finance study diagram. It contains x-y graph of finance efficiency further divided into four sections. This diagram reflects finance efficiency depends on storekeepers, disciplined operators, constrained advisors and value integrators.
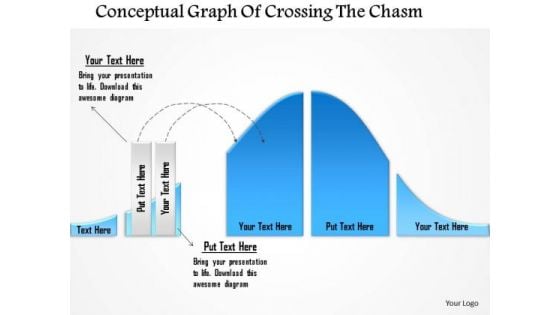
Business Diagram Conceptual Graph Of Crossing The Chasm Presentation Template
This business diagram has been designed with graphic of 3d graph. This slide contains the concept of chasm and data calculation. Use this slide to display chasm crossing condition. This business diagram adds value to your ideas.

Transportation Red Beetle Car PowerPoint Slides And Ppt Diagram Templates
Transportation_Red_Beetle_Car_PowerPoint_Slides_And_PPT_Diagram_Templates- Get the value of a lifetime with our Transportation Red Beetle Car PowerPoint Slides And Ppt Diagram Templates. Dont waste time struggling with PowerPoint. Let us do it for you.
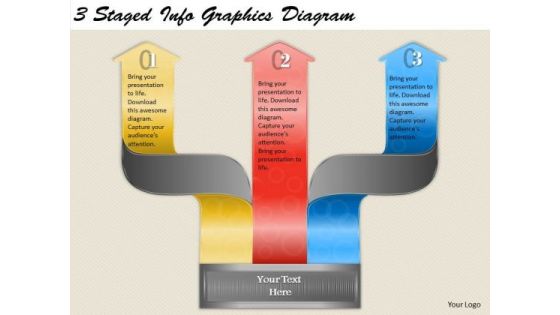
Timeline Ppt Template 3 Staged Info Graphics Diagram
Get The Domestics Right With Our Timeline Ppt Template 3 Staged Info Graphics Diagram Powerpoint Templates. Create The Base For Thoughts To Grow. Do Away With Dogmatic Approaches. Establish The Value Of Reason With Our Arrows Powerpoint Templates.
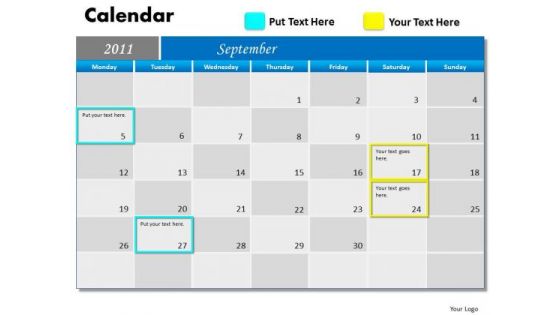
Strategy Diagram Blue Calendar 2011 Mba Models And Frameworks
Get The Domestics Right With Our Strategy_Diagram_Blue_Calendar_2011_MBA_Models_And_Frameworks Powerpoint Templates. Create The Base For Thoughts To Grow. Do Away With Dogmatic Approaches. Establish The Value Of Reason With Our Strategy_Diagram_Blue_Calendar_2011_MBA_Models_And_Frameworks Powerpoint Templates.
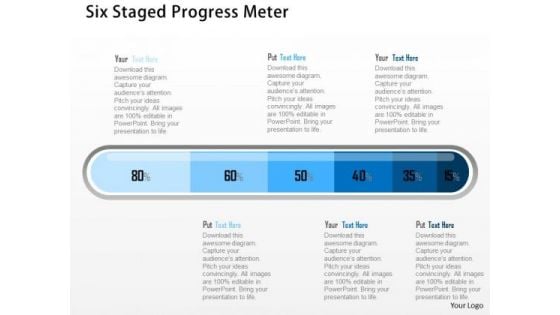
Business Diagram Six Staged Progress Meter Presentation Template
Our above business slide displays graphics of progress meter. This slide can be used as value chain example. This diagram provides an effective way of displaying information you can edit text, color, shade and style as per you need.
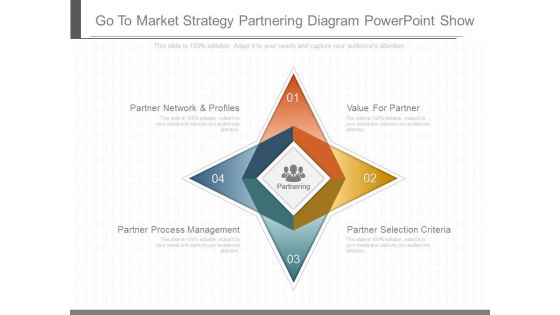
Go To Market Strategy Partnering Diagram Powerpoint Show
This is a go to market strategy partnering diagram powerpoint show. This is a four stage process. The stages in this process are partner network and profiles, partner process management, value for partner, partner selection criteria.
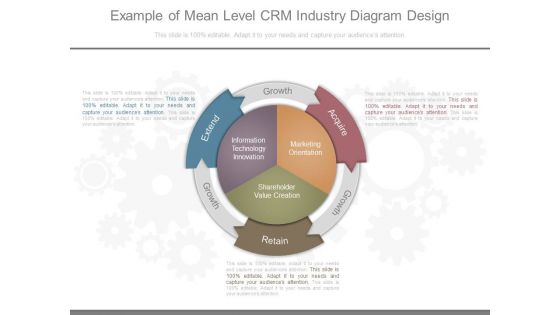
Example Of Mean Level Crm Industry Diagram Design
This is a example of mean level crm industry diagram design. This is a three stage process. The stages in this process are information technology innovation, marketing orientation, shareholder value creation, extend, growth, acquire, growth, retain.
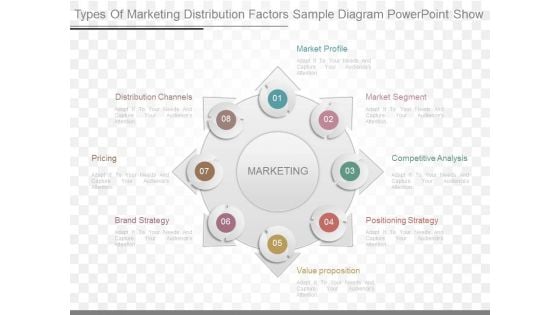
Types Of Marketing Distribution Factors Sample Diagram Powerpoint Show
This is a types of marketing distribution factors sample diagram powerpoint show. This is a eight stage process. The stages in this process are market profile, market segment, competitive analysis, positioning strategy, value proposition, brand strategy, pricing, distribution channels.
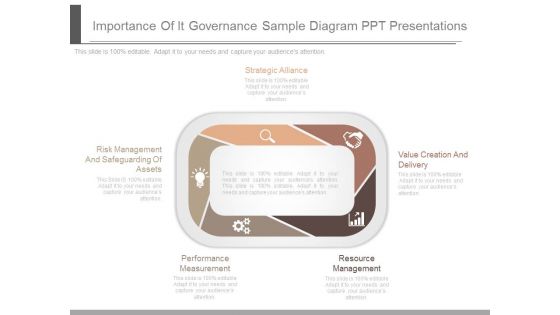
Importance Of It Governance Sample Diagram Ppt Presentations
This is a importance of it governance sample diagram ppt presentations. This is a five stage process. The stages in this process are strategic alliance, value creation and delivery, resource management, performance measurement, risk management and safeguarding of assets.
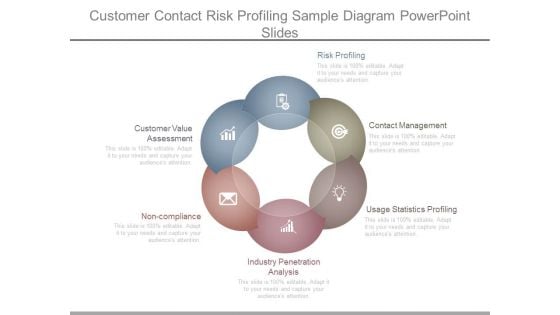
Customer Contact Risk Profiling Sample Diagram Powerpoint Slides
This is a customer contact risk profiling sample diagram powerpoint slides. This is a six stage process. The stages in this process are risk profiling, contact management, usage statistics profiling, industry penetration analysis, non compliance, customer value assessment.

Client Retention Enterprise Strategy Diagram Powerpoint Slide Presentation Examples
This is a client retention enterprise strategy diagram powerpoint slide presentation examples. This is a four stage process. The stages in this process are customer service standards, customer satisfaction, value for money, repeat purchase.
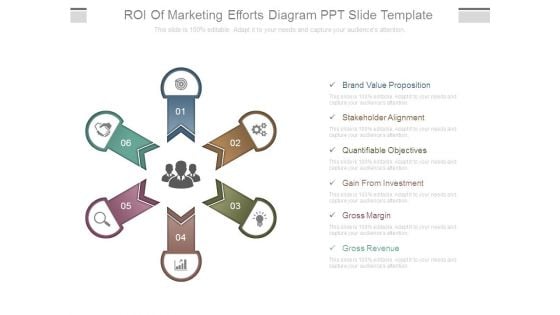
Roi Of Marketing Efforts Diagram Ppt Slide Template
This is a roi of marketing efforts diagram ppt slide template. This is a six stage process. The stages in this process are brand value proposition, stakeholder alignment, quantifiable objectives, gain from investment, gross margin, gross revenue.
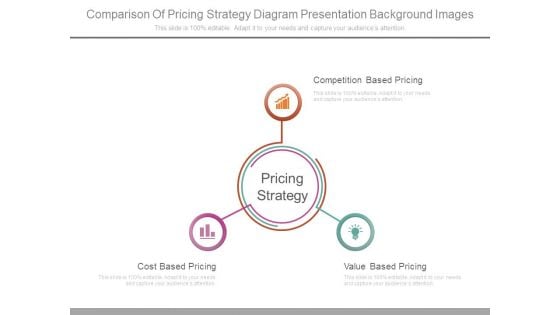
Comparison Of Pricing Strategy Diagram Presentation Background Images
This is a comparison of pricing strategy diagram presentation background images. This is a three stage process. The stages in this process are competition based pricing, cost based pricing, value based pricing.

Many Colorful Books In A Row Education PowerPoint Themes And PowerPoint Slides 0611
Microsoft Powerpoint Theme and Slide with colorful books in a row creating a border frame Our Many Colorful Books In A Row Education PowerPoint Themes And PowerPoint Slides 0611 are a business development asset. They advertise the value you deliver.
Problem And Solution Signs Metaphor PowerPoint Themes And PowerPoint Slides 0811
Microsoft PowerPoint Theme and Slide with two way metal blue signpost with problem and solution Our Problem And Solution Signs Metaphor PowerPoint Themes And PowerPoint Slides 0811 will be your best buy. The value of your thoughts will definitely appreciate.
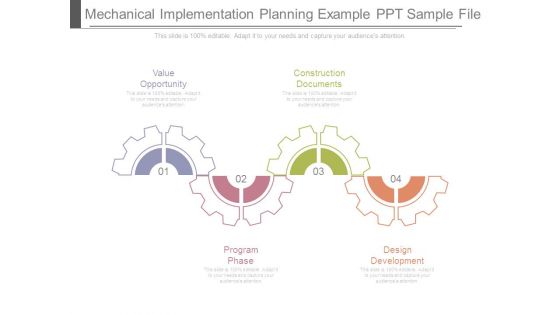
Mechanical Implementation Planning Example Ppt Sample File
This is a mechanical implementation planning example ppt sample file. This is a four stage process. The stages in this process are value opportunity, construction documents, program phase, design development.
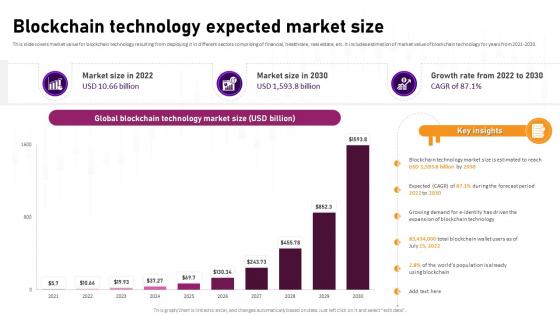
Blockchain Technology Expected Market Size Complete Roadmap To Blockchain BCT SS V
This slide covers market value for blockchain technology resulting from deploying it in different sectors comprising of financial, healthcare, real estate, etc. It includes estimation of market value of blockchain technology for years from 2021-2030. Slidegeeks is one of the best resources for PowerPoint templates. You can download easily and regulate Blockchain Technology Expected Market Size Complete Roadmap To Blockchain BCT SS V for your personal presentations from our wonderful collection. A few clicks is all it takes to discover and get the most relevant and appropriate templates. Use our Templates to add a unique zing and appeal to your presentation and meetings. All the slides are easy to edit and you can use them even for advertisement purposes. This slide covers market value for blockchain technology resulting from deploying it in different sectors comprising of financial, healthcare, real estate, etc. It includes estimation of market value of blockchain technology for years from 2021-2030.

Digital Approach To Client Digital Banking Dashboard Showcasing Transaction
This slide showcases dashboard which illustrates performance of digital wallet and payment cards used for online banking. It provides information regarding network volume, debit and credit card performance, cards weekly transaction volume, value and network value. This modern and well-arranged Digital Approach To Client Digital Banking Dashboard Showcasing Transaction provides lots of creative possibilities. It is very simple to customize and edit with the Powerpoint Software. Just drag and drop your pictures into the shapes. All facets of this template can be edited with Powerpoint, no extra software is necessary. Add your own material, put your images in the places assigned for them, adjust the colors, and then you can show your slides to the world, with an animated slide included. This slide showcases dashboard which illustrates performance of digital wallet and payment cards used for online banking. It provides information regarding network volume, debit and credit card performance, cards weekly transaction volume, value and network value.
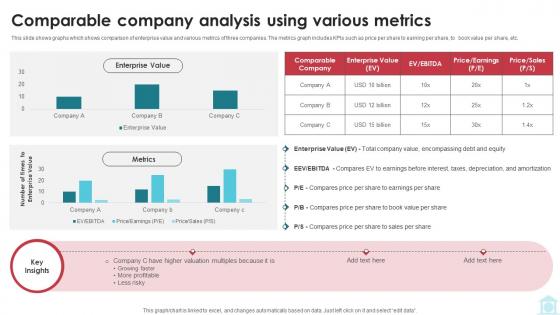
Comparable Company Analysis Using Various Metrics Mastering Investment Banking Fin SS V
This slide shows graphs which shows comparison of enterprise value and various metrics of three companies. The metrics graph includes KPIs such as price per share to earning per share, to book value per share, etc. Get a simple yet stunning designed Comparable Company Analysis Using Various Metrics Mastering Investment Banking Fin SS V It is the best one to establish the tone in your meetings. It is an excellent way to make your presentations highly effective. So, download this PPT today from Slidegeeks and see the positive impacts. Our easy-to-edit Comparable Company Analysis Using Various Metrics Mastering Investment Banking Fin SS V can be your go-to option for all upcoming conferences and meetings. So, what are you waiting for Grab this template today. This slide shows graphs which shows comparison of enterprise value and various metrics of three companies. The metrics graph includes KPIs such as price per share to earning per share, to book value per share, etc.
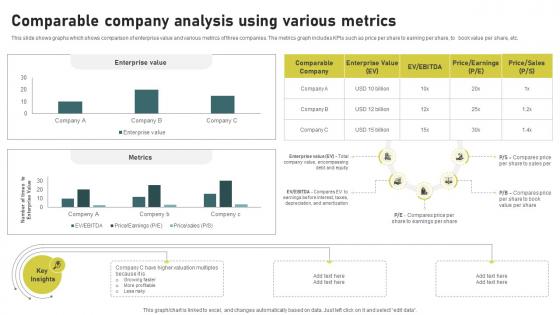
Comparable Company Analysis Using Investment Banking Simplified Functions Fin SS V
This slide shows graphs which shows comparison of enterprise value and various metrics of three companies. The metrics graph includes KPIs such as price per share to earning per share, to book value per share, etc. Get a simple yet stunning designed Comparable Company Analysis Using Investment Banking Simplified Functions Fin SS V. It is the best one to establish the tone in your meetings. It is an excellent way to make your presentations highly effective. So, download this PPT today from Slidegeeks and see the positive impacts. Our easy-to-edit Comparable Company Analysis Using Investment Banking Simplified Functions Fin SS V can be your go-to option for all upcoming conferences and meetings. So, what are you waiting for Grab this template today. This slide shows graphs which shows comparison of enterprise value and various metrics of three companies. The metrics graph includes KPIs such as price per share to earning per share, to book value per share, etc.
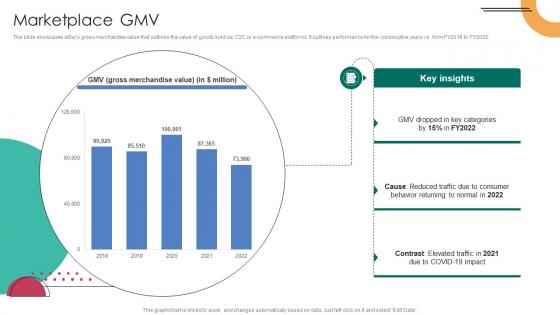
Marketplace GMV C2C Ecommerce Platform Company Profile CP SS V
The slide showcases eBays gross merchandise value that outlines the value of goods sold via. C2C or e-commerce platforms. It outlines performance for five consecutive years i.e. from FY2018 to FY2022.This modern and well-arranged Marketplace GMV C2C Ecommerce Platform Company Profile CP SS V provides lots of creative possibilities. It is very simple to customize and edit with the Powerpoint Software. Just drag and drop your pictures into the shapes. All facets of this template can be edited with Powerpoint, no extra software is necessary. Add your own material, put your images in the places assigned for them, adjust the colors, and then you can show your slides to the world, with an animated slide included. The slide showcases eBays gross merchandise value that outlines the value of goods sold via. C2C or e-commerce platforms. It outlines performance for five consecutive years i.e. from FY2018 to FY2022.
Comparable Company Analysis Using Various Understanding Investment Banking Framework Fin SS V
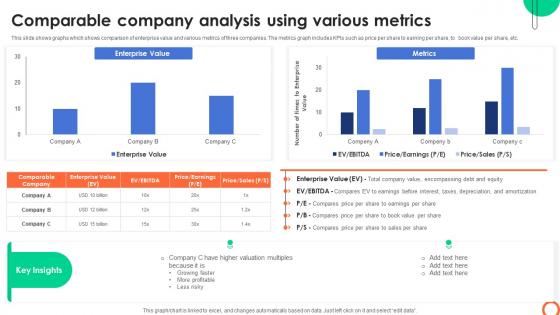
This slide shows graphs which shows comparison of enterprise value and various metrics of three companies. The metrics graph includes KPIs such as price per share to earning per share, to book value per share, etc. Get a simple yet stunning designed Comparable Company Analysis Using Various Understanding Investment Banking Framework Fin SS V. It is the best one to establish the tone in your meetings. It is an excellent way to make your presentations highly effective. So, download this PPT today from Slidegeeks and see the positive impacts. Our easy-to-edit Comparable Company Analysis Using Various Understanding Investment Banking Framework Fin SS V can be your go-to option for all upcoming conferences and meetings. So, what are you waiting for Grab this template today. This slide shows graphs which shows comparison of enterprise value and various metrics of three companies. The metrics graph includes KPIs such as price per share to earning per share, to book value per share, etc.

Step 7 Monitor Analytics Implementation For Inventory Using Dashboard Data Analytics SS V
This slide provides a dashboard highlighting inventory performance aimed at helping businesses streamline operations. It covers details on sales orders, invoices, order value, invoice amount, YTD invoice value and sales growth. Welcome to our selection of the Step 7 Monitor Analytics Implementation For Inventory Using Dashboard Data Analytics SS V. These are designed to help you showcase your creativity and bring your sphere to life. Planning and Innovation are essential for any business that is just starting out. This collection contains the designs that you need for your everyday presentations. All of our PowerPoints are 100 percent editable, so you can customize them to suit your needs. This multi-purpose template can be used in various situations. Grab these presentation templates today. This slide provides a dashboard highlighting inventory performance aimed at helping businesses streamline operations. It covers details on sales orders, invoices, order value, invoice amount, YTD invoice value and sales growth.
Business Diagram 3d Graph Of Crossing Chasm And Data Presentation Template
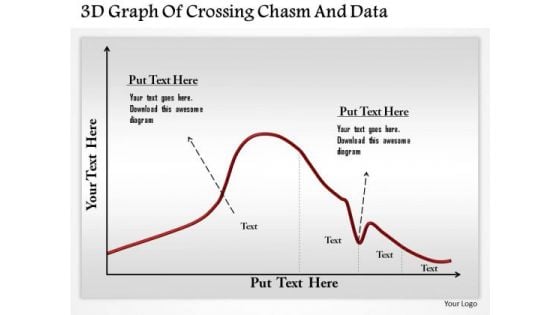
This business diagram has been designed with graphic of 3d graph. This slide contains the concept of chasm and data calculation. Use this slide to display chasm crossing condition. This business diagram adds value to your ideas.
Business Team Standing In Rings PowerPoint Templates
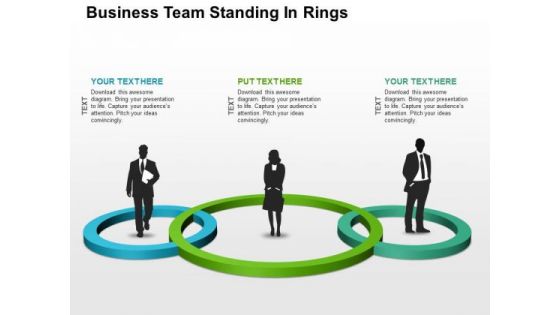
This slide contains graphics of business team standing in rings. This slide helps to portray concepts like team planning and business strategies. This PowerPoint template adds value to your presentation

 Home
Home