Volume
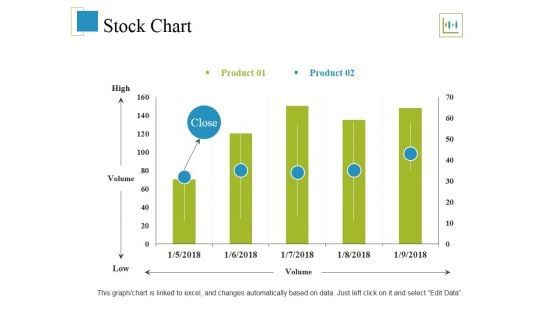
Stock Chart Ppt PowerPoint Presentation Show Design Inspiration
This is a stock chart ppt powerpoint presentation show design inspiration. This is a two stage process. The stages in this process are high, volume, low, stock chart.
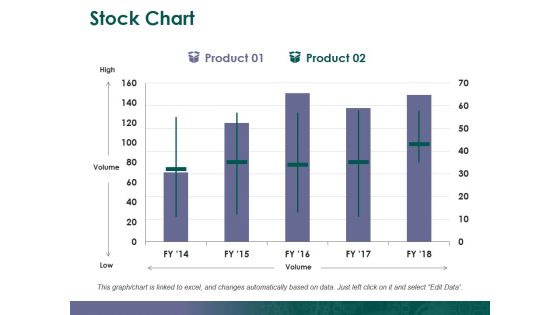
Stock Chart Ppt PowerPoint Presentation Outline Introduction
This is a stock chart ppt powerpoint presentation outline introduction. This is a two stage process. The stages in this process are stock chart, high, volume, low.
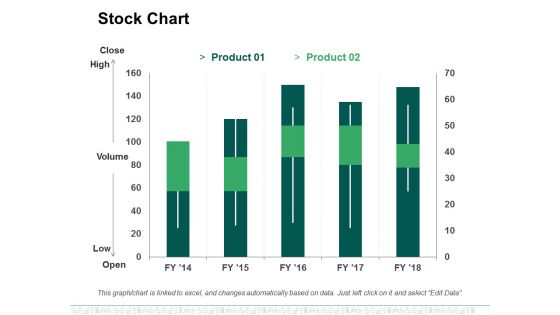
Stock Chart Ppt PowerPoint Presentation Show
This is a stock chart ppt powerpoint presentation show. This is a two stage process. The stages in this process are high, volume, low, business, marketing.
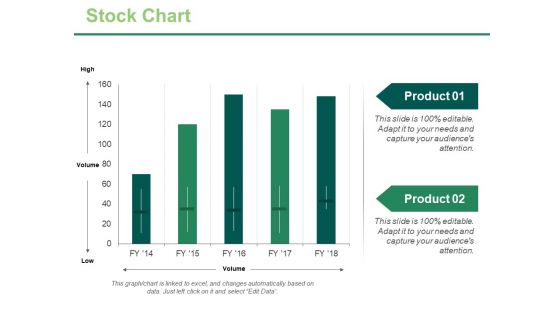
Stock Chart Ppt PowerPoint Presentation Ideas Infographics
This is a stock chart ppt powerpoint presentation ideas infographics. This is a two stage process. The stages in this process are high, volume, low, product, stock chart.
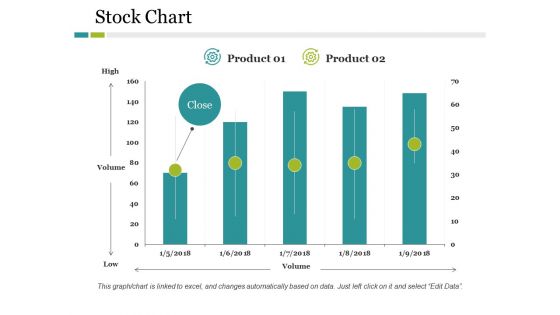
Stock Chart Ppt PowerPoint Presentation Layouts Portfolio
This is a stock chart ppt powerpoint presentation layouts portfolio. This is a two stage process. The stages in this process are business, marketing, high, volume, low, finance.
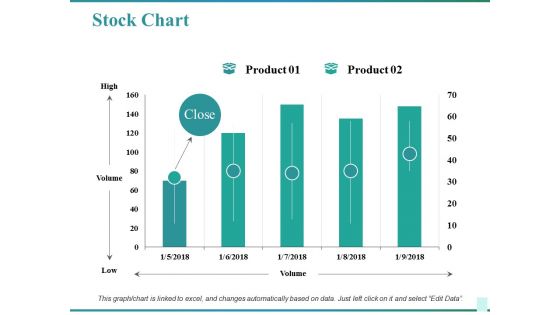
Stock Chart Ppt PowerPoint Presentation Pictures Microsoft
This is a stock chart ppt powerpoint presentation pictures microsoft. This is a two stage process. The stages in this process are business, high, volume, low, chart.

Stock Chart Ppt PowerPoint Presentation Layouts Outfit
This is a stock chart ppt powerpoint presentation layouts outfit. This is a two stage process. The stages in this process are close, high, volume, low, open.
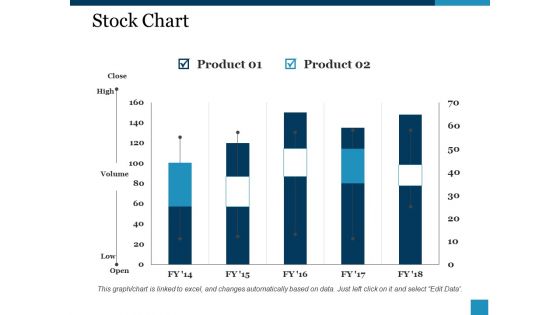
Stock Chart Ppt PowerPoint Presentation Guide
This is a stock chart ppt powerpoint presentation guide. This is a two stage process. The stages in this process are product, close, high, volume, low.
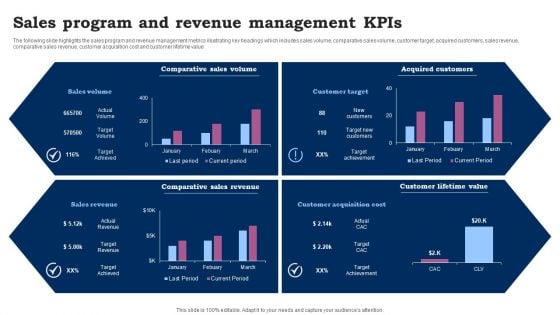
Sales Program And Revenue Management Kpis Ppt Outline Slide Download PDF
The following slide highlights the sales program and revenue management metrics illustrating key headings which includes sales volume, comparative sales volume, customer target, acquired customers, sales revenue, comparative sales revenue, customer acquisition cost and customer lifetime value. Showcasing this set of slides titled Sales Program And Revenue Management Kpis Ppt Outline Slide Download PDF. The topics addressed in these templates are Comparative Sales Volume, Acquired Customers, Comparative Sales Revenue. All the content presented in this PPT design is completely editable. Download it and make adjustments in color, background, font etc. as per your unique business setting.
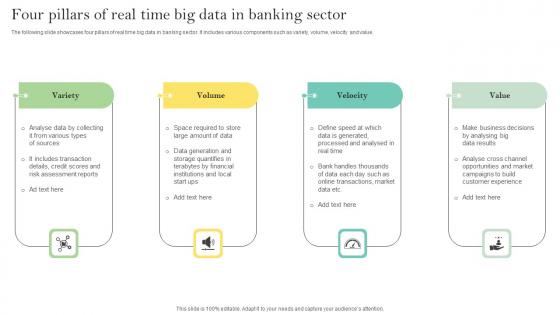
Four Pillars Of Real Time Big Data In Banking Sector Ppt Show Pdf
The following slide showcases four pillars of real time big data in banking sector. It includes various components such as variety, volume, velocity and value. Showcasing this set of slides titled Four Pillars Of Real Time Big Data In Banking Sector Ppt Show Pdf. The topics addressed in these templates are Variety, Volume, Velocity, Value. All the content presented in this PPT design is completely editable. Download it and make adjustments in color, background, font etc. as per your unique business setting. The following slide showcases four pillars of real time big data in banking sector. It includes various components such as variety, volume, velocity and value.
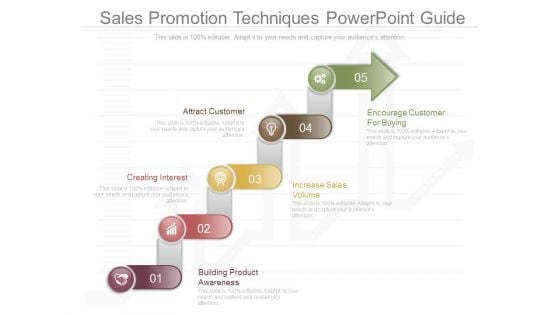
Sales Promotion Techniques Powerpoint Guide
This is a sales promotion techniques powerpoint guide. This is a five stage process. The stages in this process are attract customer, creating interest, encourage customer for buying, increase sales volume, building product awareness.
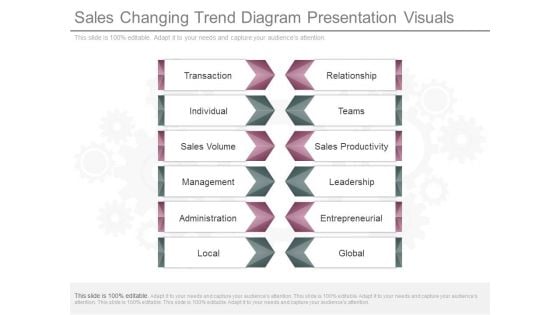
Sales Changing Trend Diagram Presentation Visuals
This is a sales changing trend diagram presentation visuals. This is a twelve stage process. The stages in this process are transaction, individual, sales volume, management, administration, local, relationship, teams, sales productivity, leadership, entrepreneurial, global.
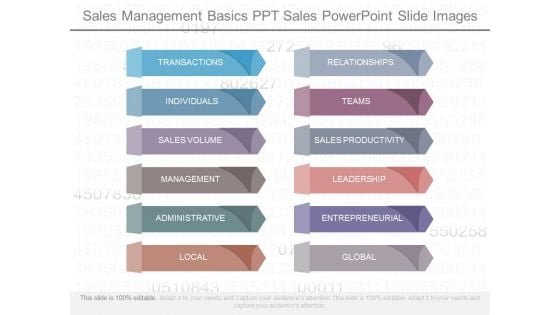
Sales Management Basics Ppt Sales Powerpoint Slide Images
This is a sales management basics ppt sales powerpoint slide images. This is a twelve stage process. The stages in this process are transactions, individuals, sales volume, management, administrative, local, relationships, teams, sales productivity, leadership, entrepreneurial, global.
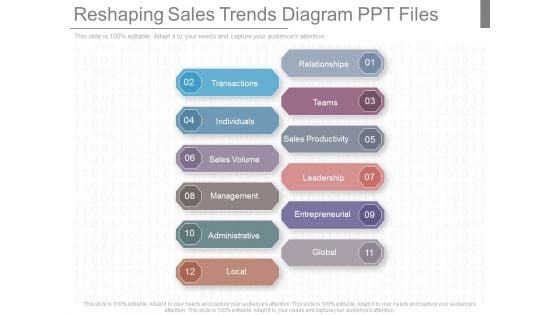
Reshaping Sales Trends Diagram Ppt Files
This is a reshaping sales trends diagram ppt files. This is a twelve stage process. The stages in this process are relationships, transactions, teams, individuals, sales productivity, sales volume, leadership, management, entrepreneurial, administrative, global, local.
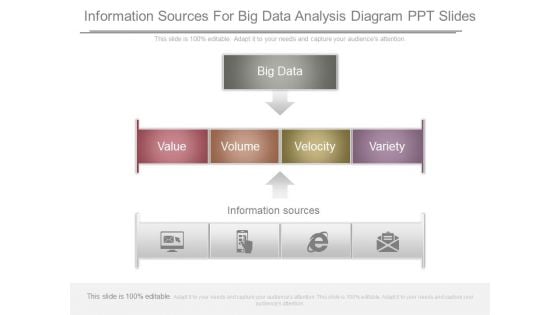
Information Sources For Big Data Analysis Diagram Ppt Slides
This is a information sources for big data analysis diagram ppt slides. This is a three stage process. The stages in this process are big data, value, volume, velocity, variety, information sources.
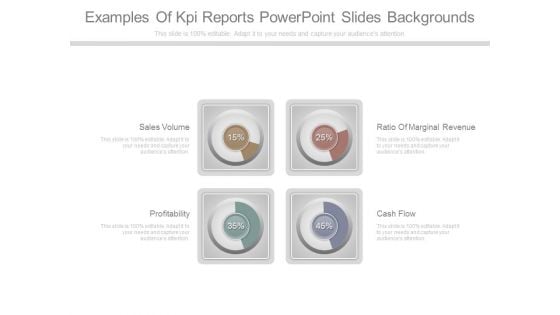
Examples Of Kpi Reports Powerpoint Slides Backgrounds
This is a examples of kpi reports powerpoint slides backgrounds. This is a four stage process. The stages in this process are sales volume, profitability, ratio of marginal revenue, cash flow.
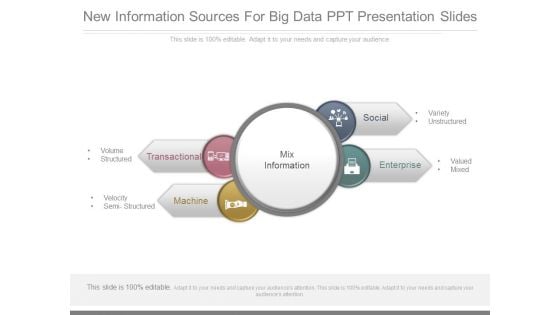
New Information Sources For Big Data Ppt Presentation Slides
This is a new information sources for big data ppt presentation slides. This is a four stage process. The stages in this process are mix information, transactional, machine, social, enterprise, volume, structured, velocity, semi structured, variety, unstructured, valued, mixed.
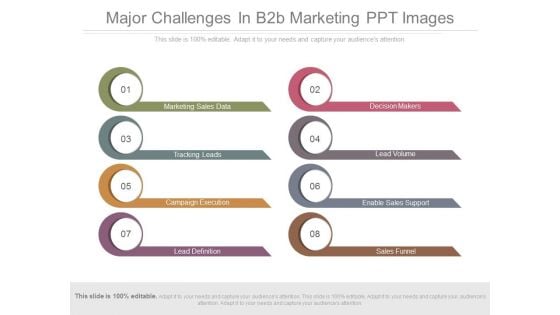
Major Challenges In B2b Marketing Ppt Images
This is a major challenges in b2b marketing ppt images. This is a eight stage process. The stages in this process are marketing sales data, decision makers, tracking leads, lead volume, campaign execution, enable sales support, lead definition, sales funnel.
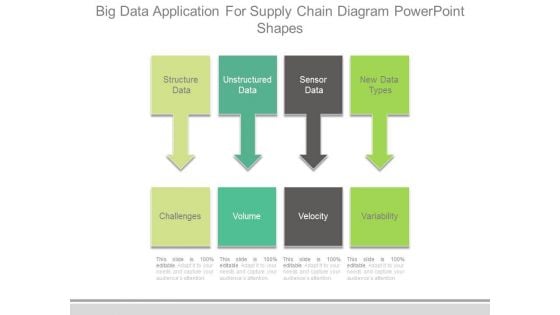
Big Data Application For Supply Chain Diagram Powerpoint Shapes
This is a big data application for supply chain diagram powerpoint shapes. This is a eight stage process. The stages in this process are structure data, unstructured data, sensor data, new data types, challenges, volume, velocity, variability.
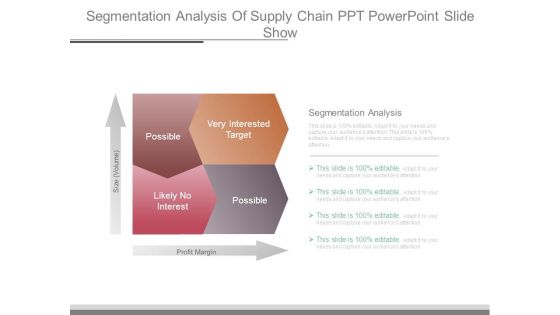
Segmentation Analysis Of Supply Chain Ppt Powerpoint Slide Show
This is a segmentation analysis of supply chain ppt powerpoint slide show. This is a four stage process. The stages in this process are very interested target, possible, likely no interest, possible, profit margin, size volume.
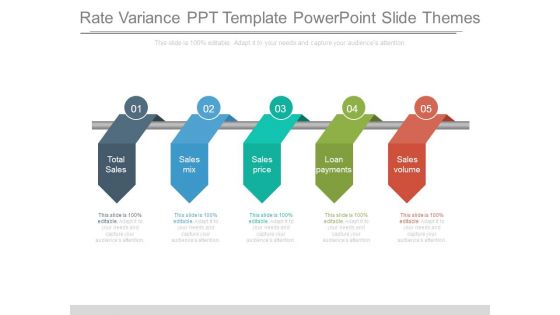
Rate Variance Ppt Template Powerpoint Slide Themes
This is a rate variance ppt template powerpoint slide themes. This is a five stage process. The stages in this process are total sales, sales mix, sales price, loan payments, sales volume.
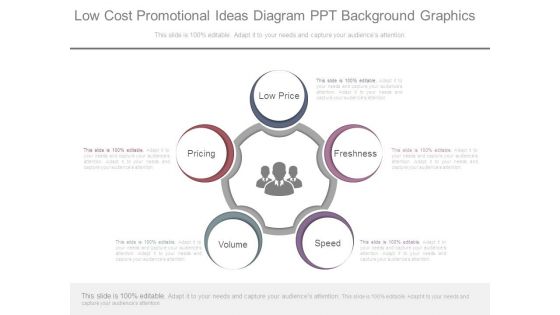
Low Cost Promotional Ideas Diagram Ppt Background Graphics
This is a low cost promotional ideas diagram ppt background graphics. This is a five stage process. The stages in this process are low price, freshness, speed, volume, pricing.
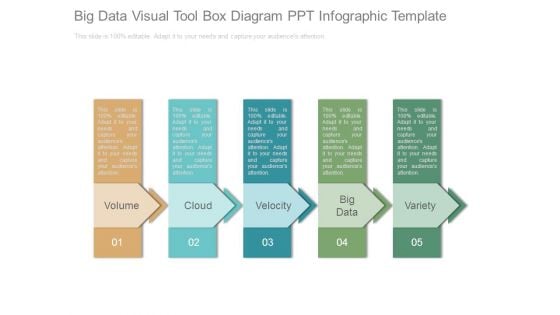
Big Data Visual Tool Box Diagram Ppt Infographic Template
This is a big data visual tool box diagram ppt infographic template. This is a five stage process. The stages in this process are volume, cloud, velocity, big data, variety.
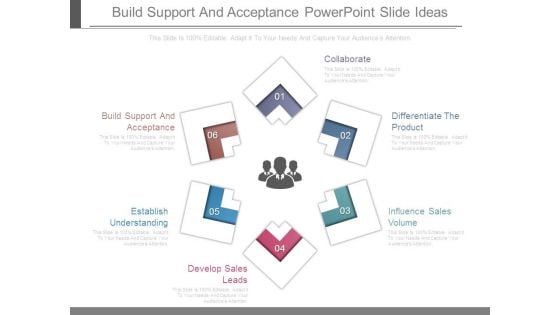
Build Support And Acceptance Powerpoint Slide Ideas
This is a build support and acceptance powerpoint slide ideas. This is a six stage process. The stages in this process are collaborate, differentiate the product, influence sales volume, develop sales leads, establish understanding, build support and acceptance.
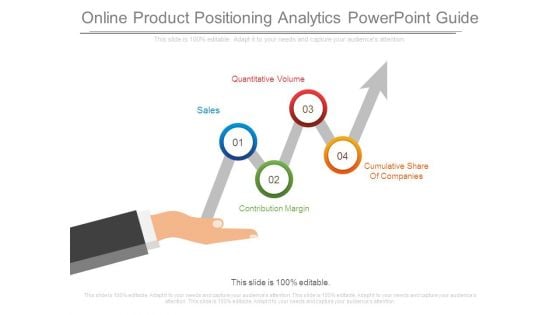
Online Product Positioning Analytics Powerpoint Guide
This is a online product positioning analytics powerpoint guide. This is a four stage process. The stages in this process are sales, quantitative volume, contribution margin, cumulative share of companies.
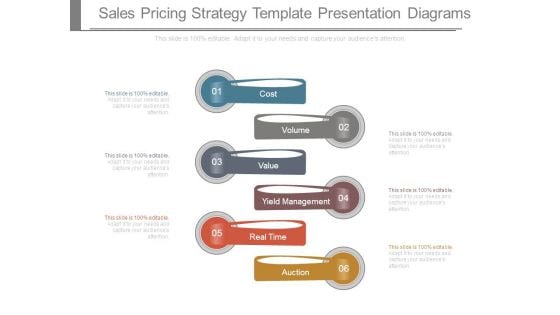
Sales Pricing Strategy Template Presentation Diagrams
This is a sales pricing strategy template presentation diagrams. This is a six stage process. The stages in this process are cost, volume, value, yield management, real time, auction.
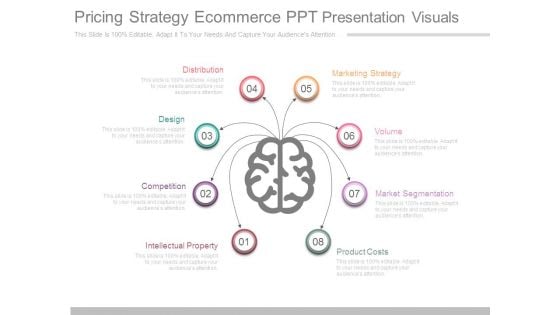
Pricing Strategy Ecommerce Ppt Presentation Visuals
This is a pricing strategy ecommerce ppt presentation visuals. This is a eight stage process. The stages in this process are intellectual property, competition, design, distribution, marketing strategy, volume, market segmentation, product costs.
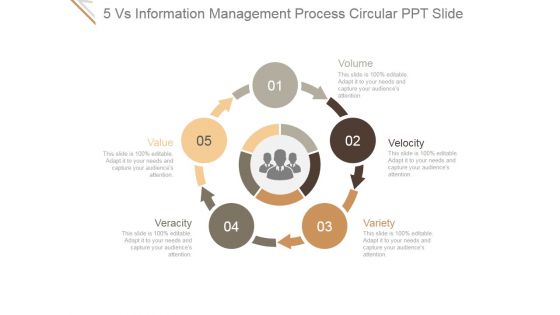
5 Vs Information Management Process Circular Ppt PowerPoint Presentation Slides
This is a 5 vs information management process circular ppt powerpoint presentation slides. This is a five stage process. The stages in this process are volume, velocity, variety, veracity, value.
5 Vs Large Data Sets Applications Circular Icons Ppt PowerPoint Presentation Picture
This is a 5 vs large data sets applications circular icons ppt powerpoint presentation picture. This is a five stage process. The stages in this process are big data, volume, velocity, variety, veracity, value.
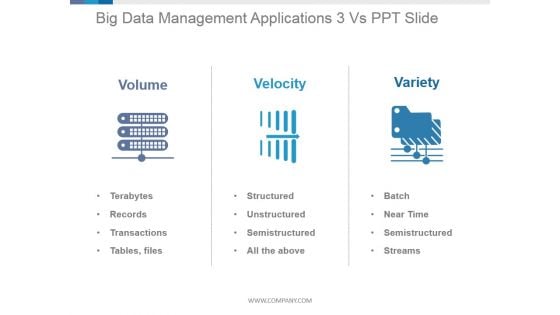
Big Data Management Applications 3 Vs Ppt PowerPoint Presentation Deck
This is a big data management applications 3 vs ppt powerpoint presentation deck. This is a three stage process. The stages in this process are volume, velocity, variety, terabytes, structured, batch.
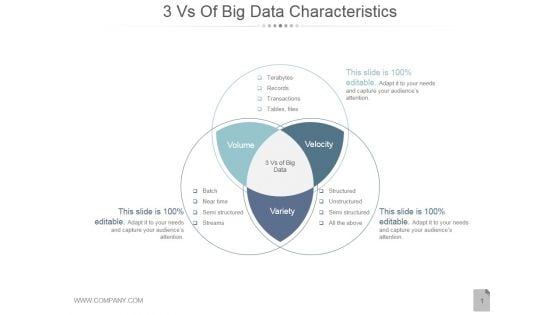
3 Vs Of Big Data Characteristics Ppt PowerPoint Presentation Example File
This is a 3 vs of big data characteristics ppt powerpoint presentation example file. This is a three stage process. The stages in this process are volume, velocity, variety.
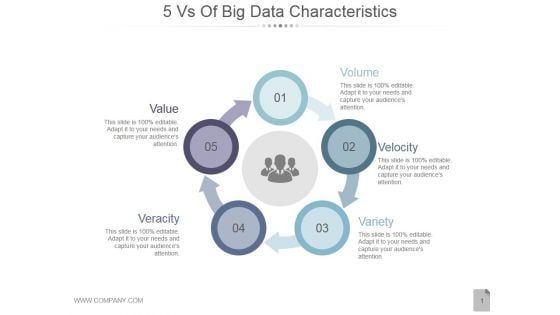
5 Vs Of Big Data Characteristics Ppt PowerPoint Presentation Model
This is a 5 vs of big data characteristics ppt powerpoint presentation model. This is a five stage process. The stages in this process are volume, velocity, variety, veracity, value.
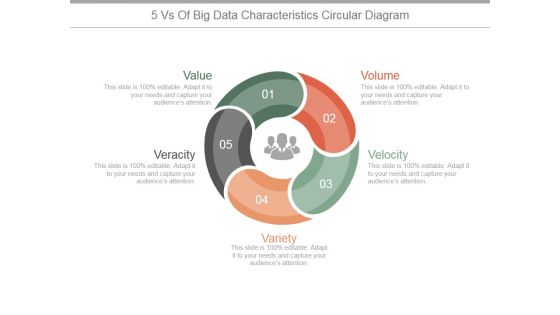
5 Vs Of Big Data Characteristics Circular Ppt PowerPoint Presentation Outline
This is a 5 vs of big data characteristics circular ppt powerpoint presentation outline. This is a five stage process. The stages in this process are value, volume, velocity, variety, veracity.
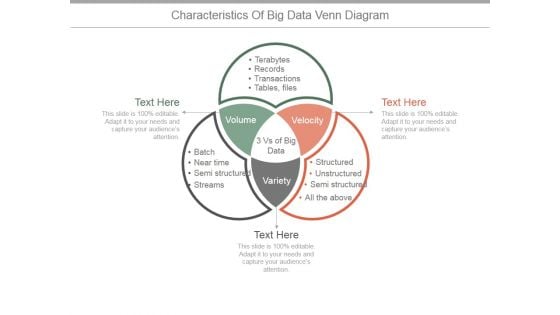
Characteristics Of Big Data Venn Diagram Ppt PowerPoint Presentation Example 2015
This is a characteristics of big data venn diagram ppt powerpoint presentation example 2015. This is a three stage process. The stages in this process are volume, velocity, variety, tables, files, transactions, records, terabytes.
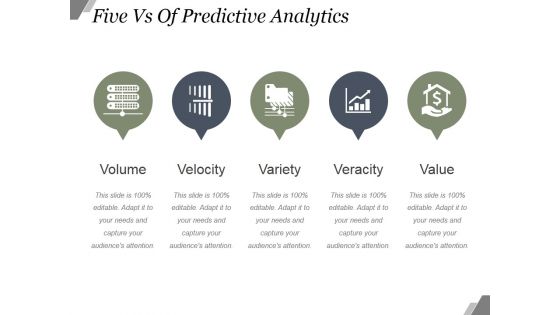
Five Vs Of Predictive Analytics Ppt PowerPoint Presentation Images
This is a five vs of predictive analytics ppt powerpoint presentation images. This is a five stage process. The stages in this process are volume, velocity, variety, veracity, value.
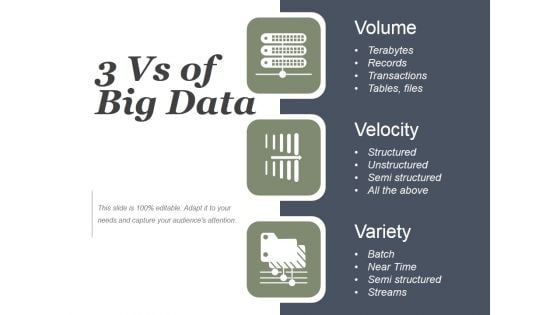
Quantity Nature Speed Of Big Data Ppt PowerPoint Presentation Model
This is a quantity nature speed of big data ppt powerpoint presentation model. This is a three stage process. The stages in this process are volume, velocity, variety, terabytes, structured, batch.
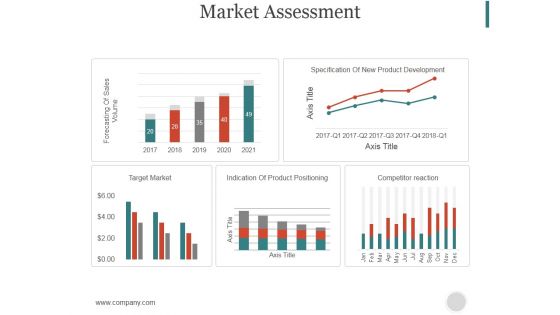
Market Assessment Ppt PowerPoint Presentation Model
This is a market assessment ppt powerpoint presentation model. This is a five stage process. The stages in this process are forecasting of sales volume, specification of new product development, target market, indication of product positioning.
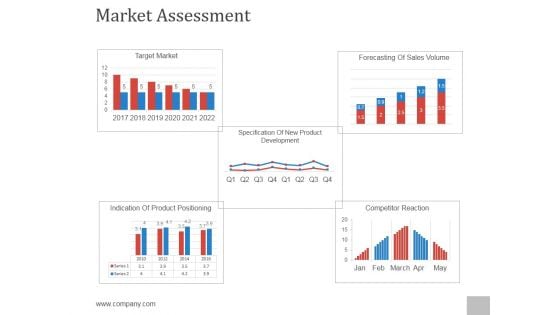
Market Assessment Ppt PowerPoint Presentation Files
This is a market assessment ppt powerpoint presentation files. This is a five stage process. The stages in this process are target market, forecasting of sales volume, indication of product positioning, competitor reaction, specification of new product development.
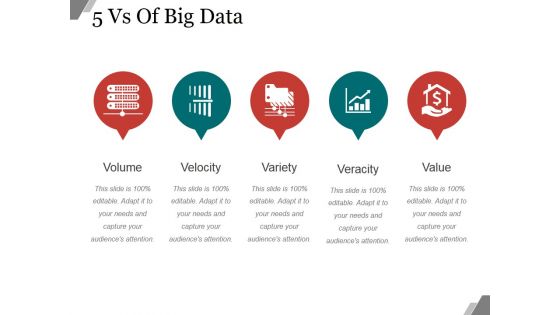
5 Vs Of Big Data Ppt PowerPoint Presentation Microsoft
This is a 5 vs of big data ppt powerpoint presentation microsoft. This is a five stage process. The stages in this process are volume, velocity, variety, veracity, value.
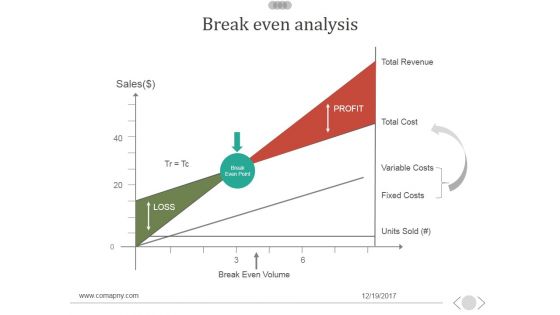
Break Even Analysis Ppt PowerPoint Presentation Design Templates
This is a break even analysis ppt powerpoint presentation design templates. This is a two stage process. The stages in this process are sales, break even volume, total revenue, loss, profit.
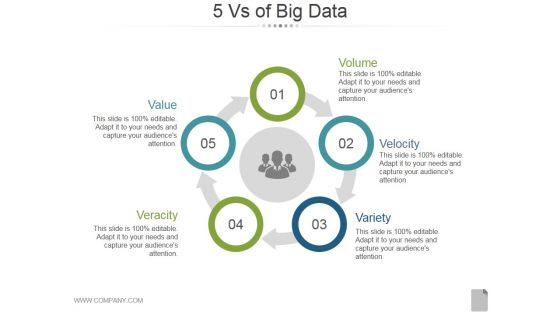
5 Vs Of Big Data Ppt PowerPoint Presentation Professional
This is a 5 vs of big data ppt powerpoint presentation professional. This is a five stage process. The stages in this process are volume, velocity, variety, veracity, value.
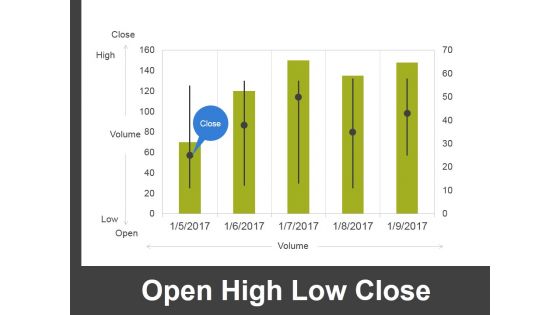
Open High Low Close Ppt PowerPoint Presentation Professional Shapes
This is a open high low close ppt powerpoint presentation professional shapes. This is a five stage process. The stages in this process are close, high, volume, low, open.

Email Marketing Metrics Ppt Powerpoint Presentation Outline Sample
This is a email marketing metrics ppt powerpoint presentation outline sample. This is a four stage process. The stages in this process are receive, aware, interest, trial, email marketing activities, metrics, volume, efficiency, speed, cost.
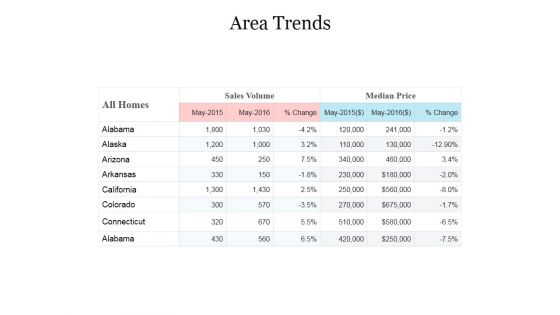
Area Trends Ppt PowerPoint Presentation Infographics Background Image
This is a area trends ppt powerpoint presentation infographics background image. This is a two stage process. The stages in this process are sales volume, median price, alabama, alaska, arizona, arkansas, california.
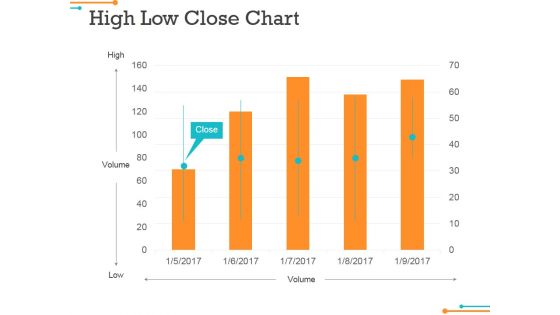
High Low Close Chart Ppt Powerpoint Presentation Gallery Slides
This is a high low close chart ppt powerpoint presentation gallery slides. This is a five stage process. The stages in this process are close, volume, high, low, graph.
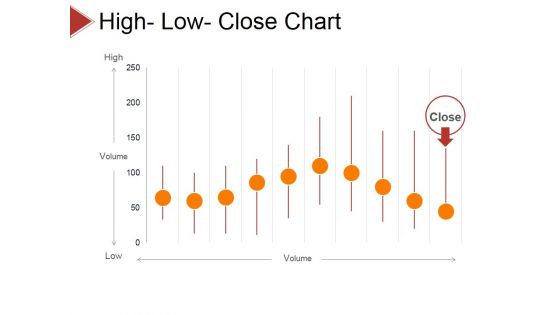
High Low Close Chart Ppt PowerPoint Presentation Layouts Visual Aids
This is a high low close chart ppt powerpoint presentation layouts visual aids. This is a ten stage process. The stages in this process are volume, high, low, close.
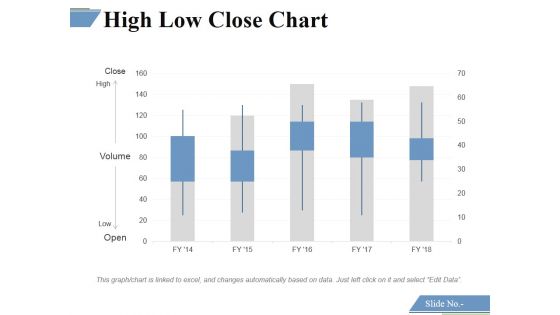
High Low Close Chart Ppt PowerPoint Presentation Professional Background Images
This is a high low close chart ppt powerpoint presentation professional background images. This is a five stage process. The stages in this process are close, high, volume, low, open.

High Low Close Chart Ppt PowerPoint Presentation Inspiration Professional
This is a high low close chart ppt powerpoint presentation inspiration professional. This is a ten stage process. The stages in this process are business, strategy, analysis, planning, high, volume, low.
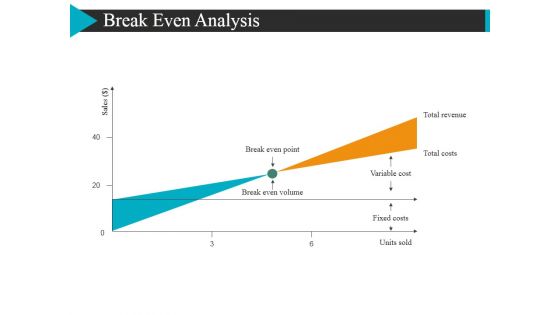
Break Even Analysis Ppt Powerpoint Presentation Show Maker
This is a break even analysis ppt powerpoint presentation show maker. This is a two stage process. The stages in this process are total revenue, total costs, break even volume.
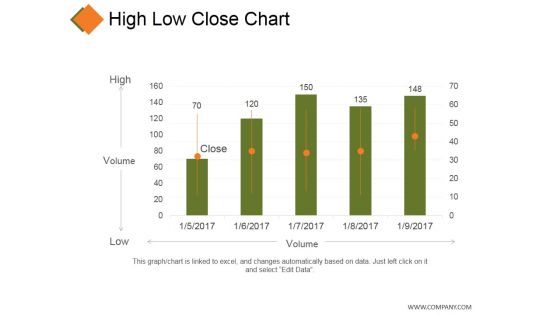
High Low Close Chart Ppt PowerPoint Presentation Model Grid
This is a high low close chart ppt powerpoint presentation model grid. This is a five stage process. The stages in this process are business, high, volume, low, marketing.
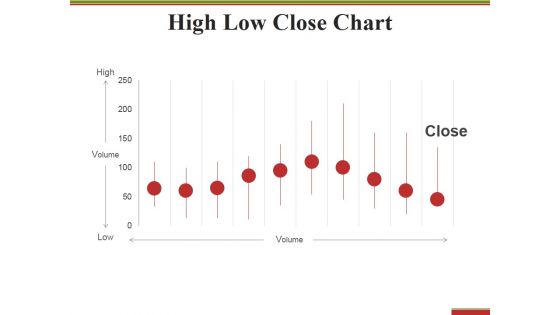
High Low Close Chart Ppt PowerPoint Presentation Styles Display
This is a high low close chart ppt powerpoint presentation styles display. This is a ten stage process. The stages in this process are high, volume, low, close, finance.
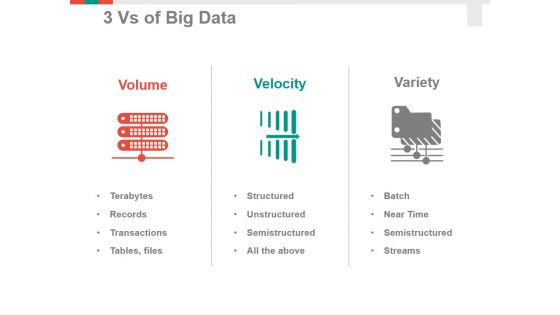
3 Vs Of Big Data Ppt PowerPoint Presentation Summary Example Introduction
This is a 3 vs of big data ppt powerpoint presentation summary example introduction. This is a three stage process. The stages in this process are volume, velocity, variety.
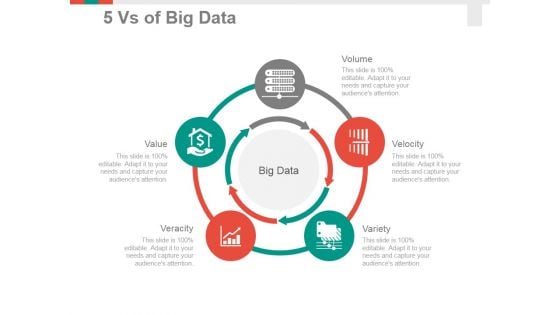
5 Vs Of Big Data Ppt PowerPoint Presentation Summary Visuals
This is a 5 vs of big data ppt powerpoint presentation summary visuals. This is a five stage process. The stages in this process are volume, velocity, variety, veracity, value.
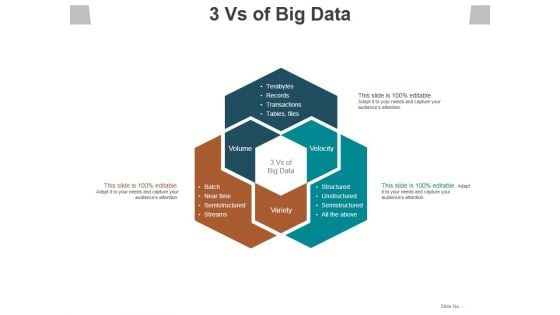
3 Vs Of Big Data Ppt PowerPoint Presentation Slides Samples
This is a 3 vs of big data ppt powerpoint presentation slides samples. This is a three stage process. The stages in this process are volume, variety, velocity, terabytes, transactions.

5 Vs Of Big Data Ppt PowerPoint Presentation Layouts Ideas
This is a 5 vs of big data ppt powerpoint presentation layouts ideas. This is a five stage process. The stages in this process are value, veracity, variety, velocity, volume.
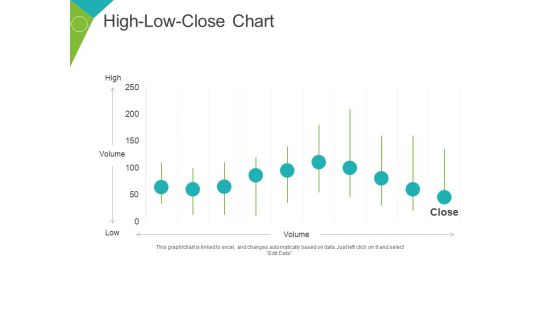
High Low Close Chart Ppt PowerPoint Presentation Layouts Guide
This is a high low close chart ppt powerpoint presentation layouts guide. This is a ten stage process. The stages in this process are high, volume, low, business, marketing, finance.
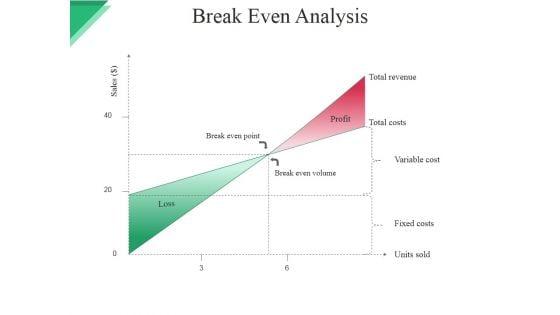
Break Even Analysis Ppt PowerPoint Presentation Styles Samples
This is a break even analysis ppt powerpoint presentation styles samples. This is a two stage process. The stages in this process are break even point, break even volume, profit, total revenue, total costs, variable cost.

Marketing Assessment Ppt PowerPoint Presentation Gallery Guidelines
This is a marketing assessment ppt powerpoint presentation gallery guidelines. This is a five stage process. The stages in this process are target market, forecasting of sales volume, indication of product positioning,, competitor reaction.
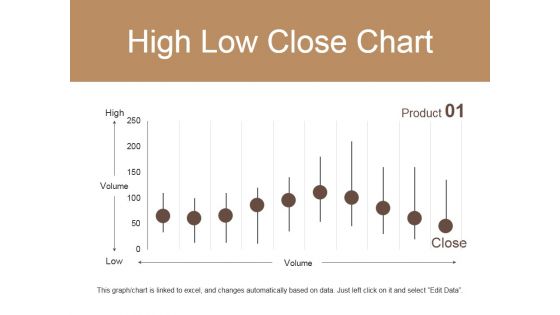
High Low Close Chart Ppt PowerPoint Presentation Infographic Template Vector
This is a high low close chart ppt powerpoint presentation infographic template vector. This is a ten stage process. The stages in this process are high, volume, low, product, close.
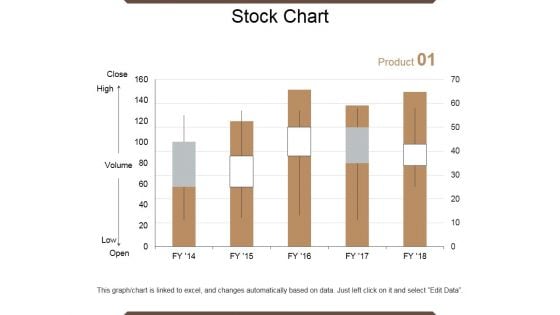
Stock Chart Ppt PowerPoint Presentation Outline Graphics Example
This is a stock chart ppt powerpoint presentation outline graphics example. This is a five stage process. The stages in this process are close, volume, low, high, open, product.


 Continue with Email

 Home
Home


